
Exhibit 99.1
CURATORS COFFEE
London, UK
Q1 2017 Shareholder Letter
SQUARE.COM/INVESTORS
Highlights
| • | | Our first-quarter results demonstrate our continued balance of investing for growth, with first-quarter GPV up 33% year over year, while also improving margins. |
| • | | We launched in the UK, our fourth international market, where small and medium businesses generated £1.8 trillion of revenue in 2016. |
| • | | Integration drives product adoption: Invoices grew significantly after we integrated it into the Square app. |
| • | | We continue to develop our industry-specific solutions with features that help sellers reach more customers and increase sales, like Caviar pickup for restaurants. |
First Quarter 2017 Key Results
| | | | |
| GROSS PAYMENT VOLUME (GPV) | | TOTAL NET REVENUE | | NET INCOME (LOSS) |
| | |
| | 
| | 
|
| | |
| GPV MIX BY SELLER SIZE | | ADJUSTED REVENUE | | ADJUSTED EBITDA |
| | |
| | 
| | 
|
A reconciliation of non-GAAP metrics used in this letter to their nearest GAAP equivalents is provided at the end of this letter.
Adjusted Revenue is defined as total net revenue less transaction-based revenue from Starbucks and transaction-based costs.
Adjusted EBITDA margin is calculated as Adjusted EBITDA divided by Adjusted Revenue.
2
| | |
| To Our Shareholders: | | MAY 3, 2017 |
Our first-quarter results demonstrate our continued ability to grow the business at scale while balancing investment and margin expansion. Improvements in net loss and Adjusted EBITDA reflect strong top-line growth, coupled with ongoing operating leverage and improvements in transaction loss rates. Similar to previous quarters, we saw strong momentum across our products, with revenue growth driven by both transaction-based and subscription and services-based monetization. We launched in the UK, our fourth international market, where small and medium businesses (SMBs) generated £1.8 trillion of revenue in 2016.1 Square is a great fit for the UK market, which has 5.5 million SMBs2 and a thriving entrepreneurial scene. The annual revenue of SMBs in 2016 was £1.8 trillion, which is 47% of all private sector UK revenue.1 In the UK, the average adult now carries less than £25 in cash and 70% of shoppers prefer to pay by card, yet industry research estimates that half of UK small businesses still do not take card payments.3 Our contactless and chip reader aims to meet the needs of the UK market, where there are more than 100 million contactless cards.4 For countries such as the UK and Australia, we also needed to enable acceptance of payments that use PINs to authenticate chip card transactions instead of signatures, which are used in the U.S. We built a new, secure way to enter PINs into the Square app on a mobile device, eliminating the need for expensive hardware PIN pads and making card acceptance more accessible. Also, our solution is quick and easy to update because it is software based, ensuring that our sellers always have access to the latest technology. We are working alongside industry partners to evolve standards for this new mobile PIN acceptance capability, which is the first of its kind for payments. In addition to payment acceptance, we are now able to bring a broader set of products to new markets right at launch. Sellers in the UK can run their businesses with payments and point of sale, as well as Invoices, Employee and Location Management, Analytics, and Customer Directory, and can integrate Square with their other business solutions through Square App | | 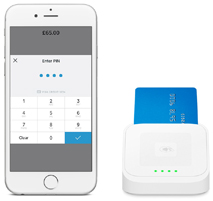
Square chip and PIN |
3
| | |
Marketplace or our Build with Square developer platform of APIs. Catherine Seay founded Curators Coffee to serve specialty coffee, tea, and freshly prepared food from two central London locations and a pop-up shop. Square’s Employee and Location Management has been invaluable for getting her staff up to speed quickly and easily, and Square Dashboard allows her to easily manage operations in real time. We’re bringing more of the Square ecosystem to sellers in our other international markets, too. Continuing the momentum of Virtual Terminal’s rollout in the U.S. and Australia, we recently launched the product in Canada and Japan. Virtual Terminal allows sellers to key in payments from a web browser, making it ideal for sellers that typically use a computer instead of a mobile device. In Australia, we formed seven new API partnerships to provide sellers that use alternative point-of-sale and order management platforms with the ability to accept payments with Square. Integration drives product adoption: Invoices grew significantly after we integrated it into the Square app. Sellers can now send and manage Invoices directly from the Square app (instead of from Square Dashboard in a web browser), making the product more accessible from a mobile device. This enhanced functionality—launched in November 2016—resonated with sellers: In March 2017, nearly 50% of all Square invoices were sent from a mobile device, up from 34% in October 2016. We added more Invoices sellers in this quarter than any other quarter, bringing the total of active Invoices sellers to nearly 225,000, driving approximately $700 million in first-quarter GPV. Invoices makes it easy for Relevé School of Dance to manage monthly billing for its hundreds of customers in Clermont, Florida. Specifically, owners Colleen and Sean Hensley rely on recurring invoices and mobile access, both of which are “big time savers.” Combining Invoices with Square Stand and our contactless and chip reader, Relevé is able to provide its customers with the flexibility to pay in person or online. Integrated, digital invoices enable fast payment, which helps our sellers manage their cash flow. The average payment time of Square Invoices is | | SELLER HIGHLIGHT 
“Using Square is the easiest part of what we do. It’s fast, intuitive, and allows us to concentrate on what’s most important - the coffee.” CATHERINE SEAY Founder ofCurators Coffee curatorscoffee.com INVOICES GPV 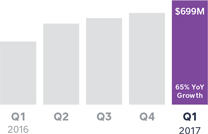
Active Invoices sellers are those who have processed 5+ invoices in the last 12 months. SELLER HIGHLIGHT “ Other payment providers have solicited us, but we didn’t like their complex fee structures. Square Invoices is so easy, why use anything else?” SEAN HENSLEY Owner ofRelevé School of Dance releveschoolofdance.com |
4
| | |
two to three days, while paper invoices average seven weeks.5 Additionally, we provide sellers with a single platform, and we can uniquely offer invoices that are integrated with other services in the ecosystem, like Square Capital and Instant Deposit. This creates strong product crossover: Instant Deposit adoption is 66% higher among Invoices sellers than other Square sellers. We continue to expand our industry-specific solutions with features that help sellers reach more customers and increase sales, like Caviar pickup for restaurants. With Caviar, our goal is to help restaurants never miss a sale by expanding orders beyond table seating, enabling them to reach more customers and increase revenue without increasing overhead. With the launch of Caviar pickup in March 2017, Caviar grew from a food delivery service to a more robust food ordering platform for restaurants and their customers. Caviar continues to grow as we enhance the platform, with order volume in the first quarter of 2017 more than doubling year over year. Caviar also creates meaningful revenue for restaurants: Over half of Caviar’s first-quarter food order volume (FOV) came from restaurants that sell more than $100,000 in FOV with Caviar on an annualized basis. Square’s expertise in point of sale, order management, and services that help sellers grow differentiates Caviar from food delivery services. We’re also better integrating Caviar into the Square ecosystem. For example, we now complete delivery payouts to all new couriers with the technology underlying Square Cash. Philz, a national coffee and coffeehouse chain, uses both Square and Caviar, and it has taken advantage of our Customers API, which connects Square to its other business solutions. Combining customer feedback from Square’s digital receipts with Philz’s CRM system creates a powerful understanding of customers’ habits and preferences. Caviar delivery has provided Philz with a new channel to reach corporate customers, and with the addition of pickup Philz is now able to run its food ordering workflow on a single platform, which has simplified its operations. | | AVERAGE INVOICES PAYMENT TIME 

Food order volume (FOV) is the dollar amount for food items only (i.e., excluding taxes and fees). SELLER HIGHLIGHT 
The Mint Mojito is one of Philz’s most popular Caviar pickup items. |
5
| | |
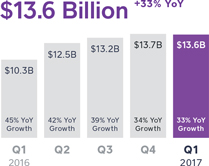
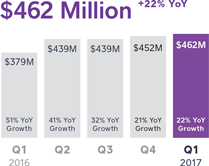
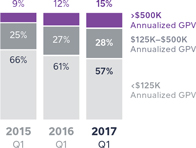
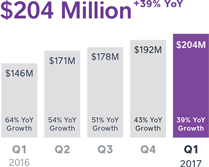
Financial Discussion Gross Payment Volume (GPV) In the first quarter of 2017, we processed $13.6 billion of GPV, which represents an increase of 33% from the first quarter of 2016. This is comparable to 34% year-over-year growth in the fourth quarter of 2016 and is in line with normal seasonal trends. We continue to see strength from larger sellers, which are those that generate more than $125,000 in annualized GPV. In the first quarter of 2017, GPV from larger sellers grew 44% year over year and accounted for 43% of total GPV, up from 39% of total GPV in the first quarter of 2016. Revenue Total net revenue was $462 million in the first quarter of 2017, up 22% compared to the first quarter of 2016. We did not generate any revenue from Starbucks, which transitioned off of our infrastructure during the fourth quarter of 2016. Excluding Starbucks revenue, total net revenue in the first quarter of 2017 grew 36% year over year. Adjusted Revenue was $204 million in the first quarter of 2017, an increase of 39% from the first quarter of 2016. Transaction-based revenue was $403 million in the first quarter of 2017, up 34% from the first quarter of 2016. Transaction-based revenue as a percentage of GPV was 2.96% in the first quarter of 2017, up from 2.92% in the prior year period. Transaction-based profit as a percentage of GPV was 1.07% in the first quarter of 2017, up from 1.03% in the prior year period. Excluding the promotional processing credit from the first quarter of 2016, transaction-based revenue and transaction-based profit as percentages of GPV are consistent year over year. Our continued ability to grow GPV at scale, while maintaining our transaction revenue margin, demonstrates that our sellers recognize the value of our managed payments solution and our cohesive ecosystem. Subscription and services-based revenue was $49 million in the first quarter of 2017, up 106% from the first quarter of 2016 and accelerating from 81% year-over-year growth in the fourth quarter of 2016. This increase | | TOTAL NET REVENUE 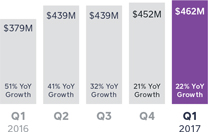
ADJUSTED REVENUE 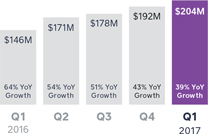
AS A PERCENTAGE OF GPV: 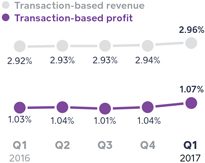
In the first quarter of 2016, we provided sellers withpromotional processing credits for pre-orders of our contactless and chip reader. Excluding these credits, transaction-based revenue and transaction-based profit as percentages of GPV would have been 2.95% and 1.06%, respectively, in the first quarter of 2016. |
6
| | |
demonstrates our ability to launch new products and feature improvements for existing products that resonate with sellers and buyers. Caviar, Square Capital, and Instant Deposit contributed significantly to subscription and services-based revenue growth. Specifically, Square Capital facilitated over 40,000 business loans totaling $251 million in the first quarter of 2017, up 64% year over year. Instant Deposit benefited from increased awareness among both sellers and Square Cash customers. Hardware revenue in the first quarter of 2017 was $9 million, down 44% from the first quarter of 2016 and flat on a sequential basis. The year-over-year decline was driven by the fulfillment of the majority of the backlog of pre-orders for our contactless and chip reader in the first quarter of 2016. Operating Expenses/Earnings Operating expenses were $188 million in the first quarter of 2017, decreasing 10% year over year and increasing 4% on a sequential basis. Excluding a litigation expense in the first quarter of 2016 of $50 million, operating expenses for the first quarter of 2017 would have increased 19% year over year. Non-GAAP operating expenses were up 24% year over year, representing 73% of Adjusted Revenue in the first quarter of 2017. • Product development expenses were $69 million on a GAAP basis and $46 million on a non-GAAP basis in the first quarter of 2017, up 6% and 15%, respectively, from the first quarter of 2016. This primarily reflects increases in engineering, product, and design personnel costs. • Sales and marketing expenses were $50 million on a GAAP basis and $46 million on a non-GAAP basis in the first quarter of 2017, up 30% and 29%, respectively, from the first quarter of 2016. The increase was driven primarily by costs related to Square Cash and growth in sales, account management, and creative personnel costs. • General and administrative expenses were $57 million on a GAAP basis and $45 million on a non-GAAP basis in the first quarter of 2017. These costs represent a 41% decline and 22% increase, respectively, from the first quarter of 2016. Excluding the litigation expense in the first quarter of 2016, expenses would have increased 23% on a GAAP basis. The year-over-year increase, excluding the litigation expense in 2016, was due primarily to increased personnel costs for functions including legal, | | TRANSACTION LOSS AS A PERCENTAGE OF GPV 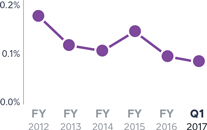
|
7
| | |
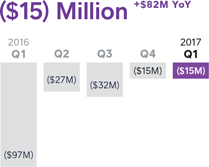
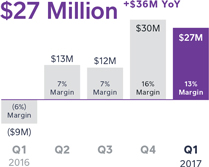
finance, and business operations for Caviar and Square Capital. • Transaction, loan, and advance losses were $12 million in the first quarter of 2017. Transaction losses as a percentage of GPV for the first quarter of 2017 are continuing to trend below our 0.1% historical average, which underscores ongoing improvements in risk management. We continue to drive a low and declining loss rate as a result of our ability to use data science and machine learning to automate risk assessment for over 99.95% of all transactions on our platform. Net loss was $15 million in the first quarter of 2017, an improvement of $82 million from the first quarter of 2016. Net loss per share, basic and diluted, was $0.04 for the first quarter of 2017, compared to a net loss per share of $0.29 in the first quarter of 2016. We had 367 million weighted-average shares as of the first quarter of 2017. Adjusted EBITDA was $27 million in the first quarter of 2017, compared to a loss of $9 million in the first quarter of 2016, an improvement of $36 million on a year-over-year basis. First-quarter Adjusted EBITDA margin of 13% is an improvement of 19 percentage points year over year. Our Adjusted EBITDA improvement reflects strong top-line growth coupled with operating leverage across all segments, as well as improvements in transaction loss rates. Adjusted Net Income Per Share (Adjusted EPS) was $0.05 based on 404 million weighted-average diluted shares for the first quarter of 2017. This represents a $0.10 improvement on a year-over-year basis from the first quarter of 2016. Balance Sheet/Cash Flow We ended the first quarter of 2017 with $990 million in cash, cash equivalents, restricted cash, and investments in marketable securities, up from $576 million at the end of the fourth quarter of 2016. Positive Adjusted EBITDA and proceeds from employee stock option exercises contributed to the increase in the balance at the end of the quarter. In addition, we had two transactions in the quarter that affected our cash balance. | | NET INCOME (LOSS) 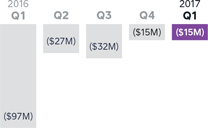
ADJUSTED EBITDA 
A reconciliation of non-GAAP metrics used in this letter to their nearest GAAP equivalents is provided at the end of this letter. Adjusted EBITDA margin is calculated as Adjusted EBITDA divided by Adjusted Revenue. Adjusted EPS is computed by dividing net loss, excluding transaction-based revenue and costs related to Starbucks, share-based compensation expense, amortization of intangible assets, amortization of debt discount and issuance costs, loss on sale of property and equipment, and the litigation settlement with Robert E. Morley, by the weighted-average number of shares of common stock during the period, including all potentially dilutive shares. |
8
| | |
| First, in February 2017, we paid Starbucks approximately $55 million in cash to cancel a warrant that gave them the right to purchase an aggregate of approximately 9.5 million shares of Square stock, eliminating the potential dilutive impact of the warrant. | | |
| |
| Second, on March 6, 2017, we completed an offering for $440 million in convertible senior notes. The convertible senior notes mature in 2022 with a coupon of 0.375%. In connection with the offering, we entered into multiple hedge and warrant transactions, which increased the effective conversion premium to 80%, and thus, reduced potential equity dilution. Total net proceeds from the offering were approximately $393 million, after deducting the costs of the hedge and warrant transactions and certain offering expenses. | | |
9
Guidance
| | | | | | |
| | | Q2 | | Current 2017 | | Previous 2017 |
| | | |
Total net revenue | | $532M to $538M | | $2.12B to $2.16B | | $2.09B to $2.15B |
| | | |
Adjusted Revenue | | $223M to $226M | | $890M to $910M | | $880M to $900M |
| | | |
Adj. Revenue YoY growth (midpoint) | | 31% | | 31% | | 30% |
| | | | |
| | | |
Adjusted EBITDA | | $25M to $28M | | $110M to $120M | | $100M to $110M |
| | | |
Adj. EBITDA margin (midpoint) | | 12% | | 13% | | 12% |
| | | | |
| | | |
Net income (loss) per share | | $(0.09) to $(0.07) | | $(0.24) to $(0.20) | | $(0.24) to $(0.20) |
| | | |
Adjusted EPS (diluted) | | $0.03 to $0.05 | | $0.16 to $0.20 | | $0.15 to $0.19 |
Given our strong results for the first quarter, we are increasing our guidance for the full year. Additionally, our guidance for net income (loss) per share reflects the effect from our convertible note, which is $(0.04) per share for the full year and $(0.01) per share for the second quarter.
There are two considerations to point out for the second quarter of 2017:
| • | | Similar to the first quarter, we do not expect Starbucks transaction-based revenue going forward, which will have a negative impact on year-over-year growth in total net revenue in 2017. | |
| • | | Hardware revenue in the second quarter of 2016 also benefited from the fulfillment of pre-orders for our contactless and chip reader. As such, year-over-year hardware revenue growth for the second quarter of 2017 will be more moderate relative to prior year periods, but to a lesser extent than the effect experienced in the first quarter. | |
We have not reconciled Adjusted EBITDA, Adjusted EBITDA margin, and Adjusted EPS guidance to their GAAP equivalents as a result of the uncertainty regarding, and the potential variability of, reconciling items such as share-based compensation expense and weighted-average fully diluted shares outstanding. Accordingly, a reconciliation of these non-GAAP guidance metrics to their corresponding GAAP equivalents is not available without unreasonable effort. However, we have provided a reconciliation of GAAP to non-GAAP metrics in tables at the end of this letter. It is important to note that the actual amount of such reconciling items would have a significant impact if they were included in our Adjusted EBITDA, Adjusted EBITDA margin, and Adjusted EPS.
10
| | |
Earnings Webcast Square (NYSE:SQ) will host a conference call and earnings webcast at 2:00 p.m.
Pacific time/5:00 p.m. Eastern time today, May 3, 2017, to discuss these financial
results. The domestic dial-in for the call is (888) 349-9618. The Conference ID is
8522233. To listen to a live audio webcast, please visit Square’s Investor Relations
website at square.com/investors. A replay will be available on the same website
following the call. We will release financial results for the second quarter of 2017 on August 2, 2017,
after the market closes, and will also host a conference call and earnings webcast
at 2:00 p.m. Pacific time/5:00 p.m. Eastern time on the same day to discuss those
financial results. As a reminder, we will host an Investor Day on May 16, 2017, from 8 a.m. Pacific
time/11 a.m. Eastern time to 12 noon Pacific time/3:00 p.m. Eastern time. We will
host a live webcast of the event from our Investor Relations website. | | MEDIA CONTACT press@squareup.com INVESTOR RELATIONS CONTACT ir@squareup.com |
| | |
 | |  |
| Jack Dorsey | | Sarah Friar |
| CEO | | CFO |
1 UK Small Business Statistics, National Federation of Self Employed & Small Businesses Limited (FSB)
2 Business Population Estimates for the UK and Regions 2016, Department for Business, Energy & Industrial Strategy
3 SMEs miss out on almost £8.8bn* in lost sales by not accepting credit and debit card payments, Barclaycard
4 Contactless Statistics, The UK Cards Association
5 Trends in Small Business Cash Flow Management and Payment Practices, Capital Solutions Bancorp
11
| | |
 | | “We chose Square
because it offers the
most elegant user
experience for our
customers. “Behind the scenes,
we rely on purchase
orders to receive
inventory, and
advanced reporting
helps track cost of
goods sold across
our three locations.
As we grow and
evolve, these details
are essential in
allowing us to
remain focused on
our customers.” Paisley Parker Marketing Manager Baggu |
SAFE HARBOR STATEMENT
This letter contains forward-looking statements within the meaning of the Safe Harbor provisions of the Private Securities Litigation Reform Act of 1995. All statements other than statements of historical fact could be deemed forward-looking, including, but not limited to, statements regarding the future performance of Square, Inc. and its consolidated subsidiaries (the Company); the Company’s expected financial results for future periods; future growth in the Company’s businesses; the cessation of transaction-based revenue from Starbucks; the Company’s expectations regarding scale, profitability, and the demand for its products, product features, and services in the U.S. and in international markets; the expected impact of the Company’s recent acquisitions; and management’s statements related to business strategy, plans, and objectives for future operations. In some cases, forward-looking statements can be identified by terms such as “may,” “will,” “appears,” “should,” “expects,” “plans,” “anticipates,” “could,” “intends,” “target,” “projects,” “contemplates,” “believes,” “estimates,” “predicts,” “potential,” or “continue,” or the negative of these words or other similar terms or expressions that concern our expectations, strategy, plans, or intentions. Such statements are subject to a number of risks, uncertainties, and assumptions, and investors are cautioned not to place undue reliance on these statements. Actual results could differ materially from those expressed or implied, and reported results should not be considered as an indication of future performance.
Risks that contribute to the uncertain nature of the forward-looking statements include, among others, the Company’s ability to deal with the substantial and increasingly intense competition in its industry; changes to the rules and practices of payment card networks and acquiring processors; the effect of evolving regulations and oversight related to the Company’s provision of payments services and other financial services; the effect of management changes and business initiatives; and changes in political, business, and economic conditions; as well as other risks listed or described from time to time in the Company’s filings with the Securities and Exchange Commission (the SEC), including the Company’s Annual Report on Form 10-K for the fiscal year ended December 31, 2016, which is on file with the SEC and available on the investor relations page of the Company’s website. Except as required by law, the Company assumes no obligation to update any of the statements in this letter.
KEY OPERATING METRICS AND NON-GAAP FINANCIAL MEASURES
To supplement our financial information presented in accordance with generally accepted accounting principles in the United States (GAAP), we consider certain operating and financial measures that are not prepared in accordance with GAAP, including Gross Payment Volume, Adjusted Revenue, Adjusted EBITDA, Adjusted EBITDA margin, Adjusted Net Income (Loss), and Adjusted EPS. We believe these metrics and measures are useful to facilitate period-to-period comparisons of our business and to facilitate comparisons of our performance to that of other payments solution providers. Each of these metrics and measures excludes the effect of our processing agreement with Starbucks, which transitioned to another payments solution provider in the fourth quarter of 2016. As a result, we believe it is useful to exclude Starbucks activity to clearly show the impact Starbucks has had on our financial results historically. Our agreements with other sellers generally provide both those sellers and us the unilateral right to terminate such agreements at any time, without fine or penalty. Furthermore, we generally do not enter into long-term contractual agreements with sellers.
We define Gross Payment Volume (GPV) as the total dollar amount of all card payments processed by sellers using Square, net of refunds. GPV excludes card payments processed for Starbucks. Additionally, GPV excludes non-revenue-generating activity related to our Square Cash peer-to-peer payments service.
Adjusted Revenue is a non-GAAP financial measure that we define as our total net revenue less transaction-based costs, adjusted to eliminate the effect of activity under our processing agreement with Starbucks. As described above, Starbucks completed its previously announced transition to another payments solutions provider and has ceased using our payments solutions altogether, and we believe that providing Adjusted Revenue metrics that exclude the impact of our agreement with Starbucks is useful to investors. We believe it is useful to exclude transaction-based costs from Adjusted Revenue as this is a primary metric used by management to measure our business performance, and it affords greater comparability to other payments solution providers. Adjusted Revenue has limitations as a financial measure, should be considered as supplemental in nature, and is not meant as a substitute for the related financial information prepared in accordance with GAAP.
Adjusted EBITDA, Adjusted Net Income (Loss), and Adjusted EPS are non-GAAP financial measures that represent our net loss and net loss per share, adjusted to eliminate the effect of Starbucks transaction-based revenue, Starbucks transaction-based costs, share-based compensation expenses, amortization of intangible assets, amortization of debt discount and issuance costs in connection with our offering of convertible senior notes in the first quarter of 2017, the litigation settlement with Robert E. Morley, the gain or loss on the sale of property and equipment, and impairment of intangible assets. In addition to the items above, Adjusted EBITDA as a non-GAAP financial measure also excludes depreciation, other cash interest income and expense, other income and expense, and provision or benefit from income taxes. Basic Adjusted Net Income (Loss) Per Share is computed by dividing the Adjusted Net Income (Loss) by the weighted-average number of shares of common stock outstanding during the period. Diluted Adjusted Net Income (Loss) Per Share is computed by dividing Adjusted Net Income (Loss) by the weighted-average number of shares of common stock outstanding, including all potentially dilutive shares. Diluted Adjusted Net Income (Loss) Per Share is the same as Basic Adjusted Net Income (Loss) Per Share because the effects of potentially dilutive items were anti-dilutive given the Adjusted Net Loss position.
We have included Adjusted EBITDA, Adjusted Net Income (Loss), and Adjusted EPS because they are key measures used by our management to evaluate our operating performance, generate future operating plans, and make strategic decisions, including those relating to operating expenses and the allocation of internal resources. Accordingly, we believe that Adjusted EBITDA, Adjusted Net Income (Loss), and Adjusted EPS provide useful information to investors and others in understanding and evaluating our operating results in the same manner as our management and board of directors. In addition, they provide a
13
useful measure for period-to-period comparisons of our business, as they remove the effect of certain non-cash items and certain variable charges. Adjusted EBITDA, Adjusted Net Income (Loss), and Adjusted EPS have limitations as financial measures, should be considered as supplemental in nature, and are not meant as substitutes for the related financial information prepared in accordance with GAAP.
These non-GAAP financial measures should not be considered in isolation from, or as a substitute for, financial information prepared in accordance with GAAP. These non-GAAP financial measures are not based on any standardized methodology prescribed by GAAP and are not necessarily comparable to similarly titled measures presented by other companies.
14
| | |
| Consolidated Statements of Operations | | UNAUDITED |
| | In thousands, except per share data |
| | | | | | | | |
| | | THREE MONTHS ENDED | |
| | | Mar 31, 2017 | | | Mar 31, 2016 | |
Revenue: | | | | | | | | |
Transaction-based revenue | | $ | 403,478 | | | $ | 300,453 | |
Starbucks transaction-based revenue | | | — | | | | 38,838 | |
Subscription and services-based revenue | | | 49,060 | | | | 23,796 | |
Hardware revenue | | | 9,016 | | | | 16,182 | |
| | | | | |
Total net revenue | | | 461,554 | | | | 379,269 | |
| | | | | |
Cost of revenue: | | | | | | | | |
Transaction-based costs | | | 257,778 | | | | 194,276 | |
Starbucks transaction-based costs | | | — | | | | 36,610 | |
Subscription and services-based costs | | | 15,876 | | | | 9,033 | |
Hardware costs | | | 12,662 | | | | 26,740 | |
Amortization of acquired technology | | | 1,807 | | | | 2,370 | |
| | | | | |
Total cost of revenue | | | 288,123 | | | | 269,029 | |
| | | | | |
Gross profit | | | 173,431 | | | | 110,240 | |
| | | | | |
Operating expenses: | | | | | | | | |
Product development | | | 68,582 | | | | 64,592 | |
Sales and marketing | | | 49,900 | | | | 38,496 | |
General and administrative | | | 56,935 | | | | 96,107 | |
Transaction, loan, and advance losses | | | 11,891 | | | | 7,861 | |
Amortization of acquired customer assets | | | 205 | | | | 317 | |
| | | | | |
Total operating expenses | | | 187,513 | | | | 207,373 | |
| | | | | |
Operating loss | | | (14,082) | | | | (97,133) | |
| | | | | |
Interest and other (income) and expense, net | | | 499 | | | | (717) | |
| | | | | |
Loss before income tax | | | (14,581) | | | | (96,416) | |
| | | | | |
Provision for income taxes | | | 509 | | | | 339 | |
| | | | | |
Net loss | | $ | (15,090) | | | $ | (96,755) | |
| | | | | |
Net loss per share: | | | | | | | | |
Basic | | $ | (0.04) | | | $ | (0.29) | |
| | | | | |
Diluted | | $ | (0.04) | | | $ | (0.29) | |
| | | | | |
Weighted-average shares used to compute net loss per share | | | | | | | | |
Basic | | | 366,737 | | | | 331,324 | |
| | | | | |
Diluted | | | 366,737 | | | | 331,324 | |
| | | | | |
15
| | |
| Consolidated Balance Sheets | | UNAUDITED In thousands, except share and per share data |
| | | | | | | | | | |
| | | | | THREE MONTHS ENDED | |
| Assets | | | | Mar 31, 2017 | | | Dec 31, 2016 | |
| Current assets: | | | | | | | | | | |
Cash and cash equivalents | | | | $ | 704,494 | | | $ | 452,030 | |
Short-term investments | | | | | 186,756 | | | | 59,901 | |
Restricted cash | | | | | 22,002 | | | | 22,131 | |
Settlements receivable | | | | | 266,088 | | | | 321,102 | |
Customer funds | | | | | 57,527 | | | | 43,574 | |
Loans held for sale | | | | | 51,883 | | | | 42,144 | |
Other current assets | | | | | 54,605 | | | | 60,543 | |
| | | | | |
| Total current assets | | | | | 1,343,355 | | | | 1,001,425 | |
| | | | | |
| Property and equipment, net | | | | | 91,013 | | | | 88,328 | |
| Goodwill | | | | | 58,103 | | | | 57,173 | |
| Acquired intangible assets, net | | | | | 18,395 | | | | 19,292 | |
| Long-term investments | | | | | 62,711 | | | | 27,366 | |
| Restricted cash | | | | | 14,494 | | | | 14,584 | |
| Other assets | | | | | 3,042 | | | | 3,194 | |
| | | | | |
| Total assets | | | | $ | 1,591,113 | | | | 1,211,362 | |
| | | | | |
| | | |
| Liabilities and Stockholders’ Equity | | | | | | | | | | |
| Current liabilities: | | | | | | | | | | |
Accounts payable | | | | $ | 9,826 | | | $ | 12,602 | |
Customers payable | | | | | 363,039 | | | | 388,058 | |
Settlements payable | | | | | 35,773 | | | | 51,151 | |
Customer funds obligation | | | | | 57,527 | | | | 43,574 | |
Accrued transaction losses | | | | | 20,444 | | | | 20,064 | |
Accrued expenses | | | | | 45,475 | | | | 39,543 | |
Other current liabilities | | | | | 22,812 | | | | 22,472 | |
| | | | | |
| Total current liabilities | | | | | 554,896 | | | | 577,464 | |
| | | | | |
| Long-term debt | | | | | 345,739 | | | | — | |
| | | | | |
| Other liabilities | | | | | 62,545 | | | | 57,745 | |
| | | | | |
| Total liabilities | | | | | 963,180 | | | | 635,209 | |
| Stockholders’ equity: | | | | | | | | | | |
Preferred stock, $0.0000001 par value: 100,000,000 shares authorized at March 31, 2017, and December 31, 2016. None issued and outstanding at March 31, 2017, and December 31, 2016. | | | | | — | | | | — | |
Class A common stock, $0.0000001 par value: 1,000,000,000 shares authorized at March 31, 2017, and December 31, 2016; 228,107,488 and 198,746,620 issued and outstanding at March 31, 2017, and December 31, 2016, respectively. | | | | | — | | | | — | |
Class B common stock, $0.0000001 par value: 500,000,000 shares authorized at March 31, 2017, and December 31, 2016; 145,258,328 and 165,800,756 issued and outstanding at March 31, 2017, and December 31, 2016, respectively. | | | | | — | | | | — | |
Additional paid-in capital | | | | | 1,424,187 | | | | 1,357,381 | |
Accumulated deficit | | | | | (795,012) | | | | (779,239) | |
Accumulated other comprehensive loss | | | | | (1,242) | | | | (1,989) | |
| | | | | |
| Total stockholders’ equity | | | | | 627,933 | | | | 576,153 | |
| | | | | |
| Total liabilities and stockholders’ equity | | | | $ | 1,591,113 | | | $ | 1,211,362 | |
| | | | | |
16
| | |
| Consolidated Statements of Cash Flows | | UNAUDITED In thousands |
| | | | | | | | | | |
| | | | | THREE MONTHS ENDED | |
| Cash Flows from Operating Activities | | | | Mar 31, 2017 | | | Mar 31, 2016 | |
| Net loss | | | | $ | (15,090) | | | $ | (96,755) | |
| Adjustments to reconcile net loss to net cash provided by (used in) operating activities: | | | | | | | | | | |
Depreciation and amortization | | | | | 9,437 | | | | 9,118 | |
Non-cash interest and other expense | | | | | 1,534 | | | | — | |
Share-based compensation | | | | | 31,670 | | | | 31,198 | |
Provision for transaction losses | | | | | 11,558 | | | | 7,182 | |
Deferred provision for income taxes | | | | | 99 | | | | 78 | |
Gain on sale of property and equipment | | | | | — | | | | (38) | |
Changes in operating assets and liabilities: | | | | | | | | | | |
Settlements receivable | | | | | 54,919 | | | | (46,503) | |
Customer funds | | | | | (13,953) | | | | 1,762 | |
Purchase of loans held for sale | | | | | (252,170) | | | | (27,827) | |
Sales and principal payments of loans held for sale | | | | | 242,431 | | | | 17,554 | |
Other current assets | | | | | 6,105 | | | | (21,203) | |
Other assets | | | | | 141 | | | | 355 | |
Accounts payable | | | | | (1,459) | | | | 2,576 | |
Customers payable | | | | | (25,085) | | | | 60,438 | |
Settlements payable | | | | | (15,378) | | | | 3,203 | |
Customer funds obligation | | | | | 13,953 | | | | (1,762) | |
Charge-offs and recoveries to accrued transaction losses | | | | | (11,178) | | | | (8,939) | |
Accrued expenses | | | | | 3,930 | | | | 55,810 | |
Other current liabilities | | | | | (368) | | | | 1,364 | |
Other noncurrent liabilities | | | | | 2,902 | | | | (1,360) | |
| | | | | |
Net cash provided by (used in) operating activities | | | | | 43,998 | | | | (13,749) | |
| | | | | |
| | | |
| Cash Flows from Investing Activities | | | | | | | | | | |
Purchase of marketable securities | | | | | (181,851) | | | | (73,086) | |
Proceeds from maturities of marketable securities | | | | | 15,569 | | | | — | |
Proceeds from sale of marketable securities | | | | | 3,996 | | | | — | |
Purchase of property and equipment | | | | | (6,508) | | | | (7,527) | |
Payment for acquisition of intangible assets | | | | | — | | | | (400) | |
Business acquisitions | | | | | (1,600) | | | | — | |
| | | | | |
Net cash used in investing activities: | | | | | (170,394) | | | | (81,013) | |
| | | | | |
17
| | |
| Consolidated Statements of Cash Flows (continued) | | UNAUDITED In thousands |
| | | | | | | | | | |
| | | | | THREE MONTHS ENDED | |
| Cash Flows from Financing Activities | | | | Mar 31, 2017 | | | Mar 31, 2016 | |
Proceeds from issuance of convertible senior notes, net | | | | | 428,250 | | | | — | |
Purchase of convertible senior note hedges | | | | | (92,136) | | | | — | |
Proceeds from issuance of warrants | | | | | 57,244 | | | | — | |
Payment for termination of Starbucks warrant | | | | | (54,808) | | | | — | |
Principal payments on capital lease obligation | | | | | (247) | | | | — | |
Payments of offering costs related to initial public offering | | | | | — | | | | (5,406) | |
Proceeds from issuances of common stock from the exercise of options, net | | | | | 39,280 | | | | 556 | |
| | | | | |
Net cash provided by (used in) financing activities | | | | | 377,583 | | | | (4,850) | |
| | | | | |
Effect of foreign exchange rate on cash and cash equivalents | | | | | 1,058 | | | | 1,558 | |
| | | | | |
Net increase (decrease) in cash, cash equivalents, and restricted cash | | | | | 252,245 | | | | (98,054) | |
| Cash, cash equivalents, and restricted cash, beginning of period | | | | | 488,745 | | | | 489,552 | |
| | | | | |
| Cash, cash equivalents, and restricted cash, end of period | | | | $ | 740,990 | | | $ | 391,498 | |
| | | | | |
18
| | |
| Key Operating Metrics and Non-GAAP Financial Measures | | UNAUDITED |
| | In thousands, except GPV and per share data |
| | | | | | | | |
| | | THREE MONTHS ENDED | |
| | | Mar 31, 2017 | | | Mar 31, 2016 | |
| | | | | | | | |
| Gross Payment Volume (GPV) (in millions) | | $ | 13,647 | | | $ | 10,290 | |
| Adjusted Revenue | | $ | 203,776 | | | $ | 146,155 | |
| Adjusted EBITDA | | $ | 27,025 | | | $ | (9,083) | |
| Adjusted Net Income (Loss) | | $ | 20,091 | | | $ | (15,110) | |
| Adjusted Net Income (Loss) Per Share Basic | | $ | 0.05 | | | $ | (0.05) | |
| Adjusted Net Income (Loss) Per Share Diluted | | $ | 0.05 | | | $ | (0.05) | |
Adjusted Revenue Reconciliation | | | | | | | UNAUDITED | |
| | | In thousands | |
| | | THREE MONTHS ENDED | |
| | | Mar 31, 2017 | | | Mar 31, 2016 | |
| | | | | | | | |
| Total net revenue | | $ | 461,554 | | | $ | 379,269 | |
| Less: Starbucks transaction revenue | | | — | | | | 38,838 | |
| Less: transaction costs | | | 257,778 | | | | 194,276 | |
| | | | | |
Adjusted Revenue | | $ | 203,776 | | | $ | 146,155 | |
| | | | | |
Adjusted EBITDA Reconciliation | | | | | | | UNAUDITED | |
| | | In thousands | |
| | | THREE MONTHS ENDED | |
| | | Mar 31, 2017 | | | Mar 31, 2016 | |
| | | | | | | | |
| Net loss | | $ | (15,090) | | | $ | (96,755) | |
| Starbucks transaction-based revenue | | | — | | | | (38,838) | |
| Starbucks transaction-based costs | | | — | | | | 36,610 | |
| Share-based compensation expense | | | 31,670 | | | | 31,198 | |
| Depreciation and amortization | | | 9,437 | | | | 9,118 | |
| Litigation settlement expense | | | — | | | | 50,000 | |
| Interest and other (income) expense, net | | | 499 | | | | (717) | |
| Provision for income taxes | | | 509 | | | | 339 | |
| Gain on sale of property and equipment | | | — | | | | (38) | |
| | | | | |
Adjusted EBITDA | | $ | 27,025 | | | $ | (9,083) | |
| | | | | |
19
| | |
| Adjusted Net Income (Loss) Reconciliation | | UNAUDITED |
| | In thousands, except per share data |
| | | | | | | | |
| | | THREE MONTHS ENDED | |
| | | Mar 31, 2017 | | | Mar 31, 2016 | |
| | | | | | | |
| Net loss | | $ | (15,090) | | | $ | (96,755) | |
| Starbucks transaction-based revenue | | | — | | | | (38,838) | |
| Starbucks transaction-based costs | | | — | | | | 36,610 | |
| Share-based compensation expense | | | 31,670 | | | | 31,198 | |
| Amortization of intangible assets | | | 2,121 | | | | 2,713 | |
| Litigation settlement expense | | | — | | | | 50,000 | |
| Amortization of debt discount and issuance costs | | | 1,390 | | | | — | |
| Gain on sale of property and equipment | | | — | | | | (38) | |
| | | | | |
Adjusted Net Income (Loss) | | $ | 20,091 | | | $ | (15,110) | |
| | | | | |
Adjusted Net Income (Loss) Per Share: | | | | | | | | |
Basic | | $ | 0.05 | | | $ | (0.05) | |
Diluted | | $ | 0.05 | | | $ | (0.05) | |
Weighted-average shares used to compute Adjusted Net Income (Loss) | | | | | | | | |
Per Share: | | | | | | | | |
Basic | | | 366,737 | | | | 331,324 | |
Diluted | | | 404,319 | | | | 331,324 | |
| | |
| Adjusted Revenue Guidance Reconciliation | | UNAUDITED |
| | In thousands |
| | | | | | | | |
| | | THREE MONTHS ENDED | | | YEAR ENDED | |
| | | June 30, 2017 | | | Dec 31, 2017 | |
| | | | | | | | |
| Total net revenue | | $ | 532,000 - 538,000 | | | $ | 2,120,000 - 2,160,000 | |
| Less: Transaction-based costs | | | 309,000 - 312,000 | | | | 1,230,000 - 1,250,000 | |
| | | | | |
Adjusted Revenue | | $ | 223,000 - 226,000 | | | $ | 890,000 - 910,000 | |
| | | | | |
20
| | | | | | | | |
| Non-GAAP Operating Expenses | | | | | | | UNAUDITED | |
| | | | | | | In thousands | |
| | | THREE MONTHS ENDED | |
| | | Mar 31, 2017 | | | Mar 31, 2016 | |
| | |
| Operating expenses | | $ | (187,513) | | | $ | (207,373) | |
| Share-based compensation | | | 31,670 | | | | 31,198 | |
| Depreciation and amortization | | | 7,531 | | | | 6,189 | |
| Litigation settlement expense | | | — | | | | 50,000 | |
| Loss (gain) on sale of fixed assets | | | — | | | | (38) | |
| | | | | |
Non-GAAP operating expenses | | $ | (148,312) | | | $ | (120,024) | |
| | | | | |
| | |
| Product development | | $ | (68,582) | | | $ | (64,592) | |
| Share-based compensation | | | 19,356 | | | | 21,947 | |
| Depreciation and amortization | | | 3,712 | | | | 3,141 | |
| | | | | |
Non-GAAP product development | | $ | (45,514) | | | $ | (39,504) | |
| | | | | |
| | |
| Sales and marketing | | $ | (49,900) | | | $ | (38,496) | |
| Share-based compensation | | | 3,935 | | | | 2,903 | |
| Depreciation and amortization | | | 77 | | | | 2 | |
| Loss (gain) on sale of fixed assets | | | 58 | | | | 18 | |
| | | | | |
Non-GAAP sales and marketing | | $ | (45,830) | | | $ | (35,573) | |
| | | | | |
| | |
| General and administrative | | $ | (56,935) | | | $ | (96,107) | |
| Share-based compensation | | | 8,379 | | | | 6,348 | |
| Depreciation and amortization | | | 3,742 | | | | 3,046 | |
| Litigation settlement expense | | | — | | | | 50,000 | |
| Loss (gain) on sale of fixed assets | | | (58) | | | | (56) | |
| | | | | |
Non-GAAP general and administrative | | $ | (44,872) | | | $ | (36,769) | |
| | | | | |
Depreciation and Amortization by Function | | | | | | | UNAUDITED | |
| | | | | | | In thousands | |
| | | THREE MONTHS ENDED | |
| | | Mar 31, 2017 | | | Mar 31, 2016 | |
| | |
| Cost of revenue | | $ | 1,906 | | | $ | 2,929 | |
| Product development | | | 3,712 | | | | 3,141 | |
| Sales and marketing | | | 77 | | | | 2 | |
| General and administrative | | | 3,742 | | | | 3,046 | |
| | | | | |
Total depreciation and amortization | | $ | 9,437 | | | $ | 9,118 | |
| | | | | |
21