Exhibit 99.1

Q1 2019 Shareholder Letter SQUARE.COM/INVESTORS FEATURED SELLER • Tutu School in Larkspur, CA
Highlights
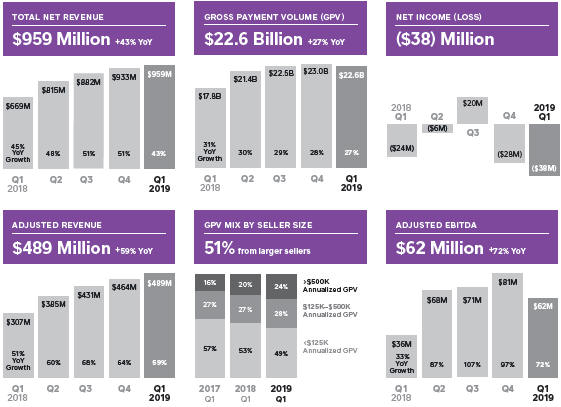
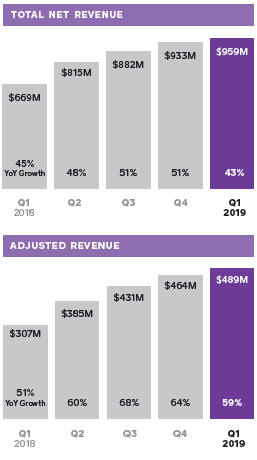
We continued to drive strong revenue growth at scale: In the first quarter of 2019, total net revenue grew 43% year over year, and Adjusted Revenue grew 59% year over year.
| | | | |
 | |  | |  |
| | |
| We launched the new Square Online Store to make it easy for sellers to combine online sales with anin-person business. | | We launched Square Invoices as a dedicated mobile app for sellers who typically accept payments remotely. | | We launched Square Stand and Square Reader for contactless and chip in Japan, as the country aims to double digital payments. |
FIRST QUARTER FINANCIAL METRICS
In August 2017, we invested $25 million for preferred shares of Eventbrite, which converted into common stock in connection with Eventbrite’s IPO in September 2018. We revalued this investment, which resulted in a gain of $37 million in the third quarter of 2018, and losses of $17 million and $14 million in the fourth quarter of 2018 and first quarter of 2019, respectively. We will continue to carry it at fair market value, with changes being recorded each quarter in other income or expense.
A reconciliation ofnon-GAAP financial measures used in this letter to their nearest GAAP equivalents is provided at the end of this letter. Adjusted Revenue is total net revenue less transaction-based costs and bitcoin costs, and excludes the effect of deferred revenue adjustment related to purchase accounting.
ON THE COVER
Tutu Schoolis a
children’s ballet studio
with over 30 locations
across the country. Tutu
School has used Square
for over two years and
uses Square Invoices to
make payment easy for
both the customer and
the business.
May 1, 2019
~2.5x
Cash App volumeis the
total dollar amount of
peer-to-peer, Cash Card,
and Cash for Business
transactions.

To Our Shareholders
We continued to drive strong revenue growth at scale. In the first quarter of 2019, total net revenue grew 43% year over year, and Adjusted Revenue grew 59% year over year. Excluding the acquisitions of Weebly and Zesty, which were completed in the second quarter of 2018, total net revenue and Adjusted Revenue grew 39% and 49% year over year, respectively. Cash App volume grew nearly 2.5x year over year, reflecting the growing network effects, reach, and engagement of this ecosystem.
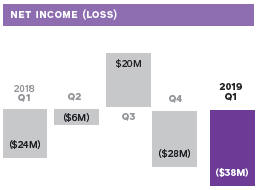
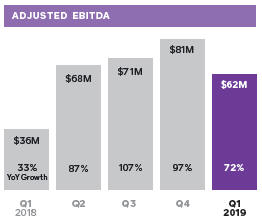
Net loss was $38 million, compared to a net loss of $24 million in the first quarter of 2018. Excluding the loss of $14 million as a result of themark-to-market valuation of our Eventbrite investment, net loss was $24 million. Adjusted EBITDA was $62 million in the first quarter of 2019, up 72% year over year, highlighting our ability to balance growth with ongoing investment in our business.
Templated, single-page
Multi-page online store
builder with customizable
|
layout and design options |
Easy to get started and
Syncs data across online
Optimized for search engines
Robuste-Commerce
functionality, including
shipping, fulfillment tracking,
Abandoned cart Emails,
Advanced vertical-
|
Shoppable Instagram galleries |
We launched the new Square Online Store to make it easy for sellers to combine online sales with anin-person business.
Customers are used to buying in person, on their computers, and on their phones, and Square provides sellers with the tools they need to offer a seamless experience across these channels. We integrated Weebly technology with Square to create a feature-rich, self-serve website builder that helps sellers create a custom online store. Square Online Store gives buyers more options, including the ability to purchase online and then pick up in store (a feature typically only available through enterprise sellers), as well as shoppable Instagram galleries.
Square Online Store makes it easy for sellers to expand their business: Approximately 70% of Square Online Store sellers used Square before adding online sales. The new Square Online Store automatically syncs items, orders, inventory, prices, and data across online andin-person sales, providing sellers with a real-time view of their entire business. Square Online Store also provides features for food and drink sellers to offer seamless online ordering from their own website, customized pickup times across multiple locations, and the option to easily pay ahead for online orders.
Oak and Lace is a women’s clothing and accessories boutique in Columbia, Tennessee, and owner Casey Bryant uses Square to run her omnichannel business. She started Oak and Lace four years ago using Square Reader and added Square Register and Square Marketing as her business grew. When she wanted to expand, Square Online Store made it easy for Casey to build and launch her website in only a couple of hours. The automatic syncing saves Casey hours of manual reconciliation every week and helps her better serve her customers as she sometimes carries a limited number of her specialty items.
We integrated Square Online Store with a redesigned Square for Retail to provide retail sellers with an industry-specific omnichannel solution. Sellers can now automatically connect their Square for Retail catalog, and managein-person and online orders directly from the point of sale. Square for Retail also has advanced inventory, purchase order, and vendor management capabilities. Square for Retail attracts larger sellers as the average annualized GPV of these sellers is nearly $250,000, and 85% self-onboard. Square for Retail sellers also often take advantage of the full ecosystem and have high adoption rates of Square Invoices, Square Capital, and Square Marketing.

Square provides sellers with the tools they need to offer a seamless experience across channels.

SELLER HIGHLIGHT

After putting together our website in one afternoon, we’ve seen a significant increase in sales. We’re now making sales across the country, and with Square’s marketing tools, we’re turning folks into repeat customers.”
Casey Bryant
Oak and Lace
Columbia, Tennessee
1. Estimate is based on the average transaction size of a Square invoice as of Q1 2019 as well as Billentis estimates ofbusiness-to-consumer andbusiness-to-businessinvoices.
2. “Getting B2B Payments out of the Paper Check Dark Ages,” PYMNTS.com, October 2018.
An active seller has taken at least five payments in the last 12 months.
We first released Invoices as a feature in Dashboard and then added Invoices to the Square Point of Sale app. In March 2019, we also launched Square Invoices as a dedicated mobile app.
3. The Economic Impact of Unpaid Invoices, Fundbox, November 2016.
The Square Invoices mobile app was launched in Australia, Canada, Japan, the UK, and the U.S.
We launched Square Invoices as a dedicated mobile app for sellers who typically accept payments remotely.
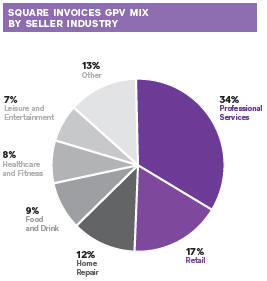
Many businesses depend on invoices to receive payments—approximately $1 trillion in consumer invoices are sent annually in the U.S. alone¹—and most payments are made with checks.² Square Invoices enables sellers to electronically create, send, and manage invoices. With the new estimates feature, sellers can create professional estimates that customers can approve with one click. Square Invoices has more than 350,000 active sellers, with over $5 billion in GPV processed in the last 12 months.
The Square Invoices dedicated mobile app better addresses the needs of a business whose primary way to get paid is via invoices: Over half of Square Invoices sellers process the majority of their payments through invoices. More specifically, these sellers have the need to collect payment remotely, and many have limited or no storefront, which means every interaction needs to reflect professionalism to build trust with the buyer. These sellers’ services are often personalized, with pricing variability dependent on time spent or materials used, which affects the way the seller needs to track and collect payment. Additionally, these sellers have a high average transaction size of more than $250, and lower transaction frequency, making effective cash flow management particularly important. The average U.S. small business waits approximately 21 days for payment³—while most Square Invoices are paid in one day.
We launched the Square Invoices mobile app across all our markets, and to date, almost 25% of downloads have been in markets outside the U.S. Square Invoices serves the needs of sellers not only in the services industry but also food and drink (e.g., catering orders) and retail (e.g., wholesale orders). Unlike many other invoicing products, Square Invoices does not charge sellers a monthly subscription fee, and sellers pay only a transaction fee for invoices that are paid with a card.
Based in Chicago, Launch Pad Media provides book editing and author services, such as content and copy editing.Co-owner Beth Skony previously used paper invoices, mailing them to customers, waiting for them to mail a check back, and then waiting even longer for the check to clear and the funds to be available. With Square Invoices, she can send an estimate that her client can approve with one click, convert it to an invoice, and receive payment on the same day. And she can follow up on late payments via email from within the app—a less intrusive experience for the customer than a phone call.

The average small business waits approximately 21 days for payment—while most Square invoices are paid in one day.
SELLER HIGHLIGHT

Before, it was difficult to keep track of what we were owed, determine what payments were overdue, and ensure we were getting paid. Now, the process is streamlined, and more often than not, we’re getting paid the same day. Having access to our funds when we need them most has been a game-changer for our business.”
Beth Skony
Launch Pad Media
Chicago, Illinois
1. METI Cashless Vision Report, 2018.
2. SME Support Japan, 2019.
METI,the Ministry of Economy, Trade and Industry, is a ministry of the Government of Japan created when various agencies merged in 2001 to support economic activities.
Today in Japan, Square Reader for contactless and chip accepts contactless cards and mobile wallets, like Apple Pay, for foreign tourists.
Square sellers in Japan can accept American Express, Diners, Discover, JCB, Mastercard, and Visa.
e-money cards have a stored balance that a buyer reloads with cash, and the cards are often used for lower value transactions as a cash alternative.e-money uses FeliCa technology, a contactless RFID protocol standard.
We launched Square Stand and Square Reader for contactless and chip in Japan, as the country aims to double digital payments.
Only 20% of transactions in Japan are conducted with card payments,¹ which presents a compelling opportunity for Square as there are over 3.8 million small andmedium-size businesses.² Furthermore, METI has recently announced programs and incentives to double card payments to 40% by 2025.¹ Additionally, the 2019 Rugby World Cup and the 2020 Summer Olympics are potential catalysts for card acceptance.
We brought Square Stand and Square Reader for contactless and chip to Japan to make it easier for sellers to accept card payments. With these devices, sellers can accept credit and debit cards via swipe, dip, and tap, and we have plans to launche-money acceptance this year. Square Reader enables sellers and their buyers to complete a payment in seconds, while Square Stand creates a tidy and professional countertop point of sale.
To help businesses extend beyond cash and accept card payments, Square is partnering with Sumitomo Mitsui Banking Corporation (SMBC), one of the largest Japanese multinational banking and financial services companies. SMBC is promoting Square to businesses as its preferred mobilepoint-of-sale provider in all its branches throughout Japan. From family businesses that have existed for generations to those that are newly opened, this partnership will allow both Square and SMBC to help more businesses and individuals across Japan to participate and thrive in the economy.
The Mashiko Pottery Market has been held every spring and fall since 1966 in a small suburb of Tokyo, and has operated predominantly with only cash payments. The market draws more than 500 potters looking to sell their goods to more than 600,000 potential buyers visiting from across Japan. Last fall, a group of potters tested Square hardware to quickly and easily accept card payments in addition to cash. The event organizers would like to make it possible for all potters to accept card payments, and partnered with Square as the ideal tool for the spring market in April.
2x
METI has announced programs and incentives to double the percentage of transactions conducted with card payments by 2025.

SELLER HIGHLIGHT
So many of my customers are thrilled to be able to purchase my ceramics with card payments, especially when they don’t have enough cash on hand. My sales recently went up about 20%, which I believe is because Square enabled me to accept credit cards.”
Yoshikuni Goto
Mashiko Pottery Market
Mashiko, Japan
A reconciliation ofnon-GAAP metrics used in this letter to their nearest GAAP equivalents is provided at the end of this letter.
1. Acquisitions were completed in the second quarter of 2018 and thus did not contribute revenue in the first quarter of 2018.
A larger seller generates more than $125,000 in annualized GPV. Amid-market seller generates more than $500,000 in annualized GPV.
Transaction-based profit is calculated by subtracting transaction-based costs from transaction-based revenue.
2. Cash App subscription and services-based revenue is comprised of fees from Instant Deposit and Cash Card transactions.
A monthlyactive Cash Card customer has at least one Cash Card transaction during a given month.
3. Represents growth in dollars of originations during the quarter.
Financial
Discussion
REVENUE
Total net revenue was $959 million in the first quarter of 2019, up 43% year over year. Adjusted Revenue was $489 million in the first quarter of 2019, up 59% year over year. Excluding the acquisitions of Weebly and Zesty,¹ total net revenue and Adjusted Revenue grew 39% and 49% year over year, respectively, in the first quarter of 2019.
In the first quarter of 2019, we processed $22.6 billion in GPV, up 27% year over year. We continued to see strength from larger sellers. In the first quarter of 2019, GPV from larger sellers grew 37% year over year and accounted for 51% of total GPV, up from 47% in the first quarter of 2018. Of note, GPV frommid-market sellers grew 50% year over year and accounted for 24% of total GPV, up from 20% in the first quarter of 2018. Transaction-based revenue was $657 million in the first quarter of 2019, up 26% year over year, and transaction-based profit was $248 million, up 27% year over year.
Subscription and services-based revenue was $219 million in the first quarter of 2019, up 126% year over year. Excluding the acquisitions of Weebly and Zesty, subscription and services-based revenue was $191 million in the first quarter of 2019, up 97% year over year, with growth driven primarily by Cash App,² Caviar, Square Capital, and Instant Deposit for sellers. Within Cash App, we continued to grow the number of monthly active Cash Card customers and saw an increase in transaction frequency per customer. In the first quarter of 2019, Square Capital facilitated approximately 70,000 loans totaling $508 million, up 50% year over year.³
Hardware revenue in the first quarter of 2019 was $18 million, up 26% year over year, driven primarily by Square Terminal, which commenced shipment in November 2018, as well as growth from Square Reader for contactless and chip, Square Stand, and third-party peripherals.
1. The acquisition of Weebly was completed in the second quarter of 2018 and thus did not contribute expenses in the first quarter of 2018.
OPERATING EXPENSES
Operating expenses were $419 million in the first quarter of 2019, up 52% year over year, andnon-GAAP operating expenses were $340 million, up 54% year over year. On anon-GAAP basis, operating expenses were 69% of Adjusted Revenue in the first quarter of 2019.
| • | | Product development expenses were $154 million on a GAAP basis and $100 million on anon-GAAP basis in the first quarter of 2019, up 46% and 44% year over year, respectively. This increase was driven primarily by personnel costs related to our engineering, data science, and design teams, as well as Weebly.¹ |
| • | | Sales and marketing expenses were $134 million on a GAAP basis and $126 million on anon-GAAP basis in the first quarter of 2019, up 73% and 76% year over year, respectively. This increase was driven primarily by Cash App marketing expenses, growth in advertising expenditures, and personnel growth. |
| • | | General and administrative expenses were $102 million on a GAAP basis and $86 million on anon-GAAP basis in the first quarter of 2019, up 35% and 38% year over year, respectively. The increase was due primarily to additions to finance, legal, and support personnel. |
| • | | Transaction, loan, and advance losses were $28 million in the first quarter of 2019, up 54% year over year. This increase is primarily driven by growth in seller GPV, Cash App, and Square Capital loan volumes, including newer loan products. Seller transaction losses continued to trend below 0.1% of GPV, underscoring continued discipline in risk management. For Square Capital, we continued to see an average loss rate of less than 4% for our core Flex Loan product. |
EARNINGS
Net loss in the first quarter of 2019 was $38 million, compared to a net loss of $24 million in the first quarter of 2018. Net loss in the first quarter of 2019 was $24 million when excluding the loss of $14 million as a result of themark-to-market valuation of our Eventbrite investment. Net loss per share was $0.09 on both a basic and diluted basis for the first quarter of 2019, based on 419 million weighted-average basic and diluted shares. This compares to a net loss per share of $0.06 in the first quarter of 2018 on both a basic and diluted basis. Excluding the effect of Eventbrite, both basic and diluted net loss per share in the first quarter of 2019 would have been $0.06.
Adjusted EBITDA was $62 million in the first quarter of 2019, compared to $36 million in the first quarter of 2018, up 72% year over year. Adjusted Net Income Per Share (Adjusted EPS) was $0.11 based on 487 million weighted-average diluted shares for the first quarter of 2019, representing a $0.05 improvement year over year.
BALANCE SHEET/CASH FLOW
We ended the first quarter of 2019 with $1.6 billion in cash, cash equivalents, restricted cash, and investments in marketable fixed income securities, comparable to the end of the fourth quarter of 2018.
In the first quarter of 2019, Adjusted EBITDA and proceeds from the exercise of stock options contributed positively to our cash balance. This was offset primarily by cash outflows due to the timing of certain operating activities, purchases of property and equipment and other long term investments, and payments for tax withholding related to vesting of restricted stock units.
In August 2017, we invested $25 million for preferred shares of Eventbrite, which converted into common stock in connection with Eventbrite’s IPO in September 2018. We revalued this investment, which resulted in a gain of $37 million in the third quarter of 2018, and losses of $17 million and $14 million in the fourth quarter of 2018 and first quarter of 2019, respectively.
Guidance
| | | | | | | | | | | | |
| | | | | Q2 2019 | | | | Current 2019 | | | | Previous 2019 |
| | | | | | |
Total net revenue | | | | $1.09B to $1.11B | | | | $4.41B to $4.47B | | | | $4.35B to $4.41B |
| | | | | | |
Adjusted Revenue | | | | $545M to $555M | | | | $2.25B to $2.28B | | | | $2.22B to $2.25B |
| | | | | | |
Year-over-year growth (midpoint) | | | | 43% | | | | 43% | | | | 41% |
| | | | | | |
Adjusted EBITDA | | | | $90M to $94M | | | | $405M to $415M | | | | $405M to $415M |
| | | | | | |
Net income (loss) per share | | | | $(0.07) to $(0.05) | | | | $(0.09) to $(0.05) | | | | $(0.05) to $(0.01) |
| | | | | | |
Adjusted EPS (diluted) | | | | $0.14 to $0.16 | | | | $0.74 to $0.78 | | | | $0.74 to $0.78 |
Given the significant market opportunity ahead of us, we will continue to be purposeful as we reinvest in our business to drive long-term growth. Our guidance for the full year of 2019 reflects both investment and growing profitability.
We are revising our net income (loss) per share guidance for the full year of 2019, primarily as a result of the first quartermark-to-market valuation of our investment in Eventbrite. Please note that our guidance for net income (loss) per share for the full year and second quarter of 2019 reflects a share price of approximately $19 for Eventbrite, based on its closing price on March 31, 2019. In a given quarter, a change in Eventbrite’s share price of $3 results in a change to our net income (loss) per share of approximately $0.01. As a reminder, this does not impact our Adjusted EPS guidance.
We have not reconciled Adjusted EBITDA and Adjusted EPS guidance to their GAAP equivalents as a result of the uncertainty regarding, and the potential variability of, reconciling items such as share-based compensation expense and weighted-average fully diluted shares outstanding. Accordingly, a reconciliation of thesenon-GAAP guidance metrics to their corresponding GAAP equivalents is not available without unreasonable effort. However, it is important to note that material changes to these reconciling items could have a significant effect on our Adjusted EBITDA and Adjusted EPS guidance and future GAAP results. We have provided a reconciliation of other GAAP tonon-GAAP metrics in tables at the end of this letter.
MEDIA CONTACT
press@squareup.com
INVESTOR RELATIONS CONTACT
ir@squareup.com
Earnings
Webcast
Square (NYSE:SQ) will host a conference call and earnings webcast at 2:00 p.m. Pacific time/5:00 p.m. Eastern time today, May 1, 2019, to discuss these financial results. The domesticdial-in for the call is (877)683-2081. The Conference ID is 7241398. To listen to a live audio webcast, please visit Square’s Investor Relations website atsquare.com/investors. A replay will be available on the same website following the call.
We will release financial results for the second quarter of 2019 on August 1, 2019, after the market closes, and will also host a conference call and earnings webcast at 2:00 p.m. Pacific time/5:00 p.m. Eastern time on the same day to discuss those financial results.
| | | | |

| | 
| | |
Jack Dorsey | | Amrita Ahuja | | |
| CEO | | CFO | | |


I’ve been using Square at my bar and restaurant since its arrival in Japan. I like Square for its simplicity, tidiness, and ease of use, and my customers love it because of how quick it is to pay.”
Yoshitane Nishioka
Owner,IKI-BA
Tokyo, Japan
SAFE HARBOR STATEMENT
This letter contains forward-looking statements within the meaning of the Safe Harbor provisions of the Private Securities Litigation Reform Act of 1995. All statements other than statements of historical fact could be deemed forward-looking, including, but not limited to, statements regarding the future performance of Square, Inc. and its consolidated subsidiaries (the Company); the Company’s expected financial results for future periods and expected benefits of reinvesting in its ecosystem; future growth in the Company’s businesses and products and the Company’s ability to drive such growth; the Company’s expectations regarding scale, profitability, and the demand for or benefits from its products, product features, and services in the U.S. and in international markets; the Company’s expectations regarding its market opportunity in Japan; and management’s statements related to business strategy, plans, and objectives for future operations. In some cases, forward-looking statements can be identified by terms such as “may,” “will,” “appears,” “should,” “expects,” “plans,” “anticipates,” “could,” “intends,” “target,” “projects,” “contemplates,” “believes,” “estimates,” “predicts,” “potential,” or “continue,” or the negative of these words or other similar terms or expressions that concern our expectations, strategy, plans, or intentions. Such statements are subject to a number of known and unknown risks, uncertainties, assumptions, and other factors that may cause the Company’s actual results, performance, or achievements to differ materially from results expressed or implied in this letter. Investors are cautioned not to place undue reliance on these statements and reported results should not be considered as an indication of future performance.
Risks that contribute to the uncertain nature of the forward-looking statements include, among others, the Company’s ability to deal with the substantial and increasingly intense competition in its industry; the Company’s ability to ensure the interoperability of its technology with that of third parties; changes to the rules and practices of payment card networks and acquiring processors; the impact of acquisitions or divestitures, strategic investments, or entries into new businesses; the effect of evolving regulations and oversight related to the Company’s provision of payments services and other financial services; the effect of management changes and business initiatives; adoption of the Company’s products and services in international markets; and changes in political, business, and economic conditions; as well as other risks listed or described from time to time in the Company’s filings with the Securities and Exchange Commission (the SEC), including the Company’s Annual Report on Form10-K for the fiscal year ended December 31, 2018, which is on file with the SEC and available on the investor relations page of the Company’s website. Additional information will also be set forth in the Company’s Quarterly Report on Form10-Q for the fiscal quarter ended March 31, 2019. All forward-looking statements are based on information and estimates available to the Company at the time of this letter and are not guarantees of future performance. Except as required by law, the Company assumes no obligation to update any of the statements in this letter.
KEY OPERATING METRICS AND
NON-GAAP FINANCIAL MEASURES
To supplement our financial information presented in accordance with generally accepted accounting principles in the United States (GAAP), we consider certain operating and financial measures that are not prepared in accordance with GAAP, including Gross Payment Volume, Adjusted Revenue, Adjusted EBITDA, Adjusted EBITDA margin, Adjusted Net Income, Diluted Adjusted Net Income Per Share (Adjusted EPS), andnon-GAAP operating expenses. We believe these metrics and measures are useful to facilitateperiod-to-period comparisons of our business and to facilitate comparisons of our performance to that of other payments solution providers.
We define Gross Payment Volume (GPV) as the total dollar amount of all card payments processed by sellers using Square, net of refunds. Additionally, GPV includes Cash App activity related topeer-to-peer payments sent from a credit card, and Cash for Business.
Adjusted Revenue is anon-GAAP financial measure that we define as our total net revenue less transaction-based costs and bitcoin costs, and we add back the impact of the acquired deferred revenue adjustment, which was written down to fair value in purchase accounting. We believe it is useful to subtract transaction-based costs and bitcoin costs from total net revenue to derive Adjusted Revenue as this is a primary metric used by management to measure our business performance, and it affords greater comparability to other payments solution providers. Substantially all of the transaction-based costs are interchange and assessment fees, processing fees, and bank settlement fees paid to third-party payment processors and financial institutions. While some payments solution providers present their revenue in a similar fashion to us, others present their revenue net of transaction-based costs because, unlike us, they pass through these costs directly to their sellers and are not deemed the principal in these arrangements. Under our standard pricing model, we do not pass through these costs directly to our sellers. We deduct bitcoin costs because we consider our role in the bitcoin transactions to be facilitating customer access to bitcoin. Since we only apply a small margin to the market cost of bitcoin when we sell bitcoin to customers, and we have no control over the cost of bitcoin in the market, which tends to be volatile, we believe deducting bitcoin costs is a better reflection of the economic benefits as well as the Company’s performance from the bitcoin transactions. We recognize acquired deferred revenue that was written down for purchase accounting since we believe that it is correlated with ordinary and ongoing operations of the acquired company and facilitates analysis of revenue growth and business trends. We define Adjusted Revenue from subscription and services as the total net subscription and services-based revenue adjusted to add back the impact of the write-down adjustment to acquired deferred revenue related to purchase accounting. We add back this deferred revenue that was written down since we believe it is correlated with ordinary and ongoing operations of the acquired company and facilitates analysis of revenue growth and business trends. The acquired deferred revenue adjustment was not included in prior periods because it was immaterial or zero. Adjusted Revenue has limitations as a financial measure, should be considered as supplemental in nature, and is not meant as a substitute for the related financial information prepared in accordance with GAAP.
Adjusted EBITDA, Adjusted EBITDA margin, Adjusted Net Income, Diluted Adjusted Net Income Per Share (Adjusted EPS), andnon-GAAP operating expenses arenon-GAAP financial measures that represent our net income (loss) and net income (loss) per share, adjusted to eliminate the effect of share-based compensation expenses, amortization of intangible assets, amortization of debt discount and issuance costs in connection with our offering of convertible senior notes in the first quarter of 2017 and in the second quarter of 2018, the gain or loss on the disposal of property and equipment, gain or loss on revaluation of equity investment, gain or loss on debt extinguishment related to the conversion of senior notes and impairment of intangible assets, as applicable. We also exclude certain costs associated with acquisitions that are not normal recurring operating expenses, including amounts paid to redeem acquirees’ unvested stock-based compensation awards, and legal, accounting, and due diligence costs, and we add back the impact of the acquired deferred revenue and deferred cost adjustment, which was written down to fair value in purchase accounting. Such amounts were not included in prior periods as they were immaterial or zero.
Additionally, for purposes of calculating diluted Adjusted EPS we add back cash interest expense on convertible senior notes, as if converted at the beginning of the period, if the impact is dilutive, since we intend to settle future conversions of our convertible senior notes entirely in shares. In addition to the items above, Adjusted EBITDA andnon-GAAP operating expenses arenon-GAAP financial measures that also exclude depreciation, other cash interest income and expense, other income and expense, and provision or benefit from income taxes, as applicable. To calculate the diluted Adjusted EPS we adjust the weighted-average number of shares of common stock outstanding for the dilutive effect of all potential shares of common stock. In periods when we recorded an Adjusted Net Loss, the diluted Adjusted EPS is the same as basic Adjusted EPS because the effects of potentially dilutive items were anti-dilutive given the Adjusted Net Loss position. Adjusted EBITDA margin is calculated as Adjusted EBITDA divided by Adjusted Revenue.
We have included Adjusted EBITDA and Adjusted EPS because they are key measures used by our management to evaluate our operating performance, generate future operating plans, and make strategic decisions, including those relating to operating expenses and the allocation of internal resources. Accordingly, we believe that Adjusted EBITDA and Adjusted EPS provide useful information to investors and others in understanding and evaluating our operating results in the same manner as our management and board of directors. In addition, they provide useful measures forperiod-to-period comparisons of our business, as they remove the effect of certainnon-cash items and certain variable charges. Adjusted EBITDA and Adjusted EPS have limitations as financial measures, should be considered as supplemental in nature, and are not meant as substitutes for the related financial information prepared in accordance with GAAP.
Additionally, we consider net loss and net loss per share excluding the impact of themark-to-market valuation of our investment in Eventbrite, net revenue excluding bitcoin revenue, net revenue and Adjusted Revenue excluding the impact of our acquisitions of Weebly and Zesty, and subscription and services-based revenue excluding the impact of our acquisitions of Weebly and Zesty. We believe that the aforementioned metrics provide useful information about our operating results, enhance the overall understanding of our past performance and future prospects, and provide useful measures forperiod-to-period comparisons of our business, as they remove the effect of certain variable amounts. Our management uses these measures to evaluate our operating performance, generate future operating plans, and make strategic decisions, including those relating to operating expenses and the allocation of internal resources.
Thesenon-GAAP financial measures should not be considered in isolation from, or as a substitute for, financial information prepared in accordance with GAAP. Thesenon-GAAP financial measures are not based on any standardized methodology prescribed by GAAP and are not necessarily comparable to similarly titled measures presented by other companies.
Consolidated Statements
of Operations
UNAUDITED
In thousands, except per share data
| | | | | | | | |
| | | THREE MONTHS ENDED | |
| | | Mar 31, 2019 | | | Mar 31, 2018 | |
Revenue: | | | | | | | | |
Transaction-based revenue | | $ | 656,762 | | | $ | 523,037 | |
Subscription and services-based revenue | | | 218,857 | | | | 97,054 | |
Hardware revenue | | | 18,212 | | | | 14,417 | |
Bitcoin revenue | | | 65,528 | | | | 34,095 | |
| | | | | |
Total net revenue | | | 959,359 | | | | 668,603 | |
| | | | | |
Cost of revenue: | | | | | | | | |
Transaction-based costs | | | 409,069 | | | | 327,911 | |
Subscription and services-based costs | | | 60,523 | | | | 30,368 | |
Hardware costs | | | 26,941 | | | | 19,702 | |
Bitcoin costs | | | 64,696 | | | | 33,872 | |
Amortization of acquired technology | | | 1,376 | | | | 1,580 | |
| | | | | |
Total cost of revenue | | | 562,605 | | | | 413,433 | |
| | | | | |
Gross profit | | | 396,754 | | | | 255,170 | |
| | | | | |
Operating expenses: | | | | | | | | |
Product development | | | 153,559 | | | | 105,095 | |
Sales and marketing | | | 133,713 | | | | 77,266 | |
General and administrative | | | 101,598 | | | | 75,501 | |
Transaction, loan and advance losses | | | 27,841 | | | | 18,031 | |
Amortization of acquired customer assets | | | 2,085 | | | | 269 | |
| | | | | |
Total operating expenses | | | 418,796 | | | | 276,162 | |
| | | | | |
Operating loss | | | (22,042) | | | | (20,992) | |
| | | | | |
Interest expense, net | | | 4,681 | | | | 2,112 | |
Other income, net | | | 11,299 | | | | 707 | |
| | | | | |
Loss before income tax | | | (38,022) | | | | (23,811) | |
| | | | | |
Provision for income taxes | | | 129 | | | | 175 | |
| | | | | |
Net loss | | $ | (38,151) | | | $ | (23,986) | |
| | | | | |
Net loss per share: | | | | | | | | |
Basic | | $ | (0.09) | | | $ | (0.06) | |
| | | | | |
Diluted | | $ | (0.09) | | | $ | (0.06) | |
| | | | | |
Weighted-average shares used to compute net loss per share | | | | | | | | |
Basic | | | 419,289 | | | | 395,948 | |
| | | | | |
Diluted | | | 419,289 | | | | 395,948 | |
| | | | | |
Consolidated Balance Sheets
UNAUDITED
In thousands, except share and per share data
| | | | | | | | |
| Assets | | Mar 31, 2019 | | | Dec 31, 2018 | |
Current assets: | | | | | | | | |
Cash and cash equivalents | | $ | 521,676 | | | $ | 583,173 | |
Short-term investments | | | 566,539 | | | | 540,991 | |
Restricted cash | | | 33,220 | | | | 33,838 | |
Settlements receivable | | | 1,391,078 | | | | 364,946 | |
Customer funds | | | 445,417 | | | | 334,017 | |
Loans held for sale | | | 123,471 | | | | 89,974 | |
Other current assets | | | 185,121 | | | | 164,966 | |
| | | | | |
Total current assets | | | 3,266,522 | | | | 2,111,905 | |
| | | | | |
Property and equipment, net | | | 133,706 | | | | 142,402 | |
Goodwill | | | 267,012 | | | | 261,705 | |
Acquired intangible assets, net | | | 79,697 | | | | 77,102 | |
Long-term investments | | | 481,063 | | | | 464,680 | |
Restricted cash | | | 14,433 | | | | 15,836 | |
Built-to-suit lease asset | | | — | | | | 149,000 | |
Operating leaseright-of-use assets | | | 111,956 | | | | — | |
Othernon-current assets | | | 48,202 | | | | 58,393 | |
| | | | | |
Total assets | | $ | 4,402,591 | | | $ | 3,281,023 | |
| | | | | |
| | |
Liabilities and Stockholders’ Equity | | | | | | | | |
Current liabilities: | | | | | | | | |
Customers payable | | | 1,661,894 | | | | 749,215 | |
Settlements payable | | | 266,121 | | | | 54,137 | |
Accrued transaction losses | | | 36,047 | | | | 33,682 | |
Accrued expenses | | | 87,812 | | | | 82,354 | |
Operating lease liabilities, current | | | 23,041 | | | | — | |
Other current liabilities | | | 108,644 | | | | 99,153 | |
| | | | | |
Total current liabilities | | | 2,183,559 | | | | 1,018,541 | |
| | | | | |
Long-term debt, net of current portion | | | 909,302 | | | | 899,695 | |
Built-to-suit lease liability | | | — | | | | 149,000 | |
Operating lease liabilities,non-current | | | 112,556 | | | | — | |
Othernon-current liabilities | | | 75,585 | | | | 93,286 | |
| | | | | |
Total liabilities | | | 3,281,002 | | | | 2,160,522 | |
Stockholders’ equity: | | | | | | | | |
Preferred stock, $0.0000001 par value: 100,000,000 shares authorized at March 31, 2019, and December 31, 2018. None issued and outstanding at March 31, 2019, and December 31, 2018. | | | — | | | | — | |
| | |
Class A common stock, $0.0000001 par value: 1,000,000,000 shares authorized at March 31, 2019, and December 31, 2018; 334,650,231 and 323,546,864 issued and outstanding at March 31, 2019, and December 31, 2018, respectively. | | | — | | | | — | |
| | |
Class B common stock, $0.0000001 par value: 500,000,000 shares authorized at March 31, 2019, and December 31, 2018; 86,973,715 and 93,501,142 issued and outstanding at March 31, 2019, and December 31, 2018, respectively. | | | — | | | | — | |
| | |
Additionalpaid-in capital | | | 2,048,938 | | | | 2,012,328 | |
Accumulated other comprehensive loss | | | (3,424 | ) | | | (6,053 | ) |
Accumulated deficit | | | (923,925 | ) | | | (885,774 | ) |
| | | | | |
Total stockholders’ equity | | | 1,121,589 | | | | 1,120,501 | |
| | | | | |
Total liabilities and stockholders’ equity | | $ | 4,402,591 | | | $ | 3,281,023 | |
| | | | | |
Consolidated Statements of Cash Flows
UNAUDITED
In thousands
| | | | | | | | |
| | | THREE MONTHS ENDED | |
| Cash Flows from Operating Activities | | Mar 31, 2019 | | | Mar 31, 2018 | |
Net loss | | $ | (38,151 | ) | | $ | (23,986 | ) |
Adjustments to reconcile net loss to net cash provided by operating activities: | | | | | | | | |
Depreciation and amortization | | | 18,971 | | | | 10,160 | |
Non-cash interest and other expense | | | 8,224 | | | | 4,847 | |
Share-based compensation | | | 61,088 | | | | 46,824 | |
Loss on revaluation of equity investment | | | 14,087 | | | | — | |
Amortization of operating leaseright-of-use assets and accretion of operating lease liabilities | | | 6,690 | | | | — | |
Recovery of common stock in connection with indemnification settlement agreement | | | (789 | ) | | | — | |
Transaction, loan and advance losses | | | 27,841 | | | | 18,031 | |
Change in deferred income taxes | | | (754 | ) | | | (654 | ) |
Changes in operating assets and liabilities: | | | | | | | | |
Settlements receivable | | | (1,027,472 | ) | | | (81,452 | ) |
Customer funds | | | (109,439 | ) | | | (49,619 | ) |
Purchase of loans held for sale | | | (507,755 | ) | | | (344,976 | ) |
Sales and principal payments of loans held for sale | | | 467,518 | | | | 337,092 | |
Other current assets | | | (19,327 | ) | | | (13,444 | ) |
Othernon-current assets | | | (2,527 | | | | (1,256 | ) |
Customers payable | | | 912,749 | | | | 147,977 | |
Settlements payable | | | 211,984 | | | | 2,114 | |
Charge-offs to accrued transaction losses | | | (17,443 | ) | | | (12,842 | ) |
Accrued expenses | | | 15,721 | | | | 2,703 | |
Other current liabilities | | | 16.991 | | | | 5,155 | |
Payments for operating lease liabilities | | | (9,293 | ) | | | — | |
Othernon-current liabilities | | | 3,530 | | | | 5,379 | |
| | | | | |
Net cash provided by operating activities | | | 32,444 | | | | 52,053 | |
| | | | | |
| | |
| Cash Flows from Investing Activities | | | | | | | | |
Purchase of marketable debt securities | | | (193,673 | ) | | | (50,221 | ) |
Proceeds from maturities of marketable debt securities | | | 111,505 | | | | 45,450 | |
Proceeds from sale of marketable debt securities | | | 44,810 | | | | — | |
Purchase of marketable debt securities from customer funds | | | (34,613 | ) | | | — | |
Proceeds from maturities of marketable debt securities from customer funds | | | 33,000 | | | | — | |
Purchase of property and equipment | | | (18,168 | ) | | | (8,083 | ) |
Payments for other investments | | | (2,000 | ) | | | — | |
Purchase of intangible assets | | | — | | | | (1,584 | ) |
Business combinations, net of cash acquired | | | (11,248 | ) | | | (1,055 | ) |
| | | | | |
Net cash used in investing activities: | | | (70,387 | ) | | | (15,493 | ) |
| | | | | |
| | |
| Cash Flows from Financing Activities | | | | | | | | |
Payment of deferred purchase consideration | | | (95 | ) | | | — | |
Principal payments on finance lease obligation | | | (1,284 | ) | | | (665 | ) |
Proceeds from the exercise of stock options, net | | | 25,328 | | | | 31,354 | |
Payments for tax withholding related to vesting of restricted stock units | | | (50,801 | ) | | | (27,651 | ) |
| | | | | |
Net cash provided by (used in) financing activities | | | (26,852 | ) | | | 3,038 | |
| | | | | |
Effect of foreign exchange rate on cash and cash equivalents | | | 1,277 | | | | 1,397 | |
| | | | | |
Net increase (decrease) in cash, cash equivalents and restricted cash | | | (63,518 | ) | | | 40,995 | |
Cash, cash equivalents and restricted cash, beginning of period | | | 632,847 | | | | 735,081 | |
| | | | | |
Cash, cash equivalents and restricted cash, end of period | | $ | 569,329 | | | $ | 776,076 | |
| | | | | |
Key Operating Metrics and
Non-GAAP Financial Measures
UNAUDITED
In thousands, except GPV and per share data
| | | | | | | | |
| | | THREE MONTHS ENDED | |
| | | Mar 31, 2019 | | | Mar 31, 2018 | |
| | |
Gross Payment Volume (GPV) (in millions) | | $ | 22,587 | | | $ | 17,827 | |
Adjusted Revenue | | $ | 489,050 | | | $ | 306,820 | |
Adjusted EBITDA | | $ | 61,697 | | | $ | 35,894 | |
Adjusted Net Income Per Share: | | | | | | | | |
Basic | | $ | 0.13 | | | $ | 0.07 | |
Diluted | | $ | 0.11 | | | $ | 0.06 | |
Adjusted Revenue
UNAUDITED
In thousands
| | | | | | | | |
| | | THREE MONTHS ENDED | |
| | | Mar 31, 2019 | | | Mar 31, 2018 | |
| | |
Total net revenue | | $ | 959,359 | | | $ | 668,603 | |
Less: transaction-based costs | | | 409,069 | | | | 327,911 | |
Less: bitcoin costs | | | 64,696 | | | | 33,872 | |
Add: deferred revenue adjustment related to purchase accounting | | | 3,456 | | | | — | |
| | | | | |
Adjusted Revenue | | $ | 489,050 | | | $ | 306,820 | |
| | | | | |
Total Net Revenue and Adjusted Revenue
Excluding Zesty and Weebly
UNAUDITED
In thousands
| | | | | | | | |
| | | THREE MONTHS ENDED | |
| | | Mar 31, 2019 | | | Mar 31, 2018 | |
| | |
Total net revenue | | $ | 959,359 | | | $ | 668,603 | |
Less: revenue from Zesty and Weebly | | | 28,000 | | | | — | |
| | | | | |
Total net revenue excluding Zesty and Weebly | | | 931,359 | | | | 668,603 | |
| | | | | |
Less: transaction-based costs | | | 409,069 | | | | 327,911 | |
Less: bitcoin costs | | | 64,696 | | | | 33,872 | |
| | | | | |
Adjusted Revenue excluding Zesty and Weebly | | $ | 457,594 | | | $ | 306,820 | |
| | | | | |
Adjusted EBITDA
UNAUDITED
In thousands
| | | | | | | | |
| | | THREE MONTHS ENDED | |
| | | Mar 31, 2019 | | | Mar 31, 2018 | |
| | |
Net loss | | $ | (38,151) | | | $ | (23,986) | |
Share-based compensation expense | | | 61,088 | | | | 46,824 | |
Depreciation and amortization | | | 18,971 | | | | 18,971 | |
Interest expense, net | | | 4,681 | | | | 2,112 | |
Other expense, net | | | 11,299 | | | | 707 | |
Provision for income taxes | | | 129 | | | | 175 | |
Loss (gain) on disposal of property and equipment | | | 19 | | | | (98) | |
Acquisition-related costs | | | 782 | | | | — | |
Acquired deferred revenue adjustment | | | 3,456 | | | | — | |
Acquired deferred costs adjustment | | | (577) | | | | — | |
| | | | | |
Adjusted EBITDA | | $ | 61,697 | | | $ | 35,894 | |
| | | | | |
Adjusted Net Income
and Adjusted EPS
UNAUDITED
In thousands, except per share data
| | | | | | | | |
| | | THREE MONTHS ENDED | |
| | | Mar 31, 2019 | | | Mar 31, 2018 | |
| | |
Net loss | | $ | (38,151) | | | $ | (23,986) | |
Share-based compensation expense | | | 61,088 | | | | 46,824 | |
Amortization of intangible assets | | | 3,487 | | | | 1,875 | |
Amortization of debt discount and issuance costs | | | 9,608 | | | | 4,393 | |
Loss on revaluation of equity investment | | | 14,087 | | | | — | |
Loss (gain) on disposal of property and equipment | | | 19 | | | | (98) | |
Acquisition-related costs | | | 782 | | | | — | |
Acquired deferred revenue adjustment | | | 3,456 | | | | — | |
Acquired deferred costs adjustment | | | (577) | | | | — | |
| | | | | |
Adjusted Net Income | | $ | 53,799 | | | $ | 29,008 | |
| | | | | |
Cash interest expense on convertible senior notes | | | 1,277 | | | | — | |
| | | | | |
Adjusted Net Income - diluted | | $ | 55,076 | | | | 29,008 | |
| | | | | |
Adjusted Net Income Per Share: | | | | | | | | |
Basic | | $ | 0.13 | | | $ | 0.07 | |
| | | | | |
Diluted | | $ | 0.11 | | | $ | 0.06 | |
| | | | | |
Weighted-average shares used to compute | | | | | | | | |
Adjusted Net Income Per Share: | | | | | | | | |
Basic | | | 419,289 | | | | 395,948 | |
| | | | | |
Diluted | | | 487,056 | | | | 461,761 | |
| | | | | |
Adjusted Revenue
Guidance Reconciliation
UNAUDITED
In thousands
| | | | | | | | |
| | | THREE MONTHS ENDED | | | YEAR ENDED | |
| | | Jun 30, 2019 | | | Dec 31, 2019 | |
| | |
Total net revenue | | $ | 1,090,000-1,110,000 | | | $ | 4,410,000-4,470,000 | |
| Less: Transaction-based costs, bitcoin costs, deferred revenue adjustment related to purchase accounting | | $ | 545,000-555,000 | | | $ | 2,160,000-2,190,000 | |
| | | | | |
Adjusted Revenue | | $ | 545,000-555,000 | | | $ | 2,250,000-2,280,000 | |
| | | | | |
Non-GAAP Operating Expenses
UNAUDITED
In thousands
| | | | | | | | |
| | | THREE MONTHS ENDED | |
| | | Mar 31, 2019 | | | Mar 31, 2018 | |
| | |
Operating expenses | | $ | (418,796) | | | $ | (276,162) | |
Share-based compensation | | | 61,067 | | | | 46,793 | |
Depreciation and amortization | | | 17,236 | | | | 8,580 | |
Loss (gain) on disposal of property and equipment | | | 19 | | | | (98) | |
Acquisition-related costs | | | 782 | | | | — | |
| | | | | |
Non-GAAP operating expenses | | $ | (339,692) | | | $ | (220,887) | |
| | | | | |
| | |
Product development | | $ | (153,559) | | | $ | (105,095) | |
Share-based compensation | | | 42,649 | | | | 30,482 | |
Depreciation and amortization | | | 11,142 | | | | 5,473 | |
Gain on disposal of property and equipment | | | (71) | | | | — | |
| | | | | |
Non-GAAP product development | | $ | (99,839) | | | $ | (69,140) | |
| | | | | |
| | |
Sales and marketing | | $ | (133,713) | | | $ | (77,266) | |
Share-based compensation | | | 6,202 | | | | 4,961 | |
Depreciation and amortization | | | 1,078 | | | | 609 | |
Loss on disposal of property and equipment | | | 151 | | | | 4 | |
| | | | | |
Non-GAAP sales and marketing | | $ | (126,282) | | | $ | (71,692) | |
| | | | | |
| | |
General and administrative | | $ | (101,598) | | | $ | (75,501) | |
Share-based compensation | | | 12,216 | | | | 11,350 | |
Depreciation and amortization | | | 2,931 | | | | 2,229 | |
Gain on disposal of property and equipment | | | (61) | | | | (102) | |
Acquisition-related costs | | | 782 | | | | — | |
| | | | | |
Non-GAAP general and administrative | | $ | (85,730) | | | $ | (62,024) | |
| | | | | |
Depreciation and
Amortization by Function
UNAUDITED
In thousands
| | | | | | | | |
| | | THREE MONTHS ENDED | |
| | | Mar 31, 2019 | | | Mar 31, 2018 | |
| | |
Cost of revenue | | $ | 1,735 | | | $ | 1,580 | |
Product Development | | | 11,142 | | | | 5,473 | |
Sales and Marketing | | | 1,078 | | | | 609 | |
General and Administrative | | | 2,931 | | | | 2,229 | |
Amortization of acquired customer assets | | | 2,085 | | | | 269 | |
| | | | | |
Total depreciation and amortization | | $ | 18,971 | | | $ | 10,160 | |
| | | | | |