Exhibit 99.1

Q2 2019 Shareholder Letter SQUARE.COM/INVESTORS FEATURED SELLER CanDid Art in Oakland, CA
Highlights
SECOND QUARTER FINANCIAL METRICS
In August 2017, we invested $25 million for preferred shares of Eventbrite, which converted into common stock in connection with Eventbrite’s IPO in September 2018. We revalued this investment, which resulted in a gain of $37 million in the third quarter of 2018, and losses of $17 million, $14 million, and $5 million in the fourth quarter of 2018, first quarter of 2019, and second quarter of 2019, respectively. We will continue to carry it at fair market value, with changes being recorded each quarter in other income or expense.
A reconciliation of non-GAAP financial measures used in this letter to their nearest GAAP equivalents is provided at the end of this letter. Adjusted Revenue is total net revenue less transaction-based costs and bitcoin costs, and excludes the effect of deferred revenue adjustment related to purchase accounting.
ON THE COVER
Candice Cox, owner
ofCanDid Art, is a
jewelry maker and home
decor designer based
in Oakland, CA. She
uses Square Reader for
contactless and chip to
easily accept payments
from her customers.
August 1, 2019

To Our Shareholders
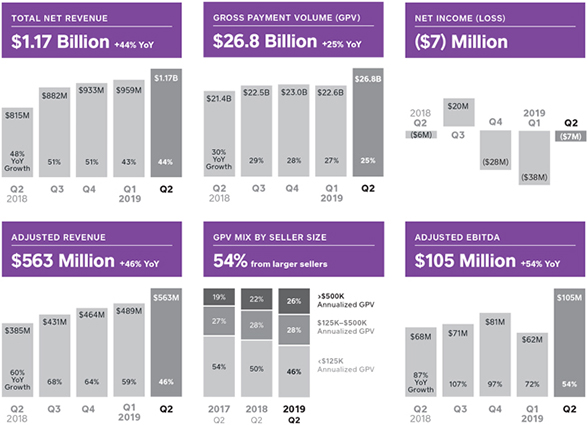
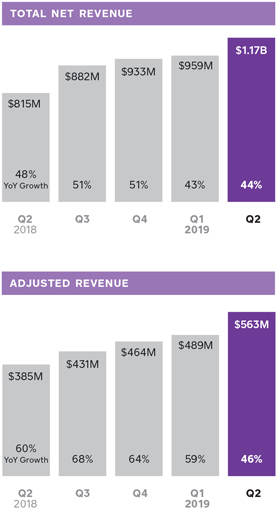
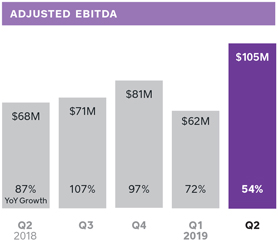
We continued to generate strong revenue growth at scale and are investing in our business to drive long-term growth. In the second quarter of 2019, total net revenue grew 44% year over year to $1.17 billion, and Adjusted Revenue grew 46% year over year to $563 million. Net loss was $7 million in the second quarter, compared to a net loss of $6 million in the second quarter of 2018. Excluding the loss of $5 million as a result of the mark-to-market valuation of our Eventbrite investment, net loss was $2 million. Adjusted EBITDA was $105 million in the second quarter of 2019, up 54% year over year.
Today we issued a press release with DoorDash announcing that we have entered into a definitive agreement in which DoorDash has agreed to acquire Caviar, our food ordering platform, for $410 million in a mix of cash and DoorDash preferred stock. This transaction allows us to increase our focus on and investment in our two large, growing ecosystems—one for businesses and one for individuals. It creates clarity in how we operate and a clearer purpose and alignment for our planning, investment, and work moving forward. Furthermore, DoorDash is already integrated with Square for Restaurants, which streamlines the acceptance of online and in-person orders for merchants, and in the second quarter Cash Boost partnered with DoorDash to provide instant rewards when customers use their Cash Card at DoorDash. We believe continuing this partnership provides valuable and strategic opportunities for Square.
Our seller and Cash App ecosystems have millions of engaged customers and have driven strong revenue growth. Our ecosystem of tools for sellers helps anyone start, run, and grow a business. Our ecosystem of tools for individuals is changing how people manage their money by providing easy ways to send, spend, and store funds. Cash App has reached significant scale, generating $135 million in revenue, excluding bitcoin, in the second quarter of 2019.
API stands for “application programming interface.” Developers use APIs to more easily share information and use functionality from another application.
1 The NPD Group, ”Delivering Digital Convenience,” 2019.
SELLER ECOSYSTEM
We launched Orders API so sellers can manage orders from all their channels within Square.
Sellers need many solutions to build a successful business, and more than 20% of our total GPV now comes from sellers connected to a third-party application. We have opened our platform to enable developers to integrate third-party products with Square so that: (1) sellers can select the solutions that are best for their business, and (2) sellers have a more comprehensive view of their data to effectively manage their business.
For example, businesses increasingly sell through multiple channels, which is why we built Orders API to allow external applications to create and process orders via Square’s platform. As a result, we can provide visibility to sellers on all their sales data whether transactions are placed through Square or a third-party solution. Developers use the Orders API to connect services to Square such as online ordering and logistics and fulfillment, which streamlines workflows and simplifies reporting.
In the second quarter, we launched Order Manager, which uses our Orders API to enable delivery app integrations with strategic partners. Square for Restaurants now integrates with more than 20 delivery platforms, including Caviar, DoorDash, and Postmates. Food and drink is an important vertical for Square, generating 26% of our second quarter GPV. The online food-ordering market in the U.S. generated approximately $27 billion in sales in 2018 and is expected to grow at a double-digit rate through 2020.¹ Postmates also integrates with Square Point of Sale and Square for Retail, providing more seller types with the ability to offer delivery to their customers.
These integrations further differentiate Square’s omnichannel offering: We are able to serve diverse seller verticals across in-person and online channels through deeply integrated first- and third-party products. Sellers can manage all orders from the point of sale, remove the counter clutter of “tablet farms,” and eliminate the manual aggregation of online and in-person orders. Square shares in the economics of orders placed through connected delivery apps, which drives additional revenue to Square.
Bobwhite Counter is a restaurant specializing in Virginia-style Southern cuisine. With three locations in Manhattan, Bobwhite relies on food delivery apps to provide additional revenue with limited incremental overhead. Using Order Manager, Bobwhite saves valuable time by managing orders from Caviar, Postmates, DoorDash, and Chowly—all from the point of sale.

| | |
Order Manager Order Manager integrates more than 20 delivery platforms with Square for Restaurants, allowing sellers to manage all orders from the point of sale. | |  |

SELLER HIGHLIGHT

Manual order entry is very unproductive, especially when the process is scattered across multiple devices. Consolidating four delivery services into one tablet experience has saved me 30 to 60 minutes per shift.”
Keedick Coulter
Bobwhite Lunch and Supper Counter
New York City
Bitcoin revenue was $125 million in the second quarter and contributed $2 million in gross profit.
CASH APP ECOSYSTEM
Our Cash App ecosystem has reached significant scale, generating $260 million in total net revenue in the second quarter of 2019. Excluding bitcoin, Cash App revenue was $135 million.
We evaluate the performance of Cash App based on the strength of our network, our customers’ engagement, and our monetization of the ecosystem.
Network:Driven by peer-to-peer (P2P) network effects and a fast, frictionless onboarding experience, we continued to efficiently grow our base of millions of customers. Cash App has been the number one free finance app in the U.S. App Store for the past two years, and is consistently a top 20 free app, demonstrating ongoing mainstream adoption.
Engagement: We have added several features that have increased daily utility and driven customer engagement. Customers have increasingly used Cash Card as a primary spending tool: In June, approximately 3.5 million customers used Cash Card, typically for everyday purchases at food and grocery, mainstream retailers, and gas and transportation. Cash Boost—a unique instant rewards program built into the debit card—has increased Cash Card adoption and driven Cash Card usage. Cash Boost also has demonstrated the ability to drive incremental revenue for merchants via customer acquisition, more frequent visits, and higher ticket sizes. These benefits are leading merchants such as DoorDash to partner with us on Boost programs.
Monetization:Cash App has reached meaningful scale, and today we generate revenue from Cash App through six different sources:
| | 4. | P2P transactions funded with a credit card |
| | 6. | Interest on customers’ stored balances |
In three years, total net revenue from Cash App increased from approximately $1 million in the second quarter of 2016 to $135 million, excluding bitcoin, in the second quarter of 2019.
| | |

| | Performance We evaluate the performance of Cash App based on its network, engagement, and monetization. |
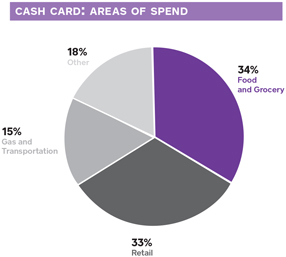
Cash Card areas of spend based on activity in the top 100 merchants during the second quarter of 2019.
A reconciliation of non-GAAP metrics used in this letter to their nearest GAAP equivalents is provided at the end of this letter.
A larger seller generates more than $125,000 in annualized GPV. Amid-market seller generates more than $500,000 in annualized GPV.
1. Represents growth in dollars of originations during the quarter.
Square Terminal commenced shipment in November 2018.
Financial
Discussion
REVENUE AND GROSS PROFIT
Total net revenue was $1.17 billion in the second quarter of 2019, up 44% year over year. Adjusted Revenue was $563 million in the second quarter of 2019, up 46% year over year. Gross profit was $466 million in the second quarter of 2019, up 48% year over year, and was 40% of total net revenue.
In the second quarter of 2019, Cash App revenue comprised $135 million in subscription and services-based and transaction-based revenue, and $125 million in bitcoin revenue. During the quarter, bitcoin revenue benefited from increased volume as a result of the increase in the price of bitcoin, and generated $2 million of gross profit.
In the second quarter of 2019, we processed $26.8 billion in GPV, up 25% year over year. In the second quarter, GPV from larger sellers grew 34% year over year and accounted for 54% of total GPV, up from 50% of total GPV in the second quarter of 2018. GPV from our largest sellers—mid-market sellers—grew 45% year over year and accounted for 26% of total GPV, up from 22% of total GPV in the second quarter of 2018. Transaction-based revenue was $776 million in the second quarter, up 24% year over year, and transaction-based gross profit was $285 million, up 24% year over year.
Subscription and services-based revenue was $251 million in the second quarter of 2019, up 87% year over year, and subscription and services-based gross profit was $191 million, up 102% year over year. Revenue growth was driven primarily by Cash App, Square Capital, Caviar, and Instant Deposit for sellers. In the second quarter of 2019, Square Capital facilitated approximately 78,000 loans totaling $528 million, up 36% year over year.¹ Cumulatively, Square Capital has facilitated approximately 800,000 loans totaling more than $5 billion since it launched in May 2014.
Hardware revenue in the second quarter of 2019 was $22 million, up 21% year over year, and hardware generated a gross loss of $11 million. Hardware revenue growth was driven primarily by Square Terminal and Square Reader for contactless and chip.
REVENUE FROM CASH APP
| | | | |
Subscription and services-based revenue and transaction-based revenue | | $ | 135M | |
Bitcoin revenue | | $ | 125M | |
Total net revenue from Cash App | | $ | 260M | |
Revenue from Cash App in the second quarter of 2019 was generated primarily by subscriptions and services. Cash App subscription and services-based revenue primarily comprised fees from Instant Deposit, interchange on Cash Card transactions, and, to a lesser extent, interest on customer funds. Cash App transaction-based revenue primarily comprised fees from business accounts and, to a lesser extent, peer-to-peer transactions funded with a credit card.
1. The acquisition of Weebly was completed in the second quarter of 2018 and thus contributed expenses for only part of the second quarter of 2018.
We offer the peer-to-peer service free to our Cash App customers for free, and we consider it to be a marketing tool to encourage the usage of Cash App.
OPERATING EXPENSES
Operating expenses were $467 million in the second quarter of 2019, up 47% year over year, and non-GAAP operating expenses were $364 million, up 45% year over year. In the second quarter, operating expenses were 40% of total net revenue on a GAAP basis and 31% of total net revenue on a non-GAAP basis.
| • | | Product development expenses were $174 million on a GAAP basis and $107 million on a non-GAAP basis in the second quarter of 2019, up 52% and 42% year over year, respectively. This increase was driven primarily by personnel costs related to our engineering, data science, and design teams, as well as Weebly.¹ |
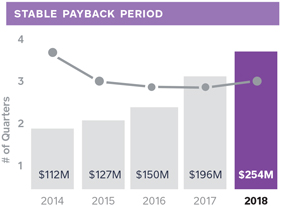
| • | | Sales and marketing expenses were $156 million on a GAAP basis and $147 million on a non-GAAP basis in the second quarter of 2019, up 59% and 61% year over year, respectively. Cash App marketing expenses were up 115% year over year, driven primarily by increases in peer-to-peer transactions and risk loss, and Cash Card issuances. Excluding Cash App marketing expenses, sales and marketing expenses were up 32% year over year. We continued to achieve a 3- to 4- quarter payback period for our seller ecosystem. Given this strong return on investment, we see further opportunities to increase our sales and marketing investments and drive long-term growth. In April, we launched an ecosystem marketing campaign to build broader awareness and understanding of our products and bring more sellers to Square. |
| • | | General and administrative expenses were $101 million on a GAAP basis and $76 million on a non-GAAP basis in the second quarter of 2019, up 21% and 20% year over year, respectively. The increase was due primarily to additions to finance, legal, and support personnel. |
| • | | Transaction, loan, and advance losses were $34 million in the second quarter of 2019, up 56% year over year. This increase is driven primarily by growth in seller GPV, Cash App volumes, and Square Capital loan volumes, including newer loan products for which we continue to train our risk models. Seller transaction losses continued to trend below 0.1% of GPV, underscoring continued discipline in risk management. For Square Capital, we continued to see an average loss rate of less than 4% for our core Flex Loan product. |
Sales and marketing shown above represents GAAP sales and marketing expenses, excluding Cash App marketing expenses.
Payback periodmeasures the effectiveness of sales and marketing spend. Payback period equals the number of quarters for a cohort’s cumulative Adjusted Revenue (excluding revenue from hardware, Gift Cards, and the acquisition of Zesty) to surpass our sales and marketing expense in the quarter in which we acquired the cohort. This measurement excludes both revenue and costs associated with Cash App. The 2018 payback period represents a trailing four-quarter average as of the third quarter of 2018.
EARNINGS
Net loss in the second quarter of 2019 was $7 million, compared to a net loss of $6 million in the second quarter of 2018. Net loss in the second quarter was $2 million when excluding the loss of $5 million as a result of the mark-to-market valuation of our Eventbrite investment. Net loss per share was $0.02 both on a basic and diluted basis for the second quarter of 2019, based on 423 million weighted-average basic and diluted shares. This compares to a net loss per share of $0.01 in the second quarter of 2018 on both a basic and diluted basis. Excluding the effect of Eventbrite, both basic and diluted net loss per share in the second quarter of 2019 would have been $0.00.
Adjusted EBITDA was $105 million in the second quarter of 2019, up 54% year over year. Adjusted Net Income Per Share (Adjusted EPS) was $0.21 based on 487 million weighted-average diluted shares for the second quarter of 2019, representing an $0.08 improvement year over year.
BALANCE SHEET/CASH FLOW
We ended the second quarter of 2019 with $1.7 billion in cash, cash equivalents, restricted cash, and investments in marketable fixed income securities, an increase of approximately $80 million compared to the end of the first quarter of 2019.
In the second quarter of 2019, Adjusted EBITDA and proceeds from the exercise of stock options contributed positively to our cash balance. This was partly offset by cash outflows due to the timing of the settlement of customers payable and settlements receivable, purchases of property and equipment and other long term investments, and payments for tax withholding related to vesting of restricted stock units.
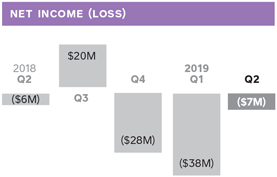
In August 2017, we invested $25 million for preferred shares of Eventbrite, which converted into common stock in connection with Eventbrite’s IPO in September 2018. We revalued this investment, which resulted in a gain of $37 million in the third quarter of 2018, and losses of $17 million, $14 million, and $5 million in the fourth quarter of 2018, first quarter of 2019, and second quarter of 2019, respectively.
Guidance
| | | | | | | | | | | | |
| | | | | Q3 2019 | | | | Current 2019 | | | | Previous 2019 |
| | | | | | |
Total net revenue | | | | $1.13B to $1.15B | | | | $4.41B to $4.47B | | | | $4.41B to $4.47B |
| | | | | | |
Adjusted Revenue | | | | $590M to $600M | | | | $2.25B to $2.28B | | | | $2.25B to $2.28B |
| | | | | | |
Year-over-year growth (midpoint) | | | | 38% | | | | 43% | | | | 43% |
| | | | | | |
Adjusted EBITDA | | | | $106M to $110M | | | | $405M to $415M | | | | $405M to $415M |
| | | | | | |
Year-over-year growth (midpoint) | | | | 52% | | | | 60% | | | | 60% |
| | | | | | |
Net income (loss) per share | | | | $(0.02) to $0.00 | | | | $(0.10) to $(0.06) | | | | $(0.09) to $(0.05) |
| | | | | | |
Adjusted EPS (diluted) | | | | $0.18 to $0.20 | | | | $0.74 to $0.78 | | | | $0.74 to $0.78 |
Our third quarter and full-year 2019 guidance does not include the impact from the sale of Caviar. We will update guidance after the completion of the transaction, which is subject to certain closing conditions, including regulatory approvals. We expect the transaction to close in 2019. This transaction will allow for increased focus on and investment in our seller and Cash App ecosystems.
We see significant market opportunity and compelling returns on our investments across both our seller and Cash App ecosystems. Our seller business continued to drive positive revenue retention and a 3- to 4- quarter payback period on sales and marketing investments. Cash App has been scaling its network with an efficient cost of acquisition, driving product velocity, and generating strong revenue growth. Similar to prior quarters, we intend to reinvest outperformance back into the business to capture the long-term opportunities ahead of us.
We are revising our net income (loss) per share guidance for full year 2019, primarily as a result of the second quarter mark-to-market valuation of our investment in Eventbrite. Please note that our guidance for net income (loss) per share for the full year and third quarter of 2019 reflects a share price of approximately $16 for Eventbrite, based on its closing price on June 30, 2019. In a given quarter, a change in Eventbrite’s share price of $3 results in a change to our net income (loss) per share of approximately $0.01. As a reminder, this does not affect our Adjusted EPS guidance.
We have not reconciled Adjusted EBITDA and Adjusted EPS guidance to their GAAP equivalents as a result of the uncertainty regarding, and the potential variability of, reconciling items such as share-based compensation expense and weighted-average fully diluted shares outstanding. Accordingly, a reconciliation of these non-GAAP guidance metrics to their corresponding GAAP equivalents is not available without unreasonable effort. However, it is important to note that material changes to these reconciling items could have a significant effect on our Adjusted EBITDA and Adjusted EPS guidance and future GAAP results. We have provided a reconciliation of other GAAP to non-GAAP metrics in tables at the end of this letter.
MEDIA CONTACT
press@squareup.com
INVESTOR RELATIONS CONTACT
ir@squareup.com
Earnings
Webcast
Square (NYSE:SQ) will host a conference call and earnings webcast at 2:00 p.m. Pacific time/5:00 p.m. Eastern time today, August 1, 2019, to discuss these financial results. The domestic dial-in for the call is (877) 683-2081. The Conference ID is 2884766. To listen to a live audio webcast, please visit Square’s Investor Relations website atsquare.com/investors. A replay will be available on the same website following the call.
We will release financial results for the third quarter of 2019 on November 6, 2019, after the market closes, and will also host a conference call and earnings webcast at 2:00 p.m. Pacific time/5:00 p.m. Eastern time on the same day to discuss those financial results.
| | | | |

| | 
| | |
Jack Dorsey | | Amrita Ahuja | | |
| CEO | | CFO | | |


This was the first year that the Indianapolis 500 had full card acceptance at every one of our 200+ concession locations. That’s because of Square, which has been fantastic. The platform has made it easy for us to get more sales data and more customer feedback than ever before. The sports industry runs off of good partnerships, and with this data we can provide more detailed reporting and deeper insights about what’s working and what isn’t, strengthening our relationships.”
Brad Lee
Director of Business Solutions,Indianapolis Motor Speedway
Indianapolis, Indiana
SAFE HARBOR STATEMENT
This letter contains forward-looking statements within the meaning of the Safe Harbor provisions of the Private Securities Litigation Reform Act of 1995. All statements other than statements of historical fact could be deemed forward-looking, including, but not limited to, statements regarding the future performance of Square, Inc. and its consolidated subsidiaries (the Company); the Company’s expected financial results for future periods; the Company’s intentions of reinvesting in its ecosystem and its expected benefits; future growth in the Company’s businesses and products and the Company’s ability to drive such growth; the Company’s expectations regarding scale, profitability, and the demand for or benefits from its products, product features, and services in the U.S. and in international markets; the Company’s expectations regarding Orders API and its ability to interoperate with third-party applications; the Company’s expectations regarding the Cash App ecosystem; statements regarding the proposed acquisition of Caviar by DoorDash (the Acquisition); and management’s statements related to business strategy, plans, and objectives for future operations. In some cases, forward-looking statements can be identified by terms such as “may,” “will,” “appears,” “should,” “expects,” “plans,” “anticipates,” “could,” “intends,” “target,” “projects,” “contemplates,” “believes,” “estimates,” “predicts,” “potential,” or “continue,” or the negative of these words or other similar terms or expressions that concern our expectations, strategy, plans, or intentions. Such statements are subject to a number of known and unknown risks, uncertainties, assumptions, and other factors that may cause the Company’s actual results, performance, or achievements to differ materially from results expressed or implied in this letter. Investors are cautioned not to place undue reliance on these statements and reported results should not be considered as an indication of future performance.
Risks that contribute to the uncertain nature of the forward-looking statements include, among others, the Company’s ability to deal with the substantial and increasingly intense competition in its industry; the Company’s ability to ensure the interoperability of its technology with that of third parties; changes to the rules and practices of payment card networks and acquiring processors; the impact of acquisitions or divestitures, strategic investments, or entries into new businesses; the effect of evolving regulations and oversight related to the Company’s provision of payments services and other financial services; the effect of management changes and business initiatives; adoption of the Company’s products and services in international markets; changes in political, business, and economic conditions; the possibility that the Acquisition will not close or that the closing may be delayed; the ability to realize the expected benefits from the transaction in the expected time period, or at all; as well as other risks listed or described from time to time in the Company’s filings with the Securities and Exchange Commission (the SEC), including the Company’s Quarterly Report on Form 10-Q for the fiscal quarter ended March 31, 2019, which is on file with the SEC and available on the investor relations page of the Company’s website. Additional information will also be set forth in the Company’s Quarterly Report on Form 10-Q for the fiscal quarter ended June 30, 2019. All forward-looking statements are based on information and estimates available to the Company at the time of this letter and are not guarantees of future performance. Except as required by law, the Company assumes no obligation to update any of the statements in this letter.
KEY OPERATING METRICS AND
NON-GAAP FINANCIAL MEASURES
To supplement our financial information presented in accordance with generally accepted accounting principles in the United States (GAAP), we consider certain operating and financial measures that are not prepared in accordance with GAAP, including Gross Payment Volume, Adjusted Revenue, Adjusted EBITDA, Adjusted EBITDA margin, Adjusted Net Income, Diluted Adjusted Net Income Per Share (Adjusted EPS), and non-GAAP operating expenses. We believe these metrics and measures are useful to facilitate period-to-period comparisons of our business and to facilitate comparisons of our performance to that of other payments solution providers.
We define Gross Payment Volume (GPV) as the total dollar amount of all card payments processed by sellers using Square, net of refunds. Additionally, GPV includes Cash App activity related to peer-to-peer payments sent from a credit card, and Business Accounts.
Adjusted Revenue is a non-GAAP financial measure that we define as our total net revenue less transaction-based costs and bitcoin costs, and we add back the impact of the acquired deferred revenue adjustment, which was written down to fair value in purchase accounting. We believe it is useful to subtract transaction-based costs and bitcoin costs from total net revenue to derive Adjusted Revenue as this is a primary metric used by management to measure our business performance, and it affords greater comparability to other payments solution providers. Substantially all of the transaction-based costs are interchange and assessment fees, processing fees, and bank settlement fees paid to third-party payment processors and financial institutions. While some payments solution providers present their revenue in a similar fashion to us, others present their revenue net of transaction-based costs because, unlike us, they pass through these costs directly to their sellers and are not deemed the principal in these arrangements. Under our standard pricing model, we do not pass through these costs directly to our sellers. We deduct bitcoin costs because we consider our role in the bitcoin transactions to be facilitating customer access to bitcoin. Since we only apply a small margin to the market cost of bitcoin when we sell bitcoin to customers, and we have no control over the cost of bitcoin in the market, which tends to be volatile, we believe deducting bitcoin costs is a better reflection of the economic benefits as well as the Company’s performance from the bitcoin transactions. We recognize acquired deferred revenue that was written down for purchase accounting since we believe that it is correlated with ordinary and ongoing operations of the acquired company and facilitates analysis of revenue growth and business trends. We define Adjusted Revenue from subscription and services as the total net subscription and services-based revenue adjusted to add back the impact of the write-down adjustment to acquired deferred revenue related to purchase accounting. We add back this deferred revenue that was written down since we believe it is correlated with ordinary and ongoing operations of the acquired company and facilitates analysis of revenue growth and business trends. Adjusted Revenue has limitations as a financial measure, should be considered as supplemental in nature, and is not meant as a substitute for the related financial information prepared in accordance with GAAP.
Adjusted EBITDA, Adjusted EBITDA margin, Adjusted Net Income, Diluted Adjusted Net Income Per Share (Adjusted EPS), and non-GAAP operating expenses are non-GAAP financial measures that represent our net income (loss) and net income (loss) per share, adjusted to eliminate the effect of share-based compensation expenses, amortization of intangible assets, amortization of debt discount and issuance costs in connection with our offering of convertible senior notes in the first quarter of 2017 and in the second quarter of 2018, the gain or loss on the disposal of property and equipment, gain or loss on revaluation of equity investment, gain or loss on debt extinguishment related to the conversion of senior notes and impairment of intangible assets, as applicable. We also exclude certain costs associated with acquisitions and other activities that are not normal recurring operating expenses, including amounts paid to redeem acquirees’ unvested stock-based compensation awards, and legal, accounting, and due diligence costs, and we add back the impact of the acquired deferred revenue and deferred cost adjustment, which was written down to fair value in purchase accounting. Additionally, for purposes of calculating diluted Adjusted EPS we
add back cash interest expense on convertible senior notes, as if converted at the beginning of the period, if the impact is dilutive, since we intend to settle future conversions of our convertible senior notes entirely in shares. In addition to the items above, Adjusted EBITDA and non-GAAP operating expenses are non-GAAP financial measures that also exclude depreciation, other cash interest income and expense, other income and expense, and provision or benefit from income taxes, as applicable. To calculate the diluted Adjusted EPS we adjust the weighted-average number of shares of common stock outstanding for the dilutive effect of all potential shares of common stock. In periods when we recorded an Adjusted Net Loss, the diluted Adjusted EPS is the same as basic Adjusted EPS because the effects of potentially dilutive items were anti-dilutive given the Adjusted Net Loss position. Adjusted EBITDA margin is calculated as Adjusted EBITDA divided by Adjusted Revenue.
We have included Adjusted EBITDA and Adjusted EPS because they are key measures used by our management to evaluate our operating performance, generate future operating plans, and make strategic decisions, including those relating to operating expenses and the allocation of internal resources. Accordingly, we believe that Adjusted EBITDA and Adjusted EPS provide useful information to investors and others in understanding and evaluating our operating results in the same manner as our management and board of directors. In addition, they provide useful measures for period-to-period comparisons of our business, as they remove the effect of certain non-cash items and certain variable charges. Adjusted EBITDA and Adjusted EPS have limitations as financial measures, should be considered as supplemental in nature, and are not meant as substitutes for the related financial information prepared in accordance with GAAP.
We believe that the aforementioned metrics provide useful information about our operating results, enhance the overall understanding of our past performance and future prospects, and provide useful measures for period-to-period comparisons of our business, as they remove the effect of certain variable amounts. Our management uses these measures to evaluate our operating performance, generate future operating plans, and make strategic decisions, including those relating to operating expenses and the allocation of internal resources.
These non-GAAP financial measures should not be considered in isolation from, or as a substitute for, financial information prepared in accordance with GAAP. These non-GAAP financial measures are not based on any standardized methodology prescribed by GAAP and are not necessarily comparable to similarly titled measures presented by other companies.
Consolidated Statements
of Operations
UNAUDITED
In thousands, except per share data
| | | | | | | | | | | | | | | | |
| | | THREE MONTHS ENDED | | | SIX MONTHS ENDED | |
| | | June 30, 2019 | | | June 30, 2018 | | | June 30, 2019 | | | June 30, 2018 | |
Revenue: | | | | | | | | | | | | | | | | |
Transaction-based revenue | | $ | 775,510 | | | $ | 625,228 | | | $ | 1,432,272 | | | $ | 1,148,265 | |
Subscription and services-based revenue | | | 251,383 | | | | 134,332 | | | | 470,240 | | | | 231,386 | |
Hardware revenue | | | 22,260 | | | | 18,362 | | | | 40,472 | | | | 32,779 | |
Bitcoin revenue | | | 125,085 | | | | 37,016 | | | | 190,613 | | | | 71,111 | |
| | | | | | | | | | | | | |
Total net revenue | | | 1,174,238 | | | | 814,938 | | | | 2,133,597 | | | | 1,483,541 | |
| | | | | | | | | | | | | |
Cost of revenue: | | | | | | | | | | | | | | | | |
Transaction-based costs | | | 490,349 | | | | 395,349 | | | | 899,418 | | | | 723,260 | |
Subscription and services-based costs | | | 60,119 | | | | 39,784 | | | | 120,642 | | | | 70,152 | |
Hardware costs | | | 33,268 | | | | 25,536 | | | | 60,209 | | | | 45,238 | |
Bitcoin costs | | | 122,938 | | | | 36,596 | | | | 187,634 | | | | 70,468 | |
Amortization of acquired technology | | | 1,719 | | | | 1,857 | | | | 3,095 | | | | 3,437 | |
| | | | | | | | | | | | | |
Total cost of revenue | | | 708,393 | | | | 499,122 | | | | 1,270,998 | | | | 912,555 | |
| | | | | | | | | | | | | |
Gross profit | | | 465,845 | | | | 315,816 | | | | 862,599 | | | | 570,986 | |
| | | | | | | | | | | | | |
Operating expenses: | | | | | | | | | | | | | | | | |
Product development | | | 174,201 | | | | 114,800 | | | | 328,551 | | | | 219,895 | |
Sales and marketing | | | 156,421 | | | | 98,243 | | | | 290,134 | | | | 175,509 | |
General and administrative | | | 100,508 | | | | 82,772 | | | | 202,106 | | | | 158,273 | |
Transaction, loan and advance losses | | | 34,264 | | | | 21,976 | | | | 62,105 | | | | 40,007 | |
Amortization of acquired customer assets | | | 1,294 | | | | 672 | | | | 2,588 | | | | 941 | |
| | | | | | | | | | | | | |
Total operating expenses | | | 466,688 | | | | 318,463 | | | | 885,484 | | | | 594,625 | |
| | | | | | | | | | | | | |
Operating loss | | | (843) | | | | (2,647) | | | | (22,885) | | | | (23,639) | |
| | | | | | | | | | | | | |
Interest expense, net | | | 5,143 | | | | 3,470 | | | | 9,824 | | | | 5,582 | |
Other expense (income), net | | | 1,230 | | | | (815) | | | | 12,529 | | | | (108) | |
| | | | | | | | | | | | | |
Loss before income tax | | | (7,216) | | | | (5,302) | | | | (45,238) | | | | (29,113) | |
| | | | | | | | | | | | | |
Provision for income taxes | | | (476) | | | | 604 | | | | (347) | | | | 779 | |
| | | | | | | | | | | | | |
Net loss | | $ | (6,740) | | | $ | (5,906) | | | $ | (44,891) | | | $ | (29,892) | |
| | | | | | | | | | | | | |
Net loss per share: | | | | | | | | | | | | | | | | |
Basic | | $ | (0.02) | | | $ | (0.01) | | | $ | (0.11) | | | $ | (0.07) | |
| | | | | | | | | | | | | |
Diluted | | $ | (0.02) | | | $ | (0.01) | | | $ | (0.11) | | | $ | (0.07) | |
| | | | | | | | | | | | | |
Weighted-average shares used to compute net loss per share | | | | | | | | | | | | | | | | |
Basic | | | 423,305 | | | | 403,301 | | | | 421,297 | | | | 399,624 | |
| | | | | | | | | | | | | |
Diluted | | | 423,305 | | | | 403,301 | | | | 421,297 | | | | 399,624 | |
| | | | | | | | | | | | | |
Consolidated Balance Sheets
UNAUDITED
In thousands, except share and per share data
| | | | | | | | |
| Assets | | June 30, 2019 | | | Dec 31, 2018 | |
Current assets: | | | | | | | | |
Cash and cash equivalents | | $ | 617,282 | | | $ | 583,173 | |
Short-term investments | | | 572,206 | | | | 540,991 | |
Restricted cash | | | 31,148 | | | | 33,838 | |
Settlements receivable | | | 1,506,194 | | | | 364,946 | |
Customer funds | | | 484,945 | | | | 334,017 | |
Loans held for sale | | | 136,511 | | | | 89,974 | |
Other current assets | | | 180,360 | | | | 164,966 | |
| | | | | |
Total current assets | | | 3,528,646 | | | | 2,111,905 | |
| | | | | |
Property and equipment, net | | | 130,747 | | | | 142,402 | |
Goodwill | | | 270,161 | | | | 261,705 | |
Acquired intangible assets, net | | | 84,216 | | | | 77,102 | |
Long-term investments | | | 460,827 | | | | 464,680 | |
Restricted cash | | | 14,433 | | | | 15,836 | |
Built-to-suit lease asset | | | — | | | | 149,000 | |
Operating leaseright-of-use assets | | | 107,809 | | | | — | |
Othernon-current assets | | | 57,167 | | | | 58,393 | |
| | | | | |
Total assets | | $ | 4,654,006 | | | $ | 3,281,023 | |
| | | | | |
| | |
Liabilities and Stockholders’ Equity | | | | | | | | |
Current liabilities: | | | | | | | | |
Customers payable | | | 1,802,128 | | | | 749,215 | |
Settlements payable | | | 290,652 | | | | 54,137 | |
Accrued transaction losses | | | 39,630 | | | | 33,682 | |
Accrued expenses | | | 106,351 | | | | 82,354 | |
Operating lease liabilities, current | | | 24,955 | | | | — | |
Other current liabilities | | | 111,878 | | | | 99,153 | |
| | | | | |
Total current liabilities | | | 2,375,594 | | | | 1,018,541 | |
| | | | | |
Long-term debt, net of current portion | | | 919,026 | | | | 899,695 | |
Built-to-suit lease liability | | | — | | | | 149,000 | |
Operating lease liabilities,non-current | | | 107,265 | | | | — | |
Othernon-current liabilities | | | 67,649 | | | | 93,286 | |
| | | | | |
Total liabilities | | | 3,469,534 | | | | 2,160,522 | |
Stockholders’ equity: | | | | | | | | |
Preferred stock, $0.0000001 par value: 100,000,000 shares authorized at June 30, 2019, and December 31, 2018. None issued and outstanding at June 30, 2019, and December 31, 2018. | | | — | | | | — | |
| | |
Class A common stock, $0.0000001 par value: 1,000,000,000 shares authorized at June 30, 2019, and December 31, 2018; 341,709,651 and 323,546,864 issued and outstanding at June 30, 2019, and December 31, 2018, respectively. | | | — | | | | — | |
| | |
Class B common stock, $0.0000001 par value: 500,000,000 shares authorized at June 30, 2019, and December 31, 2018; 84,508,342 and 93,501,142 issued and outstanding at June 30, 2019, and December 31, 2018, respectively. | | | — | | | | — | |
| | |
Additionalpaid-in capital | | | 2,116,063 | | | | 2,012,328 | |
Accumulated other comprehensive loss | | | (926 | ) | | | (6,053 | ) |
Accumulated deficit | | | (930,665 | ) | | | (885,774 | ) |
| | | | | |
Total stockholders’ equity | | | 1,184,472 | | | | 1,120,501 | |
| | | | | |
Total liabilities and stockholders’ equity | | $ | 4,654,006 | | | $ | 3,281,023 | |
| | | | | |
Consolidated Statements of Cash Flows
UNAUDITED
In thousands
| | | | | | | | |
| | | SIX MONTHS ENDED | |
| Cash Flows from Operating Activities | | June 30, 2019 | | | June 30, 2018 | |
Net loss | | $ | (44,891 | ) | | $ | (29,892 | ) |
Adjustments to reconcile net loss to net cash provided by operating activities: | | | | | | | | |
Depreciation and amortization | | | 37,754 | | | | 22,488 | |
Non-cash interest and other expense | | | 16,802 | | | | 11,855 | |
Share-based compensation | | | 140,554 | | | | 98,943 | |
Replacement stock awards in connection with acquisition | | | — | | | | 757 | |
Loss on revaluation of equity investment | | | 18,929 | | | | — | |
Amortization of operating leaseright-of-use assets and accretion of operating lease | | | 14,354 | | | | — | |
liabilities | | | | | | | | |
Recovery of common stock in connection with indemnification | | | (789 | ) | | | (2,745 | ) |
settlement agreement | | | | | | | | |
Transaction, loan and advance losses | | | 62,105 | | | | 40,007 | |
Change in deferred income taxes | | | (2,229 | ) | | | (688 | ) |
Changes in operating assets and liabilities: | | | | | | | | |
Settlements receivable | | | (1,148,376 | ) | | | (191,987 | ) |
Customer funds | | | (125,042 | ) | | | (105,813 | ) |
Purchase of loans held for sale | | | (1,035,500 | ) | | | (734,251 | ) |
Sales and principal payments of loans held for sale | | | 975,823 | | | | 716,950 | |
Customers payable | | | 1,052,867 | | | | 267,746 | |
Settlements payable | | | 236,515 | | | | 25,828 | |
Charge-offs to accrued transaction losses | | | (36,050 | ) | | | (26,030 | ) |
Other assets and liabilities | | | 3,010 | | | | (22,136 | ) |
| | | | | |
Net cash provided by operating activities | | | 165,836 | | | | 71,032 | |
| | | | | |
| | |
| Cash Flows from Investing Activities | | | | | | | | |
Purchase of marketable debt securities | | | (354,908 | ) | | | (165,024 | ) |
Proceeds from maturities of marketable debt securities | | | 220,229 | | | | 79,273 | |
Proceeds from sale of marketable debt securities | | | 116,522 | | | | 56,259 | |
Purchase of marketable debt securities from customer funds | | | (88,064 | ) | | | — | |
Proceeds from maturities of marketable debt securities from | | | 63,000 | | | | — | |
customer funds | | | | | | | | |
Purchase of property and equipment | | | (30,162 | ) | | | (23,143 | ) |
Payments for other investments | | | (2,000 | ) | | | — | |
Purchase of intangible assets | | | — | | | | (1,584 | ) |
Business combinations, net of cash acquired | | | (20,372 | ) | | | (111,828 | ) |
| | | | | |
Net cash used in investing activities | | | (95,755 | ) | | | (166,047 | ) |
| | | | | |
| | |
| Cash Flows from Financing Activities | | | | | | | | |
Proceeds from issuance of convertible senior notes, net | | | — | | | | 855,663 | |
Purchase of convertible senior note hedges | | | — | | | | (172,586 | ) |
Proceeds from issuance of warrants | | | — | | | | 112,125 | |
Payment of deferred purchase consideration | | | (95 | ) | | | (640 | ) |
Principal payments on finance lease obligation | | | (2,568 | ) | | | (1,375 | ) |
Proceeds from the exercise of stock options, net | | | 66,921 | | | | 67,199 | |
Payments for tax withholding related to vesting of restricted stock units | | | (106,663 | ) | | | (68,575 | ) |
| | | | | |
Net cash provided by (used in) financing activities | | | (42,405 | ) | | | 791,811 | |
| | | | | |
Effect of foreign exchange rate on cash and cash equivalents | | | 2,340 | | | | (3,505 | |
| | | | | |
Net increase in cash, cash equivalents and restricted cash | | | 30,016 | | | | 693,291 | |
Cash, cash equivalents and restricted cash, beginning of period | | | 632,847 | | | | 735,081 | |
| | | | | |
Cash, cash equivalents and restricted cash, end of period | | $ | 662,863 | | | $ | 1,428,372 | |
| | | | | |
Key Operating Metrics and
Non-GAAP Financial Measures
UNAUDITED
In thousands, except GPV and per share data
| | | | | | | | | | | | | | | | |
| | | THREE MONTHS ENDED | | | SIX MONTHS ENDED | |
| | | June 30, 2019 | | | June 30, 2018 | | | June 30, 2019 | | | June 30, 2018 | |
| | | | |
Gross Payment Volume (GPV) (in millions) | | $ | 26,785 | | | $ | 21,372 | | | $ | 49,371 | | | $ | 39,198 | |
Adjusted Revenue | | $ | 562,800 | | | $ | 385,433 | | | $ | 1,051,850 | | | $ | 692,253 | |
Adjusted EBITDA | | $ | 105,304 | | | $ | 68,322 | | | $ | 167,001 | | | $ | 104,216 | |
Adjusted Net Income Per Share: | | | | | | | | | | | | | | | | |
Basic | | $ | 0.23 | | | $ | 0.15 | | | $ | 0.36 | | | $ | 0.23 | |
Diluted | | $ | 0.21 | | | $ | 0.13 | | | $ | 0.32 | | | $ | 0.20 | |
|
Adjusted Revenue UNAUDITED In thousands | |
| | | THREE MONTHS ENDED | | | SIX MONTHS ENDED | |
| | | June 30, 2019 | | | June 30, 2018 | | | June 30, 2019 | | | June 30, 2018 | |
| | | | |
Total net revenue | | $ | 1,174,238 | | | $ | 814,938 | | | $ | 2,133,597 | | | $ | 1,483,541 | |
Less: transaction-based costs | | | 490,349 | | | | 395,349 | | | | 899,418 | | | | 723,260 | |
Less: bitcoin costs | | | 122,938 | | | | 36,596 | | | | 187,634 | | | | 70,468 | |
Add: deferred revenue adjustment related to purchase accounting | | | 1,849 | | | | 2,440 | | | | 5,305 | | | | 2,440 | |
| | | | | | | | | | | | | |
Adjusted Revenue | | $ | 562,800 | | | $ | 385,433 | | | $ | 1,051,850 | | | $ | 692,253 | |
| | | | | | | | | | | | | |
Adjusted EBITDA
UNAUDITED
In thousands
| | | | | | | | | | | | | | | | |
| | | THREE MONTHS ENDED | | | SIX MONTHS ENDED | |
| | | June 30, 2019 | | | June 30, 2018 | | | June 30, 2019 | | | June 30, 2018 | |
| | | | |
Net loss | | $ | (6,740) | | | $ | (5,906) | | | | (44,891) | | | | (29,892) | |
Share-based compensation expense | | | 79,466 | | | | 52,119 | | | | 140,554 | | | | 98,943 | |
Depreciation and amortization | | | 18,783 | | | | 12,328 | | | | 37,754 | | | | 22,488 | |
Interest expense, net | | | 5,143 | | | | 3,470 | | | | 9,824 | | | | 5,582 | |
Other expense (income), net | | | 1,230 | | | | (815) | | | | 12,529 | | | | (108) | |
Provision for income taxes | | | (476) | | | | 604 | | | | (347) | | | | 779 | |
Loss (gain) on disposal of property and equipment | | | 281 | | | | 73 | | | | 300 | | | | (25) | |
Acquisition-related and other costs | | | 6,133 | | | | 4,363 | | | | 6,915 | | | | 4,363 | |
Acquired deferred revenue adjustment | | | 1,849 | | | | 2,440 | | | | 5,305 | | | | 2,440 | |
Acquired deferred costs adjustment | | | (365) | | | | (354) | | | | (942) | | | | (354) | |
| | | | | | | | | | | | | |
Adjusted EBITDA | | $ | 105,304 | | | $ | 68,322 | | | | 167,001 | | | | 104,216 | |
| | | | | | | | | | | | | |
|
Adjusted Net Income and Adjusted EPS UNAUDITED In thousands, except per share data | |
| | | THREE MONTHS ENDED | | | SIX MONTHS ENDED | |
| | | June 30, 2019 | | | June 30, 2018 | | | June 30, 2019 | | | June 30, 2018 | |
| | | | |
Net loss | | $ | (6,740) | | | $ | (5,906) | | | $ | (44,891) | | | $ | (29,892) | |
Share-based compensation expense | | | 79,466 | | | | 52,119 | | | | 140,554 | | | | 98,943 | |
Amortization of intangible assets | | | 3,958 | | | | 2,816 | | | | 7,445 | | | | 4,691 | |
Amortization of debt discount and issuance costs | | | 9,725 | | | | 6,830 | | | | 19,333 | | | | 11,223 | |
Loss on revaluation of equity investment | | | 4,842 | | | | — | | | | 18,929 | | | | — | |
Loss (gain) on disposal of property and equipment | | | 281 | | | | 73 | | | | 300 | | | | (25) | |
Acquisition-related and other costs | | | 6,133 | | | | 4,363 | | | | 6,915 | | | | 4,363 | |
Acquired deferred revenue adjustment | | | 1,849 | | | | 2,440 | | | | 5,305 | | | | 2,440 | |
Acquired deferred costs adjustment | | | (365) | | | | (354) | | | | (942) | | | | (354) | |
| | | | | | | | | | | | | |
Adjusted Net Income - basic | | $ | 99,149 | | | $ | 62,381 | | | $ | 152,948 | | | $ | 91,389 | |
| | | | | | | | | | | | | |
Cash interest expense on convertible senior notes | | $ | 1,277 | | | | — | | | $ | 2,554 | | | | — | |
| | | | | | | | | | | | | |
Adjusted Net Income - diluted | | $ | 100,426 | | | | 62,381 | | | $ | 155,502 | | | $ | 91,389 | |
| | | | | | | | | | | | | |
Adjusted Net Income Per Share: | | | | | | | | | | | | | | | | |
Basic | | $ | 0.23 | | | $ | 0.15 | | | $ | 0.36 | | | $ | 0.23 | |
| | | | | | | | | | | | | |
Diluted | | $ | 0.21 | | | $ | 0.13 | | | $ | 0.32 | | | $ | 0.20 | |
| | | | | | | | | | | | | |
Weighted-average shares used to compute | | | | | | | | | | | | | | | | |
Adjusted Net Income Per Share: | | | | | | | | | | | | | | | | |
Basic | | | 423,305 | | | | 403,301 | | | | 421,297 | | | | 399,624 | |
| | | | | | | | | | | | | |
Diluted | | | 486,532 | | | | 470,022 | | | | 486,794 | | | | 465,892 | |
| | | | | | | | | | | | | |
Adjusted Revenue
Guidance Reconciliation
UNAUDITED
In thousands
| | | | | | | | |
| | | THREE MONTHS ENDED | | | YEAR ENDED | |
| | | Sept 30, 2019 | | | Dec 31, 2019 | |
| | |
Total net revenue | | $ | 1,130,000–1,150,000 | | | $ | 4,410,000–4,470,000 | |
| Less: Transaction-based costs, bitcoin costs, deferred revenue adjustment related to purchase accounting | | $ | 540,000–550,000 | | | $ | 2,160,000–2,190,000 | |
| | | | | |
Adjusted Revenue | | $ | 590,000–600,000 | | | $ | 2,250,000–2,280,000 | |
| | | | | |
Non-GAAP Operating Expenses
UNAUDITED
In thousands
| | | | | | | | | | | | | | | | |
| | | THREE MONTHS ENDED | | | SIX MONTHS ENDED | |
| | | June 30, 2019 | | | June 30, 2018 | | | June 30, 2019 | | | June 30, 2018 | |
| | | | |
Operating expenses | | $ | (466,688) | | | $ | (318,463) | | | $ | (885,484) | | | $ | (594,625) | |
Share-based compensation | | | 79,437 | | | | 52,089 | | | | 140,504 | | | | 98,882 | |
Depreciation and amortization | | | 16,873 | | | | 10,242 | | | | 34,109 | | | | 18,822 | |
Loss (gain) on disposal of property and equipment | | | 281 | | | | 73 | | | | 300 | | | | (25) | |
Acquisition-related and other costs | | | 6,133 | | | | 4,363 | | | | 6,915 | | | | 4,363 | |
| | | | | | | | | | | | | |
Non-GAAP operating expenses | | $ | (363,964) | | | $ | (251,696) | | | $ | (703,656) | | | $ | (472,583) | |
| | | | | | | | | | | | | |
| | | | |
Product development | | $ | (174,201) | | | $ | (114,800) | | | $ | (328,551) | | | $ | (219,895) | |
Share-based compensation | | | 56,144 | | | | 33,806 | | | | 98,793 | | | | 64,288 | |
Depreciation and amortization | | | 11,478 | | | | 5,974 | | | | 23,411 | | | | 11,447 | |
Gain on disposal of property and equipment | | | — | | | | — | | | | (71) | | | | — | |
| | | | | | | | | | | | | |
Non-GAAP product development | | $ | (106,579) | | | $ | (75,020) | | | $ | (206,418) | | | $ | (144,160) | |
| | | | | | | | | | | | | |
| | | | |
Sales and marketing | | $ | (156,421) | | | $ | (98,243) | | | $ | (290,134) | | | $ | (175,509) | |
Share-based compensation | | | 7,833 | | | | 5,634 | | | | 14,035 | | | | 10,595 | |
Depreciation and amortization | | | 1,085 | | | | 952 | | | | 2,163 | | | | 1,561 | |
Loss on disposal of property and equipment | | | 194 | | | | 76 | | | | 345 | | | | 80 | |
| | | | | | | | | | | | | |
Non-GAAP sales and marketing | | $ | (147,309) | | | $ | (91,581) | | | $ | (273,591) | | | $ | (163,273) | |
| | | | | | | | | | | | | |
| | | | |
General and administrative | | $ | (100,508) | | | $ | (82,772) | | | $ | (202,106) | | | $ | (158,273) | |
Share-based compensation | | | 15,460 | | | | 12,649 | | | | 27,676 | | | | 23,999 | |
Depreciation and amortization | | | 3,016 | | | | 2,644 | | | | 5,947 | | | | 4,873 | |
Loss (gain) on disposal of property and equipment | | | 87 | | | | (3) | | | | 26 | | | | (105) | |
Acquisition-related and other costs | | | 6,133 | | | | 4,363 | | | | 6,915 | | | | 4,363 | |
| | | | | | | | | | | | | |
Non-GAAP general and administrative | | $ | (75,812) | | | $ | (63,119) | | | $ | (161,542) | | | $ | (125,143) | |
| | | | | | | | | | | | | |
|
Depreciation and Amortization by Function UNAUDITED In thousands | |
| | | THREE MONTHS ENDED | | | SIX MONTHS ENDED | |
| | | June 30, 2019 | | | June 30, 2018 | | | June 30, 2019 | | | June 30, 2018 | |
| | | | |
Cost of revenue | | $ | 1,910 | | | $ | 2,086 | | | $ | 3,645 | | | $ | 3,666 | |
Product Development | | | 11,478 | | | | 5,974 | | | | 23,411 | | | | 11,447 | |
Sales and Marketing | | | 1,085 | | | | 952 | | | | 2,163 | | | | 1,561 | |
General and Administrative | | | 3,016 | | | | 2,644 | | | | 5,947 | | | | 4,873 | |
Amortization of acquired customer assets | | | 1,294 | | | | 672 | | | | 2,588 | | | | 941 | |
| | | | | | | | | | | | | |
Total depreciation and amortization | | $ | 18,783 | | | $ | 12,328 | | | $ | 37,754 | | | $ | 22,488 | |
| | | | | | | | | | | | | |


