Exhibit 99.1

Highlights
| | | | |
 | |  | |  |
| | |
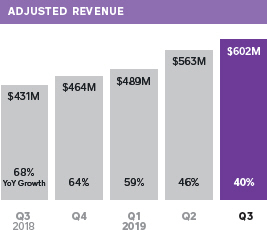
| We continued to drive significant growth at scale. In the third quarter of 2019, total net revenue and Adjusted Revenue grew 44% and 40% year over year, respectively. Excluding Caviar, total net revenue and Adjusted Revenue grew 45% and 43% year over year, respectively. | | Our Seller ecosystem has achieved strong profitability with an expected Adjusted EBITDA margin of nearly 30% for full year 2019. Given this profitability and our3- to4- quarter payback period, we are increasing our investment ingo-to-market initiatives to drive continued growth. | | Cash App’s ecosystem of differentiated products allows customers to easily send, spend, store, and now invest money. We are launching the ability for customers to buy fractional shares of stocks, transforming equity investing by lowering the barrier to entry. In the third quarter of 2019, total net revenue for Cash App was $307 million. Excluding bitcoin, Cash App revenue was $159 million, up 115% year over year. |
THIRD QUARTER FINANCIAL METRICS

In August 2017, we invested $25 million for preferred shares of Eventbrite, which converted into common stock in connection with Eventbrite’s IPO in September 2018. We revalued this investment, which resulted in gains of $2 million and $37 million in the third quarter of 2019 and third quarter of 2018, respectively. We will continue to carry it at fair market value, with changes being recorded each quarter in other income or expense.
A reconciliation ofnon-GAAP financial measures used in this letter to their nearest GAAP equivalents is provided at the end of this letter. Adjusted Revenue is total net revenue less transaction-based costs and bitcoin costs, and excludes the effect of deferred revenue adjustment related to purchase accounting.
ON THE COVER
The Ogden Raptors use
Square Point of Sale,
Square Online Store,
Square Photo Studio,
Order Manager, Square
Payroll, and our Square
Stand, Register, and
Terminal hardware.
November 6, 2019

To Our Shareholders
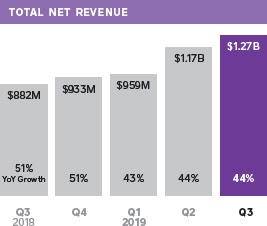
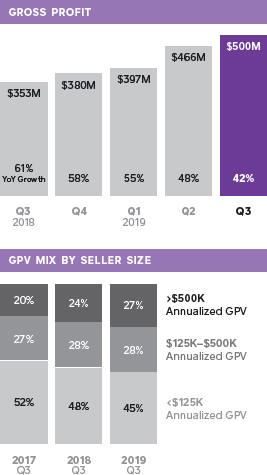
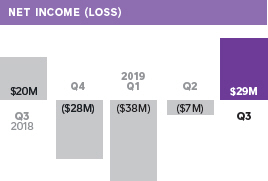
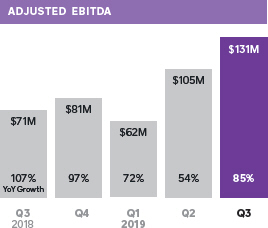
We continued to generate strong revenue growth at scale and are investing in our business to drive long-term growth. In the third quarter of 2019, total net revenue grew 44% year over year to $1.27 billion, and Adjusted Revenue grew 40% year over year to $602 million. Gross profit grew 42% year over year to $500 million. Net income was $29 million in the third quarter of 2019, compared to net income of $20 million in the third quarter of 2018. Excluding the impact of themark-to-market valuation of our Eventbrite investment, net income was $27 million, compared to a net loss of $17 million in the third quarter of 2018. Adjusted EBITDA was $131 million in the third quarter of 2019, up 85% year over year.
Caviar Transaction
We completed the sale of Caviar on October 31. Excluding Caviar, total net revenue grew 45% year over year and Adjusted Revenue grew 43% year over year in the third quarter of 2019. Excluding Caviar from the first three quarters of 2019, Square’s year-over-year growth rate of total net revenue and Adjusted Revenue would have improved by approximately 1% and 2%, respectively, and Adjusted EBITDA margins by 2.1%.
1. Total net revenue generated by our Seller ecosystem excludes revenue from Cash App and Caviar. For a definition of Cash App revenue, refer to the sidebar on page 8.
Payback periodmeasures the effectiveness of sales and marketing spend. Payback period equals the number of quarters for a cohort’s cumulative transaction-based gross profit and subscription and services-based revenue to surpass our sales and marketing expense in the quarter in which we acquired the cohort. This measurement excludes both revenue and costs associated with Cash App. We evaluate payback on a trailing four-quarter average.
2. Based on a Square survey conducted in April to May of 2018.
SELLER ECOSYSTEM
Our Seller ecosystem has achieved strong profitability with an expected Adjusted EBITDA margin of nearly 30% for full year 2019. Given this profitability and our3- to4- quarter payback period, we are increasing our investment ingo-to-market initiatives to drive continued growth.
Strong and Profitable Business Model
In the third quarter of 2019, our Seller ecosystem generated $918 million of total net revenue1 and $364 million of gross profit, which increased 27% and 26% year over year, respectively. We have also maintained strong cohort economics with positive revenue retention, which has enabled us to drive toward an expected Adjusted EBITDA margin of nearly 30% for full year 2019. We have achieved these results while scaling both our Seller and Cash App ecosystems across new products and new markets, demonstrating the strength of our business model. Given this profitability, the significant market opportunity, and our efficient payback period of 3 to 4 quarters, we are increasing our investment ingo-to-market initiatives to drive continued growth with attractive returns, some of which are outlined below.
Marketing
Today, we have a broad portfolio of products that can serve a wide range of business types and sizes. However, while nearly 80% of merchants (not Square sellers) are aware of Square, only 9% know our products well.2 We are therefore investing in marketing campaigns to increase awareness that, in addition to payments, we offer software to run an entire business. After our awareness campaign in April reached an estimated seven million businesses, we saw increases across key indicators including awareness, web traffic, and revenue contribution from new seller cohorts. We have seen that awareness marketing has the ability to efficiently scale our performance marketing.
Hardware
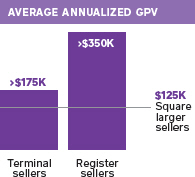
Hardware continues to be a differentiator for us. Our newest solutions, Square Terminal and Square Register, have attracted both new sellers and larger sellers: Over 30% of Square Terminal and Square Register sellers are new to Square, and the average annualized GPV of Square Terminal and Square Register sellers are over $175,000 and $350,000, respectively. In the U.S., we lowered the pricing of Square Register and Square Terminal, and since the change, weekly unit sales of Square Register have increased by more than 30%, and there has been a similar uplift for Square Terminal.
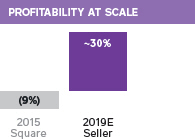
At the time of our IPO (initial public offering) in 2015, our Seller ecosystem generated nearly all of Square’s revenue and expenses. We expect our Seller ecosystem to achieve anAdjusted EBITDA margin of nearly 30% for full year 2019.
| | |
 | | Awareness marketing is designed to drive a shift in perception by increasing customers’ knowledge of your products and services. |
| |
 | | Performance marketing is designed to drive a specific action, such as account sign up or an app download. |
Dip payments: EMV (Europay, Mastercard, Visa)
chip cards
Tap payments: NFC
(near field communication), such as Apple Pay
International
We are bringing more products to our markets outside the U.S. This quarter we launched Square Terminal in Australia, Canada, and the United Kingdom. There is strong product-market fit for Square Terminal in these regions because it provides a portable,all-in-one payments solution for dip and tap payments (which, unlike in the U.S., have been prevalent for years). In the third quarter, sales of Square Terminal outside the U.S. represented more thanone-third of sales even though these are much smaller markets. Furthermore, PIN is the dominant form of authentication in these markets, and buyers can conduct the entire checkout process on Square Terminal without having to be at the checkout counter. For example, in many markets outside the U.S., tableside payments in restaurants are both common and expected by buyers. Additionally, we launched Square Loyalty in Canada and Australia as it provides sellers with aneasy-to-use tool to attract and retain customers.
Omnichannel Use Cases
Our elegant hardware, developer platform, and omnichannel capabilities enable sellers to create differentiated customer experiences with comprehensive reporting and customer insights. This has uniquely positioned us to serve the stadiums of teams such as the World Series Champion Washington Nationals and Ogden Raptors. The Ogden Raptors are a minor league baseball team based in Utah that began using Square to eliminate the need for customers to carry cash, to reduce lines at concession and merchandise stands, and to provide their fans with a better overall experience. Fans can even order right from their seats: They use their phone to select food from the Raptors website and receive a notification when the order is ready to be picked up—no waiting in lines and missing the game. The Ogden Raptors use Square Point of Sale, Square Online Store, Square Photo Studio, Order Manager, Square Payroll, and our Square Stand, Register, and Terminal hardware.

SELLER HIGHLIGHT

Half the time fans wouldn’t order things because they had to stand in the ATM line and then stand in the concession line. Getting things put together with Square was quite simple. We made a website so fans can order right from their seats. Anything that makes it easier for the fans is good for the park. And with Square, we’re tracking inventory, so I can better predict what we need for future games.”
Dave Baggott
Owner/President,Ogden Raptors
Ogden, UT
1. National Bureau of Economic Research. “Household Wealth Trends in the United States, 1962 to 2016: Has Middle Class Wealth Recovered?” November 2017.
2. Trends based on the 30 days following the launch of the redesigned customer interface.
CASH APP ECOSYSTEM
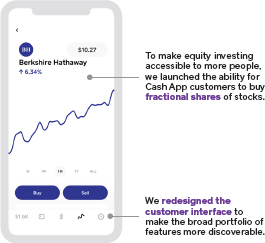
Cash App’s ecosystem of differentiated products allows customers to easily send, spend, store, and now invest money. We are launching the ability for customers to buy fractional shares of stocks, transforming equity investing by lowering the barrier to entry.
Expanding Access to Stock Investing
Approximately half of U.S. households do not own stocks,1 demonstrating an opportunity to provide more individuals with an accessible way to invest in the stock market. With Cash App, we are transforming equity investing by lowering the barrier to entry: Customers can buy fractional shares of stocks for as little as $1.00, with no commission fees. Additionally, after selling a stock, customers have immediate access to their funds, eliminating the uncertainty of when funds will be available for other spending. We will continue to roll out this investing product over the coming weeks.
Improving Product Discovery
In September, we redesigned Cash App’s customer interface to make the broad portfolio of products more discoverable. This improved layout has driven increased product adoption of Bitcoin and Cash Card: First-time bitcoin buyers have approximately doubled and Cash Card orders have seen a meaningful uplift.2
Innovating Boost
Boost continued to be a powerful and differentiated tool to drive Cash Card activations and engagement. We have launched new Boost functionality for Cash Card customers: Location-based Boosts and Boosts that are enabled by customers meeting specific requirements (such as a certain number of Cash Card transactions). These new, targeted features make Boost more compelling for both customers and potential Boost partners.
Rapidly Growing Monetization
In the third quarter of 2019, total net revenue for Cash App was $307 million and gross profit was $123 million. Excluding bitcoin, Cash App revenue was $159 million and gross profit was $121 million, growing 115% and 125% year over year, respectively. With Cash App, we have built an increasingly engaging product set and a strong business model with diverse revenue streams. Cash App has efficiently acquired new customers with a low and stable cost of acquisition, retained the majority of its monthly active customers, and efficiently cross-sold to increase revenue per customer. This model has driven strong cohort economics: Since 2015, Cash App has achieved positive revenue retention on a year-over-year basis for each cohort of its monthly active customers. Importantly, as we have expanded the ecosystem, we have improved Cash App’s margins each year since we began monetizing it in 2017.
| | |

In the third quarter of 2019, Cash App revenue (excluding bitcoin) was $159 million, up 115% year over year. | | |
| |

Cash App achieved positive year-over-year revenue retention for each of its monthly customer cohorts since 2015. | | |
A reconciliation ofnon-GAAP metrics used in this letter to their nearest GAAP equivalents is provided at the end of this letter.
A larger seller generates more than $125,000 in annualized GPV. Amid-market seller generates more than $500,000 in annualized GPV.
1. The following products were already priced at 2.6% + 10¢ forin-person payments: Square for Restaurants, Square Appointments, Square Register, Square Terminal, and Reader SDK.
2. Represents growth in dollars of originations during the quarter.
Financial
Discussion
REVENUE AND GROSS PROFIT
Total net revenue was $1.27 billion in the third quarter of 2019, up 44% year over year. Adjusted Revenue was $602 million, up 40% year over year. Gross profit was $500 million, up 42% year over year, and was 39% of total net revenue.
In the third quarter of 2019, we processed $28.2 billion in GPV, up 25% year over year. GPV from larger sellers grew 34% year over year and accounted for 55% of total GPV, up from 52% of total GPV in the third quarter of 2018. GPV from our largestsellers—mid-market sellers—grew 44% year over year and accounted for 27% of total GPV, up from 24% of total GPV in the third quarter of 2018. We continued to achieve positive GPV and Adjusted Revenue retention across our seller base, demonstrating that existing sellers can grow in the Square ecosystem. Transaction-based revenue was $817 million, up 25% year over year, and transaction-based gross profit was $297 million, up 23% year over year.
We changed the U.S. rate for tapped, dipped, and swiped transactions for Square Point of Sale from 2.75% to 2.6% + 10¢. This change was implemented for new sellers beginning on September 24 and existing sellers on November 1. We made this change to standardize our card present pricing across our seller products, and better align our rates with the fixed fee component of interchange in the U.S.1 We expect this to have a neutral to positive impact on transaction-based revenue and transaction-based profit for our Seller ecosystem beginning in the fourth quarter of 2019.
In the third quarter of 2019, subscription and services-based revenue was $280 million up 68% year over year, and subscription and services-based gross profit was $216 million, up 82% year over year. Revenue growth was driven primarily by Cash App, Square Capital, and Instant Deposit for sellers. Square Capital facilitated approximately 85,000 loans totaling $563 million, up 39% year over year.2
REVENUE AND GROSS PROFIT, EXCLUDING CAVIAR
Q3 2019, YOY GROWTH (%)
| | | | |
Total net revenue growth | | | 45 | % |
Adjusted Revenue growth | | | 43 | % |
Gross profit growth | | | 42 | % |
On our Investor Relations website, we have posted an FAQ document with more context on this reporting change, as well as a spreadsheet with our historical financials.
In the third quarter of 2019, Cash App revenue comprised $159 million in subscription and services-based and transaction-based revenue, and $148 million in bitcoin revenue. During the quarter, bitcoin generated $2 million of gross profit.
Hardware revenue in the third quarter of 2019 was $22 million, up 24% year over year, and generated a gross loss of $14 million. Hardware revenue growth was driven primarily by Square Terminal, which launched in the U.S. in the fourth quarter of 2018.
Upcoming Changes to Adjusted Revenue Reporting
In November 2015, we introduced Adjusted Revenue as a supplementalnon-GAAP metric for investors to measure our business performance and growth, and provide greater comparability to other payments solution providers. For additional detail on the Adjusted Revenue metric, please see page 16 of the Shareholder Letter under “Key Operating Metrics andNon-GAAP Financial Measures.”
Following receipt of a comment letter from, and subsequent communications with, the Division of Corporation Finance of the Securities and Exchange Commission (the “SEC”), we will discontinue the use of the Adjusted Revenue measure. This will be the last quarter in which we will report and guide to Adjusted Revenue. Going forward, our statements of operations will continue to disclose total net revenue, transaction-based costs, and bitcoin costs, determined in accordance with GAAP, which are the key components of Adjusted Revenue. This reporting change will not affect our GAAP or othernon-GAAP results.
REVENUE AND GROSS PROFIT FROM CASH APP
| | | | | | | | | |
| | | Revenue | | | | Gross Profit |
| Subscription and services-based and transaction-based | | $159M | | | | $121M |
Bitcoin | | $148M | | | | $2M |
| Total contribution from Cash App | | $307M | | | | $123M |
Revenue from Cash App in the third quarter of 2019 was generated primarily by subscriptions and services. Cash App subscription and services-based revenue is primarily composed of transaction fees from Cash App Instant Deposit and Cash Card, with a small portion generated from interest earned on customer funds. Cash App transaction-based revenue primarily comprised fees from business accounts and, to a lesser extent,peer-to-peer transactions funded with a credit card.
We offer thepeer-to-peer service to our Cash App customers for free, and we consider it to be a marketing tool to encourage the usage of Cash App.
Payback periodmeasures the effectiveness of sales and marketing spend. For a comprehensive definition, refer to the sidebar on page 4.
OPERATING EXPENSES
In the third quarter of 2019, operating expenses were $468 million, up 29% year over year, andnon-GAAP operating expenses were $372 million, up 29% year over year. Operating expenses were 37% of total net revenue on a GAAP basis and 29% of total net revenue on anon-GAAP basis.
| • | | Product development expenses were $169 million on a GAAP basis and $101 million on anon-GAAP basis in the third quarter of 2019, up 24% and 15% year over year, respectively. This increase was driven primarily by personnel costs related to our engineering, data science, and design teams. |
| • | | Sales and marketing expenses were $149 million on a GAAP basis and $142 million on anon-GAAP basis in the third quarter of 2019, up 28% and 31% year over year, respectively. Cash App marketing expenses were up 59% year over year, driven primarily by increases inpeer-to-peer transactions and risk loss, and Cash Card issuances. We continued to achieve a3- to4- quarter payback period for our Seller ecosystem. |
| • | | General and administrative expenses were $116 million on a GAAP basis and $97 million on anon-GAAP basis in the third quarter of 2019, up 36% and 39% year over year, respectively. The increase was due primarily to additions to customer support, finance, and legal personnel. |
| • | | Transaction, loan, and advance losses were $33 million in the third quarter of 2019, up 39% year over year. This increase was driven primarily by growth in seller GPV, Cash App volumes, and Square Capital loan volumes, including newer loan products for which we continue to train our risk models. Seller transaction losses remained below 0.1% of GPV, underscoring continued discipline in risk management. For Square Capital, we continued to see an average loss rate of less than 4% for our core Flex Loan product. |
EARNINGS
In the third quarter of 2019, net income was $29 million, compared to net income of $20 million in the third quarter of 2018. Net income per share was $0.07 and $0.06 on a basic and diluted basis, respectively, in the third quarter of 2019, based on 427 million weighted-average basic shares and 466 million weighted-average diluted shares. This compares to net income per share of $0.05 and $0.04 in the third quarter of 2018, on a basic and diluted basis, respectively. Themark-to-market valuation of our Eventbrite investment resulted in a gain of $2 million in the third quarter of 2019 and a gain of $37 million in the third quarter of 2018. Excluding this impact, net income was $27 million in the third quarter of 2019, compared to a net loss of $17 million in the third quarter of 2018. Excluding the effect of Eventbrite, both basic and diluted net income per share in the third quarter of 2019 would have been $0.06, compared to a net loss per share of $0.04 in the third quarter of 2018 on both a basic and diluted basis.
Adjusted EBITDA was $131 million in the third quarter of 2019, up 85% year over year. The increase in Adjusted EBITDA relative to prior guidance was driven primarily by improved business performance and the timing of certain operating expenses, including facilities expansion. Adjusted Net Income Per Share (Adjusted EPS) was $0.25 based on 486 million weighted-average diluted shares for the third quarter of 2019, representing a $0.12 improvement year over year.
BALANCE SHEET/CASH FLOW
We ended the third quarter of 2019 with $1.8 billion in cash, cash equivalents, restricted cash, and investments in marketable debt securities, an increase of approximately $80 million compared to the end of the second quarter of 2019.
In the third quarter of 2019, Adjusted EBITDA and proceeds from the exercise of stock options contributed positively to our cash balance. This was partly offset by cash outflows due to the timing of the settlement of customers payable and settlements receivable; purchases of property, equipment, and other long-term investments; and payments for tax withholding related to vesting of restricted stock units.
On October 31, 2019, we completed the sale of Caviar to DoorDash for $410 million, composed of $310 million in cash and $100 million of DoorDash’s preferred stock.
In August 2017, we invested $25 million for preferred shares of Eventbrite, which converted into common stock in connection with Eventbrite’s IPO in September 2018. We revalued this investment, which resulted in gains of $2 million and $37 million in the third quarter of 2019 and third quarter of 2018, respectively, and losses of $17 million, $14 million, and $5 million in the fourth quarter of 2018, and first and second quarters of 2019, respectively.
EVENTBRITE IMPACT TO NET INCOME (LOSS) PER SHARE
| | | | | | | | | | |
| | | 3Q 2018 | | | | | 3Q 2019 | |
Net income (loss) per share | | | $0.04 | | | | | | $0.06 | |
Impact from Eventbrite | | | $0.08 | | | | | | $0.00 | |
| Net income (loss) per share, excluding Eventbrite | | | ($0.04 | ) | | | | | $0.06 | |
Guidance
REVENUE AND GROSS PROFIT
| | | | | | | | | | | | | | |
| | | | | | Q4 2019 | | | | Current 2019 | | | | Previous 2019 |
| | | | | | |
Total net revenue | | | | | | $1,160M to $1,180M | | | | $4,560M to $4,580M | | | | $4,410M to $4,470M |
| | | | | | |
| Caviar contribution to total net revenue | | | | | | $14M | | | | $145M | | | | $190M |
| | | | | | |
Total net revenueex-Caviar | | | | | | $1,146M to $1,166M | | | | $4,415M to $4,435M | | | | $4,220M to $4,280M |
| | | | | | |
Adjusted Revenue | | | | | | $585M to $595M | | | | $2,240M to $2,250M | | | | $2,250M to $2,280M |
| | | | | | |
| Caviar contribution to Adjusted Revenue | | | | | | $14M | | | | $145M | | | | $190M |
| | | | | | |
| Adjusted Revenueex-Caviar | | | | | | $571M to $581M | | | | $2,095M to $2,105M | | | | $2,060M to $2,090M |
| | | | | | |
YoY growth (midpoint): | | | | | | | | | | | | | | |
| | | | | | |
Ex-Caviar1 | | | | | | 37% | | | | 46% | | | | 44% |
| | | | | | |
Reported2 | | | | | | 27% | | | | 41% | | | | 43% |
| | | | | | |
Gross Profit | | | | | | $502M to $512M | | | | $1,865M to $1,875M | | | | — |
| | | | | | |
| Caviar contribution to gross profit | | | | | | $4M | | | | $40M | | | | — |
| | | | | | |
Gross Profitex-Caviar | | | | | | $498M to $508M | | | | $1,825M to $1,835M | | | | — |
| | | | | | |
YoY growth (midpoint): | | | | | | | | | | | | | | |
| | | | | | |
Ex-Caviar1 | | | | | | 36% | | | | 44% | | | | — |
| | | | | | |
Reported2 | | | | | | 33% | | | | 43% | | | | — |
| | | | | | |
Transaction-based costs and bitcoin costs | | | | | | $575M to $ 585M | | | | $2,320M to $2,330M | | | | $2,160M to $2,190M |
We are increasing the upper end of our full year 2019 total net revenue guidance by $110 million due to underlying trends in our Seller and Cash App businesses as well as bitcoin outperformance in the third quarter. The performance of our Seller and Cash App ecosystems are driving a $15 million increase to the top end of our full year 2019 Adjusted Revenue guidance range, excluding a $45 million negative impact from Caviar. This impact from Caviar is a result of timing of the completion of its sale to DoorDash on October 31, 2019, which resulted in the loss of revenue from Caviar in November and December 2019, as well as underperformance of the business during the pending sale.
This quarter, we are introducing guidance for Gross Profit as a metric to evaluate business performance and growth rates. We are also introducing guidance for transaction-based costs and bitcoin costs.
1. Excludes Caviar for all of 2018 and 2019.
2. Includes Caviar for all of 2018 and through October 2019.
Guidance
EARNINGS
| | | | | | | | | | | | | | |
| | | | | | Q4 2019 | | | | Current 2019 | | | | Previous 2019 |
| | | | | | |
Adjusted EBITDA | | | | | | $112M to $117M | | | | $410M to $415M | | | | $405M to $415M |
| | | | | | |
Year-over-year growth (midpoint) | | | | | | 41% | | | | 61% | | | | 60% |
| | | | | | |
| Net income (loss) per share1 | | | | | | $(0.01) to $0.01 | | | | $(0.04) to $(0.02) | | | | $(0.10) to $(0.06) |
| | | | | | |
Adjusted EPS (diluted) | | | | | | $0.19 to $0.21 | | | | $0.76 to $0.78 | | | | $0.74 to $0.78 |
We see significant market opportunity and compelling returns on our investments. Our Seller business continued to drive positive revenue retention and a3- to4- quarter payback period. Cash App has been scaling its network with efficient acquisition costs, driving product velocity, and generating strong revenue growth. Similar to prior quarters, we intend to reinvest outperformance back into the business to capture the long-term opportunities ahead of us, and these investments are factored into our fourth quarter and full-year 2019 guidance. We are therefore maintaining our EBITDA guidance for full-year 2019.
Please note that our guidance for net income (loss) per share for the fourth quarter and full year of 2019 reflects a share price of approximately $18 for Eventbrite, based on its closing price on September 30, 2019. In a given quarter, a change in Eventbrite’s share price of $3 results in a change to our net income (loss) per share of approximately $0.01. As a reminder, this does not affect our Adjusted EPS guidance. Our Net income (loss) per share guidance excludes the expected gain from the sale of Caviar in the fourth quarter of 2019, as we are in the process of finalizing the financial impact of the sale.
1. Excludesgain-on-sale from Caviar transaction.
We have not reconciled Adjusted EBITDA and Adjusted EPS guidance to their GAAP equivalents as a result of the uncertainty regarding, and the potential variability of, reconciling items such as share-based compensation expense and weighted-average fully diluted shares outstanding. In addition, we have not reconciled Net income (loss) per share (excluding the Caviar sale gain) as we are in the process of finalizing the expected impact from the sale of Caviar in the fourth quarter of 2019. Accordingly, a reconciliation of thesenon-GAAP guidance metrics to their corresponding GAAP equivalents is not available without unreasonable effort. However, it is important to note that material changes to reconciling items could have a significant effect on our Adjusted EBITDA, Adjusted EPS guidance, Net income (loss) per share (excluding the Caviar sale gain), and future GAAP results. We have provided a reconciliation of other GAAP to non-GAAP metrics in tables at the end of this letter.
MEDIA CONTACT
press@squareup.com
INVESTOR RELATIONS CONTACT
ir@squareup.com
Earnings
Webcast
Square (NYSE:SQ) will host a conference call and earnings webcast at 2:00 p.m. Pacific time/5:00 p.m. Eastern time today, November 6, 2019, to discuss these financial results. The domesticdial-in for the call is(877) 683-2081. The Conference ID is 3878548. To listen to a live audio webcast, please visit Square’s Investor Relations website atsquare.com/investors. A replay will be available on the same website following the call.
We will release financial results for the fourth quarter and full year 2019 on February 26, 2020, after the market closes, and will also host a conference call and earnings webcast at 2:00 p.m. Pacific time/5:00 p.m. Eastern time on the same day to discuss those financial results.
| | | | |

| | 
| | |
| | |
Jack Dorsey | | Amrita Ahuja | | |
| CEO | | CFO | | |


Since the start of my business eight years ago, I have never been able to get funding through a traditional bank—despite having a strong credit score, a solid business plan, B.A. in economics, over ten years of restaurant experience, three years of new store operations experience, and exponential growth of The Peach. I’ve had to bootstrap my business the entire way. Until Square Capital. One year after paying back my loan, I have nearly doubled production capacity of The Peach.”
Joanne Canady Brown
Owner,The Gingered Peach
Lawrenceville, NJ
SAFE HARBOR STATEMENT
This letter contains forward-looking statements within the meaning of the Safe Harbor provisions of the Private Securities Litigation Reform Act of 1995. All statements other than statements of historical fact could be deemed forward-looking, including, but not limited to, statements regarding the future performance of Square, Inc. and its consolidated subsidiaries (the Company); the Company’s expected financial results for future periods and expected benefits of reinvesting in its ecosystem; future profitability and growth in the Company’s businesses and products and the Company’s ability to drive such profitability and growth; the Company’s expectations regarding scale, economics, and the demand for or benefits from its products, product features, and services in the U.S. and in international markets; the ability of the Company’s products to attract and retain customers; the Company’s expectations regarding monetization and usage of the products and features in the Cash App ecosystem; the impact of the Company’s marketing campaigns; the Company’s expectations regarding the impact of the divestiture of the Caviar business; and management’s statements related to business strategy, plans, and objectives for future operations. In some cases, forward-looking statements can be identified by terms such as “may,” “will,” “appears,” “should,” “expects,” “plans,” “anticipates,” “could,” “intends,” “target,” “projects,” “contemplates,” “believes,” “estimates,” “predicts,” “potential,” or “continue,” or the negative of these words or other similar terms or expressions that concern our expectations, strategy, plans, or intentions. Such statements are subject to a number of known and unknown risks, uncertainties, assumptions, and other factors that may cause the Company’s actual results, performance, or achievements to differ materially from results expressed or implied in this letter. Investors are cautioned not to place undue reliance on these statements, and reported results should not be considered as an indication of future performance.
Risks that contribute to the uncertain nature of the forward-looking statements include, among others, the Company’s ability to deal with the substantial and increasingly intense competition in its industry; the Company’s ability to ensure the interoperability of its technology with that of third parties; changes to the rules and practices of payment card networks and acquiring processors; the impact of acquisitions or divestitures, strategic investments, or entries into new businesses; the effect of evolving regulations and oversight related to the Company’s provision of payments services and other financial services; the effect of management changes and business initiatives; adoption of the Company’s products and services in international markets; and changes in political, business, and economic conditions; as well as other risks listed or described from time to time in the Company’s filings with the Securities and Exchange Commission (the SEC), including the Company’s Quarterly Report on Form10-Q for the fiscal quarter ended June 30, 2019, which is on file with the SEC and available on the investor relations page of the Company’s website. Additional information will also be set forth in the Company’s Quarterly Report on Form10-Q for the fiscal quarter ended September 30, 2019. All forward-looking statements are based on information and estimates available to the Company at the time of this letter and are not guarantees of future performance. Except as required by law, the Company assumes no obligation to update any of the statements in this letter.
KEY OPERATING METRICS AND
NON-GAAP FINANCIAL MEASURES
To supplement our financial information presented in accordance with generally accepted accounting principles in the United States (GAAP), we consider certain operating and financial measures that are not prepared in accordance with GAAP, including Gross Payment Volume, Adjusted Revenue, Adjusted EBITDA, Adjusted EBITDA margin, Adjusted Net Income, Diluted Adjusted Net Income Per Share (Adjusted EPS), andnon-GAAP operating expenses. We believe these metrics and measures are useful to facilitateperiod-to-period comparisons of our business and to facilitate comparisons of our performance to that of other payments solution providers.
We define Gross Payment Volume (GPV) as the total dollar amount of all card payments processed by sellers using Square, net of refunds. Additionally, GPV includes Cash App activity related topeer-to-peer payments sent from a credit card, and Business Accounts.
Adjusted Revenue is anon-GAAP financial measure that we define as our total net revenue less transaction-based costs and bitcoin costs, and we add back the impact of the acquired deferred revenue adjustment, which was written down to fair value in purchase accounting. We believe it is useful to subtract transaction-based costs and bitcoin costs from total net revenue to derive Adjusted Revenue as this is a primary metric used by management to measure our business performance, and it affords greater comparability to other payments solution providers. Substantially all of the transaction-based costs are interchange and assessment fees, processing fees, and bank settlement fees paid to third-party payment processors and financial institutions. While some payments solution providers present their revenue in a similar fashion to us, others present their revenue net of transaction-based costs because, unlike us, they pass through these costs directly to their sellers and are not deemed the principal in these arrangements. Under our standard pricing model, we do not pass through these costs directly to our sellers. We deduct bitcoin costs because we consider our role in the bitcoin transactions to be facilitating customer access to bitcoin. Since we only apply a small margin to the market cost of bitcoin when we sell bitcoin to customers, and we have no control over the cost of bitcoin in the market, which tends to be volatile, we believe deducting bitcoin costs is a better reflection of the economic benefits as well as the Company’s performance from the bitcoin transactions. We recognize acquired deferred revenue that was written down for purchase accounting since we believe that it is correlated with ordinary and ongoing operations of the acquired company and facilitates analysis of revenue growth and business trends. We define Adjusted Revenue from subscriptions and services as the total net subscription and services-based revenue adjusted to add back the impact of the write-down adjustment to acquired deferred revenue related to purchase accounting. We add back this deferred revenue that was written down since we believe it is correlated with ordinary and ongoing operations of the acquired company and facilitates analysis of revenue growth and business trends. Adjusted Revenue has limitations as a financial measure, should be considered as supplemental in nature, and is not meant as a substitute for the related financial information prepared in accordance with GAAP. As noted above, this will be the last quarter in which we will report and guide to Adjusted Revenue.
Adjusted EBITDA, Adjusted EBITDA margin, Adjusted Net Income, Diluted Adjusted Net Income Per Share (Adjusted EPS), andnon-GAAP operating expenses arenon-GAAP financial measures that represent our net income (loss) and net income (loss) per share, adjusted to eliminate the effect of share-based compensation expenses, amortization of intangible assets, amortization of debt discount and issuance costs in connection with our offering of convertible senior notes in the first quarter of 2017 and in the second quarter of 2018, the gain or loss on the disposal of property and equipment, gain or loss on revaluation of equity investment, gain or loss on debt extinguishment related to the conversion of senior notes and impairment of intangible assets, as applicable. We also exclude certain costs associated with acquisitions and other activities that are not normal recurring operating expenses, including amounts paid to redeem acquirees’ unvested stock-based compensation awards, and legal, accounting, and due diligence costs, and we add back the impact of the acquired deferred revenue and deferred cost adjustment,
which was written down to fair value in purchase accounting. Additionally, for purposes of calculating diluted Adjusted EPS we add back cash interest expense on convertible senior notes, as if converted at the beginning of the period, if the impact is dilutive, since we intend to settle future conversions of our convertible senior notes entirely in shares. In addition to the items above, Adjusted EBITDA andnon-GAAP operating expenses arenon-GAAP financial measures that also exclude depreciation, other cash interest income and expense, other income and expense, and provision or benefit from income taxes, as applicable. To calculate the diluted Adjusted EPS, we adjust the weighted-average number of shares of common stock outstanding for the dilutive effect of all potential shares of common stock. In periods when we recorded an Adjusted Net Loss, the diluted Adjusted EPS is the same as basic Adjusted EPS because the effects of potentially dilutive items were anti-dilutive given the Adjusted Net Loss position. Adjusted EBITDA margin is calculated as Adjusted EBITDA divided by Adjusted Revenue.
We have included Adjusted EBITDA and Adjusted EPS because they are key measures used by our management to evaluate our operating performance, generate future operating plans, and make strategic decisions, including those relating to operating expenses and the allocation of internal resources. Accordingly, we believe that Adjusted EBITDA and Adjusted EPS provide useful information to investors and others in understanding and evaluating our operating results in the same manner as our management and board of directors. In addition, they provide useful measures forperiod-to-period comparisons of our business, as they remove the effect of certainnon-cash items and certain variable charges. Adjusted EBITDA and Adjusted EPS have limitations as financial measures, should be considered as supplemental in nature, and are not meant as substitutes for the related financial information prepared in accordance with GAAP.
We believe that the aforementioned metrics provide useful information about our operating results, enhance the overall understanding of our past performance and future prospects, and provide useful measures forperiod-to-period comparisons of our business, as they remove the effect of certain variable amounts. Our management uses these measures to evaluate our operating performance, generate future operating plans, and make strategic decisions, including those relating to operating expenses and the allocation of internal resources.
Thesenon-GAAP financial measures should not be considered in isolation from, or as a substitute for, financial information prepared in accordance with GAAP. Thesenon-GAAP financial measures are not based on any standardized methodology prescribed by GAAP and are not necessarily comparable to similarly titled measures presented by other companies.
Consolidated Statements
of Operations
UNAUDITED
In thousands, except per share data
| | | | | | | | | | | | | | | | |
| | | THREE MONTHS ENDED | | | NINE MONTHS ENDED | |
| | | Sept 30, 2019 | | | Sept 30, 2018 | | | Sept 30, 2019 | | | Sept 30, 2018 | |
Revenue: | | | | | | | | | | | | | | | | |
Transaction-based revenue | | $ | 816,622 | | | $ | 655,384 | | | $ | 2,248,894 | | | $ | 1,803,649 | |
Subscription and services-based revenue | | | 279,801 | | | | 166,203 | | | | 750,041 | | | | 397,589 | |
Hardware revenue | | | 21,766 | | | | 17,558 | | | | 62,238 | | | | 50,337 | |
Bitcoin revenue | | | 148,285 | | | | 42,963 | | | | 338,898 | | | | 114,074 | |
| | | | | | | | | | | | | |
Total net revenue | | | 1,266,474 | | | | 882,108 | | | | 3,400,071 | | | | 2,365,649 | |
| | | | | | | | | | | | | |
Cost of revenue: | | | | | | | | | | | | | | | | |
Transaction-based costs | | | 519,312 | | | | 414,456 | | | | 1,418,730 | | | | 1,137,716 | |
Subscription and services-based costs | | | 63,352 | | | | 47,078 | | | | 183,994 | | | | 117,230 | |
Hardware costs | | | 35,672 | | | | 23,229 | | | | 95,881 | | | | 68,467 | |
Bitcoin costs | | | 146,167 | | | | 42,408 | | | | 333,801 | | | | 112,876 | |
Amortization of acquired technology | | | 1,934 | | | | 2,277 | | | | 5,029 | | | | 5,714 | |
| | | | | | | | | | | | | |
Total cost of revenue | | | 766,437 | | | | 529,448 | | | | 2,037,435 | | | | 1,442,003 | |
| | | | | | | | | | | | | |
Gross profit | | | 500,037 | | | | 352,660 | | | | 1,362,636 | | | | 923,646 | |
| | | | | | | | | | | | | |
Operating expenses: | | | | | | | | | | | | | | | | |
Product development | | | 168,771 | | | | 135,773 | | | | 497,322 | | | | 355,668 | |
Sales and marketing | | | 149,467 | | | | 116,337 | | | | 439,601 | | | | 291,846 | |
General and administrative | | | 115,980 | | | | 85,527 | | | | 318,086 | | | | 243,800 | |
Transaction, loan and advance losses | | | 32,722 | | | | 23,596 | | | | 94,827 | | | | 63,603 | |
Amortization of acquired customer assets | | | 1,003 | | | | 1,294 | | | | 3,591 | | | | 2,235 | |
| | | | | | | | | | | | | |
Total operating expenses | | | 467,943 | | | | 362,527 | | | | 1,353,427 | | | | 957,152 | |
| | | | | | | | | | | | | |
Operating income (loss) | | | 32,094 | | | | (9,867) | | | | 9,209 | | | | (33,506) | |
| | | | | | | | | | | | | |
Interest expense, net | | | 5,632 | | | | 7,224 | | | | 15,456 | | | | 12,806 | |
Other expense (income), net | | | (5,541) | | | | (37,800) | | | | 6,988 | | | | (37,908) | |
| | | | | | | | | | | | | |
Loss before income tax | | | 32,003 | | | | 20,709 | | | | (13,235) | | | | (8,404) | |
| | | | | | | | | | | | | |
Provision for income taxes | | | 2,606 | | | | 1,066 | | | | 2,259 | | | | 1,845 | |
| | | | | | | | | | | | | |
Net income (loss) | | $ | 29,397 | | | $ | 19,643 | | | $ | (15,494) | | | $ | (10,249) | |
| | | | | | | | | | | | | |
Net income (loss) per share: | | | | | | | | | | | | | | | | |
Basic | | $ | 0.07 | | | $ | 0.05 | | | $ | (0.04) | | | $ | (0.03) | |
| | | | | | | | | | | | | |
Diluted | | $ | 0.06 | | | $ | 0.04 | | | $ | (0.04) | | | $ | (0.03) | |
| | | | | | | | | | | | | |
Weighted-average shares used to compute net income (loss) per share | | | | | | | | | | | | | | | | |
Basic | | | 427,124 | | | | 409,690 | | | | 423,239 | | | | 402,980 | |
| | | | | | | | | | | | | |
Diluted | | | 466,099 | | | | 474,915 | | | | 423,239 | | | | 402,980 | |
| | | | | | | | | | | | | |
Consolidated Balance Sheets
UNAUDITED
In thousands, except share and per share data
| | | | | | | | |
| Assets | | Sept 30, 2019 | | | Dec 31, 2018 | |
Current assets: | | | | | | | | |
Cash and cash equivalents | | $ | 612,048 | | | $ | 583,173 | |
Short-term investments | | | 557,656 | | | | 540,991 | |
Restricted cash | | | 27,389 | | | | 33,838 | |
Settlements receivable | | | 564,492 | | | | 364,946 | |
Customer funds | | | 660,599 | | | | 334,017 | |
Loans held for sale | | | 120,776 | | | | 89,974 | |
Other current assets | | | 215,806 | | | | 164,966 | |
| | | | | |
Total current assets | | | 2,758,766 | | | | 2,111,905 | |
| | | | | |
Property and equipment, net | | | 134,034 | | | | 142,402 | |
Goodwill | | | 265,974 | | | | 261,705 | |
Acquired intangible assets, net | | | 72,793 | | | | 77,102 | |
Long-term investments | | | 564,508 | | | | 464,680 | |
Restricted cash | | | 14,433 | | | | 15,836 | |
Built-to-suit lease asset | | | — | | | | 149,000 | |
Operating leaseright-of-use assets | | | 108,670 | | | | — | |
Othernon-current assets | | | 81,326 | | | | 58,393 | |
| | | | | |
Total assets | | $ | 4,000,504 | | | $ | 3,281,023 | |
| | | | | |
| | |
Liabilities and Stockholders’ Equity | | | | | | | | |
Current liabilities: | | | | | | | | |
Customers payable | | | 1,268,034 | | | | 749,215 | |
Settlements payable | | | 81,597 | | | | 54,137 | |
Accrued transaction losses | | | 37,419 | | | | 33,682 | |
Accrued expenses | | | 124,005 | | | | 82,354 | |
Operating lease liabilities, current | | | 25,779 | | | | — | |
Other current liabilities | | | 108,067 | | | | 99,153 | |
| | | | | |
Total current liabilities | | | 1,644,901 | | | | 1,018,541 | |
| | | | | |
Long-term debt, net of current portion | | | 928,869 | | | | 899,695 | |
Built-to-suit lease liability | | | — | | | | 149,000 | |
Operating lease liabilities,non-current | | | 106,457 | | | | — | |
Othernon-current liabilities | | | 70,483 | | | | 93,286 | |
| | | | | |
Total liabilities | | | 2,750,710 | | | | 2,160,522 | |
Stockholders’ equity: | | | | | | | | |
Preferred stock, $0.0000001 par value: 100,000,000 shares authorized at September 30, 2019 and December 31, 2018. None issued and outstanding at September 30, 2019 and December 31, 2018. | | | — | | | | — | |
| | |
Class A common stock, $0.0000001 par value: 1,000,000,000 shares authorized at September 30, 2019 and December 31, 2018; 346,552,092 and 323,546,864 issued and outstanding at September 30, 2019 and December 31, 2018, respectively. | | | — | | | | — | |
| | |
Class B common stock, $0.0000001 par value: 500,000,000 shares authorized at September 30, 2019 and December 31, 2018; 82,521,716 and 93,501,142 issued and outstanding at September 30, 2019 and December 31, 2018, respectively. | | | — | | | | — | |
| | |
Additionalpaid-in capital | | | 2,153,449 | | | | 2,012,328 | |
Accumulated other comprehensive loss | | | (2,387) | | | | (6,053) | |
Accumulated deficit | | | (901,268) | | | | (885,774) | |
| | | | | |
Total stockholders’ equity | | | 1,249,794 | | | | 1,120,501 | |
| | | | | |
Total liabilities and stockholders’ equity | | $ | 4,000,504 | | | $ | 3,281,023 | |
| | | | | |
Consolidated Statements of Cash Flows
UNAUDITED
In thousands
| | | | | | | | |
| | | NINE MONTHS ENDED | |
| Cash Flows from Operating Activities | | Sept 30, 2019 | | | Sept 30, 2018 | |
Net loss | | $ | (15,494) | | | $ | (10,249) | |
Adjustments to reconcile net loss to net cash provided by operating activities: | | | | | | | | |
Depreciation and amortization | | | 56,879 | | | | 38,323 | |
Non-cash interest and other expense | | | 25,486 | | | | 23,554 | |
Share-based compensation | | | 217,980 | | | | 157,856 | |
Replacement stock awards in connection with acquisition | | | — | | | | 899 | |
Loss (gain) on revaluation of equity investment | | | 16,467 | | | | (36,908) | |
| Amortization of operating leaseright-of-use assets and accretion of operating lease liabilities | | | 21,950 | | | | — | |
Recovery of common stock in connection with indemnification settlement agreement | | | (789) | | | | (2,745) | |
Transaction, loan and advance losses | | | 94,827 | | | | 63,603 | |
Change in deferred income taxes | | | (1,054) | | | | (563) | |
Changes in operating assets and liabilities: | | | | | | | | |
Settlements receivable | | | (215,594) | | | | (579,769) | |
Customer funds | | | (202,718) | | | | (156,162) | |
Purchase of loans held for sale | | | (1,596,394) | | | | (1,139,142) | |
Sales and principal payments of loans held for sale | | | 1,547,158 | | | | 1,130,378 | |
Customers payable | | | 519,123 | | | | 581,530 | |
Settlements payable | | | 27,460 | | | | 88,486 | |
Charge-offs to accrued transaction losses | | | (56,486) | | | | (40,354) | |
Other assets and liabilities | | | (34,218) | | | | (1,702) | |
| | | | | |
Net cash provided by operating activities | | | 404,583 | | | | 118,660 | |
| | | | | |
| | |
| Cash Flows from Investing Activities | | | | | | | | |
Purchase of marketable debt securities | | | (758,969) | | | | (859,060) | |
Proceeds from maturities of marketable debt securities | | | 325,682 | | | | 128,603 | |
Proceeds from sale of marketable debt securities | | | 327,247 | | | | 106,358 | |
Purchase of marketable debt securities from customer funds | | | (237,640) | | | | — | |
Proceeds from maturities of marketable debt securities from customer funds | | | 115,200 | | | | — | |
Purchase of property and equipment | | | (45,826) | | | | (37,173) | |
Payments for other investments | | | (2,000) | | | | — | |
Purchase of intangible assets | | | — | | | | (1,584) | |
Business combinations, net of cash acquired | | | (20,372) | | | | (112,399) | |
| | | | | |
Net cash used in investing activities | | | (296,678) | | | | (775,255) | |
| | | | | |
| | |
| Cash Flows from Financing Activities | | | | | | | | |
Proceeds from issuance of convertible senior notes, net | | | — | | | | 855,663 | |
Purchase of convertible senior note hedges | | | — | | | | (172,586) | |
Proceeds from issuance of warrants | | | — | | | | 112,125 | |
Principal payment on conversion of senior notes | | | — | | | | (70,047) | |
Payments for tax withholding related to vesting of restricted stock units | | | (164,044) | | | | (125,899) | |
Proceeds from the exercise of stock options, net | | | 81,781 | | | | 94,780 | |
Other financing activities | | | (3,946) | | | | (3,298) | |
| | | | | |
Net cash provided by (used in) financing activities | | | (86,209) | | | | 690,738 | |
| | | | | |
Effect of foreign exchange rate on cash and cash equivalents | | | (673) | | | | (4,154) | |
| | | | | |
Net increase in cash, cash equivalents and restricted cash | | | 21,023 | | | | 29,989 | |
Cash, cash equivalents and restricted cash, beginning of period | | | 632,847 | | | | 735,081 | |
| | | | | |
Cash, cash equivalents and restricted cash, end of period | | $ | 653,870 | | | $ | 765,070 | |
| | | | | |
Key Operating Metrics and
Non-GAAP Financial Measures
UNAUDITED
In thousands, except GPV and per share data
| | | | | | | | | | | | | | | | |
| | | THREE MONTHS ENDED | | | NINE MONTHS ENDED | |
| | | Sept 30, 2019 | | | Sept 30, 2018 | | | Sept 30, 2019 | | | Sept 30, 2018 | |
| | | | |
Gross Payment Volume (GPV) (in millions) | | $ | 28,228 | | | $ | 22,498 | | | $ | 77,599 | | | $ | 61,696 | |
Adjusted Revenue | | $ | 602,219 | | | $ | 431,136 | | | $ | 1,654,069 | | | $ | 1,123,389 | |
Adjusted EBITDA | | $ | 131,323 | | | $ | 70,997 | | | $ | 298,324 | | | $ | 175,213 | |
Adjusted Net Income Per Share: | | | | | | | | | | | | | | | | |
Basic | | $ | 0.28 | | | $ | 0.16 | | | $ | 0.65 | | | $ | 0.39 | |
Diluted | | $ | 0.25 | | | $ | 0.13 | | | $ | 0.57 | | | $ | 0.33 | |
|
Adjusted Revenue UNAUDITED In thousands | |
| | | THREE MONTHS ENDED | | | NINE MONTHS ENDED | |
| | | Sept 30, 2019 | | | Sept 30, 2018 | | | Sept 30, 2019 | | | Sept 30, 2018 | |
| | | | |
Total net revenue | | $ | 1,266,474 | | | $ | 882,108 | | | $ | 3,400,071 | | | $ | 2,365,649 | |
Less: transaction-based costs | | | 519,312 | | | | 414,456 | | | | 1,418,730 | | | | 1,137,716 | |
Less: bitcoin costs | | | 146,167 | | | | 42,408 | | | | 333,801 | | | | 112,876 | |
Add: deferred revenue adjustment related to purchase accounting | | | 1,224 | | | | 5,892 | | | | 6,529 | | | | 8,332 | |
| | | | | | | | | | | | | |
Adjusted Revenue | | $ | 602,219 | | | $ | 431,136 | | | $ | 1,654,069 | | | $ | 1,123,389 | |
| | | | | | | | | | | | | |
Adjusted Revenue
Guidance Reconciliation
UNAUDITED
In thousands
| | | | | | | | |
| | | THREE MONTHS ENDED | | | YEAR ENDED | |
| | | Dec 31, 2019 | | | Dec 31, 2019 | |
| | |
Total net revenue | | $ | 1,160,000–1,180,000 | | | $ | 4,560,000–4,580,000 | |
| Less: Transaction-based costs, bitcoin costs, deferred revenue adjustment related to purchase accounting | | $ | 575,000–585,000 | | | $ | 2,320,000���2,330,000 | |
| | | | | |
Adjusted Revenue | | $ | 585,000–595,000 | | | $ | 2,240,000–2,250,000 | |
| | | | | |
Select Financial Results
Excluding Caviar
UNAUDITED
In thousands
| | | | | | | | | | | | | | | | |
| | | THREE MONTHS ENDED | | | NINE MONTHS ENDED | |
| | | Sept 30, 2019 | | | Sept 30, 2018 | | | Sept 30, 2019 | | | Sept 30, 2018 | |
Total net revenue | | $ | 1,266,474 | | | $ | 882,108 | | | $ | 3,400,071 | | | $ | 2,365,649 | |
Less: Caviar contribution to total net revenue | | | 40,948 | | | | 39,583 | | | | 130,868 | | | | 103,979 | |
| | | | | | | | | | | | | |
Total net revenue excluding Caviar | | | 1,225,526 | | | | 842,525 | | | | 3,269,203 | | | | 2,261,670 | |
| | | | | | | | | | | | | |
Adjusted Revenue | | $ | 602,219 | | | $ | 431,136 | | | $ | 1,654,069 | | | $ | 1,123,389 | |
Less: Caviar contribution to Adjusted Revenue | | | 40,948 | | | | 39,583 | | | | 130,868 | | | | 103,979 | |
| | | | | | | | | | | | | |
Adjusted Revenue excluding Caviar | | | 561,271 | | | | 391,553 | | | | 1,523,201 | | | | 1,019,410 | |
| | | | | | | | | | | | | |
Cost of revenue, in accordance with GAAP | | $ | 766,437 | | | $ | 529,448 | | | $ | 2,037,435 | | | $ | 1,442,003 | |
Less: Caviar contribution to cost of revenue | | | 28,305 | | | | 29,820 | | | | 93,489 | | | | 78,612 | |
| | | | | | | | | | | | | |
Cost of revenue excluding Caviar | | | 738,132 | | | | 499,628 | | | | 1,943,946 | | | | 1,363,391 | |
| | | | | | | | | | | | | |
Gross Profit, in accordance with GAAP | | $ | 500,037 | | | $ | 352,660 | | | $ | 1,362,636 | | | $ | 923,646 | |
Less: Caviar contribution to gross profit | | | 12,643 | | | | 9,763 | | | | 37,379 | | | | 25,367 | |
| | | | | | | | | | | | | |
Gross profit excluding Caviar | | | 487,394 | | | | 342,897 | | | | 1,325,257 | | | | 898,279 | |
| | | | | | | | | | | | | |
Adjusted EBITDA | | $ | 131,323 | | | $ | 70,997 | | | $ | 298,324 | | | $ | 175,213 | |
Less: Caviar contribution to Adjusted EBITDA | | | (3,427) | | | | (2,163) | | | | (8,923) | | | | (6,216) | |
| | | | | | | | | | | | | |
Adjusted EBITDA excluding Caviar | | | 134,750 | | | | 73,160 | | | | 307,247 | | | | 181,429 | |
| | | | | | | | | | | | | |
Adjusted EBITDA
UNAUDITED
In thousands
| | | | | | | | | | | | | | | | |
| | | THREE MONTHS ENDED | | | NINE MONTHS ENDED | |
| | | Sept 30, 2019 | | | Sept 30, 2018 | | | Sept 30, 2019 | | | Sept 30, 2018 | |
| | | | |
Net income (loss) | | $ | 29,397 | | | $ | 19,643 | | | $ | (15,494) | | | $ | (10,249) | |
Share-based compensation expense | | | 77,426 | | | | 58,913 | | | | 217,980 | | | | 157,856 | |
Depreciation and amortization | | | 19,125 | | | | 15,835 | | | | 56,879 | | | | 38,323 | |
Interest expense, net | | | 5,632 | | | | 7,224 | | | | 15,456 | | | | 12,806 | |
Other expense (income), net | | | (5,541) | | | | (37,800) | | | | 6,988 | | | | (37,908) | |
Provision for income taxes | | | 2,606 | | | | 1,066 | | | | 2,259 | | | | 1,845 | |
Loss on disposal of property and equipment | | | 128 | | | | 806 | | | | 428 | | | | 781 | |
Acquisition-related and other costs | | | 1,564 | | | | 345 | | | | 8,479 | | | | 4,708 | |
Acquired deferred revenue adjustment | | | 1,224 | | | | 5,892 | | | | 6,529 | | | | 8,332 | |
Acquired deferred costs adjustment | | | (238) | | | | (927) | | | | (1,180) | | | | (1,281) | |
| | | | | | | | | | | | | |
Adjusted EBITDA | | $ | 131,323 | | | $ | 70,997 | | | $ | 298,324 | | | $ | 175,213 | |
| | | | | | | | | | | | | |
|
Adjusted Net Income and Adjusted EPS UNAUDITED In thousands | |
| | | THREE MONTHS ENDED | | | NINE MONTHS ENDED | |
| | | Sept 30, 2019 | | | Sept 30, 2018 | | | Sept 30, 2019 | | | Sept 30, 2018 | |
| | | | |
Net income (loss) | | $ | 29,397 | | | $ | 19,643 | | | $ | (15,494) | | | $ | (10,249) | |
Share-based compensation expense | | | 77,426 | | | | 58,913 | | | | 217,980 | | | | 157,856 | |
Amortization of intangible assets | | | 3,841 | | | | 4,384 | | | | 11,286 | | | | 9,075 | |
Amortization of debt discount and issuance costs | | | 9,843 | | | | 11,627 | | | | 29,176 | | | | 22,850 | |
Loss (gain) on revaluation of equity investment | | | (2,462) | | | | (36,908) | | | | 16,467 | | | | (36,908) | |
Loss on extinguishment of long-term debt | | | — | | | | 1,625 | | | | — | | | | 1,625 | |
Loss on disposal of property and equipment | | | 128 | | | | 806 | | | | 428 | | | | 781 | |
Acquisition related and other costs | | | 1,564 | | | | 345 | | | | 8,479 | | | | 4,708 | |
Acquired deferred revenue adjustment | | | 1,224 | | | | 5,892 | | | | 6,529 | | | | 8,332 | |
Acquired deferred costs adjustment | | | (238) | | | | (927) | | | | (1,180) | | | | (1,281) | |
| | | | | | | | | | | | | |
Adjusted Net Income - basic | | $ | 120,723 | | | $ | 65,400 | | | $ | 273,671 | | | $ | 156,789 | |
| | | | | | | | | | | | | |
Cash interest expense on convertible senior notes | | $ | 1,277 | | | | — | | | $ | 3,831 | | | | — | |
| | | | | | | | | | | | | |
Adjusted Net Income - diluted | | $ | 122,000 | | | $ | 65,400 | | | $ | 277,502 | | | $ | 156,789 | |
| | | | | | | | | | | | | |
Adjusted Net Income Per Share: | | | | | | | | | | | | | | | | |
Basic | | $ | 0.28 | | | $ | 0.16 | | | $ | 0.65 | | | $ | 0.39 | |
| | | | | | | | | | | | | |
Diluted | | $ | 0.25 | | | $ | 0.13 | | | $ | 0.57 | | | $ | 0.33 | |
| | | | | | | | | | | | | |
Weighted-average shares used to compute | | | | | | | | | | | | | | | | |
Adjusted Net Income Per Share: | | | | | | | | | | | | | | | | |
Basic | | | 427,124 | | | | 409,690 | | | | 423,239 | | | | 402,980 | |
| | | | | | | | | | | | | |
Diluted | | | 486,404 | | | | 495,621 | | | | 486,664 | | | | 475,801 | |
| | | | | | | | | | | | | |
Non-GAAP Operating Expenses
UNAUDITED
In thousands
| | | | | | | | | | | | | | | | |
| | | THREE MONTHS ENDED | | | NINE MONTHS ENDED | |
| | | Sept 30, 2019 | | | Sept 30, 2018 | | | Sept 30, 2019 | | | Sept 30, 2018 | |
| | | | |
Operating expenses | | $ | (467,943) | | | $ | (362,527) | | | $ | (1,353,427) | | | $ | (957,152) | |
Share-based compensation | | | 77,388 | | | | 58,895 | | | | 217,892 | | | | 157,777 | |
Depreciation and amortization | | | 17,084 | | | | 13,215 | | | | 51,193 | | | | 32,037 | |
Loss on disposal of property and equipment | | | 128 | | | | 806 | | | | 428 | | | | 781 | |
Acquisition related and other costs | | | 1,564 | | | | 345 | | | | 8,479 | | | | 4,708 | |
| | | | | | | | | | | | | |
Non-GAAP operating expenses | | $ | (371,779) | | | $ | (289,266) | | | $ | (1,075,435) | | | $ | (761,849) | |
| | | | | | | | | | | | | |
| | | | |
Product development | | $ | (168,771) | | | $ | (135,773) | | | $ | (497,322) | | | $ | (355,668) | |
Share-based compensation | | | 56,321 | | | | 39,525 | | | | 155,114 | | | | 103,813 | |
Depreciation and amortization | | | 11,933 | | | | 7,831 | | | | 35,344 | | | | 19,278 | |
Loss (gain) on disposal of property and equipment | | | — | | | | 712 | | | | (71) | | | | 712 | |
| | | | | | | | | | | | | |
Non-GAAP product development | | $ | (100,517) | | | $ | (87,705) | | | $ | (306,935) | | | $ | (231,865) | |
| | | | | | | | | | | | | |
| | | | |
Sales and marketing | | $ | (149,467) | | | $ | (116,337) | | | $ | (439,601) | | | $ | (291,846) | |
Share-based compensation | | | 6,269 | | | | 6,108 | | | | 20,304 | | | | 16,703 | |
Depreciation and amortization | | | 1,093 | | | | 1,608 | | | | 3,256 | | | | 3,169 | |
Loss on disposal of property and equipment | | | 83 | | | | 91 | | | | 428 | | | | 171 | |
| | | | | | | | | | | | | |
Non-GAAP sales and marketing | | $ | (142,022) | | | $ | (108,530) | | | $ | (415,613) | | | $ | (271,803) | |
| | | | | | | | | | | | | |
| | | | |
General and administrative | | $ | (115,980) | | | $ | (85,527) | | | $ | (318,086) | | | $ | (243,800) | |
Share-based compensation | | | 14,798 | | | | 13,262 | | | | 42,474 | | | | 37,261 | |
Depreciation and amortization | | | 3,055 | | | | 2,482 | | | | 9,002 | | | | 7,355 | |
Loss (gain) on disposal of property and equipment | | | 45 | | | | 3 | | | | 71 | | | | (102) | |
Acquisition-related and other costs | | | 1,564 | | | | 345 | | | | 8,479 | | | | 4,708 | |
| | | | | | | | | | | | | |
Non-GAAP general and administrative | | $ | (96,518) | | | $ | (69,435) | | | $ | (258,060) | | | $ | (194,578) | |
| | | | | | | | | | | | | |
|
Depreciation and Amortization by Function UNAUDITED In thousands | |
| | | THREE MONTHS ENDED | | | NINE MONTHS ENDED | |
| | | Sept 30, 2019 | | | Sept 30, 2018 | | | Sept 30, 2019 | | | Sept 30, 2018 | |
| | | | |
Cost of revenue | | $ | 2,041 | | | $ | 2,620 | | | $ | 5,686 | | | $ | 6,286 | |
Product Development | | | 11,933 | | | | 7,831 | | | | 35,344 | | | | 19,278 | |
Sales and Marketing | | | 1,093 | | | | 1,608 | | | | 3,256 | | | | 3,169 | |
General and Administrative | | | 3,055 | | | | 2,482 | | | | 9,002 | | | | 7,355 | |
Amortization of acquired customer assets | | | 1,003 | | | | 1,294 | | | | 3,591 | | | | 2,235 | |
| | | | | | | | | | | | | |
Total depreciation and amortization | | $ | 19,125 | | | $ | 15,835 | | | $ | 56,879 | | | $ | 38,323 | |
| | | | | | | | | | | | | |