November 18, 2019
VIA EDGAR
Securities and Exchange Commission
Division of Corporation Finance
Office of Information Technology and Services
100 F Street, N.E.
Washington, D.C. 20549
| Attention: | Laura Veator | |
| Stephen Krikorian | ||
| Christine Adams | ||
Re: Square, Inc. Form10-Q for the Quarter Ended March 31, 2018 | ||
Filed May 2, 2018 | ||
Form10-Q for the Quarter Ended June 30, 2018 | ||
Filed August 1, 2018 | ||
FileNo. 001-37622 | ||
Ladies and Gentlemen:
Square, Inc. (“Square” or the “Company” ) submits this letter in response to discussions and correspondence with the staff (the “Staff”) of the Securities and Exchange Commission (the “Commission”) relating to the Company’s Form10-Q for the fiscal quarter ended March 31, 2018 filed with the Commission on May 2, 2018 and for the fiscal quarter ended June 30, 2018 filed with the Commission on August 1, 2018 (FileNo. 001-37622).
Based on the comment letter received from the Staff on November 1, 2018 on our adjusted revenue measure (the “Comment Letter”) and our subsequent discussions with the Staff, Square has determined to transition away from this measure. Square acknowledges and agrees that it will no longer include the adjusted revenue measure in filings subsequent to Square’s Form10-Q for the fiscal quarter ended September 30, 2019 filed with the Commission on November 6, 2019.
In addition, the Company is filing asExhibit A to this letter the following correspondence between the Staff and the Company relating to the Comment Letter:
| 1. | Email and related attachments sent to the Staff on March 18, 2019 in connection with a proposed alternative measure to adjusted revenue, including a hypothetical illustrativemock-up of Square’s Q4 2018 shareholder letter. |
| 2. | Slide deck presented in connection with a meeting with the Staff in Washington, D.C. on May 8, 2019. |
| 3. | Email and related attachments sent to the Staff on October 1, 2019 in connection with a proposed transition plan away from adjusted revenue, including hypothetical illustrativemock-ups of Square’s Q2 2019 shareholder letter showing Q3, Q4 and “steady state” presentations. |
* * * * *
If you have any questions or comments, please contact me at415-375-3176.
| Very truly yours, |
| /s/ Ajmere Dale |
| Ajmere Dale |
| Chief Accounting Officer |
cc:
Amrita Ahuja, Chief Financial Officer, Square, Inc.
Sivan Whiteley, General Counsel and Corporate Secretary, Square, Inc.
Tait Svenson, Corporate Lead and Assistant Secretary, Square, Inc.
Shahzia Rahman, Governance and Securities Counsel Lead and Assistant Secretary, Square, Inc.
Tony Jeffries, Wilson Sonsini Goodrich & Rosati, Professional Corporation
Lisa Stimmell, Wilson Sonsini Goodrich & Rosati, Professional Corporation
Dave Cabral, Ernst & Young LLP
Hal Berliner, Ernst & Young LLP
Exhibit A
Square Inc. Mail - Square, Inc. - Correspondence |
|
 | Tait Svenson <tait@squareup.com> |
Square, Inc. - Correspondence
| Tait Svenson<tait@squareup.com> | Mon, Mar 18, 2019 at 10:20 PM | |
To: “Veator, Laura” <VeatorL@sec.gov>, wilsonc@sec.gov, AdamsC@sec.gov, KrikorianS@sec.gov
Cc: Ajmere Dale <ajmere@squareup.com>, Shahzia Rahman <shahzia@squareup.com>
Ladies and Gentlemen,
We wanted to reach out to your team to follow up on our call from February 22nd, during which Square determined to discontinue its use of Adjusted Revenue as aNon-GAAP metric. After our call, the Square team (Investor Relations, Communications, Accounting, Finance, and Legal) engaged in internal discussions and research on the potential impact of this decision on our investors, many of whom have relied on this metric through our IPO and over our last three years as a public company. While we understand the Staff’s concerns and we agree to discontinue using Adjusted Revenue, we anticipate that this will cause significant disruption for our investors. We therefore believe introducing an operating metric will be critical to help them to understand and measure the performance of key drivers of our business.
We are proposing to use a Net Billings operating metric, which we describe in more detail below. This proposal is the result of internal research and discussions, a review of the SEC’s prior comment letters on operating metrics and consultations with our new CFO, Amrita Ahuja.
**
Net Billings as an operating metric:
Net Billings is a measure of our business performance that we believe closely represents the economic value of the underlying sales transactions. It is a primary metric used by management to measure growth performance across the business. We believe the growth of our business is driven by our ability to maintain relationships with our sellers and increase usage of our ecosystem. Our Net Billings metric provides a measurement of our ability to increase long-term value of our seller base through retaining our existing sellers and cross-selling them products and services with different pricing models. Additionally, we also use net billings to measure the effectiveness of our sales and marketing spend in bringing in new sellers to the Square platform. We calculate the metric as shown in the table below:
| 12/31/2018 | ||||
Transaction-based fees | $2,471,451 | |||
Less: transaction-based costs | -1,558,562 | |||
Net billings from transaction based fees | 912,889 | |||
Net billings from subscription and services | 591,706 | |||
Net billings from hardware sales | 68,503 | |||
Bitcoin sales | 166,517 | |||
Less: Bitcoin costs | -164,827 | |||
Net billings from bitcoin sales | 1,690 | |||
Total Net Billings | $1,574,788 |
Net billings from transaction processing represents our transaction-based fees that we charge our customers less the related transaction-based costs that comprise interchange and assessment fees, processing fees, and bank settlement fees. These transaction-based costs are paid to the third-party payment processors and financial institutions and are settled in advance of the Company receiving its net proceeds. We deduct these costs to arrive at the amounts we expect to retain from these transactions for reinvestment in the business.
| 1/2 |
Square Inc. Mail - Square, Inc. - Correspondence |
|
Net billings from subscription and services represents the gross amounts that we invoice our customers for the associated services that we expect to collect from the customers in full.
Net billings from hardware sales represents the gross amounts invoiced to customers from hardware sales that we expect to collect from the customers in full.
Net billings from bitcoin is comprised of gross sales from bitcoin less bitcoin costs. Given the automated nature of the bitcoin transactions and that we essentially pair customer trades on a near real time basis, the margin we make on bitcoin sales is the amount that we retain that is available for reinvestment in the business.
**
We expect we can introduce Net Billings in connection with the10-Q for this quarter (Q1 2019). For your reference, I have attached to this email (i) our 201810-K and (ii) our Q4 2018 shareholder letter, which we have marked up to indicate how we propose treating this new metric. While we have focused on the more prominent areas of the letter and will need to revisit the actual Q1 2019 disclosure in more detail, we hope this provides a helpful reference point for you. We’d be happy to coordinate a call with your team to discuss our proposal. We could set something up next week if that works for you.
Best,
Tait
Tait Svenson| Corporate Lead and Assistant Secretary
1455 Market St., Ste 600 San Francisco, CA 94103

2 attachments |
 | Square SEC filings modified for Net Billings (3.18.19).pdf 391K | |||
| Square4Q18-Earnings-SEC-Changes (3.18.19).pdf 3595K | |||
| 2/2 |
Key Operating Metrics andNon-GAAP Financial Measures
We collect and analyze operating and financial data to evaluate the health of our business, allocate our resources, and assess our performance. In addition to revenue, net loss, and other results under generally accepted accounting principles (GAAP), the following table sets forth key operating metrics andnon-GAAP financial measures we use to evaluate our business. We believe these metrics and measures are useful to facilitateperiod-to-period comparisons of our business, and to facilitate comparisons of our performance to that of other payment processors.
| (in thousands, except for GPV and per share data) | ||||
| Non-GAAP financial measures: | ||||
Adjusted Revenue (as previously defined) | $ | 1,587,641 | ||
Adjusted EBITDA | $ | 256,523 | ||
Adjusted Net Income (Loss) Per Share: | ||||
Basic | $ | 0.55 | ||
Diluted | $ | 0.47 | ||
| ||||
Operating metrics: | ||||
Gross Payment Volume (GPV) (in millions) | $ | 84,654 | ||
Net Billings (as defined below) | $ | 1,574,788 | ||
Discontinuation of Adjusted Revenue
After this quarter we will discontinue reporting Adjusted Revenue, anon-GAAP financial measure as previously defined. Our statement of operations fully discloses our total revenues as well as transaction-based costs and bitcoin costs.
Gross Payment Volume (GPV)
We define GPV as the total dollar amount of all card payments processed by sellers using Square, net of refunds. Additionally, GPV includes Cash App activity related topeer-to-peer payments sent from a credit card and Cash for Business.
Net Billings
During the quarter ended March 31, 2019, we have introduced a new operating metric, Net Billings. Net Billings is a measure of our business performance that more closely represents the economic value of the underlying sales transactions. Net billings is comprised of transaction-based fees net of transaction-based costs, subscription and services-based sales, hardware sales, and sales of bitcoin net of bitcoin costs.

Highlights
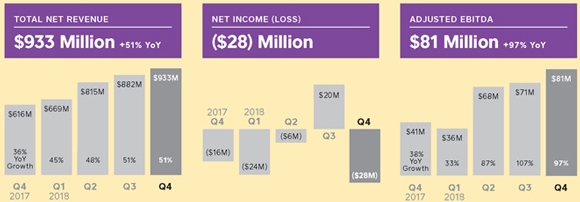
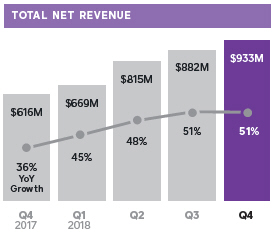
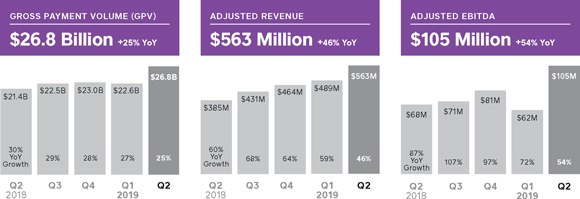
We continued to drive strong revenue growth at scale: In the fourth quarter of 2018, total net revenue grew 51% year over year.
 |  |  | ||
| We launched Square Card to provide a new way for sellers to spend and manage their funds. | We launchedIn-App Payments SDK to allow developers and sellers to build consumer apps that use Square to process mobile payments. | We launched a mobile app and introduced employee benefits for Square Payroll, a full-service solution for small businesses, which are underserved by traditional payroll providers. | ||
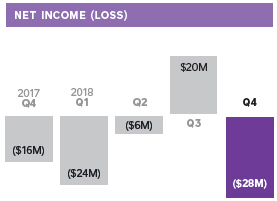
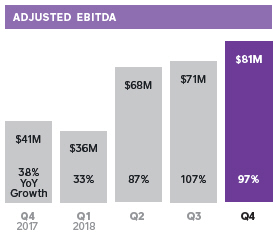
FOURTH QUARTER FINANCIAL METRICS
FOURTH QUARTER OPERATING METRICS
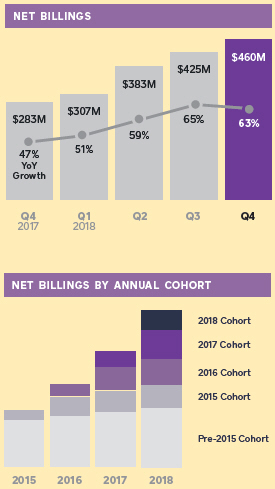
Net Billings is a new operating metric that is a measure of our business performance that we believe more closely represents the actual economic inflows we expect to receive from sales of our products and services to our customers. Net billings is comprised of transaction-based fees net of transaction-based costs, subscription and services-based sales, hardware sales, and sales of bitcoin net of bitcoin costs.
In August 2017, we invested $25 million for preferred shares of Eventbrite, which converted into common stock in connection with Eventbrite’s IPO in September 2018. We revalued this investment, which resulted in a gain of $37 million in the third quarter of 2018 and a loss of $17 million in the fourth quarter of 2018, affecting net income (loss) in each quarter. We will continue to carry it at fair market value, with changes in fair market value being recorded in other income or expense. A reconciliation ofnon-GAAP financial measures used in this letter to their nearest GAAP equivalents is provided at the end of this letter.
| SQUARE Q4 2018 2 |
ON THE COVER
AND RIGHT
Quest Skinner is a mixed-
media artist, teacher,
and community activist
based in Washington, D.C.
She uses Square Card
to quickly reinvest funds
from her sales back into
her business.
February 27, 2019
Net Billings is a new operating metricthat is a measure of our business performance that we believe more closely represents the actual economic inflows we expect to receive from sales of our products and services to our customers. Net billings is comprised of transaction-based fees net of transaction-based costs, subscription and services-based sales, hardware sales, and sales of bitcoin net of bitcoin costs.
15M+
CASH APP
MONTHLY ACTIVES
Amonthly active Cash App customer has at least one cash inflow or outflow during a given month.

To Our Shareholders
| ||
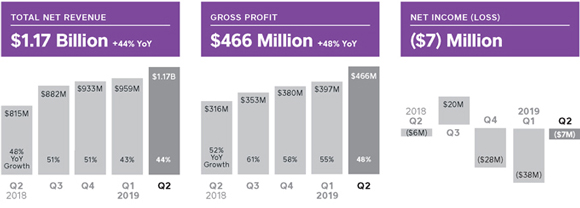
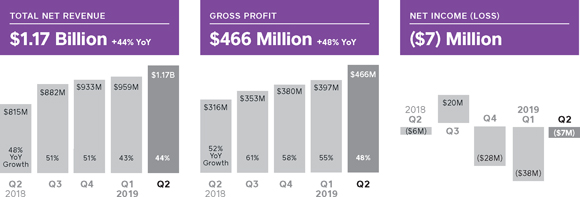
We continued to drive strong revenue growth at scale. In the fourth quarter of 2018, total net revenue grew 51% year over year and 47% year over year excluding the acquisitions of Weebly and Zesty, which were acquired in the second quarter of 2018. Net loss was $28 million, compared to a net loss of $16 million in the fourth quarter of 2017. Excluding the loss of $17 million as a result of themark-to-market valuation of our Eventbrite investment, net loss was $12 million. Adjusted EBITDA was $81 million in the fourth quarter of 2018, up 97% year over year, with margins improving compared to the fourth quarter of 2017. Net Billings grew 63% year over year in the fourth quarter of 2018 and and 53% year over year excluding the acquisitions of Weebly and Zesty. | ||
We are driving innovation and adoption of new services by reinvesting in our ecosystem: In the fourth quarter of 2018, revenue from products launched in the last five years was 37% of total net revenue, up from 22% in the prior year period. Our investment activity is guided by our three ongoing focus areas: strengthening omnichannel commerce, expanding financial services, and growing current international markets. As we reinvest for growth, we are seeing strong momentum in our ecosystem: Notably, Cash App had more than 15 million monthly active customers in December 2018, which is more than double year over year. These three strategic areas represent long-term opportunities for Square to create meaningful value for our customers. |
| |
| Products launched since 2014 as a percentage of total net revenue includes revenue from acquisitions, excludes hardware revenue. | ||
|
| SQUARE Q4 2018 3 |
1. Based on a survey of 140 Square Card beta sellers conducted in January 2019.
We launched Square Card to provide a new way for sellers to spend and manage their funds.
Square Card is a free business debit card that enables sellers to spend their funds as soon as they make a sale. When a seller takes a payment, the proceeds immediately go into their Square stored balance, which can then be spent or withdrawn from an ATM. Square earns interchange fees when sellers make purchases with Square Card. By providing sellers with an accessible spending tool for their business, Square Card helps sellers separate business and personal expenses, making it easier to assess their business’s health and track expenses for tax purposes.
All businesses need to be nimble, and Square Card is designed to provide sellers with the ability to easily invest in the growth of their business. Access to funds is crucial, and Square Card does not charge a fee to the cardholder. And as part of the Square ecosystem, Square Card provides sellers with a consolidated view of their sales, operating expenses, and cash flow to better manage their business.
Square Card aligns with our focus on expanding access to financial services: Approximately 40% of Square Card beta sellers did not previously have a business debit card.¹ Square Card also encourages commerce within the Square community by offering the cardholder a 2.75% instant discount on purchases from other Square sellers. We were able to quickly build Square Card by using the technology and infrastructure behind Cash Card—our prepaid debit card for Cash App customers—demonstrating how our scale and growing ecosystem enable rapid innovation.
C.C. Nedrow, owner of Payton’s Photography, has used Square since its earliest days. As a sole proprietor, C.C. is responsible for all purchasing decisions and uses Square Card to buy supplies as soon as she needs them. She can keep her personal expenses separate and easily view her business purchases and sales in the same place. C.C. also uses Square Invoices, Square Marketing, and Square Capital to grow her business.

Square Cardis a contactless(NFC-enabled) and chip card that sellers can use anywhere Mastercard® is accepted. Because the card is a business prepaid debit card, Square earns interchange fees when sellers make purchases.
SELLER HIGHLIGHT

With Square Card, the money I make from a photo session is at my fingertips so I can purchase the supplies I need to run my business—whether that’s coffee at a client meeting, props, or a last-minute replacement lens. Tools available to sole proprietors like myself don’t always offer a simple way to separate business and personal expenses, so being able to do this all in one place with Square is amazing.”
C.C. Nedrow
Payton’s Photography
Montgomery, Illinois
| SQUARE Q4 2018 4 |
1. Euromonitor, “How to survive in an omnichannel world: Best practices for omnichannel retailing,” October 2016.
In-App Payments SDK is Payment Card Industry Data Security Standard (PCI DSS) compliant.
AnSDKis a software development kit. Developers use SDKs to create applications with advanced functionalities.
Larger Sellers Processing Payments with Square Through Multiple Channels
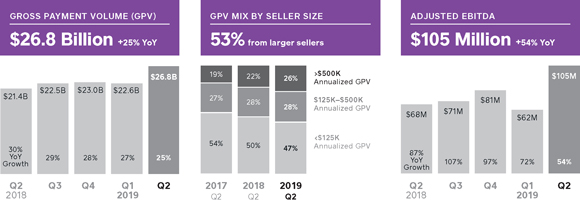
Alarger sellergenerates more than $125,000 in annualized GPV.
We launchedIn-App Payments SDK to allow developers and sellers to build consumer apps that use Square to process mobile payments.
Mobile apps are an increasingly important channel for sellers: Nearly half of all internet retailing is expected to be transacted via mobile by 2020.¹ With just a few lines of code, developers can easily integrate a secure, elegant, andPCI-compliant checkout flow into their Android or iOS apps. WithIn-App Payments SDK, developers leave the complexity of payments to Square, so they can focus on building an engaging,easy-to-use app. For sellers, the SDK allows them to offer their buyers the ability to pay with credit and debit cards and digital wallets (such as Google Pay and Apple Pay), and to save their card information for future purchases.
The SDK further establishes our omnichannel payments capabilities, as Square now offers first-party products acrossin-person, web, and mobile app transactions. Providing sellers and developers with one platform to manage payments across channels minimizes the complexity of this critical task. Sellers receive a single, unified report of sales across all channels, providing a holistic view of their buyers’ behavior for better customer service and loyalty management.
Brushfire is a fast-growing provider of online ticketing and registration for churches and ministries worldwide. For a recent event, Brushfire integratedIn-App Payments SDK into its client’s mobile app to create a new channel (in addition toin-person ticket booths) for customers to buy tickets for future events. After adding mobile ticketing capabilities, Brushfire increased ticket sales by more than 20% year over year.
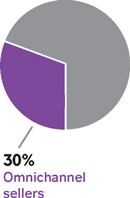
Omnichannel commerce—the ability for sellers to serve buyers wherever they are—remains a top focus area for us as 30% of our larger sellers serve their customers via more than one channel on Square. In addition to SDKs, we have other solutions that enable sellers to engage their buyers: Three of our online payment products—Invoices, Virtual Terminal, and eCommerce API—contributed more than 10% of Square’s GPV in the fourth quarter. By helping sellers always make a sale, these products can help drive growth for both sellers and Square.
IN PERSON Square Reader SDK enablesin-person payments with a Square Reader and apoint-of-sale app on the seller’s device. | VS. | MOBILE In-App Payments SDKenables mobile payments with Square in an app on the consumer’s device. |

Brushfire
After adding mobile ticketing capabilities,
Brushfire increased ticket sales by more
than 20% year over year.
SELLER HIGHLIGHT
Square’sIn-App Payments SDK was painless and easy to use. We loved it from a technical standpoint: It allowed us to do something that was literally impossible for us to do before, and we were able to do it easier than ever. That’s all that matters to developers.”
Jorin Slaybaugh
Brushfire
Texas
| SQUARE Q4 2018 5 |
1. U.S. Census Bureau, “Annual Survey of Entrepreneurs,” 2016.
2. U.S. Bureau of Labor Statistics, “Characteristics of minimum wage workers,” 2017.
Square Payroll as an Acquisition Channel
3. Based on a survey of 345 Square Payroll customers in October 2018.
4. According to the Employee Benefit Research Institute 2017 Health and Workplace Benefits Survey, 83% of employees said that health insurance was very important or extremely important when deciding to choose or stay at a job, and 73% said the same about retirement benefits.
We launched a mobile app and introduced employee benefits for Square Payroll, a full-service solution for small businesses, which are underserved by traditional payroll providers.
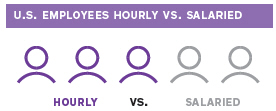
Traditional payroll tools can be expensive and cumbersome, and are designed for enterprise businesses with salaried employees, neglecting the needs of a majority of U.S. businesses: Approximately 90% of businesses have 20 or fewer employees,¹ and three out of five employees are hourly workers.² As a result, small business owners often manage payroll manually, which can be error-prone and time consuming.
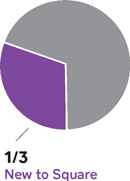
Square Payroll makes it easy for employers to pay their teams by handling tasks from overtime calculations to tax payments and filings. Integration with the Square ecosystem enables seamless importing of timecards and tips. With the new Square Payroll mobile app, sellers can manage their business from anywhere. And with the new Square Team app, employees can view their pay stubs, clock in and out of shifts, and manage their preferences, such as whether they’d like to be paid via Cash App. Additionally, Square Payroll has been a valuable acquisition channel: Approximatelyone-third of Square Payroll sellers that joined in 2018 were new to Square.
When Mimi Washington opened Seya CrossFit & Wellness, she quickly recognized the need for an easy way to pay her fitness instructors. Square Payroll was the ideal solution, allowing her to add and pay her 20 contractors in minutes. Within a year, she expanded the gym into a wellness center with a yoga studio and juice bar, and is now using Square Register and Square Point of Sale to serve her growing fitness community.
In the fourth quarter we added employee benefits, which was the most requested feature in a recent survey of businesses using Square Payroll.³ Benefit offerings typically aren’t accessible to small businesses, making this feature a key employee retention tool that helps Square Payroll sellers compete with larger employers for talented employees.4 With Square Payroll, employers can select the specific benefits that fit their business and their budget, including health insurance, retirement savings,pre-tax spending, and workers’ compensation.

SELLER HIGHLIGHT

I go in, click a button, and they get paid. It’s the quickest way I’ve done payroll in my life. If only everything was this easy. I can’t find enough good things to say about Square Payroll. I love it!”
Mimi Washington
Seya CrossFit & Wellness
Baltimore, MD
| SQUARE Q4 2018 6 |
1. Acquisitions were completed in the second quarter of 2018 and thus did not contribute revenue in 2017.
Excluding $52 million of bitcoin revenue, total net revenue in the fourth quarter was $880 million, up 43% year over year. Excluding $167 million of bitcoin revenue, total net revenue for the full year of 2018 was $3.1 billion, up 41% year over year.
Transaction-based profit is calculated by subtracting transaction-based costs from transaction-based revenue.
2. We add back the impact of the write-down to acquired deferred revenue related to purchase accounting to total net subscription and services-based revenue. We add back this deferred revenue that was written down since we believe it is correlated with ordinary and ongoing operations of the acquired company and facilitates analysis of revenue growth and business trends.
Financial Discussion
REVENUE
Total net revenue was $933 million in the fourth quarter of 2018, up 51% year over year. For the full year of 2018, total net revenue was $3.3 billion, an increase of 49% from the full year of 2017. Excluding the acquisitions of Weebly and Zesty,¹ which were acquired in the second quarter of 2018, total net revenue grew 47% year over year in the fourth quarter of 2018. For the full year of 2018, excluding these acquisitions, total net revenue grew 46% year over year. Our strong revenue growth enabled us to reinvest back into the business, particularly in product development and sales and marketing.
Transaction-based revenue was $668 million in the fourth quarter of 2018, up 27% year over year, and transaction-based profit was $247 million, up 29% year over year. For the full year of 2018, transaction-based revenue was $2.5 billion, up 29% year over year, and transaction-based profit was $913 million, up 32% year over year.
Subscription and services-based revenue was $194 million in the fourth quarter of 2018, up 144% year over year, and $592 million for the full year of 2018, up 134% year over year. Subscription and services-based revenue excluding the acquisitions of Weebly and Zesty was $168 million in the fourth quarter of 2018, up 112% year over year, and $528 million in the full year of 2018, up 109% year over year. Excluding the impact of the deferred revenue write down related to purchase accounting, Subscription and Services-based Revenue was $199 million in the fourth quarter, up 150% year over year, and $605 million in the full year of 2018, up 139% year over year.² Growth in the fourth quarter was driven primarily by Instant Deposit, Cash Card, Caviar, and Square Capital.
| SQUARE Q4 2018 7 |
3. Apple Top U.S. Apps of 2018.
4. Represents growth in dollars of originations during the quarter.
Cash App continued to see strong momentum in growing its platform: In 2018, Apple ranked Cash App as atop-20 app in the App Store.³ And Cash App had more than 15 million monthly active customers in December 2018, which is more than double year over year. In the fourth quarter of 2018, Square Capital facilitated approximately 72,000 business loans totaling $472 million, up 55% year over year.4
Hardware revenue in the fourth quarter of 2018 was $18 million, up 51% year over year, driven by Square Terminal, which commenced shipment in November 2018, as well as Square Register and third-party peripherals. For the full year of 2018, hardware revenue was $69 million, an increase of 65% compared to the full year of 2017.
Apple Top Apps of 2018 | ||||||
Top 20 Free Apps in the U.S. App Store | ||||||
1 | YouTube | 11 | Amazon | |||
2 | 12 | Uber | ||||
3 | Snapchat | 13 | ||||
4 | Messenger | 14 | Pandora | |||
5 | 15 | Wish | ||||
6 | Bitmoji | 16 | TikTok | |||
7 | Netflix | 17 | Cash App | |||
8 | Google Maps | 18 | Google Photos | |||
9 | Gmail | 19 | Google Chrome | |||
10 | Spotify Music | 20 | ||||
| SQUARE Q4 2018 8 |
Net Billings retention rate is calculated as the year-over-year Net Billings growth of a quarterly seller cohort, averaged over the last four quarters (excluding contributions from hardware, Gift Cards, Cash App, and the acquisitions of Weebly and Zesty)
Acohort represents the new sellers onboarded to Square during a given period.
OPERATING METRICS
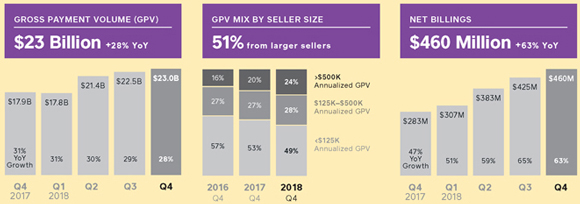
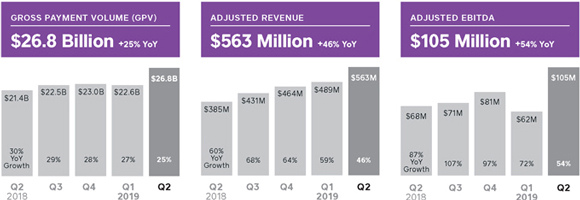
In the fourth quarter of 2018, we processed $23.0 billion in GPV, up 28% year over year. For the full year of 2018, GPV totaled $84.7 billion, an increase of 30% from the full year of 2017. We continued to see strength from larger sellers. In the fourth quarter of 2018, GPV from this group grew 39% year over year and accounted for 51% of total GPV, up from 47% in the fourth quarter of 2017.
Net Billings was $460 million in the fourth quarter of 2018, up 63% year over year. For the full year of 2018, Net Billings was $1.6 billion, an increase of 61% year over year and an acceleration of 18 percentage points compared to our growth rate in 2017. This acceleration is a demonstration of our continued ability to drive growth as we scale.
Excluding the acquisitions of Weebly and Zesty, which were acquired in the second quarter of 2018, Net Billings grew 53% year over year in the fourth quarter of 2018. For the full year of 2018, excluding these acquisitions, Net Billings grew 54% year over year.
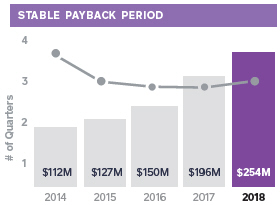
We continued to efficiently acquire new sellers and provide them with the tools they need to grow their business. We achieved positive Net Billings retention across our seller base, which demonstrates that existing sellers can grow in the Square ecosystem. We have maintained a seller payback period of three to four quarters on our sales and marketing spend, underscoring the continued efficacy of ourgo-to-market strategy as our business scales. Additionally, the Net Billings contribution from new seller cohorts continued to grow year over year as a result of the acquisition of larger sellers and the increased adoption of more products and services.
| SQUARE Q4 2018 9 |
1. The acquisition of Weebly was completed in the second quarter of 2018 and thus did not contribute expenses in 2017.
OPERATING EXPENSES
Operating expenses were $383 million in the fourth quarter of 2018, up 52% year over year, andnon-GAAP operating expenses were $304 million, up 52% year over year. For the full year of 2018, operating expenses were $1.3 billion, representing 41% of total net revenue. On anon-GAAP basis, operating expenses were $1.1 billion for the full year of 2018, representing 32% of total net revenue.
| • | Product development expenses were $142 million on a GAAP basis and $88 million on anon-GAAP basis in the fourth quarter of 2018, up 53% and 50%, respectively, year over year. This increase was primarily driven by personnel costs related to our engineering, data science, and design teams, as well as Weebly.¹ |
| • | Sales and marketing expenses were $119 million on a GAAP basis and $112 million on anon-GAAP basis in the fourth quarter of 2018, up 55% and 57%, respectively, year over year. This increase was driven primarily by Cash App expenses, personnel costs, and growth in advertising expenditures. |
| • | General and administrative expenses were $95 million on a GAAP basis and $80 million on anon-GAAP basis in the fourth quarter of 2018, up 44% and 51%, respectively, year over year. The increase was due primarily to additions to finance, legal, and support personnel. |
| • | Transaction, loan, and advance losses were $24 million in the fourth quarter of 2018. Transaction losses as a percentage of GPV continued to trend below our 0.1% historical average, underscoring ongoing improvements in risk management. We continued to see consistent loan loss rates of less than 4% on average for our core Square Capital flex loan product. |
Sales and marketing shown above represents GAAP sales and marketing expenses, excluding Cash App marketing expenses.
Payback period measures the effectiveness of sales and marketing spend. Payback period equals the number of quarters for a cohort’s cumulative Net Billings (excluding contributions from hardware, Gift Cards, and the acquisitions of Weebly and Zesty) to surpass our sales and marketing expense in the quarter in which we acquired the cohort. This measurement excludes both Net Billings and costs associated with Cash App. The 2018 payback period represents a trailing four-quarter average as of the first quarter of 2018.
| SQUARE Q4 2018 10 |
EARNINGS
Net loss in the fourth quarter of 2018 was $28 million, compared to a net loss of $16 million in the fourth quarter of 2017. Net loss was $12 million when excluding the loss of $17 million as a result of themark-to-market valuation of our Eventbrite investment. Net loss per share was $0.07 on both a basic and diluted basis for the fourth quarter of 2018, based on 414 million weighted-average basic and diluted shares. This compares to a net loss per share of $0.04 in the fourth quarter of 2017 on both a basic and diluted basis. Excluding the effect of Eventbrite, both basic and diluted net loss per share in the fourth quarter of 2018 would have been $0.03. For the full year, net loss per share was $0.09 based on 406 million weighted-average basic and diluted shares, compared to a net loss per share of $0.17 for the full year of 2017 on both a basic and diluted basis.
Adjusted EBITDA was $81 million in the fourth quarter of 2018, compared to $41 million in the fourth quarter of 2017, up 97% year over year. For the full year of 2018, Adjusted EBITDA was $257 million, compared to $139 million for the full year of 2017, up 85% year over year.
Adjusted Net Income Per Share (Adjusted EPS) was $0.14 based on 488 million weighted-average diluted shares for the fourth quarter of 2018, representing a $0.06 improvement year over year. For the full year of 2018, Adjusted EPS was $0.47 based on 479 million weighted-average diluted shares for the full year of 2018, compared to $0.27 for the full year of 2017.
In August 2017, we invested $25 million for preferred shares of Eventbrite, which converted into common stock in connection with Eventbrite’s IPO in September 2018. We revalued this investment, which resulted in a gain of $37 million in the third quarter of 2018 and a loss of $17 million in the fourth quarter of 2018, affecting net income (loss) in each quarter.
| SQUARE Q4 2018 11 |
On May 25, 2018, we completed an offering of $862.5 million in convertible senior notes. The convertible senior notes mature in 2023 with a coupon of 0.50%.
On March 6, 2017, we completed an offering of $440 million in convertible senior notes. The convertible senior notes mature in 2022 with a coupon of 0.375%.
BALANCE SHEET/CASH FLOW
We ended the fourth quarter of 2018 with $1.6 billion in cash, cash equivalents, restricted cash, and investments in marketable fixed income securities, up $530 million compared to the end of the fourth quarter of 2017.
For the full year of 2018, Adjusted EBITDA, proceeds from the exercise of stock options, and stock purchases under the employee stock purchase plan contributed positively to our cash balance.
Additionally, in the second quarter of 2018, our cash balance was positively impacted by $795 million in net proceeds from an offering of 2023 convertible senior notes. In the second quarter of 2018, we completed our acquisition of Weebly, which was partly funded with $106 million in cash (net of cash acquired).
We also saw cash outflows related to principal payments on certain convertible notes. In the third quarter of 2018, certain holders of the 2022 convertible senior notes converted an aggregate principal amount of $70 million of their notes. The company settled the principal amount in cash and the balance by issuing 2.2 million shares of our Class A common stock. In the fourth quarter of 2018, certain holders of the 2022 convertible senior notes converted an aggregate principal amount of $149 million of their notes. The company settled the principal amount in cash and the balance by issuing 4.7 million shares of our Class A common stock. We expect to settle subsequent conversions entirely in shares of our Class A common stock.
| SQUARE Q4 2018 12 |
Guidance
| Q1 2019 | 2019 | |||||||||
FINANCIAL METRICS | ||||||||||
| GAAP Financial Metrics | ||||||||||
| Total net revenue | $918M to $938M | $4.35B to $4.41B | ||||||||
| Net income (loss) per share | $(0.12) to $(0.10) | $(0.05) to $(0.01) | ||||||||
Non- GAAP Financial Metrics | ||||||||||
Adjusted EBITDA | $47M to $51M | $405M to $415M | ||||||||
Adjusted EPS (diluted) | $0.06 to $0.08 | $0.74 to $0.78 | ||||||||
OPERATING METRIC | ||||||||||
Net Billings | $472M to $482M | $2.22B to $2.25B | ||||||||
Given the significant market opportunity ahead of us, we will continue to be purposeful as we reinvest in our business to drive long-term growth. Our guidance for the full year of 2019 reflects both investment and growing profitability.
As a reminder, the first quarter is typically our slowest in terms of sequential revenue growth due to seasonality. Additionally, our operating expense base will increase in the first quarter as we invest in growth opportunities.
Please note that our guidance for net income (loss) per share for the full year and first quarter of 2019 reflects a share price of approximately $28 for Eventbrite based on its closing price on December 31, 2018. Therefore, this guidance assumes no change in themark-to-market valuation of our investment in Eventbrite. In a given quarter, a change in Eventbrite’s share price of $3 results in a change to our net income (loss) per share of approximately $0.01.
We have not reconciled Adjusted EBITDA and Adjusted EPS guidance to their GAAP equivalents as a result of the uncertainty regarding, and the potential variability of, reconciling items such as share-based compensation expense and weighted-average fully diluted shares outstanding. Accordingly, a reconciliation of thesenon-GAAP guidance metrics to their corresponding GAAP equivalents is not available without unreasonable effort. However, it is important to note that material changes to these reconciling items could have a significant effect on our Adjusted EBITDA and Adjusted EPS guidance and future GAAP results. We have provided a reconciliation of other GAAP tonon-GAAP metrics in tables at the end of this letter.
| SQUARE Q4 2018 13 |
MEDIA CONTACT
press@squareup.com
INVESTOR RELATIONS CONTACT
ir@squareup.com
Earnings
Webcast
Square (NYSE:SQ) will host a conference call and earnings webcast at 2:00 p.m. Pacific time/5:00 p.m. Eastern time today, February 27, 2019, to discuss these financial results. The domesticdial-in for the call is (833)235-2654. The Conference ID is 5298445. To listen to a live audio webcast, please visit Square’s Investor Relations website atsquare.com/investors. A replay will be available on the same website following the call.
We will release financial results for the first quarter of 2019 on May 1, 2019, after the market closes, and will also host a conference call and earnings webcast at 2:00 p.m. Pacific time/5:00 p.m. Eastern time on the same day to discuss those financial results.
 |  | |||
Jack Dorsey | Amrita Ahuja | |||
| CEO | CFO | |||
| SQUARE Q4 2018 14 |

My dad has been collecting vinyl for 20 years, and his 15,000 records were taking over the house. When we decided to open Grace Records a little over a year ago, I chose Square for its simple and effective payments processing. I run the shop as a side hobby, so the speed and ease of payroll is important—it only takes about three minutes to complete a pay run.”
Darren Skarecky Owner,Grace Records Gilbert, AZ |

| SQUARE Q4 2018 15 |
Consolidated Statements
of Operations
UNAUDITED
In thousands, except per share data
| THREE MONTHS ENDED | YEAR ENDED | |||||||||||||||
| Dec 31, 2018 | Dec 31, 2017 | Dec 31, 2018 | Dec 31, 2017 | |||||||||||||
Revenue: | ||||||||||||||||
Transaction-based revenue | $ | 667,802 | $ | 524,612 | $ | 2,471,451 | $ | 1,920,174 | ||||||||
Subscription and services-based revenue | 194,117 | 79,402 | 591,706 | 252,664 | ||||||||||||
Hardware revenue | 18,166 | 12,021 | 68,503 | 41,415 | ||||||||||||
Bitcoin revenue | 52,443 | — | 166,517 | — | ||||||||||||
|
|
|
|
|
|
| ||||||||||
Total net revenue | 932,528 | 616,035 | 3,298,177 | 2,214,253 | ||||||||||||
|
|
|
|
|
|
| ||||||||||
Cost of revenue: | ||||||||||||||||
Transaction-based costs | 420,846 | 333,377 | 1,558,562 | 1,230,290 | ||||||||||||
Subscription and services-based costs | 52,654 | 24,559 | 169,884 | 75,720 | ||||||||||||
Hardware costs | 25,647 | 16,783 | 94,114 | 62,393 | ||||||||||||
Bitcoin costs | 51,951 | — | 164,827 | — | ||||||||||||
Amortization of acquired technology | 1,376 | 1,486 | 7,090 | 6,544 | ||||||||||||
|
|
|
|
|
|
| ||||||||||
Total cost of revenue | 552,474 | 376,205 | 1,994,477 | 1,374,947 | ||||||||||||
|
|
|
|
|
|
| ||||||||||
Gross profit | 380,054 | 239,830 | 1,303,700 | 839,306 | ||||||||||||
|
|
|
|
|
|
| ||||||||||
Operating expenses: | ||||||||||||||||
Product development | 141,811 | 92,633 | 497,479 | 321,888 | ||||||||||||
Sales and marketing | 119,305 | 76,821 | 411,151 | 253,170 | ||||||||||||
General and administrative | 95,445 | 66,318 | 339,245 | 250,553 | ||||||||||||
Transaction, loan and advance losses | 24,474 | 16,833 | 88,077 | 67,018 | ||||||||||||
Amortization of acquired customer assets | 2,127 | 234 | 4,362 | 883 | ||||||||||||
|
|
|
|
|
|
| ||||||||||
Total operating expenses | 383,162 | 252,839 | 1,340,314 | 893,512 | ||||||||||||
|
|
|
|
|
|
| ||||||||||
Operating loss | (3,108) | (13,009) | (36,614) | (54,206) | ||||||||||||
|
|
|
|
|
|
| ||||||||||
Interest expense, net | 5,176 | 2,483 | 17,982 | 10,053 | ||||||||||||
Other income, net | 19,439 | 356 | (18,469) | (1,595) | ||||||||||||
|
|
|
|
|
|
| ||||||||||
Loss before income tax | (27,723) | (15,848) | (36,127) | (62,664) | ||||||||||||
|
|
|
|
|
|
| ||||||||||
Provision (benefit) for income taxes | 481 | (185) | 2,326 | 149 | ||||||||||||
|
|
|
|
|
|
| ||||||||||
Net loss | $ | (28,204) | $ | (15,663) | $ | (38,453) | $ | (62,813) | ||||||||
|
|
|
|
|
|
| ||||||||||
Net loss per share: | ||||||||||||||||
Basic | $ | (0.07) | $ | (0.04) | $ | (0.09) | $ | (0.17) | ||||||||
|
|
|
|
|
|
| ||||||||||
Diluted | $ | (0.07) | $ | (0.04) | $ | (0.09) | $ | (0.17) | ||||||||
|
|
|
|
|
|
| ||||||||||
Weighted-average shares used to compute net loss per share | ||||||||||||||||
Basic | 413,984 | 390,030 | 405,731 | 379,344 | ||||||||||||
|
|
|
|
|
|
| ||||||||||
Diluted | 413,984 | 390,030 | 405,731 | 379,344 | ||||||||||||
|
|
|
|
|
|
| ||||||||||
| SQUARE Q4 2018 16 |
Consolidated Balance Sheets
UNAUDITED
In thousands, except share and per share data
| Dec 31, 2018 | Dec 31, 2017 | |||||||
Assets | ||||||||
Current assets: | ||||||||
Cash and cash equivalents | $ | 583,173 | $ | 696,474 | ||||
Short-term investments | 540,991 | 169,576 | ||||||
Restricted cash | 33,838 | 28,805 | ||||||
Settlements receivable | 364,946 | 620,523 | ||||||
Customer funds | 334,017 | 103,042 | ||||||
Loans held for sale | 89,974 | 73,420 | ||||||
Other current assets | 164,966 | 86,454 | ||||||
|
|
| ||||||
Total current assets | 2,111,905 | 1,778,294 | ||||||
|
|
| ||||||
Property and equipment, net | 142,402 | 91,496 | ||||||
Goodwill | 261,705 | 58,327 | ||||||
Acquired intangible assets, net | 77,102 | 14,334 | ||||||
Long-term investments | 464,680 | 203,667 | ||||||
Restricted cash | 15,836 | 9,802 | ||||||
Build-to-suit lease asset | 149,000 | — | ||||||
Othernon-current assets | 58,393 | 31,350 | ||||||
|
|
| ||||||
Total assets | $ | 3,281,023 | $ | 2,187,270 | ||||
|
|
| ||||||
Liabilities and Stockholders’ Equity | ||||||||
Current liabilities: | ||||||||
Customers payable | 749,215 | 733,736 | ||||||
Settlements payable | 54,137 | 114,788 | ||||||
Accrued transaction losses | 33,682 | 26,893 | ||||||
Accrued expenses | 82,354 | 52,280 | ||||||
Other current liabilities | 99,153 | 45,130 | ||||||
|
|
| ||||||
Total current liabilities | 1,018,541 | 972,827 | ||||||
|
|
| ||||||
Long-term debt, net of current portion | 899,695 | 358,572 | ||||||
Build-to-suit lease liability | 149,000 | — | ||||||
Othernon-current liabilities | 93,286 | 69,538 | ||||||
|
|
| ||||||
Total liabilities | 2,160,522 | 1,400,937 | ||||||
Stockholders’ equity: | ||||||||
Preferred stock, $0.0000001 par value: 100,000,000 shares authorized at December 31, 2018, and December 31, 2017. None issued and outstanding at December 31, 2018, and December 31, 2017. | — | — | ||||||
Class A common stock, $0.0000001 par value: 1,000,000,000 shares authorized at December 31, 2018, and December 31, 2017; 323,546,864 and 280,400,813 issued and outstanding at December 31, 2018, and December 31, 2017, respectively. | — | — | ||||||
Class B common stock, $0.0000001 par value: 500,000,000 shares authorized at December 31, 2018, and December 31, 2017; 93,501,142 and 114,793,262 issued and outstanding at December 31, 2018, and December 31, 2017, respectively. | — | |||||||
Additionalpaid-in capital | 2,012,328 | 1,630,386 | ||||||
Accumulated deficit | (885,774) | (842,735) | ||||||
Accumulated other comprehensive loss | (6,053) | (1,318) | ||||||
|
|
| ||||||
Total stockholders’ equity | 1,120,501 | 786,333 | ||||||
|
|
| ||||||
Total liabilities and stockholders’ equity | $ | 3,281,023 | $ | 2,187,270 | ||||
|
|
| ||||||
| SQUARE Q4 2018 17 |
Consolidated Statements of Cash Flows
UNAUDITED
In thousands
| YEAR ENDED | ||||||||
| Cash Flows from Operating Activities | Dec 31, 2018 | Dec 31, 2017 | ||||||
Net loss | $ | (38,453) | $ | (62,813) | ||||
Adjustments to reconcile net loss to net cash provided by operating activities: | ||||||||
Depreciation and amortization | 60,961 | 37,279 | ||||||
Non-cash interest and other expense | 31,257 | 14,421 | ||||||
Loss on extinguishment of long-term debt | 5,047 | — | ||||||
Share-based compensation | 216,881 | 155,836 | ||||||
Replacement stock awards issued in connection with acquisition | 899 | — | ||||||
Gain on revaluation of equity investment | (20,342) | — | ||||||
Recovery of common stock in connection with indemnification settlement agreement | (2,745) | — | ||||||
Transaction, loan and advance losses | 88,077 | 67,018 | ||||||
Change in deferred income taxes | (646) | (1,385) | ||||||
Changes in operating assets and liabilities: | ||||||||
Settlements receivable | 245,795 | (305,831) | ||||||
Customer funds | (131,004) | (59,468) | ||||||
Purchase of loans held for sale | (1,609,611) | (1,184,630) | ||||||
Sales and principal payments of loans held for sale | 1,579,834 | 1,145,314 | ||||||
Other current assets | (77,405) | (26,119) | ||||||
Othernon-current assets | (6,641) | (3,274) | ||||||
Customers payable | 15,597 | 301,778 | ||||||
Settlements payable | (60,651) | 63,637 | ||||||
Charge-offs to accrued transaction losses | (58,192) | (46,148) | ||||||
Accrued expenses | 7,190 | 12,207 | ||||||
Other current liabilities | 35,294 | 8,198 | ||||||
Othernon-current liabilities | 13,938 | 11,691 | ||||||
|
|
| ||||||
Net cash provided by operating activities | 295,080 | 127,711 | ||||||
|
|
| ||||||
| Cash Flows from Investing Activities | ||||||||
Purchase of marketable debt securities | (1,000,346) | (544,910) | ||||||
Proceeds from maturities of marketable debt securities | 197,454 | 168,224 | ||||||
Proceeds from sale of marketable debt securities | 171,992 | 89,087 | ||||||
Purchase of marketable debt securities from customer funds | (148,096) | — | ||||||
Proceeds from sale of marketable debt securities from customer funds | 48,334 | — | ||||||
Purchase of property and equipment | (61,203) | (26,097) | ||||||
Purchase of equity investment | — | (25,000) | ||||||
Purchase of intangible assets | (1,584) | — | ||||||
Business combinations, net of cash acquired | (112,399) | (1,915) | ||||||
|
|
| ||||||
Net cash used in investing activities: | (905,848) | (340,611) | ||||||
|
|
| ||||||
| Cash Flows from Financing Activities | ||||||||
Proceeds from issuance of convertible senior notes, net | 855,663 | 428,250 | ||||||
Purchase of convertible senior note hedges | (172,586) | (92,136) | ||||||
Proceeds from issuance of warrants | 112,125 | 57,244 | ||||||
Principal payment on conversion of senior notes | (219,384) | — | ||||||
Settlement of deferred purchase consideration | (848) | — | ||||||
Payment for termination of Starbucks warrant | — | (54,808) | ||||||
Principal payments on capital lease obligation | (3,941) | (1,439) | ||||||
Proceeds from the exercise of stock options and purchases under the employee stock purchase plan, net | 133,850 | 162,504 | ||||||
Payments for tax withholding related to vesting of restricted stock units | (189,124) | (44,682) | ||||||
|
|
| ||||||
Net cash provided by financing activities | 515,755 | 454,933 | ||||||
|
|
| ||||||
Effect of foreign exchange rate on cash and cash equivalents | (7,221) | 4,303 | ||||||
|
|
| ||||||
Net increase (decrease) in cash, cash equivalents and restricted cash | (102,234) | 246,336 | ||||||
Cash, cash equivalents and restricted cash, beginning of period | 735,081 | 488,745 | ||||||
|
|
| ||||||
Cash, cash equivalents and restricted cash, end of period | $ | 632,847 | $ | 735,081 | ||||
|
|
| ||||||
| SQUARE Q4 2018 18 |
Key Operating Metrics and
Non-GAAP Financial Measures
UNAUDITED
In thousands, except GPV and per share data
| THREE MONTHS ENDED | YEAR ENDED | |||||||||||||||
| Dec 31, 2018 | Dec 31, 2017 | Dec 31, 2018 | Dec 31, 2017 | |||||||||||||
Gross Payment Volume (GPV) (in millions) | $ | 22,958 | $ | 17,888 | $ | 84,654 | $ | 65,343 | ||||||||
Adjusted EBITDA | $ | 81,310 | $ | 41,184 | $ | 256,523 | $ | 139,009 | ||||||||
Adjusted Net Income Per Share: | ||||||||||||||||
Basic | $ | 0.16 | $ | 0.09 | $ | 0.55 | $ | 0.30 | ||||||||
Diluted | $ | 0.14 | $ | 0.08 | $ | 0.47 | $ | 0.27 | ||||||||
Total Net Revenue Excluding Zesty and Weebly UNAUDITED In thousands |
| |||||||||||||||
| THREE MONTHS ENDED | YEAR ENDED | |||||||||||||||
| Dec 31, 2018 | Dec 31, 2017 | Dec 31, 2018 | Dec 31, 2017 | |||||||||||||
Total net revenue | $ | 932,528 | $ | 616,035 | $ | 3,298,177 | $ | 2,214,253 | ||||||||
Less: revenue from Zesty and Weebly | 26,152 | — | 63,719 | — | ||||||||||||
|
|
|
|
|
|
| ||||||||||
Total net revenue excluding Zesty and Weebly | 906,376 | 616,035 | 3,234,458 | 2,214,253 | ||||||||||||
|
|
|
|
|
|
| ||||||||||
| SQUARE Q4 2018 19 |
Adjusted EBITDA
UNAUDITED
In thousands
| THREE MONTHS ENDED | YEAR ENDED | |||||||||||||||
| Dec 31, 2018 | Dec 31, 2017 | Dec 31, 2018 | Dec 31, 2017 | |||||||||||||
Net loss | $ | (28,204) | $ | (15,663) | $ | (38,453) | $ | (62,813) | ||||||||
Share-based compensation expense | 59,025 | 44,525 | 216,881 | 155,836 | ||||||||||||
Depreciation and amortization | 22,638 | 9,632 | 60,961 | 37,279 | ||||||||||||
Interest expense, net | 5,176 | 2,483 | 17,982 | 10,053 | ||||||||||||
Other (income) expense, net | 19,439 | 356 | (18,469) | (1,595) | ||||||||||||
Provision (benefit) for income taxes | 481 | (185) | 2,326 | 149 | ||||||||||||
Loss (gain) on disposal of property and equipment | (1,005) | 36 | (224) | 100 | ||||||||||||
Acquisition-related costs | — | — | 4,708 | — | ||||||||||||
Acquired deferred revenue adjustment | 4,521 | — | 12,853 | — | ||||||||||||
Acquired deferred costs adjustment | (761) | — | (2,042) | — | ||||||||||||
|
|
|
|
|
|
| ||||||||||
Adjusted EBITDA | $ | 81,310 | $ | 41,184 | $ | 256,523 | $ | 139,009 | ||||||||
|
|
|
|
|
|
| ||||||||||
Adjusted Net Income and Adjusted EPS UNAUDITED In thousands, except per share data |
| |||||||||||||||
| THREE MONTHS ENDED | YEAR ENDED | |||||||||||||||
| Dec 31, 2018 | Dec 31, 2017 | Dec 31, 2018 | Dec 31, 2017 | |||||||||||||
Net loss | $ | (28,204) | $ | (15,663) | $ | (38,453) | $ | (62,813) | ||||||||
Share-based compensation expense | 59,025 | 44,525 | 216,881 | 155,836 | ||||||||||||
Amortization of intangible assets | 4,029 | 1,747 | 13,104 | 7,615 | ||||||||||||
Amortization of debt discount and issuance costs | 10,005 | 4,335 | 32,855 | 14,223 | ||||||||||||
Loss (gain) on revaluation of equity investment | 16,566 | — | (20,342) | — | ||||||||||||
Loss on extinguishment of long-term debt | 3,403 | — | 5,028 | — | ||||||||||||
Loss (gain) on disposal of property and equipment | (1,005) | 36 | (224) | 100 | ||||||||||||
Acquisition-related costs | — | — | 4,708 | — | ||||||||||||
Acquired deferred revenue adjustment | 4,521 | — | 12,853 | — | ||||||||||||
Acquired deferred costs adjustment | (761) | — | (2,042) | — | ||||||||||||
|
|
|
|
|
|
| ||||||||||
Adjusted Net Income | $ | 67,579 | $ | 34,980 | $ | 224,368 | $ | 114,961 | ||||||||
|
|
|
|
|
|
| ||||||||||
Cash interest expense on convertible senior notes | 1,292 | — | 1,292 | — | ||||||||||||
|
|
|
|
|
|
| ||||||||||
Adjusted Net Income - diluted | $ | 68,871 | 34,980 | 225,660 | 114,961 | |||||||||||
|
|
|
|
|
|
| ||||||||||
Adjusted Net Income Per Share: | ||||||||||||||||
Basic | $ | 0.16 | $ | 0.09 | $ | 0.55 | $ | 0.30 | ||||||||
|
|
|
|
|
|
| ||||||||||
Diluted | $ | 0.14 | $ | 0.08 | $ | 0.47 | $ | 0.27 | ||||||||
|
|
|
|
|
|
| ||||||||||
Weighted-average shares used to compute | ||||||||||||||||
Adjusted Net Income Per Share: | ||||||||||||||||
Basic | 413,984 | 390,030 | 405,731 | 379,344 | ||||||||||||
|
|
|
|
|
|
| ||||||||||
Diluted | 488,177 | 450,703 | 478,895 | 426,519 | ||||||||||||
|
|
|
|
|
|
| ||||||||||
| SQUARE Q4 2018 20 |
Non-GAAP Operating Expenses
UNAUDITED
In thousands
| THREE MONTHS ENDED | YEAR ENDED | |||||||||||||||
| Dec 31, 2018 | Dec 31, 2017 | Dec 31, 2018 | Dec 31, 2017 | |||||||||||||
Operating expenses | $ | (383,162) | $ | (252,839) | $ | (1,340,314) | $ | (893,512) | ||||||||
Share-based compensation | 59,007 | 44,495 | 216,784 | 155,759 | ||||||||||||
Depreciation and amortization | 20,754 | 8,115 | 52,791 | 30,544 | ||||||||||||
Loss (gain) on disposal of property and equipment | (1,005) | 36 | (224) | 100 | ||||||||||||
Acquisition-related costs | — | — | 4,708 | — | ||||||||||||
|
|
|
|
|
|
| ||||||||||
Non-GAAP operating expenses | $ | (304,406) | $ | (200,193) | $ | (1,066,255) | $ | (707,109) | ||||||||
|
|
|
|
|
|
| ||||||||||
Product development | $ | (141,811) | $ | (92,633) | $ | (497,479) | $ | (321,888) | ||||||||
Share-based compensation | 40,788 | 28,564 | 144,601 | 98,310 | ||||||||||||
Depreciation and amortization | 14,029 | 5,221 | 33,307 | 16,955 | ||||||||||||
Gain on disposal of property and equipment | (986) | — | (274) | — | ||||||||||||
|
|
|
|
|
|
| ||||||||||
Non-GAAP product development | $ | (87,980) | $ | (58,848) | $ | (319,845) | $ | (206,623) | ||||||||
|
|
|
|
|
|
| ||||||||||
Sales and marketing | $ | (119,305) | $ | (76,821) | $ | (411,151) | $ | (253,170) | ||||||||
Share-based compensation | 6,094 | 4,699 | 22,797 | 17,568 | ||||||||||||
Depreciation and amortization | 1,238 | 590 | 4,407 | 1,415 | ||||||||||||
Loss on disposal of property and equipment | 68 | 36 | 239 | 158 | ||||||||||||
|
|
|
|
|
|
| ||||||||||
Non-GAAP sales and marketing | $ | (111,905) | $ | (71,496) | $ | (383,708) | $ | (234,029) | ||||||||
|
|
|
|
|
|
| ||||||||||
General and administrative | $ | (95,445) | $ | (66,318) | $ | (339,245) | $ | (250,553) | ||||||||
Share-based compensation | 12,125 | 11,232 | 49,386 | 39,881 | ||||||||||||
Depreciation and amortization | 3,360 | 2,070 | 10,715 | 11,291 | ||||||||||||
Gain on disposal of property and equipment | (87) | — | (189) | (58) | ||||||||||||
Acquisition-related costs | — | — | 4,708 | — | ||||||||||||
|
|
|
|
|
|
| ||||||||||
Non-GAAP general and administrative | $ | (80,047) | $ | (53,016) | $ | (274,625) | $ | (199,439) | ||||||||
|
|
|
|
|
|
| ||||||||||
Depreciation and Amortization by Function UNAUDITED In thousands |
| |||||||||||||||
| THREE MONTHS ENDED | YEAR ENDED | |||||||||||||||
| Dec 31, 2018 | Dec 31, 2017 | Dec 31, 2018 | Dec 31, 2017 | |||||||||||||
Cost of revenue | $ | 1,884 | $ | 1,517 | $ | 8,170 | $ | 6,735 | ||||||||
Product Development | 14,029 | 5,221 | 33,307 | 16,955 | ||||||||||||
Sales and Marketing | 1,238 | 590 | 4,407 | 1,415 | ||||||||||||
General and Administrative | 3,360 | 2,070 | 10,715 | 11,291 | ||||||||||||
Amortization of acquired customer assets | 2,127 | 234 | 4,362 | 883 | ||||||||||||
|
|
|
|
|
|
| ||||||||||
Total depreciation and amortization | $ | 22,638 | $ | 9,632 | $ | 60,961 | $ | 37,279 | ||||||||
|
|
|
|
|
|
| ||||||||||
| SQUARE Q4 2018 21 |

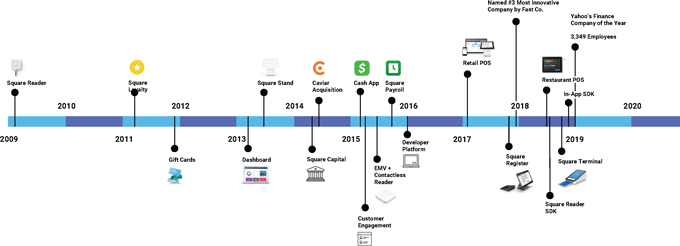
Square
We started Square in 2009 to make it possible for small businesses to accept card payments—an important capability that was previously only available to large businesses. However, sellers need many innovative solutions to thrive, and we have since expanded to provide additional products and services.
| SQUARE, INC. CONFIDENTIAL | 3 |  | ||
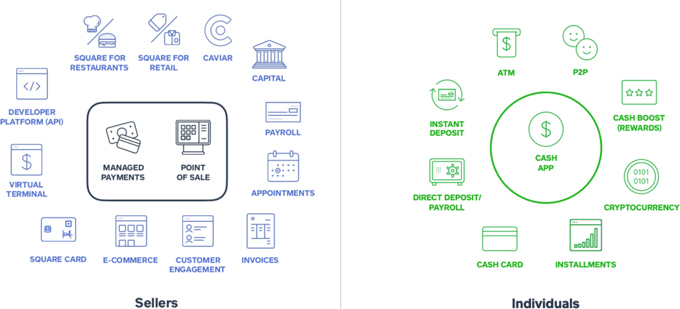
Diverse Products and Services
Square has built two ecosystems of services—one for sellers and one for individuals—that empower people to participate and thrive in the economy.
| SQUARE, INC. CONFIDENTIAL | 4 | | ||
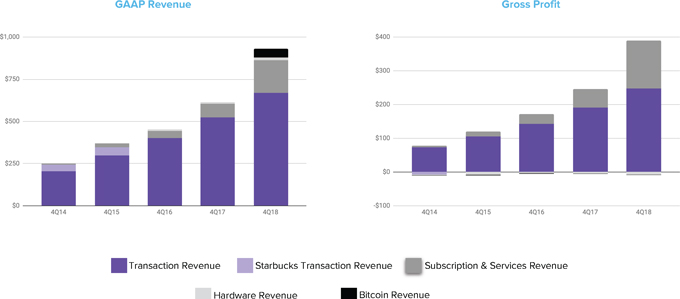
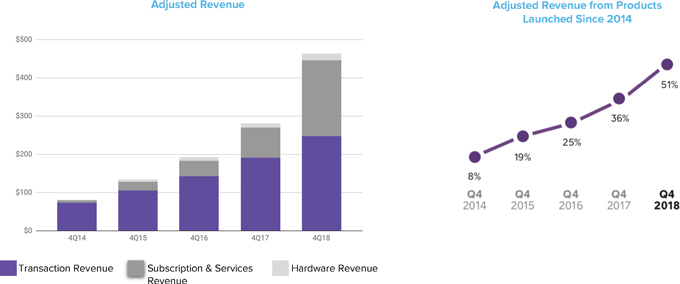
Square has significantly diversified its products and revenues
| SQUARE, INC. CONFIDENTIAL | 5 | | ||
Square has significantly diversified its products and revenues
| SQUARE, INC. CONFIDENTIAL | 6 | | ||
We use Adjusted Revenue internally to track drivers of growth, drive decisions across products and, as a supplement to GAAP reporting, communicate trends to the financial community
Dollar Retention
measures dollar value growth of our existing seller base, factoring in the value of various products that a seller may adopt with Square. | 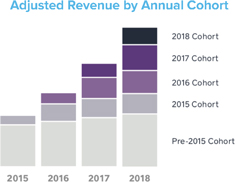 | |
Seller Payback
measures the effectiveness of our sales and marketing spend in driving economic growth from new customers. | 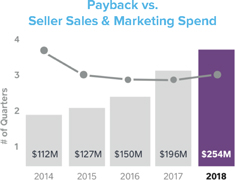 | |
Note
| 1) | Dollar retention rate is calculated as the year-over-year Adjusted Revenue growth of a quarterly seller cohort, averaged over the last four quarters |
| 2) | Payback period equals the number of quarters for a cohort’s cumulative Adjusted Revenue to surpass our sales and marketing expense in the quarter in which we acquired the cohort. |
| SQUARE, INC. CONFIDENTIAL | 7 | | ||
How we calculate Adjusted Revenue at Square
We define Adjusted Revenue as:
| ● | Our totalnet revenue,minus |
| ● | Transaction-based costs,minus |
| ● | Bitcoin costs,plus |
| ● | Theimpact of the acquired deferred revenue adjustment, which was written down to fair value in purchase accounting. |
| SQUARE, INC. CONFIDENTIAL | 8 | | ||
Limitations of Adjusted Revenue
We recognize and acknowledge in ournon-GAAP disclosures that Adjusted Revenue has certain limitations as a financial measure. Our disclosure acknowledges such limitations as follows:
| ● | Adjusted Revenue is net of transaction-based costs, which is our largest cost of revenue item |
| ● | Adjusted Revenue is net of bitcoin costs, which could be a significant cost |
| ● | The deferred revenue adjustment that is added back to Adjusted Revenue will never be recognized as revenue by Square |
| SQUARE, INC. CONFIDENTIAL | 9 | | ||
Why we believe Adjusted Revenue is not misleading
Rule 100(b) of Regulation Gprovides as follows: “A registrant, or a person acting on its behalf, shall not make public anon-GAAP financial measure that, taken together with the information accompanying that measure and any other accompanying discussion of that measure,contains an untrue statement of a material fact or omits to state a material fact necessary in order to make the presentation of thenon-GAAP financial measure, in light of the circumstances under which it is presented, not misleading.”
Non-GAAP Financial Measures Compliance and Disclosure InterpretationQuestion 100.4provides that“Non-GAAP measuresthat substitute individually tailored revenue recognition and measurement methods for those of GAAP could violate Rule 100(b) of Regulation G.
| SQUARE, INC. CONFIDENTIAL | 10 | | ||
Why we believe Adjusted Revenue is not misleading
In the documents we file and furnish with the SEC, we:
| ● | Fully disclose how Adjusted Revenue is calculated |
| ● | Lead with GAAP numbers and not give prominence to thisnon-GAAP metric over our GAAP metrics |
| ● | Provide adetailed reconciliation against the closest comparable GAAP metric |
| ● | Include revenues and costs from components of this metricas line items on the face of our financial statements |
| ● | Tell investors this metric is supplemental andnot meant as a substitute for the related financial information prepared in accordance with GAAP andfully disclose the limitations of this metric |
| ● | Do not inflate our revenues. In prior guidance (e.g. C&DI 100.04 and Deputy Chief Accountant Patrick Gilmore’s December 2018 speech), the SEC objected to a company inflating its revenue above what would be permitted under GAAP revenue recognition rules. Square’s metric doesnot inflate its revenues. |
| ● | Provide analysts with a useful metric. Since our IPO, Adjusted Revenue has been a focus of research analysts reports and the metrics that they calculate (e.g. the percentage of revenues that various costs represent) focus on Adjusted Revenue. |
| SQUARE, INC. CONFIDENTIAL | 11 | | ||
Why Adjusted Revenue, as a supplement to GAAP, provides a better understanding of Square’s business
This metric has a long history of use by Square and provides utility to analysts and investors:
| ● | Started using it during our IPO after discussion with the SEC. Originally used to remove Starbucks revenue to present useful information, given that we anticipated that Starbucks would cease using our payments solution in the fourth quarter of 2016. |
| ● | We use it to measure revenue retention and growth across our existing seller base, whichinforms our investors of the effectiveness of our business strategy and our ability to increase value from our existing sellers by cross-selling multiple services to them. |
| ● | We also measure our seller payback period on our sales and marketing spend, which we consider to bea measure of the efficacy of ourgo-to-market strategy. |
| ● | Our core strategy has been to create an ecosystem of tools to help sellers manage and grow their business. Most of these services and products have higher margins than transaction processing (72% vs 38% in 2018), so Adjusted Revenueprovides a better basis for measuring the growth and contribution of these additional products and services to our performance. |
| ● | Allows comparability of our results to other businesses. Square has a mix of different revenue streams (i.e. transaction processing, financial services, SaaS etc.) and this metric helps comparisons to both merchant acquirers and software companies that have different business models. |
| SQUARE, INC. CONFIDENTIAL | 12 | | ||
Comparable Public Companies
Due to the scope of our diversified products and revenues, comparable companies include payments and software companies. Our supplemental Adjusted Revenue metric is an effort to capture that diversity.
GAAP Revenue Recognition | Non-GAAP Revenue metrics | |||||||
| Industry | Company | Net Revenue | Gross Revenue | |||||
| Payments | WorldPay | X | N/A | |||||
Global Payments | X | Net rev plus gross up for network fees (shareholder letter) | ||||||
Fleetcor | X | Revenue adjusted for macro factors | ||||||
Evertec | X | N/A | ||||||
First Data | X | Revenue excluding reimbursables | ||||||
Total System Services | X | Revenue excluding reimbursables | ||||||
Adyen (IFRS reporting) | X | Gross revenue less interchange and inventory costs | ||||||
Paypal | X | N/A | ||||||
| Subscription and services | ServiceNow | X | Rev plus change in deferred rev, unbilled receiv., deposits | |||||
Paycom | X | N/A | ||||||
Twilio | X | N/A | ||||||
Docusign | X | Revenue plus changes in contract assets and liabilities | ||||||
Hubspot | X | N/A | ||||||
Intuit | X | N/A | ||||||
| SQUARE, INC. CONFIDENTIAL | ||||
| Square Inc. Mail - Square Transition Plan |
|
| Tait Svenson <tait@squareup.com> |
Square Transition Plan
19 messages
Shahzia Rahman<shahzia@squareup.com> | Tue, Oct 1, 2019 at 7:00 AM |
To: “Adams, Christine B.” <AdamsC@sec.gov>
Cc: Tait Svenson <tait@squareup.com>, Ajmere Dale <ajmere@squareup.com>
Hi Christy,
As discussed, we are following up with a proposed plan for Square to transition away from using its Adjusted Revenue metric. Since we last spoke to the SEC, we have spent time discussing this issue with our investors, analysts, Audit Committee and other stakeholders. Taking into account the feedback we received from our stakeholders, the recent volatility of our stock price, and the fact that the recently announced sale of our Caviar business has not yet closed, we respectfully propose the following transition plan:
| 1. | In Q3 2019: Square will disclose Adjusted Revenue on an actual basis and with respect to guidance. We will publicly message the transition away from Adjusted Revenue and plan to introduce guidance on additional GAAP metrics, including (i) gross profit and (ii) transaction costs/bitcoin costs on an aggregate basis. |
| 2. | In Q4 2019: Square will disclose Adjusted Revenue on an actual basis only. We will provide guidance on GAAP metrics. |
| 3. | In Q1 2020: Square will have completed its transition and will no longer report on Adjusted Revenue. |
I am attaching to this email (i) amock-up of our Q3 2019, Q4 2019, and “steady state” Q1 2020 shareholder letters that reflect the transition plan described above and (ii) language we intend to include in our next10-Q filing that discusses our proposed transition plan.
We would like to discuss this plan and any questions you may have for us on a call. Please let us know if your team is available to speak with us this week and any specific times that would work for you. We can then coordinate internally to find something mutually acceptable.
Best,
Shahzia
--

Shahzia Rahman
Governance and Securities Counsel Lead | Square, Inc.
shahzia@squareup.com
4 attachments | ||||||
| 2_Q4 interim.pdf 57K | |||||
| 4_10-Q language.pdf 51K | |||||
| 3_steady-state.pdf 438K | |||||
| 1_Q3 interim.pdf 421K | |||||
| 1/7 |
Highlights
 |  |  | ||
| We continued to drive strong revenue growth at scale: In the second quarter of 2019, total net revenue grew 44% year over year, and Adjusted Revenue grew 46% year over year. | We launched Orders API so sellers can manage orders from all of their channels within Square. | Our Cash App ecosystem has reached significant scale and drove 22% of total net revenue in the second quarter of 2019. | ||
SECOND QUARTER FINANCIAL METRICS
In the second quarter of 2019, Cash App contributed $260 million to total net revenue, of which Bitcoin contributed $125 million, and total net revenue from Cash App excluding Bitcoin was $135 million.
In August 2017, we invested $25 million for preferred shares of Eventbrite, which converted into common stock in connection with Eventbrite’s IPO in September 2018. We revalued this investment, which resulted in a gain of $37 million in the third quarter of 2018, and losses of $17 million, $14 million, and $5 million in the fourth quarter of 2018, first quarter of 2019, and second quarter of 2019, respectively. We will continue to carry it at fair market value, with changes being recorded each quarter in other income or expense.
A reconciliation ofnon-GAAP financial measures used in this letter to their nearest GAAP equivalents is provided at the end of this letter. Adjusted Revenue is total net revenue less transaction-based costs and bitcoin costs, and excludes the effect of deferred revenue adjustment related to purchase accounting.
| SQUARE Q2 2019 1 |
Guidance
| Q3 2019 | Current 2019 | Previous 2019 | ||||||||||||
GAAP metrics
| ||||||||||||||
| Total net revenue | $1.13B to $1.15B | $4.41B to $4.47B | $4.41B to $4.47B | |||||||||||
| Transaction-based costs and bitcoin costs | $xxxM to $xxxM | $xxxM to $xxxM | — | |||||||||||
| Gross Profit | $xxxM to $xxxM | $x.xxB to $x.xxB | — | |||||||||||
Year-over-year growth (midpoint) | xx% | xx% | — | |||||||||||
Net income (loss) per share
| $(0.01) to $0.01
| $(0.10) to $(0.06)
| $(0.09) to $(0.05)
| |||||||||||
Non-GAAP metrics
| ||||||||||||||
Adjusted Revenue | $590M to $600M | $2.25B to $2.28B | $2.25B to $2.28B | |||||||||||
Adjusted EBITDA | $112M to $116M | $405M to $415M | $405M to $415M | |||||||||||
Year-over-year growth (midpoint) | 61% | 60% | 60% | |||||||||||
Adjusted EPS (diluted) | $0.20 to $0.22 | $0.74 to $0.78 | $0.74 to $0.78 | |||||||||||
We see significant market opportunity and compelling returns on our investments across both our seller and Cash App ecosystems. Our seller business continued to drive positive revenue retention and a 3 to 4 quarter payback period on sales and marketing investments. Cash App has been scaling its network with an efficient cost of acquisition, driving product velocity, and generating strong revenue growth. Similar to prior quarters, we intend to reinvest outperformance back into the business to capture the long-term opportunities ahead of us. We are therefore maintaining our EBITDA guidance for full year 2019.
We have not reconciled Adjusted EBITDA and Adjusted EPS guidance to their GAAP equivalents as a result of the uncertainty regarding, and the potential variability of, reconciling items such as share-based compensation expense and weighted-average fully diluted shares outstanding. Accordingly, a reconciliation of thesenon-GAAP guidance metrics to their corresponding GAAP equivalents is not available without unreasonable effort. However, it is important to note that material changes to these reconciling items could have a significant effect on our Adjusted EBITDA and Adjusted EPS guidance and future GAAP results. We have provided a reconciliation of other GAAP tonon-GAAP metrics in tables at the end of this letter.
| SQUARE Q2 2019 2 |
Highlights
 |  |  | ||
| We continued to drive strong revenue growth at scale: In the second quarter of 2019, total net revenue grew 44% year over year, and Adjusted Revenue grew 46% year over year. | We launched Orders API so sellers can manage orders from all of their channels within Square. | Our Cash App ecosystem has reached significant scale and drove 22% of total net revenue in the second quarter of 2019. | ||
SECOND QUARTER FINANCIAL METRICS
In the second quarter of 2019, Cash App contributed $260 million to total net revenue, of which Bitcoin contributed $125 million, and total net revenue from Cash App excluding Bitcoin was $135 million.
In August 2017, we invested $25 million for preferred shares of Eventbrite, which converted into common stock in connection with Eventbrite’s IPO in September 2018. We revalued this investment, which resulted in a gain of $37 million in the third quarter of 2018, and losses of $17 million, $14 million, and $5 million in the fourth quarter of 2018, first quarter of 2019, and second quarter of 2019, respectively. We will continue to carry it at fair market value, with changes being recorded each quarter in other income or expense.
A reconciliation ofnon-GAAP financial measures used in this letter to their nearest GAAP equivalents is provided at the end of this letter. Adjusted Revenue is total net revenue less transaction-based costs and bitcoin costs, and excludes the effect of deferred revenue adjustment related to purchase accounting.
| SQUARE Q2 2019 1 |
Guidance
| Q3 2019 | Current 2019 | Previous 2019 | ||||||||||||
GAAP metrics
| ||||||||||||||
| Total net revenue | $1.13B to $1.15B | $4.41B to $4.47B | $4.41B to $4.47B | |||||||||||
| Transaction-based costs and bitcoin costs | $xxxM to $xxxM | $xxxM to $xxxM | — | |||||||||||
| Gross Profit | $xxxM to $xxxM | $x.xxB to $x.xxB | — | |||||||||||
Year-over-year growth (midpoint) | xx% | xx% | — | |||||||||||
Net income (loss) per share
| $(0.01) to $0.01
| $(0.10) to $(0.06)
| $(0.09) to $(0.05)
| |||||||||||
Non-GAAP metrics
| ||||||||||||||
Adjusted EBITDA | $112M to $116M | $405M to $415M | $405M to $415M | |||||||||||
Year-over-year growth (midpoint) | 61% | 60% | 60% | |||||||||||
| Adjusted EPS (diluted) | $0.20 to $0.22 | $0.74 to $0.78 | $0.74 to $0.78 | |||||||||||
We see significant market opportunity and compelling returns on our investments across both our seller and Cash App ecosystems. Our seller business continued to drive positive revenue retention and a 3 to 4 quarter payback period on sales and marketing investments. Cash App has been scaling its network with an efficient cost of acquisition, driving product velocity, and generating strong revenue growth. Similar to prior quarters, we intend to reinvest outperformance back into the business to capture the long-term opportunities ahead of us. We are therefore maintaining our EBITDA guidance for full year 2019.
We have not reconciled Adjusted EBITDA and Adjusted EPS guidance to their GAAP equivalents as a result of the uncertainty regarding, and the potential variability of, reconciling items such as share-based compensation expense and weighted-average fully diluted shares outstanding. Accordingly, a reconciliation of thesenon-GAAP guidance metrics to their corresponding GAAP equivalents is not available without unreasonable effort. However, it is important to note that material changes to these reconciling items could have a significant effect on our Adjusted EBITDA and Adjusted EPS guidance and future GAAP results. We have provided a reconciliation of other GAAP tonon-GAAP metrics in tables at the end of this letter.
| SQUARE Q2 2019 2 |
Highlights

We continued to drive strong revenue growth at scale: In the second quarter of 2019, total net revenue grew 44% year over year.

We launched Orders API so sellers can manage orders from all of their channels within Square.

Our Cash App ecosystem has reached significant scale and drove 22% of total net revenue in the second quarter of 2019.
SECOND QUARTER FINANCIAL METRICS

In the second quarter of 2019, Cash App contributed $260 million to total net revenue, of which Bitcoin contributed $125 million, and total net revenue from Cash App excluding Bitcoin was $135 million.
In August 2017, we invested $25 million for preferred shares of Eventbrite, which converted into common stock in connection with Eventbrite’s IPO in September 2018. We revalued this investment, which resulted in a gain of $37 million in the third quarter of 2018, and losses of $17 million, $14 million, and $5 million in the fourth quarter of 2018, first quarter of 2019, and second quarter of 2019, respectively. We will continue to carry it at fair market value, with changes being recorded each quarter in other income or expense.
A reconciliation ofnon-GAAP financial measures used in this letter to their nearest GAAP equivalents is provided at the end of this letter.
| SQUARE Q2 2019 1 |
Guidance
| Q3 2019 | Current 2019 | Previous 2019 | ||||||||||||
GAAP metrics
| ||||||||||||||
| Total net revenue | $1.13B to $1.15B | $4.41B to $4.47B | $4.41B to $4.47B | |||||||||||
| Transaction-based costs and bitcoin costs | $xxxM to $xxxM | $xxxM to $xxxM | — | |||||||||||
| Gross Profit | $xxxM to $xxxM | $x.xxB to $x.xxB | — | |||||||||||
Year-over-year growth (midpoint) | xx% | xx% | — | |||||||||||
Net income (loss) per share
| $(0.01) to $0.01
| $(0.10) to $(0.06)
| $(0.09) to $(0.05)
| |||||||||||
Non-GAAP metrics
| ||||||||||||||
Adjusted EBITDA | $112M to $116M | $405M to $415M | $405M to $415M | |||||||||||
Year-over-year growth (midpoint) | 61% | 60% | 60% | |||||||||||
| Adjusted EPS (diluted) | $0.20 to $0.22 | $0.74 to $0.78 | $0.74 to $0.78 | |||||||||||
We see significant market opportunity and compelling returns on our investments across both our seller and Cash App ecosystems. Our seller business continued to drive positive revenue retention and a 3 to 4 quarter payback period on sales and marketing investments. Cash App has been scaling its network with an efficient cost of acquisition, driving product velocity, and generating strong revenue growth. Similar to prior quarters, we intend to reinvest outperformance back into the business to capture the long-term opportunities ahead of us. We are therefore maintaining our EBITDA guidance for full year 2019.
We have not reconciled Adjusted EBITDA and Adjusted EPS guidance to their GAAP equivalents as a result of the uncertainty regarding, and the potential variability of, reconciling items such as share-based compensation expense and weighted-average fully diluted shares outstanding. Accordingly, a reconciliation of thesenon-GAAP guidance metrics to their corresponding GAAP equivalents is not available without unreasonable effort. However, it is important to note that material changes to these reconciling items could have a significant effect on our Adjusted EBITDA and Adjusted EPS guidance and future GAAP results. We have provided a reconciliation of other GAAP tonon-GAAP metrics in tables at the end of this letter.
| SQUARE Q2 2019 2 |
Language to be added to Q310-Q
Adjusted Revenue
In November 2015 we introduced Adjusted Revenue as a supplementalnon-GAAP measure, as we felt it would provide investors and analysts with useful metrics to measure the performance and growth of our ongoing recurring business and allow comparability to other businesses in the payment processing sector. Further, Adjusted Revenue is consistent with what management uses to assess the performance, growth and contribution of our different products and services that have significantly different margins. Adjusted Revenue was intended to be supplemental to, and not a substitute for the Company’s net revenue, which is calculated in accordance with US GAAP.
Following receipt of a comment letter from, and subsequent communications with, the Division of Corporation Finance of the Securities and Exchange Commission (the “SEC”), the SEC has requested that we discontinue use of the Adjusted Revenue measure. As part of a transition period, we have reported Adjusted Revenue in this Quarterly Report on Form10-Q and will include it in the Annual Report on Form10-K for the year 2019. We will however discontinue reporting Adjusted Revenue beginning in the first quarter of 2020. Our statement of operations will continue to disclose total revenues, transaction-based costs and bitcoin costs, determined in accordance with US GAAP, which are the key components of Adjusted Revenue as defined.