Exhibit 99.1
 | 2020 Third Quarter Report |
Contrarian. Innovative. Aligned.
Table of Contents
| Letter to Shareholders | | 2 |
| | | |
| Management's Discussion and Analysis | | 3 |
| | | |
| Consolidated Financial Statements | | 25 |
| | | |
| Notes to the Consolidated Financial Statements | | 30 |
Dear Fellow Shareholders,
At time of writing, the outcome of the US election is still being digested, although market reactions appear to be favorable. While we understand that on a short-term basis, the expectations for additional stimulus and its effect on both interest rates and equities will remain in focus, we believe the long-term trends which will drive precious metals prices remain unchanged. In our view, global debt balances have clearly passed the point of no return, while the economy struggles in low growth mode. This combination will require future monetary and fiscal accommodations which we expect will increase in scale and frequency. We believe in this environment it is of increasing importance for investors to maintain an allocation to precious metals in their portfolios.
Throughout 2020, Sprott has benefited from strong market value appreciation across most of our fund products, as well as significant in-flows in our Exchange Listed Products segment. Our Managed Equities segment delivered excellent year-to-date performance, despite the fact that investors have been slow to allocate capital to mining equities. Our Assets Under Management (“AUM”) increased to $16.3 billion as at September 30, 2020, up $2.4 billion (17%) from June 30, 2020 and up $7 billion (76%) from December 31, 2019. Adjusted base EBITDA was $12 million in the quarter, up $4.4 million (58%) from the prior period and $29.4 million on a year-to-date basis, up $7.9 million (36%).
As a reflection of the robust financial performance of the Company and our strong capital position, we are pleased to announce that the Board of Directors has approved an 8.7% increase of the quarterly dividend from $0.23 per share to $0.25 per share, effective immediately. We are confident that our business will support this dividend level without impacting our ability to fund future growth initiatives.
During the third quarter, Sprott’s strong financial performance was recognized with our inclusion in the S&P/TSX Composite Index. The TSX also ranked Sprott among the 30 top-performing TSX stocks over a three-year period based on dividend adjusted share price appreciation, through inclusion in the TSX30 program.
Sprott has adapted well as to the changes forced upon us by COVID-19, and in some cases we have learned new ways to operate more efficiently in a largely remote environment. We have increased our commitment to digital marketing and found new ways to connect with our investors and clients.
Building on the solid results this year, we remain engaged in various projects which will involve launching new products and pursuing new avenues for growth. The global precious metals investment area remains under-serviced in certain areas, and we see ample opportunity to pursue global growth through new product and distribution initiatives.
We are pleased with our performance following the repositioning of the company in 2017, however, we believe the best is yet to come. We have the right team and strategies in place to capitalize on the tremendous opportunities we see ahead in precious metals and mining investments.
Thank you for your continued support. We look forward to reporting to you again at year end.

Peter Grosskopf
Chief Executive Officer
 | | 2 |
Management's Discussion and Analysis
Three and nine months ended September 30, 2020
| | | 3 |
FORWARD LOOKING STATEMENTS
Certain statements in this Management's Discussion & Analysis ("MD&A"), and in particular the "Business Highlights and Growth Initiatives" section and "Outlook" subsection, contain forward-looking information and forward-looking statements (collectively referred to herein as the "Forward-Looking Statements") within the meaning of applicable Canadian and U.S. securities laws. The use of any of the words "expect", "anticipate", "continue", "estimate", "may", "will", "project", "should", "believe", "plans", "intends" and similar expressions are intended to identify Forward-Looking Statements. In particular, but without limiting the forgoing, this MD&A contains Forward-Looking Statements pertaining to: (i) our ability to be involved in launching new products and pursuing new avenues for growth through new product and distribution initiatives; (ii) our belief that our dividend adjusted share price performance in the future will be better than in the past; (iii) expectations regarding the current precious metals pricing environment; (iv) expectations that the Acquisition continues to be accretive to operating margins in the Managed Equity segment throughout the rest of the year; (v) expectations regarding deployment of capital called into our lending LPs; (vi) anticipation of higher year-over-year performance in the Brokerage segment; (vii) anticipation of flat-to-lower year-over-year operating costs and slightly lower EBITDA contribution from non-reportable segments; (viii) expectation of the effects of COVID-19, and in particular, world government responses thereto via fiscal and monetary policy, will continue to be highly constructive to precious metals markets; and (ix) the declaration, payment and designation of dividends and confidence that our business will support the dividend level without impacting our ability to fund future growth initiatives.
Although the Company believes that the Forward-Looking Statements are reasonable, they are not guarantees of future results, performance or achievements. A number of factors or assumptions have been used to develop the Forward-Looking Statements, including: (i) the impact of increasing competition in each business in which the Company operates will not be material; (ii) quality management will be available; (iii) the effects of regulation and tax laws of governmental agencies will be consistent with the current environment; and (iv) those assumptions disclosed herein under the heading "Significant Accounting Judgments, Estimates and Changes in Accounting Policies". Actual results, performance or achievements could vary materially from those expressed or implied by the Forward-Looking Statements should assumptions underlying the Forward-Looking Statements prove incorrect or should one or more risks or other factors materialize, including: (i) difficult market conditions; (ii) poor investment performance; (iii) failure to continue to retain and attract quality staff; (iv) employee errors or misconduct resulting in regulatory sanctions or reputational harm; (v) performance fee fluctuations; (vi) a business segment or another counterparty failing to pay its financial obligation; (vii) failure of the Company to meet its demand for cash or fund obligations as they come due; (viii) changes in the investment management industry; (ix) failure to implement effective information security policies, procedures and capabilities; (x) lack of investment opportunities; (xi) risks related to regulatory compliance; (xii) failure to manage risks appropriately; (xiii) failure to deal appropriately with conflicts of interest; (xiv) competitive pressures; (xv) corporate growth which may be difficult to sustain and may place significant demands on existing administrative, operational and financial resources; (xvi) failure to comply with privacy laws; (xvii) failure to successfully implement succession planning; (xviii) foreign exchange risk relating to the relative value of the U.S. dollar; (xix) litigation risk; (xx) failure to develop effective business resiliency plans; (xxi) failure to obtain or maintain sufficient insurance coverage on favourable economic terms; (xxii) historical financial information being not necessarily indicative of future performance; (xxiii) the market price of common shares of the Company may fluctuate widely and rapidly; (xxiv) risks relating to the Company’s investment products; (xxv) risks relating to the Company's proprietary investments; (xxvi) risks relating to the Company's lending business; (xxvii) risks relating to the Company’s brokerage business; (xxviii) those risks described under the heading "Risk Factors" in the Company’s annual information form dated February 27, 2020; and (xxix) those risks described under the headings "Managing Risk: Financial" and "Managing Risk: Non-Financial" in this MD&A. In addition, the payment of dividends is not guaranteed and the amount and timing of any dividends payable by the Company will be at the discretion of the Board of Directors of the Company and will be established on the basis of the Company’s earnings, the satisfaction of solvency tests imposed by applicable corporate law for the declaration and payment of dividends, and other relevant factors. The Forward-Looking Statements speak only as of the date hereof, unless otherwise specifically noted, and the Company does not assume any obligation to publicly update any Forward-Looking Statements, whether as a result of new information, future events or otherwise, except as may be expressly required by applicable securities laws.
MANAGEMENT'S DISCUSSION AND ANALYSIS
This MD&A of financial condition and results of operations, dated November 12, 2020, presents an analysis of the consolidated financial condition of the Company and its subsidiaries as at September 30, 2020, compared with December 31, 2019, and the consolidated results of operations for the three and nine months ended September 30, 2020, compared with the three and nine months ended September 30, 2019. The Board of Directors approved this MD&A on November 12, 2020. All note references in this MD&A are to the notes to the Company's September 30, 2020 unaudited interim condensed consolidated financial statements ("interim financial statements"), unless otherwise noted. The Company was incorporated under the Business Corporations Act (Ontario) on February 13, 2008.
PRESENTATION OF FINANCIAL INFORMATION
The financial statements, including the required comparative information, have been prepared in accordance with International Financial Reporting Standards ("IFRS"), as issued by the International Accounting Standards Board ("IASB"). Financial results, including related historical comparatives contained in this MD&A, unless otherwise specified herein, are based on the interim financial statements. While the Company’s functional currency is the Canadian dollar, its presentation currency has switched to US dollars effective January 1, 2020, with the prior period figures restated accordingly. We believe the US dollar better reflects the Company’s consolidated financial position and results of operations given the significance of our revenues denominated in US dollars that further increased in 2020 with the January 17, 2020 close of the Tocqueville Asset Management gold strategies acquisition (the "Acquisition"). Accordingly, all dollar references in this MD&A are in US dollars, unless otherwise specified. The use of the term "prior period" refers to the three and nine months ended September 30, 2019.
| | | 4 |
KEY PERFORMANCE INDICATORS (NON-IFRS FINANCIAL MEASURES)
The Company measures the success of its business using a number of key performance indicators that are not measurements in accordance with IFRS and should not be considered as an alternative to net income (loss) or any other measure of performance under IFRS. Non-IFRS financial measures do not have a standardized meaning prescribed by IFRS and are therefore unlikely to be comparable to similar measures presented by other issuers. Our key performance indicators are discussed below:
Assets Under Management
Assets Under Management ("AUM") refers to the total net assets managed by the Company through its various investment product offerings, managed accounts and managed companies.
Net Inflows
Net Inflows (consisting of net sales, capital calls and fee earning capital commitments) result in changes to AUM and are described individually below:
Net Sales
Fund sales (net of redemptions), including 'at-the-market' transactions and secondary offerings of our physical trusts and new 'creations' of ETF units, are a key performance indicator as new assets being managed will lead to higher management fees and can potentially lead to increased carried interest and performance fee generation (as applicable) given that AUM is also the basis upon which carried interest and performance fees are calculated.
Capital calls and commitments
Capital calls into our lending LPs are a key source of AUM creation, and ultimately, earnings for the Company. Once capital is called into our lending LPs, it is included within the AUM of the Company as it will now earn a management fee (NOTE: it is possible for some forms of committed capital to earn a commitment fee despite being uncalled, in which case, it will also be included in AUM at that time). Conversely, once loans in our lending LPs are repaid, capital may be returned to investors in the form of a distribution, thereby reducing our AUM ("capital distributions").
Net Fees
Management fees (net of trailer and sub-advisor fees) and carried interest and performance fees (net of carried interest and performance fee payouts) are key revenue indicators as they represent the net revenue contribution after directly associated costs that we generate from our AUM.
Net Commissions
Commissions, net of commission expenses, arise primarily from the transaction based service offerings of our brokerage segment.
Compensation
Compensation excludes commissions, carried interest and performance fee payouts, which are presented net of their related revenues in this MD&A, and severance and new hire accruals which are non-recurring.
| | | 5 |
EBITDA, Adjusted EBITDA, Adjusted base EBITDA and Operating margin
EBITDA in its most basic form is defined as earnings before interest expense, income taxes, depreciation and amortization. EBITDA is a measure commonly used in the investment industry by management, investors and investment analysts in understanding and comparing results by factoring out the impact of different financing methods, capital structures, amortization techniques and income tax rates between companies in the same industry. While other companies, investors or investment analysts may not utilize the same method of calculating EBITDA (or adjustments thereto), the Company believes its adjusted base EBITDA metric, in particular, results in a better comparison of the Company's underlying operations against its peers and a better indicator of recurring results from operations as compared to other non-IFRS financial measures.
Neither EBITDA, adjusted EBITDA or adjusted base EBITDA have standardized meaning under IFRS. Consequently, they should not be considered in isolation, nor should they be used in substitute for measures of performance prepared in accordance with IFRS.
The following table outlines how our EBITDA, Adjusted EBITDA and Adjusted base EBITDA measures are determined:
| | | | | |
| | 3 months ended | 9 months ended |
| | | | | |
| (in thousands $) | Sep. 30, 2020 | Sep. 30, 2019 | Sep. 30, 2020 | Sep. 30, 2019 |
| | | | | |
| Net income for the periods | 8,704 | | 4,336 | | 20,258 | | 8,764 | |
| Adjustments: | | | | |
| Interest expense | 320 | | 297 | | 906 | | 767 | |
| Provision for income taxes | 1,613 | | 1,473 | | 5,123 | | 1,793 | |
| Depreciation and amortization | 992 | | 893 | | 3,029 | | 2,541 | |
| EBITDA | 11,629 | | 6,999 | | 29,316 | | 13,865 | |
| | | | | |
| Other adjustments: | | | | |
| (Gain) loss on investments (1) | (4,408 | ) | (600 | ) | (8,198 | ) | (367 | ) |
| Non-cash stock-based compensation | 871 | | 1,212 | | 1,528 | | 3,215 | |
| Other expenses (2) | 3,932 | | 1 | | 6,769 | | 4,849 | |
| Adjusted EBITDA | 12,024 | | 7,612 | | 29,415 | | 21,562 | |
| | | | | |
| Other adjustments: | | | | |
| Carried interest and performance fees | — | | — | | — | | — | |
| Carried interest and performance fee related expenses | — | | — | | — | | — | |
| Adjusted base EBITDA | 12,024 | | 7,612 | | 29,415 | | 21,562 | |
| Operating margin (3) | 47 | % | 36 | % | 47 | % | 38 | % |
| (1) | This adjustment removes the income effects of certain gains or losses on short-term investments, co-investments, and digital gold strategies to ensure the reporting objectives of our EBITDA metric as described above are met. |
| | | |
| (2) | In addition to the items outlined in Note 6, Other expenses also includes severance and new hire accruals of $0.2 million for the 3 months ended (3 months ended September 30, 2019 - $0.2 million) and $1.2 million for the 9 months ended (9 months ended September 30, 2019 - $0.9 million) and excludes income attributable to non-controlling interests (see Other expenses in Note 6 of the interim financial statements). |
| | | |
| (3) | Calculated as adjusted base EBITDA inclusive of depreciation and amortization, and excluding income related to legacy balance sheet loans. This figure is then divided by revenues before gains (losses) on investments, net of direct costs as applicable. |
| | | 6 |
BUSINESS OVERVIEW
Our reportable operating segments are as follows:
Exchange Listed Products
| · | The Company's closed-end physical trusts and exchange traded funds ("ETFs"). |
Managed Equities
| · | The Company's alternative investment strategies managed in-house and on a sub-advised basis. |
Lending
| · | The Company's lending and streaming activities occur through limited partnership vehicles ("lending LPs"). |
Brokerage
| · | The Company's regulated broker-dealer activities (equity origination, corporate advisory, sales and trading). |
Corporate
| · | Provides the Company's operating segments with capital, balance sheet management and other shared services. |
All Other Segments
| · | Contains all non-reportable segments as per IFRS 8, Operating Segments ("IFRS 8"). See Note 12 of the interim financial statements for further details. |
For a detailed account of the underlying principal subsidiaries within our reportable business segments, refer to the Company's Annual Information Form and Note 2 of the annual financial statements.
| | | 7 |
BUSINESS HIGHLIGHTS AND GROWTH INITIATIVES
Investment Performance
Market value appreciation of our AUM was $1.5 billion during the quarter and $3.1 billion on a year-to-date basis as precious metals prices and equity market valuations remain strong this year.
Other Matters
On September 21, 2020, the Company's common shares were added by Dow Jones Canadian Index Services to the S&P/TSX Composite Index. The TSX also added Sprott to the TSX30 as the Company now ranks among the 30 top-performing TSX stocks over a three-year period based on dividend adjusted share price appreciation.
| | | 8 |
OUTLOOK
Exchange Listed Products
We expect this segment to continue benefiting from the current precious metals pricing environment as more than 99% of this segment’s AUM is directly or indirectly impacted by gold and silver price changes, net of redemptions.
Managed Equities
The Acquisition that closed on January 17, 2020 was highly accretive to operating margins and should continue to be accretive throughout the rest of this year.
Lending
| · | This segment’s revenues are generated primarily from two sources: management fees and co-investment income (included in finance income). |
| · | Our lending strategies had $906 million in AUM at the end of the third quarter, earning a blended net management fee rate of 1.02%. We expect capital calls (net of capital distributions) in 2020 to be in excess of $100 million based on our lending team's current view of the loan market and their expectations of possible repayments. |
Brokerage
We continue to anticipate higher year-over-year operating performance in this segment.
Corporate & Other Non-reportable Segments
As a result of better than expected SG&A cost containment at the corporate level and across the company, we anticipate flat-to-lower year-over-year SG&A costs and slightly lower EBITDA contribution from non-reportable segments (see “Consolidation, elimination and all other segments” column of the segment table in Note 12 of the interim financial statements).
COVID-19
The changing economic and market climate as a result of COVID-19 has led to the Company implementing its business continuity plan. Our portfolio managers, brokerage professionals, enterprise shared services teams and key outsource service providers are fully operational. While the exact impacts of COVID-19 over the short and long-term are undeterminable at the date of this report, management believes the effects of COVID-19 we have witnessed thus far, and in particular, world government responses thereto via fiscal and monetary policy, will continue to be highly constructive to precious metals markets.
| | | 9 |
SUMMARY FINANCIAL INFORMATION
| (In thousands $) | Q3
2020 | | Q2
2020 | | Q1
2020 | | Q4
2019 | | Q3
2019 | | Q2
2019 | | Q1
2019 | | Q4
2018 | |
| SUMMARY INCOME STATEMENT | | | | | | | | | | | | | | | | |
| Management fees | 19,934 | | 15,825 | | 15,125 | | 10,685 | | 10,577 | | 9,962 | | 10,195 | | 9,979 | |
| Carried interest and performance fees | — | | — | | — | | 1,811 | | — | | — | | — | | — | |
| less: Trailer and sub-advisor fees | 291 | | 326 | | 154 | | 966 | | 50 | | 67 | | — | | 29 | |
| less: Carried interest and performance fee payouts | — | | — | | — | | 86 | | — | | — | | — | | — | |
| Net Fees | 19,643 | | 15,499 | | 14,971 | | 11,444 | | 10,527 | | 9,895 | | 10,195 | | 9,950 | |
| Commissions | 9,386 | | 6,133 | | 5,179 | | 6,599 | | 6,056 | | 3,293 | | 3,315 | | 4,855 | |
| less: Commission expense | 3,789 | | 2,377 | | 1,870 | | 2,658 | | 2,654 | | 1,356 | | 1,386 | | 2,047 | |
| Net Commissions | 5,597 | | 3,756 | | 3,309 | | 3,941 | | 3,402 | | 1,937 | | 1,929 | | 2,808 | |
| Finance income (1) | 757 | | 656 | | 914 | | 2,481 | | 2,561 | | 3,435 | | 2,946 | | 3,213 | |
| Gain (loss) on investments | 4,408 | | 8,142 | | (4,352 | ) | (1,252 | ) | 600 | | (408 | ) | 5 | | 5,238 | |
| Other income | 914 | | 285 | | 113 | | 623 | | 91 | | 93 | | 77 | | 173 | |
| Total Net Revenues | 31,319 | | 28,338 | | 14,955 | | 17,237 | | 17,181 | | 14,952 | | 15,152 | | 21,382 | |
| | | | | | | | | | | | | | | | | |
| Compensation (2) | 12,281 | | 8,256 | | 7,588 | | 7,368 | | 6,892 | | 5,457 | | 6,306 | | 8,450 | |
| Compensation - severance and new hire accruals | 210 | | 358 | | 667 | | 157 | | 168 | | 650 | | 109 | | 29 | |
| Placement and referral fees | 522 | | 246 | | 86 | | 434 | | 114 | | 251 | | 58 | | 279 | |
| Selling, general and administrative | 2,523 | | 3,049 | | 3,544 | | 2,986 | | 3,175 | | 3,256 | | 3,062 | | 3,157 | |
| Interest expense | 320 | | 350 | | 236 | | 269 | | 297 | | 226 | | 244 | | 236 | |
| Depreciation and amortization | 992 | | 1,049 | | 988 | | 1,254 | | 893 | | 819 | | 829 | | 453 | |
| Other expenses (gain) | 4,154 | | 2,893 | | (1,081 | ) | 2,376 | | (167 | ) | 3,051 | | 1,038 | | (1,225 | ) |
| Total Expenses | 21,002 | | 16,201 | | 12,028 | | 14,844 | | 11,372 | | 13,710 | | 11,646 | | 11,379 | |
| | | | | | | | | | | | | | | | |
| Net Income | 8,704 | | 10,492 | | 1,062 | | 1,445 | | 4,336 | | 1,581 | | 2,847 | | 7,442 | |
| Net Income per share (3) | 0.36 | | 0.43 | | 0.04 | | 0.06 | | 0.18 | | 0.06 | | 0.12 | | 0.31 | |
| Adjusted base EBITDA | 12,024 | | 9,204 | | 8,187 | | 7,441 | | 7,612 | | 7,032 | | 6,918 | | 7,639 | |
| Adjusted base EBITDA per share (3) | 0.49 | | 0.38 | | 0.33 | | 0.31 | | 0.31 | | 0.29 | | 0.28 | | 0.32 | |
| Operating margin | 47 | % | 49 | % | 43 | % | 38 | % | 36 | % | 39 | % | 39 | % | 38 | % |
| | | | | | | | | | | | | | | | | |
| SUMMARY BALANCE SHEET | | | | | | | | | | | | | | | | |
| Total Assets | 358,300 | | 338,931 | | 318,318 | | 324,943 | | 325,442 | | 338,530 | | 332,504 | | 313,895 | |
| Total Liabilities | 81,069 | | 70,818 | | 65,945 | | 53,313 | | 51,774 | | 68,008 | | 54,009 | | 40,386 | |
| Total AUM | 16,259,184 | | 13,893,039 | | 10,734,831 | | 9,252,515 | | 8,548,982 | | 8,103,723 | | 7,909,488 | | 7,756,582 | |
| Average AUM | 16,705,046 | | 13,216,415 | | 11,007,781 | | 8,932,651 | | 8,608,001 | | 7,898,334 | | 7,887,089 | | 7,599,173 | |
| (1) | Finance income includes: (1) interest income from on-balance sheet loans and brokerage client accounts; (2) co-investment income from lending LP units; and (3) ancillary income earned directly or indirectly from lending activities. |
| (2) | See 'Compensation' in the key performance indicators (non-IFRS financial measures) section of this MD&A. |
| (3) | Per share amounts for periods before May 28, 2020 reflect retrospective treatment of the 10:1 share consolidation. |
| | | 10 |
SUMMARY MANAGEMENT FEE BREAKDOWN
Below is a detailed list of management fee rates on our fund products as at September 30, 2020 (in millions $):
| FUND | AUM | | BLENDED NET MANAGEMENT
FEE RATE | CARRIED INTEREST & PERFORMANCE FEE CRITERIA |
| | | | | |
| Exchange Listed Products | | | | |
| Sprott Physical Gold Trust | 4,705 | | 0.35 | % | N/A (1) |
| Sprott Physical Gold and Silver Trust | 4,216 | | 0.40 | % | N/A (1) |
| Sprott Physical Silver Trust | 2,095 | | 0.45 | % | N/A (1) |
| Sprott Gold Miner's ETF | 279 | | 0.35 | % | N/A (1) |
| Sprott Physical Platinum & Palladium Trust | 115 | | 0.50 | % | N/A (1) |
| Sprott Jr. Gold Miner's ETF | 102 | | 0.35 | % | N/A (1) |
| Total | 11,512 | | 0.39 | % | |
| | | | | |
| Managed Equities: Precious Metals Strategies | | | |
| Sprott Gold Equity Fund | 1,258 | | 0.75 | % | N/A |
| Institutional Accounts | 322 | | 0.55 | % | 0-20% of all net profits in excess of the HWM |
| Bullion Funds (2) | 234 | | 0.27 | % | N/A |
| Fixed Term Limited Partnerships | 233 | | 1.70 | % | 15-30% over preferred return |
| Corporate Class Funds (2) | 202 | | 0.69 | % | 5% excess over applicable benchmark indices |
| Gold and Precious Minerals Fund (2) | 132 | | 0.89 | % | 5% excess over applicable benchmark indices |
| Sprott Hathaway Special Situations Fund | 66 | | 1.50 | % | 20% of net profits over preferred return |
| Total | 2,447 | | 0.79 | % | |
| | | | | |
| Managed Equities: Other | | | |
| Sprott U.S. Value Strategies | 209 | | 1.00 | % | N/A |
| Flow-through LPs (2) | 87 | | 0.70 | % | 10% of all net profits in excess of the HWM |
| Legacy Managed Accounts (3) | 16 | | 1.00 | % | N/A |
| Total | 312 | | 0.92 | % | |
| | | | | |
| Lending | | | | |
| Sprott private resource lending LPs | 906 | | 1.02 | % | 15-70% of net profits over preferred return |
| | | | | |
| Other | | | | |
| Managed Companies (4) | 617 | | 0.50 | % | 20% of net profits over preferred return |
| Separately Managed Accounts (5) | 465 | | 0.61 | % | 20% of net profits over preferred return |
| Total | 1,082 | | 0.55 | % | |
| | | | | |
| Total AUM | 16,259 | | 0.51 | % | |
| | | | | |
| (1) Exchange listed products do not generate performance fees, however the management fees they generate are closely correlated to precious metals prices. |
| (2) Management fee rate represents the net amount received by the Company. |
| (3) Institutional managed accounts. |
| (4) Includes Sprott Korea Corp. |
| (5) Includes our private equity strategy in Sprott Asia and high net worth discretionary managed accounts in the U.S. |
| | | 11 |
RESULTS OF OPERATIONS
AUM SUMMARY
AUM was $16.3 billion as at September 30, 2020, up $2.4 billion (17%) from June 30, 2020 and up $7 billion (76%) from December 31, 2019. On a three and nine months ended basis, we benefited from strong market value appreciation across most of our fund products. We also benefited from strong inflows in our physical trusts that more than offset the anticipated redemption experience in our precious metals strategies post-Acquisition (the Acquisition added $1.7 billion of AUM at time of closing). We also benefited from new capital calls (net of distributions) and commitment fee earning assets being added to our lending platform on a year-to-date basis.
3 months results
| (In millions $) | AUM
Jun. 30, 2020 | Net
Inflows (1) | Market
Value
Changes | Other (2) | AUM
Sep. 30, 2020 |
| Exchange Listed Products | | | | | | |
| - Physical Trusts | 9,181 | 890 | 1,060 | — | 11,131 | |
| - ETFs | 328 | 27 | 26 | — | 381 | |
| | 9,509 | 917 | 1,086 | — | 11,512 | |
| | | | | | | |
| Managed Equities | | | | | | |
| - Precious Metals Strategies | 2,279 | (57) | 225 | — | 2,447 | |
| - Other | 277 | 19 | 16 | — | 312 | |
| | 2,556 | (38) | 241 | — | 2,759 | |
| | | | | | | |
| Lending | 893 | 17 | 18 | (22) | 906 | (3) |
| | | | | | | |
| Other | 935 | — | 147 | — | 1,082 | |
| | | | | | | |
| Total | 13,893 | 896 | 1,492 | (22) | 16,259 | |
| | | | | | | |
| (1) See 'Net Inflows' in the key performance indicators (non-IFRS financial measures) section of this MD&A. | |
| (2) Includes new AUM from fund acquisitions and lost AUM from fund divestitures and capital distributions of our lending LPs. | |
| (3) $1.2 billion of committed capital remains uncalled, of which $0.5 billion earns a commitment fee (AUM), and $0.7 billion does not (future AUM). |
9 months results
| (In millions $) | AUM
Dec. 31, 2019 | Net
Inflows (1) | Market
Value
Changes | Other (2) | AUM
Sep. 30, 2020 |
| Exchange Listed Products | | | | | | |
| - Physical Trusts | 6,579 | 2,551 | 2,001 | — | 11,131 | |
| - ETFs | 252 | 46 | 83 | — | 381 | |
| | 6,831 | 2,597 | 2,084 | — | 11,512 | |
| | | | | | | |
| Managed Equities | | | | | | |
| - Precious Metals Strategies | 601 | (649) | 754 | 1,741 | 2,447 | |
| - Other | 350 | 16 | (54) | — | 312 | |
| | 951 | (633) | 700 | 1,741 | 2,759 | |
| | | | | | | |
| Lending | 783 | 166 | 23 | (66) | 906 | (3) |
| | | | | | | |
| Other | 688 | 139 | 255 | — | 1,082 | |
| | | | | | | |
| Total | 9,253 | 2,269 | 3,062 | 1,675 | 16,259 | |
| | | | | | | |
| (1) See 'Net Inflows' in the key performance indicators (non-IFRS financial measures) section of this MD&A. | |
| (2) Includes new AUM from fund acquisitions and lost AUM from fund divestitures and capital distributions of our lending LPs. | |
| (3) $1.2 billion of committed capital remains uncalled, of which $0.5 billion earns a commitment fee (AUM), and $0.7 billion does not (future AUM). |
| | | 12 |
KEY REVENUE LINES
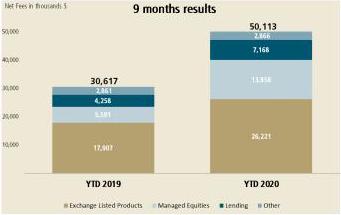
Management fees were $19.9 million in the quarter, up $9.4 million (88%) from the prior period and were $50.9 million on a year-to-date basis, up $20.2 million (66%). Net fees were $19.6 million in the quarter, up $9.1 million (87%) from the prior period and were $50.1 million on a year-to-date basis, up $19.5 million (64%). The increase in the quarter and on a year-to-date basis was due to strong net inflows in our exchange listed products segment and the Acquisition in our managed equities segment. We also benefited from higher fees in our lending segment as we continue to grow AUM in this area.
 | |  |
Commission revenues were $9.4 million in the quarter, up $3.3 million (55%) from the prior period and were $20.7 million on a year-to-date basis, up $8 million (63%). Net Commissions were $5.6 million in the quarter, up $2.2 million (65%) from the prior period and were $12.7 million on a year-to-date basis, up $5.4 million (74%). The increase in the quarter and on a year-to-date basis was due to strong equity origination, sales and trading activities in our brokerage segment.
Finance Income was $0.8 million in the quarter, down $1.8 million (70%) from the prior period and was $2.3 million on a year-to-date basis, down $6.6 million (74%). Finance income primarily includes interest income from legacy loans, interest income from our co-investments in LP units and other ancillary income earned directly or indirectly from lending activities. Lower finance income in the quarter and on a year-to-date basis was primarily due to the repayment of legacy balance sheet loans and higher capital distribution levels in our lending LPs in 2019.
| | | 13 |
KEY EXPENSE LINES
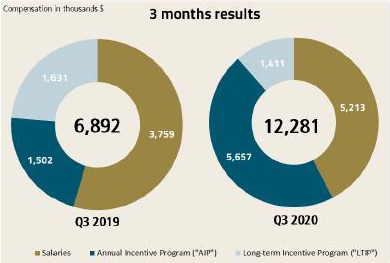
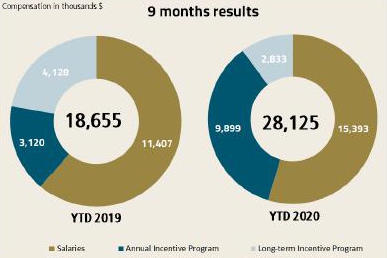
Compensation was $12.3 million in the quarter, up $5.4 million (78%) from the prior period and was $28.1 million on a year-to-date basis, up $9.5 million (51%). The increase in the quarter and on a year-to-date basis was primarily due to higher salaries from new hires related to the Acquisition and higher AIP on increased revenues and earnings across the Company. These increases were partially offset by lower LTIP amortization.
SG&A was $2.5 million in the quarter, down $0.7 million (21%) from the prior period and was $9.1 million on a year-to-date basis, down $0.4 million (4%). The decrease in the quarter and on a year-to-date basis was the result of lower marketing and sales costs relating to travel restrictions due to COVID-19.
EARNINGS
Net income was $8.7 million in the quarter, up $4.4 million from the prior period and was $20.3 million on a year-to-date basis, up $11.5 million. Adjusted base EBITDA was $12 million in the quarter, up $4.4 million (58%) from the the prior period and was $29.4 million on a year-to-date basis, up $7.9 million (36%).
During the quarter and on a year-to-date basis, we benefited from increased fees due to strong inflows and precious metals price appreciation in our exchange listed products segment and from the Acquisition in our managed equities segment. We also benefited from increased commission revenues in our brokerage segment. These increases more than offset lower finance income in our lending segment and higher compensation on increased revenues and earnings across the Company.
ADDITIONAL REVENUES AND EXPENSES
Investments gains were mainly due to market value appreciation of certain equity holdings and co-investments.
Other income was higher mainly due to the consolidation of certain feeder funds. Interest expense was largely flat from the prior period.
Placement and referral fees were higher mainly due to referral fees paid on higher placement activity in our brokerage segment.
Amortization of intangibles was flat from the prior period. Depreciation of property and equipment was higher from the prior period mainly due to increased depreciation expense related to a new lease attributable to the Acquisition.
Other expenses were higher primarily due to the increase in contingent consideration related to the Acquisition.
BALANCE SHEET
Total Assets were $358.3 million, up $33.4 million (10%) from December 31, 2019. The increase was primarily due to the increase in intangible assets related to the Acquisition.
Total Liabilities were $81.1 million, up $27.8 million (52%) from December 31, 2019. The increase was primarily due to the accrual of contingent consideration related to the Acquisition and accrued liabilities related to non-controlling interests.
Total Shareholder's Equity was $277.2 million, up $5.6 million (2%) from December 31, 2019.
| | | 14 |
REPORTABLE OPERATING SEGMENTS
Exchange Listed Products
| | | | | |
| | 3 months ended | 9 months ended |
| | | | | |
| | | | | |
| (In thousands $) | Sep. 30, 2020 | Sep. 30, 2019 | Sep. 30, 2020 | Sep. 30, 2019 |
| SUMMARY INCOME STATEMENT | | | | |
| Management fees | 11,208 | | 6,442 | | 26,221 | | 17,907 | |
| Other income | 1 | | 26 | | 9 | | 26 | |
| Total Revenues | 11,209 | | 6,468 | | 26,230 | | 17,933 | |
| | | | | |
| Compensation | 1,488 | | 1,026 | | 3,721 | | 2,687 | |
| Selling, general and administrative | 464 | | 647 | | 1,677 | | 2,095 | |
| Interest expense | 64 | | 254 | | 262 | | 623 | |
| Depreciation and amortization | 237 | | 238 | | 698 | | 713 | |
| Other expenses (gain) | 147 | | (175 | ) | (509 | ) | 335 | |
| Total Expenses | 2,400 | | 1,990 | | 5,849 | | 6,453 | |
| | | | | |
| Income before income taxes | 8,809 | | 4,478 | | 20,381 | | 11,480 | |
| Adjusted base EBITDA | 9,396 | | 4,994 | | 21,066 | | 13,413 | |
| Operating margin | 82 | % | 76 | % | 79 | % | 74 | % |
| | | | | |
| Total AUM | 11,512,310 | | 6,558,970 | | 11,512,310 | | 6,558,970 | |
| Average AUM | 11,919,859 | | 6,580,627 | | 9,290,867 | | 6,102,108 | |
3 and 9 months ended
Income before income taxes was $8.8 million in the quarter, up $4.3 million (97%) from the prior period and was $20.4 million on a year-to-date basis, up $8.9 million (78%). Adjusted base EBITDA was $9.4 million in the quarter, up $4.4 million (88%) from the prior period and was $21.1 million on a year-to-date basis, up $7.7 million (57%). Our three and nine months ended results benefited from higher average AUM given strong inflows and market value appreciation which more than offset higher compensation.
| | | 15 |
Managed Equities
| | 3 months ended | 9 months ended |
| (In thousands $) | Sep. 30, 2020 | Sep. 30, 2019 | Sep. 30, 2020 | Sep. 30, 2019 |
| SUMMARY INCOME STATEMENT | | | | |
| Management fees | 5,941 | | 1,986 | | 14,720 | | 5,804 | |
| less: Trailer and sub-advisor fees | 316 | | 83 | | 862 | | 213 | |
| Net Fees | 5,625 | | 1,903 | | 13,858 | | 5,591 | |
| Gain on investments | 4,240 | | 902 | | 8,084 | | 2,382 | |
| Other income | 202 | | 344 | | 558 | | 520 | |
| Total Net Revenues | 10,067 | | 3,149 | | 22,500 | | 8,493 | |
| | | | | |
| Compensation | 2,498 | | 935 | | 6,077 | | 3,516 | |
| Selling, general and administrative | 341 | | 517 | | 1,370 | | 1,263 | |
| Interest expense | 172 | | — | | 486 | | — | |
| Depreciation and amortization | 53 | | 52 | | 154 | | 161 | |
| Other expenses | 3,095 | | 30 | | 2,320 | | 180 | |
| Total Expenses | 6,159 | | 1,534 | | 10,407 | | 5,120 | |
| | | | | |
| Income before income taxes | 3,908 | | 1,615 | | 12,093 | | 3,373 | |
| Adjusted base EBITDA | 3,141 | | 899 | | 7,474 | | 2,376 | |
| Operating margin | 53 | % | 38 | % | 51 | % | 36 | % |
| | | | | |
| Total AUM | 2,758,676 | | 850,583 | | 2,758,676 | | 850,583 | |
| Average AUM | 2,874,082 | | 876,811 | | 2,620,610 | | 837,257 | |
3 and 9 months ended
Income before income taxes was $3.9 million in the quarter, up $2.3 million from the prior period and was $12.1 million on a year-to-date basis, up $8.7 million. Adjusted base EBITDA was $3.1 million in the quarter, up $2.2 million from the prior period and was $7.5 million on a year-to-date basis, up $5.1 million. Our three and nine months ended results benefited from increased management fees from the Acquisition and improved equity valuations in our funds, which more than offset higher compensation.
| | | 16 |
Lending
| | 3 months ended | 9 months ended |
| (In thousands $) | Sep. 30, 2020 | Sep. 30, 2019 | Sep. 30, 2020 | Sep. 30, 2019 |
| SUMMARY INCOME STATEMENT | | | | |
| Management fees | 2,221 | | 1,426 | | 7,168 | | 4,258 | |
| | | | | |
| | | | | |
| | | | | |
| Finance income (1) | 757 | | 2,205 | | 2,209 | | 7,701 | |
| Gain (loss) on investments | (451 | ) | 488 | | (25 | ) | (1,051 | ) |
| Other income | 8 | | 7 | | 83 | | 21 | |
| Total Revenues | 2,535 | | 4,126 | | 9,435 | | 10,929 | |
| | | | | |
| Compensation | 1,323 | | 1,407 | | 4,354 | | 3,749 | |
| Placement and referral fees | 123 | | 8 | | 151 | | 29 | |
| Selling, general and administrative | 194 | | 179 | | 569 | | 555 | |
| Interest expense | 5 | | 5 | | 11 | | 31 | |
| Depreciation and amortization | — | | 27 | | 52 | | 80 | |
| Other expenses (gain) | 481 | | (454 | ) | (789 | ) | 653 | |
| Total Expenses | 2,126 | | 1,172 | | 4,348 | | 5,097 | |
| | | | | |
| Income before income taxes | 409 | | 2,954 | | 5,087 | | 5,832 | |
| Adjusted base EBITDA | 1,522 | | 2,359 | | 4,849 | | 8,266 | |
| Operating margin | 60 | % | 33 | % | 57 | % | 52 | % |
| | | | | |
| Total AUM (2) | 905,844 | | 442,242 | | 905,844 | | 442,242 | |
| Average AUM | 898,030 | | 477,875 | | 857,369 | | 476,662 | |
(1) Includes: (1) co-investment income from lending LP units held as part of our co-investment portfolio; and (2) interest income from on-balance sheet loans in the prior period.
(2) $1.2 billion of committed capital remains uncalled, of which $0.5 billion earns a commitment fee (AUM), and $0.7 billion does not (future AUM).
3 and 9 months ended
Income before income taxes was $0.4 million in the quarter, down $2.5 million (86%) from the prior period and was $5.1 million on a year-to-date basis, down $0.7 million (13%). Adjusted base EBITDA was $1.5 million in the quarter, down $0.8 million (35%) from the prior period and was $4.8 million on a year-to-date basis, down $3.4 million (41%). Our three and nine months ended results were primarily impacted by lower finance income on higher capital distribution levels in 2019 and the full repayment of legacy loans in the third quarter of 2019. Lower finance income more than offset increased management fees in the period.
| | | 17 |
Brokerage
| | | | | |
| | 3 months ended | 9 months ended |
| | | | | |
| (In thousands $) | Sep. 30, 2020 | Sep. 30, 2019 | Sep. 30, 2020 | Sep. 30, 2019 |
| SUMMARY INCOME STATEMENT | | | | |
| Commissions | 9,198 | | 5,720 | | 19,823 | | 12,219 | |
| less: Commission expense | 3,789 | | 2,627 | | 8,036 | | 5,374 | |
| Net Commissions | 5,409 | | 3,093 | | 11,787 | | 6,845 | |
| Management fees | 557 | | 345 | | 1,282 | | 940 | |
| Finance income | — | | 356 | | 118 | | 1,241 | |
| Gain (loss) on investments | 433 | | (341 | ) | 1,585 | | (278 | ) |
| Other income | 3 | | 22 | | 78 | | 60 | |
| Total Net Revenues | 6,402 | | 3,475 | | 14,850 | | 8,808 | |
| | | | | |
| Compensation (1) | 1,790 | | 1,758 | | 4,824 | | 5,208 | |
| Placement and referral fees | 344 | | 86 | | 505 | | 318 | |
| Selling, general and administrative | 957 | | 1,148 | | 3,120 | | 3,464 | |
| Interest expense | 10 | | 14 | | 33 | | 45 | |
| Depreciation and amortization | 130 | | 137 | | 388 | | 355 | |
| Other expenses (gain) | 58 | | 18 | | 166 | | (27 | ) |
| Total Expenses | 3,289 | | 3,161 | | 9,036 | | 9,363 | |
| | | | | |
| Income (loss) before income taxes | 3,113 | | 314 | | 5,814 | | (555 | ) |
| Adjusted base EBITDA | 3,030 | | 1,410 | | 5,530 | | 1,586 | |
| Operating margin | 57 | % | 37 | % | 48 | % | 16 | % |
(1) Compensation is presented excluding commission expense, which is reported net of commission revenue.
3 and 9 months ended
Income before income taxes was $3.1 million in the quarter, up $2.8 million from the prior period and was $5.8 million on a year-to-date basis, up $6.4 million. Adjusted base EBITDA was $3 million in the quarter, up $1.6 million from the prior period and was $5.5 million on a year-to-date basis, up $3.9 million. Our three and nine months ended results benefited from strong equity origination, sales and trading activities.
| | | 18 |
Corporate
This segment is primarily a cost centre that provides capital, balance sheet management and shared services to the Company's subsidiaries.
| | | | | |
| | 3 months ended | 9 months ended |
| | | | | |
| (In thousands $) | Sep. 30, 2020 | Sep. 30, 2019 | Sep. 30, 2020 | Sep. 30, 2019 |
| SUMMARY INCOME STATEMENT | | | | |
| Gain (loss) on investments | 315 | | 59 | | (558 | ) | (557 | ) |
| Other income | 25 | | 23 | | 66 | | 45 | |
| Total Revenues | 340 | | 82 | | (492 | ) | (512 | ) |
| | | | | |
| Compensation | 4,660 | | 1,563 | | 9,101 | | 3,816 | |
| Selling, general and administrative | 264 | | 329 | | 1,368 | | 1,556 | |
| Interest expense | 69 | | 24 | | 114 | | 68 | |
| Depreciation and amortization | 562 | | 432 | | 1,714 | | 1,211 | |
| Other expenses | 47 | | 233 | | 947 | | 324 | |
| Total Expenses | 5,602 | | 2,581 | | 13,244 | | 6,975 | |
| | | | | |
| Income (loss) before income taxes | (5,262 | ) | (2,499 | ) | (13,736 | ) | (7,487 | ) |
| Adjusted base EBITDA | (4,590 | ) | (1,744 | ) | (9,757 | ) | (5,245 | ) |
3 and 9 months ended
| • | Net investments gains and losses were due to market value fluctuations of certain equity holdings. |
| • | Compensation increased primarily due to the Acquisition and higher AIP accruals on increased revenue and earnings generation. |
| • | SG&A decreased due to our ongoing multi-year cost containment program. |
| • | Higher amortization was due to increased depreciation expense due to a new lease. |
| • | Other expenses were primarily due to FX translation movements (CAD-to-USD). |
| | | 19 |
Dividends
The following dividends were declared by the Company during the nine months ended September 30, 2020:
| Record date | Payment Date | Cash dividend
per share (1) | Total dividend amount
(in thousands $) |
| March 9, 2020 - Regular Dividend Q4 2019 | March 24, 2020 | CAD$0.30 | 5,387 | |
| May 19, 2020 - Regular Dividend Q1 2020 | June 3, 2020 | CAD$0.30 | 5,560 | |
| August 17, 2020 - Regular Dividend Q2 2020 | September 1, 2020 | US$0.23 | 5,915 | |
| Dividends (2) | | | 16,862 | |
| (1) | Dividends per share in this MD&A for periods before May 28 reflect retrospective treatment of the 10:1 share consolidation. |
| (2) | Subsequent to quarter-end, on November 12, 2020, a regular dividend was declared and increased to US$0.25 per common share for the quarter ended September 30, 2020. This dividend is payable on December 8, 2020 to shareholders of record at the close of business on November 23, 2020. |
Capital Stock
On May 28, 2020, the Company successfully completed a 10:1 common share consolidation. Shareholders received 1 post-consolidation share for every 10 pre-consolidation shares. All information pertaining to shares and per-share amounts in this MD&A for periods before May 28 reflect retrospective treatment of this share consolidation.
Including the 1 million unvested common shares currently held in the EPSP Trust (December 31, 2019 - 0.9 million), total capital stock issued and outstanding was 25.5 million (December 31, 2019 - 25.3 million).
Earnings per share for the current and prior periods have been calculated using the weighted average number of shares outstanding during the respective periods. Basic earnings per share was $0.36 for the quarter and $0.83 on a year-to-date basis compared to $0.18 and $0.36 in the prior periods respectively. Diluted earnings per share was $0.34 in the quarter and $0.79 on a year-to-date basis compared to $0.17 and $0.34 in the prior periods respectively. Diluted earnings per share reflects the dilutive effect of in-the-money stock options, unvested shares held in the EPSP Trust and outstanding restricted stock units.
A total of 177,500 stock options are outstanding pursuant to our stock option plan, all of which are exercisable.
| | | 20 |
Liquidity and Capital Resources
As at September 30, 2020, the Company had $17.4 million (December 31, 2019 - $15.3 million) outstanding on its credit facility, $3.7 million of which is due within 12 months and $13.7 million is due after 12 months (December 31, 2019 - $3.8 million and $11.5 million respectively).
The Company has a 5 year, CAD$90 million credit facility with a major Canadian schedule I chartered bank. The facility consists of a CAD$25 million term loan and a CAD$65 million revolving line of credit. Amounts may be borrowed under the facility through prime rate loans or bankers’ acceptances. Amounts may also be borrowed in US dollars through base rate loans. In 2019, the Company drew CAD$25 million on the term loan portion of the credit facility to avoid its expiry and to partially fund anticipated growth in the business over the next 12-18 months. As at September 30, 2020, the Company was in compliance with all covenants, terms and conditions under the credit facility. Key terms under the credit facility are noted below:
Structure
| · | 5-year, CAD$65 million revolver with "bullet maturity" December 31, 2022 |
| · | 5-year, CAD$25 million term loan with 5% of principal amortizing quarterly, with the remaining balance maturing on December 31, 2022 |
Interest Rate
| · | Banker Acceptance Rate + 170 bps |
Covenant Terms
| · | Minimum AUM: CAD$8.2 billion |
| · | Debt to EBITDA less than 2.5:1 |
| · | EBITDA to interest expense more than 2.5:1 |
Commitments
Besides the Company's long-term lease agreements, there are commitments to make co-investments in lending LPs arising from our lending segment or commitments to make investments in the net investments portfolio of the Company. As at September 30, 2020, the Company had $6.1 million in co-investment commitments from the lending segment (December 31, 2019 - $6.6 million).
| | | 21 |
Significant Accounting Judgments, Estimates and Changes in Accounting Policies
The interim financial statements have been prepared in accordance with IFRS standards in effect as at September 30, 2020, specifically, IAS 34 Interim Financial Reporting.
Compliance with IFRS requires the Company to exercise judgment, make estimates and assumptions that affect the reported amount of assets and liabilities and disclosure of contingent assets and liabilities at the date of the financial statements and the reported amounts of revenues and expenses during the reporting period. Actual results may vary. Except as otherwise noted, significant accounting judgments and estimates are described in Note 2 of the December 31, 2019 annual audited financial statements and have been applied consistently to the interim financial statements as at and for the three and nine months ended September 30, 2020.
Change in presentation currency
Effective January 1, 2020, the Company changed its presentation currency from Canadian to US dollars to better reflect the Company's business activities, given the significance of our revenues denominated in US dollars that further increased in 2020 with the January 17, 2020 close of the Acquisition.
The Company followed the guidance of IAS 21 Effects of Changes in Foreign Exchange Rates ("IAS 21") and have applied the change retroactively. As a result, the Company has restated prior year comparatives, including the January 1 opening balance sheet as required by IFRS 1 First-time Adoption of International Financial Reporting Standards ("IFRS 1"). The change in presentation currency had the following effect:
| · | Assets and liabilities have been translated at the exchange rate on the respective reporting dates; |
| · | Equity transactions have been translated at the historical exchange rate at the date of the transaction; |
| · | The statements of operations has been translated at the average exchange rate on the respective reporting dates; |
| · | Exchange differences arising on translation are presented in the Accumulated other comprehensive loss line in shareholders' equity on the balance sheet. |
Contingent consideration
The Acquisition necessitated the recognition of contingent consideration for the amounts payable in cash and shares under the terms of the purchase agreement. The cash settled portion of the contingent consideration has been measured at the closing date fair value, based on management’s estimate of the level of future revenue obtained from the contracts over the contingent consideration measurement period. The equity settled portion of the contingent consideration has been measured at its grant date fair value in accordance with the requirements of IFRS 2 Share-based Payment. The key judgments utilized in the estimation of the contingent consideration were fund flow assumptions. As at September 30, 2020, the contingent consideration was updated to reflect current estimates with the resulting adjustment recorded in other expenses.
| | | 22 |
Managing Risk: Financial
COVID-19 risk
The changing economic and market climate as a result of COVID-19 has led to the Company implementing its business continuity plan. Our portfolio managers, brokerage professionals, enterprise shared services teams and key outsource service providers are fully operational. While the exact impacts of COVID-19 over the short and long-term are undeterminable at the date of this report, management believes the effects of COVID-19 we have witnessed thus far, and in particular, world government responses thereto via fiscal and monetary policy, will continue to be highly constructive to precious metals markets.
Market risk
The Company separates market risk into three categories: price risk, interest rate risk and foreign currency risk.
Price risk
Price risk arises from the possibility that changes in the price of the Company's on and off-balance sheet assets and liabilities will result in changes in carrying value or recoverable amounts. The Company's revenues are also exposed to price risk since management fees, carried interests and performance fees are correlated with AUM, which fluctuates with changes in the market values of the assets in the funds and managed accounts managed by the Company.
Interest rate risk
Interest rate risk arises from the possibility that changes in interest rates will adversely affect the value of, or cash flows from, financial instrument assets. The Company’s earnings, particularly through its lending segment, are exposed to volatility as a result of sudden changes in interest rates. Management takes into account a number of factors and is committed to several processes to ensure that this risk is appropriately managed.
Foreign currency risk
The Company enters into transactions that are denominated primarily in US dollar and Canadian dollar. Foreign currency risk arises from foreign exchange rate movements that could negatively impact either the carrying value of financial assets and liabilities or the related cash flows which are denominated in currencies other than the functional currency of the Company and its subsidiaries. The Company may employ certain hedging strategies to mitigate foreign currency risk.
Credit risk
Credit risk is the risk that a borrower will not honor its commitments and a loss to the Company may result. Credit risk generally arises in the Company's investments portfolio.
Investments
The Company incurs credit risk when entering into, settling and financing transactions with counterparties. Management takes into account a number of factors and is committed to several processes to ensure that this risk is appropriately managed.
Other
The majority of accounts receivable relate to management fees, carried interest and performance fees receivable from the funds, managed accounts and managed companies managed by the Company. These receivables are short-term in nature and any credit risk associated with them is managed by dealing with counterparties that the Company believes to be creditworthy and by actively monitoring credit exposure and the financial health of the counterparties.
| | | 23 |
Liquidity risk
Liquidity risk is the risk that the Company cannot meet a demand for cash or fund its obligations as they come due. The Company's exposure to liquidity risk is minimal as it maintains sufficient levels of liquid assets to meet its obligations as they come due. Additionally, the Company has access to a CAD$90 million committed line of credit with a major Canadian schedule I chartered bank. As part of its cash management program, the Company primarily invests in short-term debt securities issued by the Government of Canada with maturities of less than three months.
The Company's exposure to liquidity risk as it relates to our co-investments in lending LPs arises from fluctuations in cash flows from making capital calls and receiving capital distributions. The Company manages its loan co-investment liquidity risk through the ongoing monitoring of scheduled capital calls and distributions ("match funding") and through its broader treasury risk management program and enterprise capital budgeting.
Financial liabilities, including accounts payable and accrued liabilities and compensation and employee bonuses payable, are short-term in nature and are generally due within a year.
The Company's management team is responsible for reviewing resources to ensure funds are readily available to meet its financial obligations as they come due, as well as ensuring adequate funds exist to support business strategies and operations growth. The Company manages liquidity risk by monitoring cash balances on a daily basis and through its broader treasury risk management program. To meet any liquidity shortfalls, actions taken by the Company could include: slowing its co-investment activities; adjust or otherwise temporarily suspend AIPs; cut or temporarily suspend its dividend; drawing on the line of credit; liquidating net investments; and/or issuing common shares.
Concentration risk
A significant portion of the Company's AUM as well as its investments are focused on the natural resource sector, and in particular, precious metals related investments and transactions. In addition, from time-to-time, certain investment may be concentrated to a material degree in a single position or group of positions. Management takes into account a number of factors and is committed to several processes to ensure that this risk is appropriately managed.
Disclosure Controls and Procedures ("DC&P") and Internal Control over Financial Reporting ("ICFR")
Management is responsible for the design and operational effectiveness of DC&P and ICFR in order to provide reasonable assurance regarding the disclosure of material information relating to the Company. This includes information required to be disclosed in the Company's annual filings, interim filings and other reports filed under securities legislation, as well as the reliability of financial reporting and the preparation of financial statements for external purposes in accordance with IFRS.
Consistent with National Instrument 52-109, the Company's CEO and CFO evaluate quarterly the DC&P and ICFR. As at September 30, 2020, the Company's CEO and CFO concluded that the Company's DC&P and ICFR were properly designed and were operating effectively. In addition, there were no material changes to ICFR during the quarter, and the implementation of our business continuity plan as a result of COVID-19 has not prevented the normal function of our internal controls.
Managing Risk: Non-financial
For details around other risks managed by the Company (e.g. confidentiality of information, conflicts of interest, etc.) refer to the Company's annual report as well as the Annual Information Form available on SEDAR at www.sedar.com.
Additional information relating to the Company, including the Company's Annual Information Form is available on SEDAR at www.sedar.com
| | | 24 |
Consolidated Financial Statements
Three and nine months ended September 30, 2020
| | | 25 |
INTERIM CONDENSED CONSOLIDATED BALANCE SHEETS (UNAUDITED)
| | | | | |
| As at | | Sep. 30 | Dec. 31 | Jan. 1 |
| (In thousands of US dollars) | | 2020 | 2019 | 2019 |
| | | | | |
| Assets | | | (Note 2) | (Note 2) |
| Current | | | | |
| Cash and cash equivalents | | 49,889 | | 54,748 | | 34,637 | |
| Fees receivable | | 9,964 | | 8,682 | | 6,330 | |
| Loans receivable | | — | | — | | 11,197 | |
| Short-term investments | (Notes 3 & 9) | 13,123 | | 17,495 | | 19,580 | |
| Other assets | (Note 6) | 9,054 | | 12,980 | | 7,893 | |
| Income taxes recoverable | | 1,235 | | 1,439 | | 1,744 | |
| Total current assets | | 83,265 | | 95,344 | | 81,381 | |
| | | | | |
| Loans receivable | | — | | — | | 15,207 | |
| Co-investments | (Note 4 & 9) | 67,378 | | 55,595 | | 56,894 | |
| Other assets | (Note 6 & 9) | 21,109 | | 20,276 | | 19,175 | |
| Property and equipment, net | | 15,773 | | 16,230 | | 16,392 | |
| Intangible assets | (Note 5) | 148,951 | | 114,078 | | 108,726 | |
| Goodwill | (Note 5) | 19,149 | | 19,149 | | 19,149 | |
| Deferred income taxes | (Note 8) | 2,675 | | 4,271 | | 4,322 | |
| | | 275,035 | | 229,599 | | 239,865 | |
| Total assets | | 358,300 | | 324,943 | | 321,246 | |
| | | | | |
| Liabilities and shareholders' equity | | | | |
| Current | | | | |
| Accounts payable and accrued liabilities | | 35,917 | | 23,618 | | 32,106 | |
| Compensation payable | | 10,387 | | 6,912 | | 6,939 | |
| Obligations related to securities sold short | | — | | — | | 187 | |
| Loan facility | (Note 13) | 3,704 | | 3,829 | | — | |
| Income taxes payable | | 3,575 | | 807 | | 445 | |
| Total current liabilities | | 53,583 | | 35,166 | | 39,677 | |
| Other accrued liabilities | | 10,524 | | 4,247 | | 5,769 | |
| Loan facility | (Note 13) | 13,658 | | 11,486 | | — | |
| Deferred income taxes | (Note 8) | 3,304 | | 2,414 | | 2,291 | |
| Total liabilities | | 81,069 | | 53,313 | | 47,737 | |
| | | | | |
| Shareholders' equity | | | | |
| Capital stock | (Note 7) | 412,461 | | 407,900 | | 407,775 | |
| Contributed surplus | (Note 7) | 46,870 | | 43,160 | | 42,964 | |
| Deficit | | (104,826) | | (108,222) | | (95,422) | |
| Accumulated other comprehensive loss | | (77,274) | | (71,208) | | (81,808) | |
| Total shareholders' equity | | 277,231 | | 271,630 | | 273,509 | |
| Total liabilities and shareholders' equity | | 358,300 | | 324,943 | | 321,246 | |
| | | | | |
| Commitments and provisions | (Note 14) | | | |
| | | | | |
| The accompanying notes form part of the consolidated financial statements | | | |
| | | | |
| "Ron Dewhurst" | "Sharon Ranson, FCPA, FCA" | |
| Director | Director | |
| | | |
| | | 26 |
INTERIM CONDENSED CONSOLIDATED STATEMENTS OF OPERATIONS AND COMPREHENSIVE INCOME (UNAUDITED)
| | | | | | | | | | |
| | | For the three months ended | | For the nine months ended | |
| | | | | | | | | | |
| | | Sep. 30 | | Sep. 30 | | Sep. 30 | | Sep. 30 | |
| (In thousands of US dollars, except for per share amounts) | 2020 | | 2019 | | 2020 | | 2019 | |
| | | | | | | | | | |
| | | | | | | (Note 2) | | | | | | (Note 2) | |
| Revenues | | | | | | | | | | | | | |
| Management fees | | | 19,934 | | | 10,577 | | | 50,884 | | | 30,734 | |
| Commissions | | | 9,386 | | | 6,056 | | | 20,698 | | | 12,664 | |
| Finance income | | | 757 | | | 2,561 | | | 2,327 | | | 8,942 | |
| Gain on investments | (Note 3 & 4) | | 4,408 | | | 600 | | | 8,198 | | | 197 | |
| Other income | (Note 6) | | 914 | | | 91 | | | 1,312 | | | 261 | |
| Total revenue | | | 35,399 | | | 19,885 | | | 83,419 | | | 52,798 | |
| | | | | | | | | | | | | | |
| Expenses | | | | | | | | | | | | | |
| Compensation | | | 14,869 | | | 8,083 | | | 34,563 | | | 20,850 | |
| Stock-based compensation | (Note 7) | | 1,411 | | | 1,631 | | | 2,833 | | | 4,128 | |
| Trailer and sub-advisor fees | | | 291 | | | 50 | | | 771 | | | 117 | |
| Placement and referral fees | | | 522 | | | 114 | | | 854 | | | 423 | |
| Selling, general and administrative | | | 2,523 | | | 3,175 | | | 9,116 | | | 9,493 | |
| Interest expense | | | 320 | | | 297 | | | 906 | | | 767 | |
| Amortization of intangibles | (Note 5) | | 219 | | | 221 | | | 645 | | | 658 | |
| Depreciation of property and equipment | | | 773 | | | 672 | | | 2,384 | | | 1,883 | |
| Other expenses | (Note 6) | | 4,154 | | | (167 | ) | | 5,966 | | | 3,922 | |
| Total expenses | | | 25,082 | | | 14,076 | | | 58,038 | | | 42,241 | |
| Income before income taxes for the period | | | 10,317 | | | 5,809 | | | 25,381 | | | 10,557 | |
| Provision for income taxes | (Note 8) | | 1,613 | | | 1,473 | | | 5,123 | | | 1,793 | |
| Net income for the period | | | 8,704 | | | 4,336 | | | 20,258 | | | 8,764 | |
| Net Income per share: | | | | | | | | | | | | | |
| Basic(1) | (Note 7) | $ | 0.36 | | $ | 0.18 | | $ | 0.83 | | $ | 0.36 | |
| Diluted(1) | (Note 7) | $ | 0.34 | | $ | 0.17 | | $ | 0.79 | | $ | 0.34 | |
| | | | | | | | | | | | | | |
| Net income for the period | | | 8,704 | | | 4,336 | | | 20,258 | | | 8,764 | |
| Other comprehensive income (loss) | | | | | | | | | | | | | |
| Items that may be reclassified subsequently to profit or loss | | | | | | | | | | | | | |
| Foreign currency translation gain (loss) on foreign operations (taxes of $Nil) | | | 5,129 | | | 3,119 | | | (6,066 | ) | | 7,105 | |
| Total other comprehensive income (loss) | | | 5,129 | | | 3,119 | | | (6,066 | ) | | 7,105 | |
| Comprehensive income | | | 13,833 | | | 7,455 | | | 14,192 | | | 15,869 | |
| | | | | | | | | | | | | | |
| The accompanying notes form part of the consolidated financial statements | | | | | | | | | | | | |
(1) Amounts reflect retrospective application of the May 28, 2020 share consolidation (see Note 7).
| | | 27 |
INTERIM CONDENSED CONSOLIDATED STATEMENTS OF CHANGES IN SHAREHOLDERS' EQUITY (UNAUDITED)
| (In thousands of US dollars, other than number of shares) | | Number of
Shares
Outstanding (1) | | Capital
Stock | | Contributed
Surplus | | Deficit | | Accumulated
Other
Comprehensive
Income | | Total
Equity | |
| | | | | | | | | | | | | | |
| At Dec. 31, 2019 | | 24,417,639 | | 407,900 | | 43,160 | | (108,222 | ) | (71,208 | ) | 271,630 | |
| Shares acquired for equity incentive plan | (Note 7) | (128,304 | ) | (2,514 | ) | — | | — | | — | | (2,514 | ) |
| Issuance of share capital on purchase of management contracts | (Note 7) | 104,720 | | 2,500 | | | | — | | — | | 2,500 | |
| Share-based contingent consideration related to the Acquisition | (Note 7) | — | | — | | 4,879 | | — | | — | | 4,879 | |
| Shares released on vesting of equity incentive plan | (Note 7) | 10,084 | | 288 | | (288 | ) | — | | — | | — | |
| Issuance of share capital on exercise of stock options | (Note 7) | 150,000 | | 5,159 | | (2,655 | ) | | | | | 2,504 | |
| Shares acquired and canceled under normal course issuer bid | (Note 7) | (112,343 | ) | (2,024 | ) | — | | — | | — | | (2,024 | ) |
| Foreign currency translation gain (loss) on foreign operations | | — | | — | | — | | — | | (6,066 | ) | (6,066 | ) |
| Stock-based compensation | (Note 7) | — | | — | | 2,833 | | — | | — | | 2,833 | |
| Issuance of share capital on conversion of RSUs and other share based considerations | (Note 7) | 53,810 | | 1,059 | | (1,059 | ) | — | | — | | — | |
| Dividends declared | (Note 10) | 4,170 | | 93 | | — | | (16,862 | ) | — | | (16,769 | ) |
| | | | | | | | | | | | | | |
| Net income | | — | | — | | — | | 20,258 | | — | | 20,258 | |
| Balance, Sep. 30, 2020 | | 24,499,776 | | 412,461 | | 46,870 | | (104,826 | ) | (77,274 | ) | 277,231 | |
| | | | | | | | | | | | | | |
| At Dec. 31, 2018 | (Note 2) | 24,306,233 | | 407,775 | | 42,964 | | (95,422) | | (81,808) | | 273,509 | |
| Shares acquired for equity incentive plan | | (149,812 | ) | (4,185 | ) | — | | — | | — | | (4,185 | ) |
| Shares released on vesting of equity incentive plan | | 91,513 | | 1,661 | | (1,661 | ) | — | | — | | — | |
| Foreign currency translation gain (loss) on foreign operations | | — | | — | | — | | — | | 7,105 | | 7,105 | |
| Stock-based compensation | | — | | — | | 4,128 | | — | | — | | 4,128 | |
| Issuance of share capital on conversion of RSUs and other share based considerations | | 76,573 | | 1,549 | | (143 | ) | — | | — | | 1,406 | |
| Dividends declared | | 4,418 | | 109 | | — | | (17,167 | ) | — | | (17,058 | ) |
| | | | | | | | | | | | | | |
| Net income | | — | | — | | — | | 8,764 | | — | | 8,764 | |
| Balance, Sep. 30, 2019 | (Note 2) | 24,328,925 | | 406,909 | | 45,288 | | (103,825 | ) | (74,703 | ) | 273,669 | |
The accompanying notes form part of the consolidated financial statements
(1) Amounts reflect retrospective application of the May 28, 2020 share consolidation (see Note 7).
| | | 28 |
INTERIM CONDENSED CONSOLIDATED STATEMENTS OF CASH FLOWS (UNAUDITED)
| | | | |
| | | For the nine months ended |
| | | | |
| | | Sep. 30 | Sep. 30 |
| (In thousands of US dollars) | | 2020 | 2019 |
| | | | |
| Operating Activities | | | (Note 2) |
| Net income for the period | | 20,258 | | 8,764 | |
| Add (deduct) non-cash items: | | | |
| Loss (gain) on net proprietary investments | | (8,198 | ) | (197 | ) |
| Stock-based compensation | | 2,833 | | 4,128 | |
| Depreciation and amortization of property, equipment and intangible assets | | 3,029 | | 2,541 | |
| Deferred income tax expense | | 2,436 | | 820 | |
| Current income tax expense | | 2,687 | | 973 | |
| Other items | | (936 | ) | 414 | |
| Income taxes paid | | — | | (1,898 | ) |
| Changes in: | | | |
| Fees receivable | | (1,282 | ) | (337 | ) |
| Loans receivable | | — | | 24,229 | |
| Other assets | | 3,093 | | (1,086 | ) |
| Accounts payable, accrued liabilities and compensation payable | | 4,004 | | (10,081 | ) |
| Cash provided by (used in) operating activities | | 27,924 | | 28,270 | |
| | | | |
| Investing Activities | | | |
| Purchase of investments | | (15,535 | ) | (23,093 | ) |
| Sale of investments | | 15,536 | | 36,646 | |
| Purchase of property and equipment | | (374 | ) | (2,982 | ) |
| Purchase of management contracts | | (12,500 | ) | — | |
| Cash provided (used in) investing activities | | (12,873 | ) | 10,571 | |
| | | | |
| Financing Activities | | | |
| Acquisition of common shares for equity incentive plan | | (2,514 | ) | (4,185 | ) |
| Acquisition of common shares under normal course issuer bid | | (2,024 | ) | — | |
| Issuance of shares under stock options plan | | 2,504 | | — | |
| Repayment of lease liabilities | | (1,401 | ) | (1,179 | ) |
| Contributions from non-controlling interests | | 2,395 | | — | |
| Net advances from loan facility | | 2,294 | | 15,974 | |
| Dividends paid | | (16,769 | ) | (17,058 | ) |
| Cash provided by (used in) financing activities | | (15,515 | ) | (6,448 | ) |
| Effect of foreign exchange on cash balances | | (4,395 | ) | 470 | |
| Net increase (decrease) in cash and cash equivalents during the period | | (4,859 | ) | 32,863 | |
| Cash and cash equivalents, beginning of the year | | 54,748 | | 34,637 | |
| Cash and cash equivalents, end of the period | | 49,889 | | 67,500 | |
| Cash and cash equivalents: | | | |
| Cash | | 44,467 | | 63,517 | |
| Short-term deposits | | 5,422 | | 3,983 | |
| | | 49,889 | | 67,500 | |
| | | | |
| The accompanying notes form part of the consolidated financial statements | | | |
| | | 29 |
SPROTT INC.
NOTES TO THE INTERIM CONDENSED CONSOLIDATED FINANCIAL STATEMENTS (UNAUDITED)
For the three and nine months ended September 30, 2020 and 2019
Sprott Inc. (the "Company") was incorporated under the Business Corporations Act (Ontario) on February 13, 2008. Its registered office is at Royal Bank Plaza, South Tower, 200 Bay Street, Suite 2600, Toronto, Ontario M5J 2J1.
| 2 | SUMMARY OF SIGNIFICANT ACCOUNTING POLICIES |
Statement of compliance
The interim condensed consolidated financial statements have been prepared in accordance with IFRS standards in effect as at September 30, 2020, specifically, IAS 34 Interim Financial Reporting.
Compliance with IFRS requires the Company to exercise judgment and make estimates and assumptions that affect the reported amount of assets and liabilities and disclosure of contingent assets and liabilities at the date of the financial statements and the reported amounts of revenues and expenses during the reporting period. Actual results may vary. Except as otherwise noted, significant accounting judgments and estimates are described in Note 2 of the December 31, 2019 annual audited financial statements and have been applied consistently to the interim financial statements as at and for the three and nine months ended September 30, 2020.
Basis of presentation
These interim financial statements have been prepared on a going concern basis and on a historical cost basis, except for financial assets and financial liabilities classified as fair value through profit or loss ("FVTPL") or fair value through other comprehensive income ("FVOCI"), both of which have been measured at fair value. The financial statements are presented in US dollars and all values are rounded to the nearest thousand ($000), except when indicated otherwise.
Principles of consolidation
These interim financial statements of the Company are prepared on a consolidated basis so as to include the accounts of all limited partnerships and corporations the Company is deemed to control under IFRS. Controlled limited partnerships and corporations ("subsidiaries") are consolidated from the date the Company obtains control. All intercompany balances with subsidiaries are eliminated upon consolidation. Subsidiary financial statements are prepared over the same reporting period as the Company and are based on accounting policies consistent with that of the Company.
During the quarter, the Company commenced consolidation of certain feeder funds due to them becoming material. The Company records third-party interests in the funds which do not qualify to be equity due to redeemable or limited life features, as non-controlling interest liabilities. Such interests are initially recognized at fair value, with any changes recorded as Other expense.
Control exists if the Company has power over the entity, exposure or rights to variable returns from its involvement with the entity and the ability to use its power over the entity to affect the amount of returns the Company receives. In many, but not all instances, control will exist when the Company owns more than one half of the voting rights of a corporation, or is the sole limited and general partner of a limited partnership.
| | | 30 |
SPROTT INC.
NOTES TO THE INTERIM CONDENSED CONSOLIDATED FINANCIAL STATEMENTS (UNAUDITED)
For the three and nine months ended September 30, 2020 and 2019
The Company currently controls the following principal subsidiaries:
| • | Sprott Asset Management LP ("SAM"); |
| | |
| • | Sprott Capital Partners LP ("SCP"); |
| | |
| • | Sprott Asia LP ("Sprott Asia") and Sprott Korea Corporation ("Sprott Korea"); |
| | |
| • | Sprott U.S. Holdings Inc. ("SUSHI"), parent of: (1) Rule Investments Inc. ("RII"); (2) Sprott Global Resource Investments Ltd. ("SGRIL"); (3) Sprott Asset Management USA Inc. ("SAM US"); and (4) Resource Capital Investment Corporation ("RCIC"). Collectively, the interests of SUSHI are referred to as "Global" in these financial statements; |
| | |
| • | Sprott Resource Lending Corp. ("SRLC"); |
| | |
| • | Sprott Inc. 2011 Employee Profit Sharing Plan Trust (the "Trust"). |
Changes in accounting policies
Change in presentation currency
Effective January 1, 2020, the Company changed its presentation currency from CAD to USD to better reflect the Company's business activities, given the significance of our revenues denominated in US dollars that further increased in 2020 with the January 17, 2020 close of Tocqueville Asset Management's gold strategies ("the Acquisition").
The Company followed the guidance of IAS 21 Effects of Changes in Foreign Exchange Rates ("IAS 21") and have applied the change retroactively. As a result, the Company has restated prior year comparatives, including the January 1 opening balance sheet as required by IFRS 1 First-Time Adoption of International Financial Reporting Standards ("IFRS 1"). The change in presentation currency had the following effect:
| • | Assets and liabilities have been translated at the exchange rate on the respective reporting dates; |
| | |
| • | Equity transactions have been translated at the historical exchange rate at the date of the transaction; |
| | |
| • | The statements of operations has been translated at the average exchange rate on the respective reporting dates; |
| | |
| • | Exchange differences arising on translation are presented in the accumulated other comprehensive loss line in shareholders' equity on the balance sheet. |
The exchange rates used for prior periods were as follows:
| | Dec. 31, 2019 | | Sep. 30, 2019 | | Jun. 30, 2019 | | Mar. 31, 2019 | | Jan. 1, 2019 | |
| As at reporting date | 1.31 | | 1.32 | | 1.31 | | 1.34 | | 1.36 | |
| Average rate for the 3 month ended | 1.32 | | 1.32 | | 1.34 | | 1.33 | | 1.32 | |
Contingent consideration
The Acquisition necessitated the recognition of contingent consideration for the amounts payable in cash and shares under the terms of the purchase agreement. The cash settled portion of the contingent consideration was measured at the closing date fair value, based on management’s estimate of the level of future revenue obtained from the contracts over the contingent consideration measurement period. The equity settled portion of the contingent consideration was measured at its grant date fair value in accordance with the requirements of IFRS 2 Share-based Payment. The key judgments utilized in the estimation of the contingent consideration were fund flow assumptions. As at September 30, 2020, the contingent consideration payable was updated to reflect current estimates with the resulting adjustment recorded in Other expense.
Other accounting policies
All other accounting policies, judgments, and estimates described in the annual audited financial statements have been applied consistently to these consolidated interim financial statements unless otherwise noted.
| | | 31 |
SPROTT INC.
NOTES TO THE INTERIM CONDENSED CONSOLIDATED FINANCIAL STATEMENTS (UNAUDITED)
For the three and nine months ended September 30, 2020 and 2019
Short-term investments
Primarily consist of equity investments in public and private entities we target through our lending, managed equities and brokerage segments (in thousands $):
| | Classification and
measurement criteria | Sep. 30, 2020 | | Dec. 31, 2019 | |
| | | | | | |
| Public equities and share purchase warrants | FVTPL | 9,724 | | 10,520 | |
| Fixed income securities | FVTPL | 1,576 | | 4,220 | |
| Private holdings: | | | | | |
| - Private investments | FVTPL | 1,823 | | 1,864 | |
| - Energy contracts | Non-financial instrument | — | | 891 | |
| Total short-term investments | | 13,123 | | 17,495 | |
Gains and losses on financial assets and liabilities classified at FVTPL are included in the gain (loss) on investments on the consolidated statements of operations.
Co-investments
Consists of the following (in thousands $):
| | | | |
| | Classification and measurement criteria | Sep. 30, 2020 | Dec. 31, 2019 |
| | | | |
| Co-investments in funds | FVTPL | 67,378 | | 55,595 | |
| Total co-investments | | 67,378 | | 55,595 | |
Gains and losses on co-investments in funds are included in the gain (loss) on investments on the consolidated statements of operations.
| | | 32 |
SPROTT INC.
NOTES TO THE INTERIM CONDENSED CONSOLIDATED FINANCIAL STATEMENTS (UNAUDITED)
For the three and nine months ended September 30, 2020 and 2019
| 5 | GOODWILL AND INTANGIBLE ASSETS |
Consist of the following (in thousands $):
| | Goodwill | Fund management contracts (indefinite life) | Fund management contracts (finite life) | Total |
| Cost | | | | |
| At Dec. 31, 2018 | 132,251 | | 97,744 | | 34,768 | | 264,763 | |
| Additions | — | | 1,376 | | — | | 1,376 | |
| Net exchange differences | — | | 4,350 | | 1,540 | | 5,890 | |
| At Dec. 31, 2019 | 132,251 | | 103,470 | | 36,308 | | 272,029 | |
| Additions | — | | 36,107 | | — | | 36,107 | |
| Net exchange differences | — | | (318 | ) | (271 | ) | (589 | ) |
| At Sep. 30, 2020 | 132,251 | | 139,259 | | 36,037 | | 307,547 | |
| | | | | |
| Accumulated amortization | | | | |
| At Dec. 31, 2018 | (113,102 | ) | — | | (23,753 | ) | (136,855 | ) |
| Amortization charge for the period | — | | — | | (879 | ) | (879 | ) |
| Net exchange differences | — | | — | | (1,068 | ) | (1,068 | ) |
| At Dec. 31, 2019 | (113,102 | ) | — | | (25,700 | ) | (138,802 | ) |
| Amortization charge for the period | — | | — | | (645 | ) | (645 | ) |
| At Sep. 30, 2020 | (113,102 | ) | — | | (26,345 | ) | (139,447 | ) |
| | | | | |
| Net book value at: | | | | |
| Dec. 31, 2019 | 19,149 | | 103,470 | | 10,608 | | 133,227 | |
| Sep. 30, 2020 | 19,149 | | 139,259 | | 9,692 | | 168,100 | |
| | | 33 |
SPROTT INC.
NOTES TO THE INTERIM CONDENSED CONSOLIDATED FINANCIAL STATEMENTS (UNAUDITED)
For the three and nine months ended September 30, 2020 and 2019
Impairment assessment of goodwill
The Company has identified 5 cash generating units ("CGU") as follows:
| • | Exchange Listed Products |
As at September 30, 2020, the Company had allocated $19.1 million (December 31, 2019 - $19.1 million) of goodwill on a relative value approach basis to the exchange listed products and managed equities CGUs.
In the normal course, goodwill is tested for impairment once per annum, which for the Company is during the fourth quarter of each year or earlier if there are indicators of impairment. During the quarter, there were no indicators of impairment in either the exchange listed products CGU or the managed equities CGU.
Impairment assessment of indefinite life fund management contracts
As at September 30, 2020, the Company had indefinite life intangibles related to fund management contracts of $139.3 million (December 31, 2019 - $103.5 million). The addition during the year relates to the Acquisition. The cost of the intangible asset was recorded at the fair value of consideration transferred, including contingent consideration (see Note 2) and the acquisition costs directly attributable to the transfer of the management contracts (see Note 6). There were no indicators of impairment as at September 30, 2020.
Impairment assessment of finite life fund management contracts
As at September 30, 2020, the Company had exchange listed fund management contracts within the exchange listed products CGU of $9.7 million (December 31, 2019 - $10.6 million). There were no indicators of impairment as at September 30, 2020.
| | | 34 |
SPROTT INC.
NOTES TO THE INTERIM CONDENSED CONSOLIDATED FINANCIAL STATEMENTS (UNAUDITED)
For the three and nine months ended September 30, 2020 and 2019
| 6 | OTHER ASSETS, INCOME, EXPENSES AND NON-CONTROLLING INTERESTS |
Other assets
Consist of the following (in thousands $):
| | | |
| | Sep. 30, 2020 | Dec. 31, 2019 |
| | | |
| Digital gold strategies(1) | 17,347 | | 18,913 | |
| Fund recoveries and investment receivables | 5,744 | | 5,951 | |
| Assets attributable to non-controlling interests | 2,395 | | — | |
| Prepaid expenses | 2,266 | | 4,355 | |
| Other(2) | 2,411 | | 2,231 | |
| Deferred costs related to the Acquisition(3) | — | | 1,806 | |
| Total other assets | 30,163 | | 33,256 | |
(1) Digital gold strategies are financial instruments classified at FVTPL. Gains and losses are included in gain (loss) on investments on the consolidated statements of operations. These investments were reclassified from long-term investments to other assets.
(2) Other includes miscellaneous third-party receivables.
(3) Includes legal, proxy and investor relations costs.
Other income
Consist of the following (in thousands $):
| | | | | |
| | For the three months ended | For the nine months ended |
| | | | | |
| | Sep. 30, 2020 | Sep. 30, 2019 | Sep. 30, 2020 | Sep. 30, 2019 |
| | | | | |
| Investment income (1) | 482 | | 91 | | 880 | | 261 | |
| Income attributable to non-controlling interests | 432 | | — | | 432 | | — | |
| Total other income | 914 | | 91 | | 1,312 | | 261 | |
(1) Primarily includes miscellaneous investment fund income, syndication and trailer fee income.
Other expenses
Consist of the following (in thousands $):
| | | | | | | | | |
| | For the three months ended | | For the nine months ended | |
| | | | | | | | | |
| | Sep. 30, 2020 | | Sep. 30, 2019 | | Sep. 30, 2020 | | Sep. 30, 2019 | |
| | | | | | | | �� | |
| Costs related to energy assets | — | | 45 | | 798 | | 49 | |
| Foreign exchange losses (gains) | 475 | | (321) | | (653) | | 1,131 | |
| Increase in contingent consideration related to the Acquisition | 2,946 | | — | | 2,946 | | — | |
| Other (1) | 733 | | 109 | | 2,875 | | 2,742 | |
| Total other expenses | 4,154 | | (167) | | 5,966 | | 3,922 | |
| (1) | Includes net income attributable to non-controlling interest of $320 thousand and SG&A attributable to non-controlling interest of $112 thousand for the three and nine months ended September 30, 2020 (three and nine months ended September 30, 2019 - $Nil) as well as non-recurring professional fees and transaction costs. |
| | | 35 |
SPROTT INC.
NOTES TO THE INTERIM CONDENSED CONSOLIDATED FINANCIAL STATEMENTS (UNAUDITED)
For the three and nine months ended September 30, 2020 and 2019
Non-controlling interests
Non-controlling interests consist of third-party interests in our consolidated co-investments in funds. The following tables provide a summary of amounts attributable to these non-controlling interests:
| | Sep. 30, 2020 | | Dec. 31, 2019 |
| | | | |
| Assets | 2,395 | | — | |
| Liabilities - current(1) | (1,050) | | — | |
| Liabilities - long-term(1) | (1,345) | | — | |
(1) Current and long-term Liabilities attributable to non-controlling interest is included in accounts payable and accrued liabilities and other accrued liabilities respectively
| | | 36 |
SPROTT INC.
NOTES TO THE INTERIM CONDENSED CONSOLIDATED FINANCIAL STATEMENTS (UNAUDITED)
For the three and nine months ended September 30, 2020 and 2019
On May 28, 2020, the Company successfully completed a 10:1 common share consolidation. Shareholders received 1 post-consolidation share for every 10 pre-consolidation shares. All information pertaining to shares and per-share amounts in the financial statements for periods before May 28 reflect retrospective treatment of this share consolidation.
Capital stock and contributed surplus
The authorized and issued share capital of the Company consists of an unlimited number of common shares, without par value.
| | | |
| | Number
of shares | Stated value
(in thousands $) |
| | | |
| At Dec. 31, 2018 | 24,306,233 | | 407,775 | |
| Issuance of share capital under dividend reinvestment program | 6,151 | | 147 | |
| Acquired and cancelled under normal course issuer bid | (74,060) | | (1,715) | |
| Issuance of share capital on conversion of RSUs | 81,528 | | 1,654 | |
| Acquired for equity incentive plan | (182,612) | | (4,906) | |
| Released on vesting of equity incentive plan | 280,399 | | 4,945 | |
| At Dec. 31, 2019 | 24,417,639 | | 407,900 | |
| Shares acquired for equity incentive plan | (128,304) | | (2,514) | |
| Issuance of share capital on purchase of management contracts | 104,720 | | 2,500 | |
| Shares released on vesting of equity incentive plan | 10,084 | | 288 | |
| Issuance of share capital on exercise of stock options | 150,000 | | 5,159 | |
| Acquired and canceled under normal course issuer bid | (112,343) | | (2,024) | |
| Issuance of share capital on conversion of RSUs and other share based considerations | 53,810 | | 1,059 | |
| Issuance of share capital under dividend reinvestment program | 4,170 | | 93 | |
| At Sep. 30, 2020 | 24,499,776 | | 412,461 | |
Contributed surplus consists of: stock option expense; earn-out shares expense; equity incentive plans' expense; and additional purchase consideration.
| | |
| | Stated value
(in thousands $) |
| | |
| At Dec. 31, 2018 | 42,964 | |
| Expensing of Stock-based compensation over the vesting period | 5,392 | |
| Issuance of share capital on conversion of RSUs | (251) | |
| Released on vesting of common shares for equity incentive plan | (4,945) | |
| At Dec. 31, 2019 | 43,160 | |
| Share-based contingent consideration related to the Acquisition | 4,879 | |
| Released on vesting of common shares for equity incentive plan | (288) | |
| Released on exercise of Stock option plan | (2,655) | |
| Expensing of Stock-based compensation over the vesting period | 2,833 | |
| Issuance of share capital on conversion of RSUs and other share based considerations | (1,059) | |
| At Sep. 30, 2020 | 46,870 | |
| | | 37 |
SPROTT INC.
NOTES TO THE INTERIM CONDENSED CONSOLIDATED FINANCIAL STATEMENTS (UNAUDITED)
For the three and nine months ended September 30, 2020 and 2019
Stock option plan
The Company has an option plan (the "Plan") intended to provide incentives to directors, officers and employees of the Company and its wholly owned subsidiaries. The aggregate number of shares issuable upon the exercise of all options granted under the Plan and under all other stock-based compensation arrangements including the Trust and Equity Incentive Plan ("EIP") cannot exceed 10% of the issued and outstanding shares of the Company as at the date of grant. The options may be granted at a price that is not less than the market price of the Company's common shares at the time of grant. The options vest annually over a three-year period and may be exercised during a period not to exceed 10 years from the date of grant.
There were no stock options issued or exercised in the three months ended September 30, 2020 (three months ended September 30, 2019 - Nil). There were no stock options issued and 150,000 stock options were exercised for the nine months ended September 30, 2020 (nine months ended September 30, 2019 - Nil).
For valuing share option grants, the fair value method of accounting is used. The fair value of option grants is determined using the Black-Scholes option-pricing model, which takes into account the exercise price of the option, the current share price, the risk-free interest rate, the expected volatility of the share price over the life of the option and other relevant factors. Compensation cost is recognized over the vesting period, assuming an estimated forfeiture rate, with an offset to contributed surplus. When exercised, amounts originally recorded against contributed surplus as well as any consideration paid by the option holder is credited to capital stock.
A summary of the changes in the Plan is as follows:
| | | |
| | Number of options | Weighted average
exercise price (CAD $) |
| | | |
| Options outstanding, Dec. 31, 2018 | 327,500 | | 25.70 | |
| Options exercisable, Dec. 31, 2018 | 187,500 | | 27.00 | |
| Options outstanding, Dec. 31, 2019 | 327,500 | | 25.70 | |
| Options exercisable, Dec. 31, 2019 | 257,500 | | 26.00 | |
| Options exercised during the year | (150,000) | | 23.30 | |
| Options outstanding, Sep. 30, 2020 | 177,500 | | 27.19 | |
| Options exercisable, Sep. 30, 2020 | 177,500 | | 27.19 | |
Options outstanding and exercisable as at September 30, 2020 are as follows:
| Exercise price (CAD $) | Number of
options outstanding | | Weighted average
remaining contractual life
(years) | | Number of
options exercisable |
| | | | | | |
| 66.00 | 15,000 | | 0.1 | | 15,000 | |
| 23.30 | 150,000 | | 5.3 | | 150,000 | |
| 27.30 | 12,500 | | 5.6 | | 12,500 | |
| 23.30 to 66.00 | 177,500 | | 4.9 | | 177,500 | |
| | | 38 |
SPROTT INC.
NOTES TO THE INTERIM CONDENSED CONSOLIDATED FINANCIAL STATEMENTS (UNAUDITED)
For the three and nine months ended September 30, 2020 and 2019
Equity incentive plan
For employees in Canada, the Trust has been established and the Company will fund the Trust with cash, which will be used by the trustee to purchase: (1) on the open market, common shares of the Company that will be held in the Trust until the awards vest and are distributed to eligible members; or (2) from treasury, common shares of the Company that will be held in the Trust until the awards vest and are distributed to eligible employees; and (3) from time-to-time, purchases from 2176423 Ontario Ltd., a company controlled by Eric Sprott, pursuant to the terms and conditions of a previously announced share transaction. For employees in the U.S. under the EIP plan, the Company will allot common shares of the Company as either: (1) restricted stock; (2) unrestricted stock; or (3) restricted stock units ("RSUs"), the resulting common shares of which will be issued from treasury.
There were 2,931 RSUs granted during the three months ended September 30, 2020 (3 months ended September 30, 2019 - 2,314) and 89,858 RSUs granted during the nine months ended September 30, 2020 (nine months ended September 30, 2019 - 69,954). The Trust acquired 6,000 shares in the three months ended September 30, 2020 (nine months ended September 30, 2019 - 133,585) and 128,304 shares in the nine months ended September 30, 2020 (nine months ended September 30, 2019 - 149,812 shares).
| | | |
| | |
| | Number of
common shares |
| | |
| Common shares held by the Trust, Dec. 31, 2018 | 993,225 | |
| Acquired | 182,612 | |
| Released on vesting | (280,399) | |
| Unvested common shares held by the Trust, Dec. 31, 2019 | 895,438 | |
| Acquired | 128,304 | |
| Released on vesting | (10,084) | |
| Unvested common shares held by the Trust, Sep. 30, 2020 | 1,013,658 | |
The table below provides a breakdown of the share-based compensation expense and the corresponding increase to contributed surplus:
| | | | | |
| | For the three months ended | For the nine months ended |
| | | | | |
| | Sep. 30, 2020 | Sep. 30, 2019 | Sep. 30, 2020 | Sep. 30, 2019 |
| | | | | |
| Stock option plan | — | | 43 | | 10 | | 141 | |
| EIP | 1,411 | | 1,588 | | 2,823 | | 3,987 | |
| | 1,411 | | 1,631 | | 2,833 | | 4,128 | |
| | | 39 |
SPROTT INC.
NOTES TO THE INTERIM CONDENSED CONSOLIDATED FINANCIAL STATEMENTS (UNAUDITED)
For the three and nine months ended September 30, 2020 and 2019
Basic and diluted earnings per share
The following table presents the calculation of basic and diluted earnings per common share:
| | | | | | | | | |
| | | For the three months ended | | For the nine months ended |
| | | | | | | | | |
| | | Sept. 30, 2020 | | | Sept. 30, 2019 | | | Sept. 30, 2020 | | | Sept. 30, 2019 | |
| | | | | | | | | |
| Numerator (in thousands $): | | | | | | | | |
| Net income - basic and diluted | | 8,704 | | | 4,336 | | | 20,258 | | | 8,764 | |
| | | | | | | | | |
| Denominator (Number of shares in thousands): | | | | | | | | |
| Weighted average number of common shares | | 25,511 | | | 25,365 | | | 25,436 | | | 25,352 | |
| Weighted average number of unvested shares purchased by the Trust | | (1,011) | | | (971) | | | (964) | | | (939) | |
| Weighted average number of common shares - basic | | 24,500 | | | 24,394 | | | 24,472 | | | 24,413 | |
| Weighted average number of dilutive stock options | | 163 | | | 312 | | | 163 | | | 312 | |
| Weighted average number of unvested shares under EIP | | 1,202 | | | 971 | | | 1,155 | | | 939 | |
| Weighted average number of common shares - diluted | | 25,865 | | | 25,677 | | | 25,790 | | | 25,664 | |
| | | | | | | | | | | | | |
| Net income per common share | | | | |
| Basic | $ | 0.36 | | $ | 0.18 | | $ | 0.83 | | $ | 0.36 | |
| Diluted | $ | 0.34 | | $ | 0.17 | | $ | 0.79 | | $ | 0.34 | |
Capital management
The Company's objectives when managing capital are:
| • | to meet regulatory requirements and other contractual obligations; |
| • | to safeguard the Company's ability to continue as a going concern so that it can continue to provide returns for shareholders; |
| • | to provide financial flexibility to fund possible acquisitions; |
| • | to provide adequate seed capital for the Company's new product offerings; and |
| • | to provide an adequate return to shareholders through growth in assets under management, growth in management fees, carried interest and performance fees and return on the Company's invested capital that will result in dividend payments to shareholders. |
The Company's capital is comprised of equity, including capital stock, contributed surplus, retained earnings (deficit) and accumulated other comprehensive income (loss). SCP is a member of the Investment Industry Regulatory Organization of Canada ("IIROC"), SAM is a registrant of the Ontario Securities Commission ("OSC") and the U.S. Securities and Exchange Commission ("SEC"), SAM US is registered with the SEC and SGRIL is a member of the Financial Industry Regulatory Authority ("FINRA"). As a result, all of these entities are required to maintain a minimum level of regulatory capital. To ensure compliance, management monitors regulatory and working capital on a regular basis. As at September 30, 2020, all entities were in compliance with their respective capital requirements.
| | | 40 |
SPROTT INC.
NOTES TO THE INTERIM CONDENSED CONSOLIDATED FINANCIAL STATEMENTS (UNAUDITED)
For the three and nine months ended September 30, 2020 and 2019
8 INCOME TAXES
The major components of income tax expense are as follows (in thousands $):
| | | |
| | For the nine months ended |
| | | |
| | Sep. 30, 2020 | Sep. 30, 2019 |
| | | |
| Current income tax expense (recovery) | | |
| Based on taxable income of the current period | 2,599 | | 973 | |
| Adjustments in respect to previous years | 88 | | — | |
| Total current income tax expense | 2,687 | | 973 | |
| Deferred income tax expense (recovery) | | |
| Origination and reversal of temporary differences | 3,165 | | 770 | |
| Adjustments in respect to previous years | (729 | ) | 50 | |
| Total deferred income tax expense | 2,436 | | 820 | |
| Income tax expense reported in the consolidated statements of operations | 5,123 | | 1,793 | |
Taxes calculated on the Company's earnings differs from the theoretical amount that would arise using the weighted average tax rate applicable to earnings of the Company as follows (in thousands $):
| | | |
| | For the nine months ended |
| | | |
| | Sept. 30, 2020 | Sept. 30, 2019 |
| | | |
| Income before income taxes | 25,381 | | 10,557 | |
| Tax calculated at domestic tax rates applicable to profits in the respective countries | 6,835 | | 2,819 | |
| Tax effects of: | | |
| Non-deductible stock-based compensation | 255 | | 90 | |
| Non-taxable capital (gains) and losses | (403) | | (163) | |
| Adjustments in respect of previous periods | (641) | | 50 | |
| Non-capital losses and other temporary differences not benefited previously | (1,014) | | (1,093) | |
| Rate differences and other | 91 | | 90 | |
| Tax charge | 5,123 | | 1,793 | |
The weighted average statutory tax rate was 26.9% (September 30, 2019 - 26.7%). The Company has $13 million of capital tax losses from prior years that will begin to expire in 2020. The benefit of these capital losses has not been recognized.
| | | 41 |
SPROTT INC.
NOTES TO THE INTERIM CONDENSED CONSOLIDATED FINANCIAL STATEMENTS (UNAUDITED)
For the three and nine months ended September 30, 2020 and 2019
Deferred income taxes reflect the net tax effects of temporary differences between the carrying amounts of assets and liabilities for financial reporting purposes and the amounts used for income tax purposes. Deferred tax assets are recognized for tax loss carry-forwards to the extent that the realization of the related tax benefit through future taxable profits is probable. The ability to realize the tax benefits of these losses is dependent upon a number of factors, including the future profitability of operations in the jurisdictions in which the tax losses arose. The movement in significant components of the Company's deferred income tax assets and liabilities is as follows (in thousands $):
For the nine months ended September 30, 2020
| | Dec. 31, 2019 | Recognized in
income | Recognized in
other
comprehensive
income | Sept. 30, 2020 |
| Deferred income tax assets | | | | |
| Stock-based compensation | 4,056 | | (661 | ) | (144 | ) | 3,251 | |
| Non-capital and capital losses | 3,432 | | (1,218 | ) | (111 | ) | 2,103 | |
| Unrealized losses | 910 | | (898 | ) | (23 | ) | (11 | ) |
| Other | 247 | | 197 | | (15 | ) | 429 | |
| Total deferred income tax assets | 8,645 | | (2,580 | ) | (293 | ) | 5,772 | |
| | | | | |
| Deferred income tax liabilities | | | | |
| Fund management contracts | 6,809 | | 45 | | (255 | ) | 6,599 | |
| Other | (21 | ) | (189 | ) | 12 | | (198 | ) |
| Total deferred income tax liabilities | 6,788 | | (144 | ) | (243 | ) | 6,401 | |
| Net deferred income tax assets (liabilities) | 1,857 | | (2,436 | ) | (50 | ) | (629 | ) |
For the year ended December 31, 2019
| | Dec. 31, 2018 | Recognized in
income | Recognized in
other
comprehensive
income | Dec. 31, 2019 |
| Deferred income tax assets | | | | |
| Stock-based compensation | 3,152 | | 750 | | 154 | | 4,056 | |
| Non-capital losses | 3,678 | | (372 | ) | 126 | | 3,432 | |
| Unrealized losses | 283 | | 604 | | 23 | | 910 | |
| Other | 376 | | (143 | ) | 14 | | 247 | |
| Total deferred income tax assets | 7,489 | | 839 | | 317 | | 8,645 | |
| | | | | |
| Deferred income tax liabilities | | | | |
| Fund management contracts | 5,141 | | 1,404 | | 264 | | 6,809 | |
| Other | 317 | | (334 | ) | (4 | ) | (21 | ) |
| Total deferred income tax liabilities | 5,458 | | 1,070 | | 260 | | 6,788 | |
| Net deferred income tax assets | 2,031 | | (231 | ) | 57 | | 1,857 | |
| | | 42 |
SPROTT INC.
NOTES TO THE INTERIM CONDENSED CONSOLIDATED FINANCIAL STATEMENTS (UNAUDITED)
For the three and nine months ended September 30, 2020 and 2019
The following tables present the Company's recurring fair value measurements within the fair value hierarchy. The Company did not have non-recurring fair value measurements as at September 30, 2020 and December 31, 2019 (in thousands $).
Short-term investments
| Sept. 30, 2020 | Level 1 | Level 2 | Level 3 | Total |
| | | | | |
| Public equities and share purchase warrants | 5,514 | | 4,210 | | — | | 9,724 | |
| Fixed income securities | — | | 1,576 | | — | | 1,576 | |
| Private holdings | — | | — | | 1,823 | | 1,823 | |
| Total net recurring fair value measurements | 5,514 | | 5,786 | | 1,823 | | 13,123 | |
| | |
| Dec. 31, 2019 | Level 1 | Level 2 | Level 3 | Total |
| | | | | |
| Public equities and share purchase warrants | 7,537 | | 2,983 | | — | | 10,520 | |
| Fixed income securities | — | | 3,454 | | 766 | | 4,220 | |
| Private holdings | — | | — | | 1,864 | | 1,864 | |
| Total net recurring fair value measurements | 7,537 | | 6,437 | | 2,630 | | 16,604 | |
Co-investments
| Sep. 30, 2020 | Level 1 | Level 2 | Level 3 | Total |
| | | | | |
| Co-investments in funds | — | | 61,303 | | 6,075 | | 67,378 | |
| Total net recurring fair value measurements | — | | 61,303 | | 6,075 | | 67,378 | |
| | |
| Dec. 31, 2019 | Level 1 | Level 2 | Level 3 | Total |
| | | | | |
| Co-investments in funds | — | | 51,065 | | 4,530 | | 55,595 | |
| Total net recurring fair value measurements | — | | 51,065 | | 4,530 | | 55,595 | |
Other assets
| Sep. 30, 2020 | Level 1 | Level 2 | Level 3 | Total |
| | | | | |
| Digital gold strategies | — | | — | | 17,347 | | 17,347 | |
| Total net recurring fair value measurements | — | | — | | 17,347 | | 17,347 | |
| | |
| Dec. 31, 2019 | Level 1 | Level 2 | Level 3 | Total |
| | | | | |
| Digital gold strategies | — | | — | | 18,913 | | 18,913 | |
| Total net recurring fair value measurements | — | | — | | 18,913 | | 18,913 | |
| | | 43 |
SPROTT INC.
NOTES TO THE INTERIM CONDENSED CONSOLIDATED FINANCIAL STATEMENTS (UNAUDITED)
For the three and nine months ended September 30, 2020 and 2019
The following tables provides a summary of changes in the fair value of Level 3 financial assets (in thousands $):
Short-term investments
| | Changes in the fair value of Level 3 measurements - Sep. 30 2020 | |
| | Dec. 31, 2019 | Purchases and
reclassifications | Settlements | Net unrealized
gains (losses)
included in net
income | Sep. 30, 2020 |
| Private holdings | 1,864 | | — | | (14 | ) | (27 | ) | 1,823 | |
| Fixed income securities | 766 | | (747 | ) | — | | (19 | ) | — | |
| | 2,630 | | (747 | ) | (14 | ) | (46 | ) | 1,823 | |
| | Changes in the fair value of Level 3 measurements - Dec. 31, 2019 |
| | Dec. 31, 2018 | Purchases and
reclassifications | Settlements | Net unrealized
gains (losses)
included in net
income | Dec. 31, 2019 |
| Private holdings | 2,075 | | 34 | | (43 | ) | (202 | ) | 1,864 | |
| Fixed income securities | 733 | | — | | — | | 33 | | 766 | |
| | 2,808 | | 34 | | (43 | ) | (169 | ) | 2,630 | |
Co-investments
| | Changes in the fair value of Level 3 measurements - Sep. 30, 2020 |
| | Dec. 31, 2019 | Purchases and
reclassifications | Settlements | Net unrealized
gains (losses)
included in net
income | Sep. 30, 2020 |
| Co-investments in funds | 4,530 | | 1,590 | | — | | (45 | ) | 6,075 | |
| | 4,530 | | 1,590 | | — | | (45 | ) | 6,075 | |
| | Changes in the fair value of Level 3 measurements - Dec. 31, 2019 |
| | Dec. 31, 2018 | Purchases and
reclassifications | Settlements | Net unrealized
gains (losses)
included in net
income | Dec. 31, 2019 |
| Co-investments in funds | 3,574 | | 1,193 | | — | | (237 | ) | 4,530 | |
| | 3,574 | | 1,193 | | — | | (237 | ) | 4,530 | |
| | | 44 |
SPROTT INC.
NOTES TO THE INTERIM CONDENSED CONSOLIDATED FINANCIAL STATEMENTS (UNAUDITED)
For the three and nine months ended September 30, 2020 and 2019
Other assets
| | Changes in the fair value of Level 3 measurements - Sep. 30, 2020 |
| | Dec. 31, 2019 | Purchases and
reclassifications | Settlements | Net unrealized
gains (losses)
included in net
income | Sep. 30, 2020 |
| Digital gold strategies | 18,913 | | 500 | | — | | (2,066 | ) | 17,347 | |
| | 18,913 | | 500 | | — | | (2,066 | ) | 17,347 | |
| | Changes in the fair value of Level 3 measurements - Dec. 31, 2019 |
| | Dec. 31, 2018 | Purchases and
reclassifications | Settlements | Net unrealized
gains (losses)
included in net
income | Dec. 31, 2019 |
| Digital gold strategies | 18,285 | 2,574 | — | | (1,946) | 18,913 |
| | 18,285 | 2,574 | — | | (1,946) | 18,913 |
During the nine months ended September 30, 2020, the Company transferred public equities of $0.5 million (December 31, 2019 - $2.5 million) from Level 2 to Level 1 within the fair value hierarchy due to the release of trading restrictions by the issuer. For the nine months ended September 30, 2020, the Company purchased level 3 investments of $2.1 million (December 31, 2019 - $3.9 million). For the nine months ended September 30, 2020, the Company transferred $Nil million (December 31, 2019 - $0.1 million) from Level 3 to Level 1 within the fair value hierarchy. For the nine months ended September 30, 2020, the Company transferred $0.7 million (December 31, 2019 - $Nil million) from Level 3 to Level 2 within the fair value hierarchy.
The following table presents the valuation techniques used by the Company in measuring fair values:
| Type | Valuation technique |
| Public equities and share purchase warrants | Fair values are determined using pricing models which incorporate all available market-observable inputs. |
| Hedge funds and private equity funds | Fair values are based on the last available Net Asset Value. |
| Fixed income securities | Fair values are based on independent market data providers or third-party broker quotes. |
| Private holdings (including digital gold strategies) | Fair values based on variety of valuation techniques, including discounted cash flows, comparable recent transactions and other techniques used by market participants. |
The Company’s Level 3 securities consist of private holdings, private equity funds and fixed income securities of private companies. The significant unobservable inputs used in these valuation techniques can vary considerably over time, and include grey market financing prices, discount rates and extraction recovery rates of mining projects. A significant change in any of these inputs in isolation would result in a material impact in fair value measurement. The potential impact of a 5% change in the significant unobservable inputs on profit or loss would be approximately $0.9 million (December 31, 2019 - $0.9 million).
Financial instruments not carried at fair value
For fees receivable, other assets, accounts payable and accrued liabilities and compensation payable, the carrying amount represents a reasonable approximation of fair value.
| | | 45 |
SPROTT INC.
NOTES TO THE INTERIM CONDENSED CONSOLIDATED FINANCIAL STATEMENTS (UNAUDITED)
For the three and nine months ended September 30, 2020 and 2019
The following dividends were declared by the Company during the nine months ended September 30, 2020:
| Record date | Payment Date | Cash dividend
per share (1) | Total dividend amount
(in thousands $) |
| March 9, 2020 - Regular Dividend Q4 2019 | March 24, 2020 | CAD$0.30 | 5,387 | |
| May 19, 2020 - Regular Dividend Q1 2020 | June 3, 2020 | CAD$0.30 | 5,560 | |
| August 17, 2020 - Regular Dividend Q2 2020 | September 1, 2020 | US$0.23 | 5,915 | |
| Dividends (2) | | | 16,862 | |
(1) Dividends per share in this MD&A for periods before May 28 reflect retrospective treatment of the 10:1 share consolidation.
(2) Subsequent to quarter-end, on November 12, 2020, a regular dividend was declared and increased to US$0.25 per common share for the quarter ended September 30, 2020. This dividend is payable on December 8, 2020 to shareholders of record at the close of business on November 23, 2020.
COVID-19 risk
The changing economic and market climate as a result of COVID-19 has led to the Company implementing its business continuity plan. Our portfolio managers, brokerage professionals, enterprise shared services teams and key outsource service providers are fully operational. While the exact impacts of COVID-19 over the short and long-term are undeterminable at the date of this report, management believes the effects of COVID-19 we have witnessed thus far, and in particular, world government responses thereto via fiscal and monetary policy, will continue to be highly constructive to precious metals markets.
Other risk management activities
All other risk management activities described in the annual audited financial statements are consistent with the consolidated interim financial statements.
| | | 46 |
SPROTT INC.
NOTES TO THE INTERIM CONDENSED CONSOLIDATED FINANCIAL STATEMENTS (UNAUDITED)
For the three and nine months ended September 30, 2020 and 2019
For management purposes, the Company is organized into business units based on its products, services and geographical location and has five reportable segments as follows:
| • | Exchange Listed Products (reportable), which provides management services to the Company's closed-end physical trusts and exchange traded funds ("ETFs"), both of which are actively traded on public securities exchanges; |
| | |
| • | Managed Equities (reportable), which provides asset management and sub-advisory services to the Company's branded funds, fixed-term LPs and managed accounts; |
| | |
| • | Lending (reportable), which provides lending and streaming activities through limited partnership vehicles as well as through direct lending activities using the Company's balance sheet; |
| | |
| • | Brokerage (reportable), which includes the activities of our Canadian and U.S. broker-dealers; |
| | |
| • | Corporate (reportable), which provides capital, balance sheet management and enterprise shared services to the Company's subsidiaries; |
| | |
| • | All Other Segments (non-reportable), which do not meet the definition of reportable segments as per IFRS 8. |
Management monitors the operating results of its business units separately for the purpose of making decisions about resource allocation and performance assessment. Segment performance is evaluated based on earnings before interest expense, income taxes, amortization and impairment of intangible assets and goodwill, gains and losses on proprietary investments (as if such gains and losses had not occurred), foreign exchange gains and losses, one time non-recurring expenses, non-cash and non-recurring stock-based compensation, carried interest and performance fees and carried interest and performance fee payouts (adjusted base EBITDA).
Adjusted base EBITDA is not a measurement in accordance with IFRS and should not be considered as an alternative to net income or any other measure of performance under IFRS.
Transfer pricing between operating segments is performed on an arm's length basis in a manner similar to transactions with third parties.
The following tables present the operations of the Company's segments (in thousands $):
For the three months ended September 30, 2020
| | | | | | | | |
| | Exchange
Listed
Products | Managed
Equities | Lending | Brokerage | Corporate | Consolidation,
elimination
and all other
segments | Consolidated |
| Total revenue | 11,209 | 10,383 | 2,535 | 10,191 | 340 | 741 | 35,399 |
| Total expenses | 2,400 | 6,475 | 2,126 | 7,078 | 5,602 | 1,401 | 25,082 |
| Income (loss) before income taxes | 8,809 | 3,908 | 409 | 3,113 | (5,262) | (660) | 10,317 |
| Adjusted base EBITDA | 9,396 | 3,141 | 1,522 | 3,030 | (4,590) | (475) | 12,024 |
| | | 47 |
SPROTT INC.
NOTES TO THE INTERIM CONDENSED CONSOLIDATED FINANCIAL STATEMENTS (UNAUDITED)
For the three and nine months ended September 30, 2020 and 2019
For the three months ended September 30, 2019
| | | | | | | | |
| | Exchange
Listed
Products | Managed
Equities | Lending | Brokerage | Corporate | Consolidation,
elimination
and all other
segments | Consolidated |
| Total revenue | 6,468 | 3,232 | 4,126 | 6,102 | 82 | (125) | 19,885 |
| Total expenses | 1,990 | 1,617 | 1,172 | 5,788 | 2,581 | 928 | 14,076 |
| Income (loss) before income taxes | 4,478 | 1,615 | 2,954 | 314 | (2,499) | (1,053) | 5,809 |
| Adjusted base EBITDA | 4,994 | 899 | 2,359 | 1,410 | (1,744) | (306) | 7,612 |
For the nine months ended September 30, 2020
| | | | | | | | |
| | Exchange
Listed
Products | Managed
Equities | Lending | Brokerage | Corporate | Consolidation,
elimination
and all other
segments | Consolidated |
| Total revenue | 26,230 | 23,362 | 9,435 | 22,886 | (492) | 1,998 | 83,419 |
| Total expenses | 5,849 | 11,269 | 4,348 | 17,072 | 13,244 | 6,256 | 58,038 |
| Income (loss) before income taxes | 20,381 | 12,093 | 5,087 | 5,814 | (13,736) | (4,258) | 25,381 |
| Adjusted base EBITDA | 21,066 | 7,474 | 4,849 | 5,530 | (9,757) | 253 | 29,415 |
For the nine months ended September 30, 2019
| | | | | | | | |
| | Exchange
Listed
Products | Managed
Equities | Lending | Brokerage | Corporate | Consolidation,
elimination
and all other
segments | Consolidated |
| Total revenue | 17,933 | 8,706 | 10,929 | 14,182 | (512) | 1,560 | 52,798 |
| Total expenses | 6,453 | 5,333 | 5,097 | 14,737 | 6,975 | 3,646 | 42,241 |
| Income (loss) before income taxes | 11,480 | 3,373 | 5,832 | (555) | (7,487) | (2,086) | 10,557 |
| Adjusted base EBITDA | 13,413 | 2,376 | 8,266 | 1,586 | (5,245) | 1,166 | 21,562 |
For geographic reporting purposes, transactions are primarily recorded in the location that corresponds with the underlying subsidiary's country of domicile that generates the revenue. The following table presents the revenue of the Company by geographic location (in thousands $):
| | | | | |
| | For the three months ended | For the nine months ended |
| | | | | |
| | Sep. 30, 2020 | Sep. 30, 2019 | Sep. 30, 2020 | Sep. 30, 2019 |
| | | | | |
| Canada | 27,628 | | 17,383 | | 68,719 | | 45,447 | |
| United States | 7,771 | | 2,502 | | 14,700 | | 7,351 | |
| | 35,399 | | 19,885 | | 83,419 | | 52,798 | |
| | | 48 |
SPROTT INC.
NOTES TO THE INTERIM CONDENSED CONSOLIDATED FINANCIAL STATEMENTS (UNAUDITED)
For the three and nine months ended September 30, 2020 and 2019
As at September 30, 2020, the Company had $17.4 million (December 31, 2019 - $15.3 million) outstanding on its credit facility, $3.7 million of which is due within 12 months and $13.7 million is due after 12 months (December 31, 2019 - $3.8 million and $11.5 million respectively).
The Company has a 5 year, CAD$90 million credit facility with a major Canadian schedule I chartered bank. The facility consists of a CAD$25 million term loan and a CAD$65 million revolving line of credit. Amounts may be borrowed under the facility through prime rate loans or bankers’ acceptances. Amounts may also be borrowed in US dollars through base rate loans. In 2019, the Company drew CAD$25 million on the term loan portion of the credit facility to avoid its expiry and to partially fund anticipated growth in the business over the next 12-18 months. As at September 30, 2020, the Company was in compliance with all covenants, terms and conditions under the credit facility. Key terms under the credit facility are noted below:
Structure
| • | 5-year, CAD$65 million revolver with "bullet maturity" December 31, 2022 |
| | |
| • | 5-year, CAD$25 million term loan with 5% of principal amortizing quarterly, with the remaining balance maturing on December 31, 2022 |
Interest Rate
| • | Prime rate + 0 bps or; |
| | |
| • | Banker Acceptance Rate + 170 bps |
Covenant Terms
| • | Minimum AUM: CAD$8.2 billion |
| | |
| • | Debt to EBITDA less than 2.5:1 |
| | |
| • | EBITDA to interest expense more than 2.5:1 |
| 14 | COMMITMENTS AND PROVISIONS |
Besides the Company's long-term lease agreement, there are commitments to make investments in the net investments portfolio of the Company. As at September 30, 2020, the Company had $6.1 million in co-investment commitments from the lending segment (December 31, 2019 - $6.6 million).
| | | 49 |
Corporate Information
| Head Office | Legal Counsel | |
| Sprott Inc. | Stikeman Elliot LLP | |
| Royal Bank Plaza, South Tower | 5300 Commerce Court West | |
| 200 Bay Street, Suite 2600 | 199 Bay Street | |
| Toronto, Ontario M5J 2J1, Canada | Toronto, Ontario M5L 1B9 | |
| T: 416.943.8099 | | |
| 1.855.943.8099 | Auditors | |
| | KPMG LLP | |
| Directors & Officers | Bay Adelaide Centre | |
| Ronald Dewhurst, Chairman | 333 Bay Street, Suite 4600 | |
| Sharon Ranson, FCPA, FCA, Director | Toronto, Ontario M5H 2S5 | |
| Rosemary Zigrossi, Director | | |
| Graham Birch, Director | Investor Relations | |
| Peter Grosskopf, Chief Executive Officer and Director | Shareholder requests may be directed to | |
| Rick Rule, Director | Investor Relations by e-mail at ir@sprott.com | |
| Whitney George, President | or via telephone at 416.943.8099 | |
| Kevin Hibbert, FCPA, FCA, Chief Financial Officer | or toll free at 1.855.943.8099 | |
| Arthur Einav, Corporate Secretary | | |
| US Transfer Agent and Registrar | Stock Information | |
| Sprott Inc. common shares are traded on the | |
| Continental Stock Transfer & Trust Company | New York Stock Exchange and Toronto Stock | |
| 1 State Street 30th Floor | Exchange under the symbol “SII” | |
| New York, NY 10004-1561 | | |
| 212.509.4000 | | |
| continentalstock.com | | |
| | | |
| Canadian Transfer Agent and Registrar | | |
| TMX Equity Transfer Services | | |
| 200 University Avenue, Suite 300 | | |
| Toronto, Ontario M5H 4H1 | | |
| Toll Free: 1.866.393.4891 | | |
| www.tmxequitytransferservices.com | | |