Exhibit 99.1
TM HLSS Servicer Advance Receivables Trust Investor Presentation
Disclaimer
FORWARD-LOOKING STATEMENTS: THIS PRESENTATION CONTAINS FORWARD-LOOKING STATEMENTS THAT INVOLVE RISKS AND UNCERTAINTIES. ALL STATEMENTS IN THIS PRESENTATION OTHER THAN STATEMENTS OF HISTORICAL FACTS ARE FORWARD-LOOKING STATEMENTS. THESE FORWARD-LOOKING STATEMENTS ARE SUBJECT TO INHERENT RISKS AND UNCERTAINTIES IN PREDICTING FUTURE RESULTS AND CONDITIONS THAT COULD CAUSE THE COMPANY’S ACTUAL RESULTS TO DIFFER MATERIALLY FROM THOSE PROJECTED IN THESE FORWARD-LOOKING STATEMENTS. WE HAVE INCLUDED IMPORTANT FACTORS IN THE CAUTIONARY STATEMENTS MADE IN OUR ANNUAL REPORT ON FORM 10-K, PARTICULARLY UNDER THE HEADINGS “RISK FACTORS” AND “MANAGEMENT’S DISCUSSION AND ANALYSIS OF FINANCIAL CONDITION AND RESULTS OF OPERATIONS,” THAT WE BELIEVE COULD CAUSE OUR ACTUAL RESULTS OR EVENTS TO DIFFER MATERIALLY FROM THOSE EXPRESSED OR IMPLIED BY THE FORWARD LOOKING STATEMENTS THAT WE MAKE IN THIS PRESENTATION. IN LIGHT OF THE SIGNIFICANT UNCERTAINTIES IN THESE FORWARD-LOOKING STATEMENTS, YOU SHOULD NOT REGARD THESE STATEMENTS AS A REPRESENTATION OR WARRANTY BY US OR ANY OTHER PERSON THAT WE WILL ACHIEVE OUR OBJECTIVES AND PLANS IN ANY SPECIFIED TIME FRAME, OR AT ALL. UNLESS REQUIRED BY LAW, WE UNDERTAKE NO OBLIGATION TO PUBLICLY UPDATE OR REVISE ANY FORWARD-LOOKING STATEMENTS TO REFLECT NEW INFORMATION OR FUTURE EVENTS OR OTHERWISE. NON-GAAP MEASURES: OUR PRESENTATION CONTAINS REFERENCES TO SERVICING REVENUE AND SERVICING EXPENSE, WHICH ARE NON-GAAP PERFORMANCE MEASURES. WE BELIEVE THESE NON-GAAP PERFORMANCE MEASURES MAY PROVIDE ADDITIONAL MEANINGFUL COMPARISONS BETWEEN CURRENT RESULTS AND RESULTS IN PRIOR PERIODS. NON-GAAP PERFORMANCE MEASURES SHOULD BE VIEWED IN ADDITION TO, AND NOT AS AN ALTERNATIVE FOR, THE COMPANY’S REPORTED RESULTS UNDER ACCOUNTING PRINCIPLES GENERALLY ACCEPTED IN THE UNITED STATES. 2
|
|
Table of Contents Agenda 1. HLSS Overview 2. Ocwen Overview 3. HSART Master Trust Overview 4. Appendices 3
HLSS Overview 4
|
|
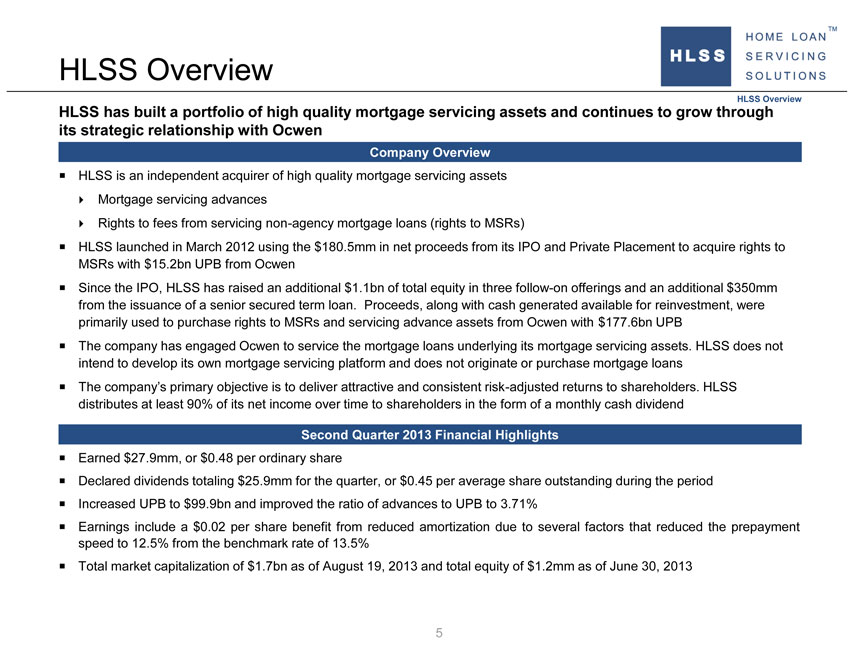
HLSS Overview HLSS Overview HLSS has built a portfolio of high quality mortgage servicing assets and continues to grow through its strategic relationship with Ocwen Company Overview ? HLSS is an independent acquirer of high quality mortgage servicing assets ? Mortgage servicing advances ? Rights to fees from servicing non-agency mortgage loans (rights to MSRs) ? HLSS launched in March 2012 using the $180.5mm in net proceeds from its IPO and Private Placement to acquire rights to MSRs with $15.2bn UPB from Ocwen ? Since the IPO, HLSS has raised an additional $1.1bn of total equity in three follow-on offerings and an additional $350mm from the issuance of a senior secured term loan. Proceeds, along with cash generated available for reinvestment, were primarily used to purchase rights to MSRs and servicing advance assets from Ocwen with $177.6bn UPB ? The company has engaged Ocwen to service the mortgage loans underlying its mortgage servicing assets. HLSS does not intend to develop its own mortgage servicing platform and does not originate or purchase mortgage loans ? The company’s primary objective is to deliver attractive and consistent risk-adjusted returns to shareholders. HLSS distributes at least 90% of its net income over time to shareholders in the form of a monthly cash dividend Second Quarter 2013 Financial Highlights ? Earned $27.9mm, or $0.48 per ordinary share ? Declared dividends totaling $25.9mm for the quarter, or $0.45 per average share outstanding during the period ? Increased UPB to $99.9bn and improved the ratio of advances to UPB to 3.71% ? Earnings include a $0.02 per share benefit from reduced amortization due to several factors that reduced the prepayment speed to 12.5% from the benchmark rate of 13.5% ? Total market capitalization of $1.7bn as of August 19, 2013 and total equity of $1.2mm as of June 30, 2013 5
|
|
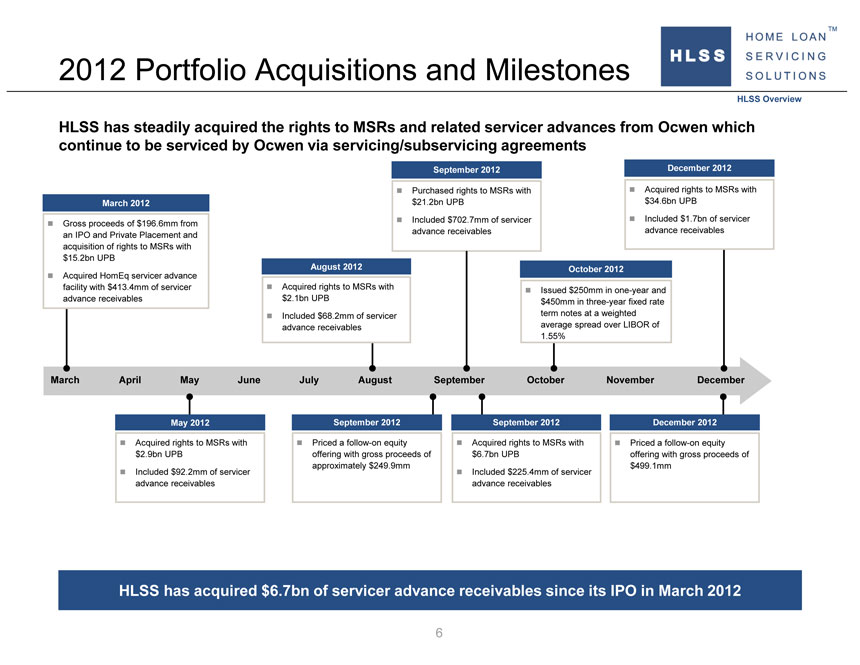
2012 Portfolio Acquisitions and Milestones HLSS Overview HLSS has steadily acquired the rights to MSRs and related servicer advances from Ocwen which continue to be serviced by Ocwen via servicing/subservicing agreements September 2012 December 2012 Purchased rights to MSRs with Acquired rights to MSRs with March 2012 $21.2bn UPB $34.6bn UPB Included $702.7mm of servicer ? Included $1.7bn of servicer Gross proceeds of $196.6mm from advance receivables advance receivables an IPO and Private Placement and acquisition of rights to MSRs with $15.2bn UPB August 2012 October 2012 Acquired HomEq servicer advance facility with $413.4mm of servicer Acquired rights to MSRs with Issued $250mm in one-year and advance receivables $2.1bn UPB $450mm in three-year fixed rate Included $68.2mm of servicer term notes at a weighted advance receivables average spread over LIBOR of 1.55% March April May June July August September October November December May 2012 September 2012 September 2012 December 2012 Acquired rights to MSRs with Priced a follow-on equity Acquired rights to MSRs with Priced a follow-on equity $2.9bn UPB offering with gross proceeds of $6.7bn UPB offering with gross proceeds of approximately $249.9mm $499.1mm Included $92.2mm of servicer ? Included $225.4mm of servicer advance receivables advance receivables HLSS has acquired $6.7bn of servicer advance receivables since its IPO in March 2012 6
|
|
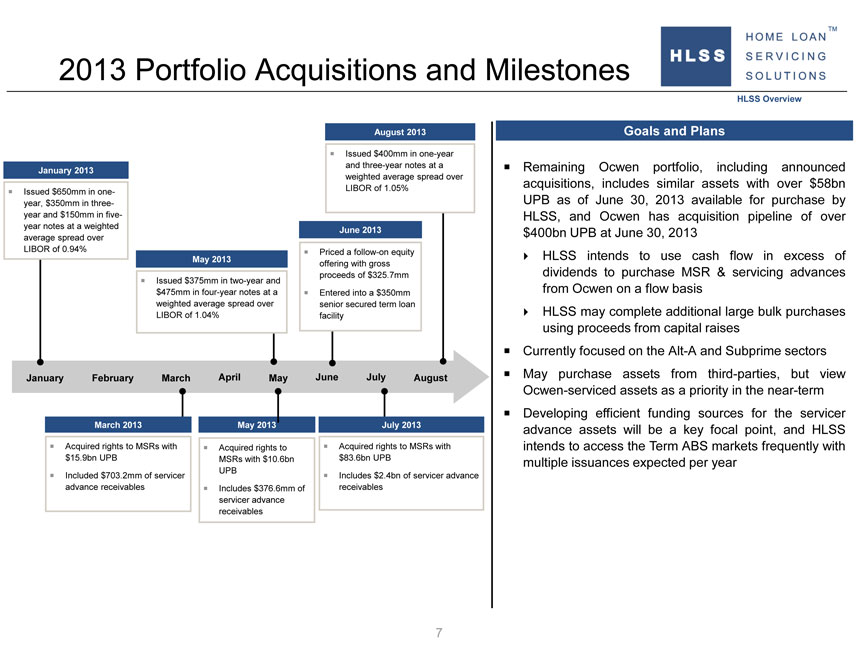
2013 Portfolio Acquisitions and Milestones HLSS Overview August 2013 Goals and Plans Issued $400mm in one-year and three-year notes at a Remaining Ocwen portfolio, including announced January 2013 weighted average spread over LIBOR of 1.05% acquisitions, includes similar assets with over $58bn Issued $650mm in one-year, $350mm in three- UPB as of June 30, 2013 available for purchase by year and $150mm in five- HLSS, and Ocwen has acquisition pipeline of over year notes at a weighted average spread over June 2013 $400bn UPB at June 30, 2013 LIBOR of 0.94% Priced a follow-on equity May 2013 HLSS intends to use cash flow in excess of offering with gross Issued $375mm in two-year and proceeds of $325.7mm dividends to purchase MSR & servicing advances $475mm in four-year notes at a Entered into a $350mm from Ocwen on a flow basis weighted average spread over senior secured term loan LIBOR of 1.04% facility HLSS may complete additional large bulk purchases using proceeds from capital raises Currently focused on the Alt-A and Subprime sectors January February March April May June July August May purchase assets from third-parties, but view Ocwen-serviced assets as a priority in the near-term Developing efficient funding sources for the servicer March 2013 May 2013 July 2013 advance assets will be a key focal point, and HLSS Acquired rights to MSRs with Acquired rights to Acquired rights to MSRs with intends to access the Term ABS markets frequently with $15.9bn UPB MSRs with $10.6bn $83.6bn UPB multiple issuances expected per year UPB Included $703.2mm of servicer Includes $2.4bn of servicer advance receivables Includes $376.6mm of receivables servicer advance receivables 7
|
|
HLSS Leadership Team HLSS Overview Veteran management team with extensive mortgage servicing experience William C. Erbey John P. Van Vlack James E. Lauter Served as Chairman since the Served as a director since October Serves as CFO and SVP inception of HLSS 2011 and was appointed President in March 2012 Previously served as VP of Ocwen Chairman of Ocwen since September Financial 1996 and Altisource since 2009 Previously served as CFO and Chief Accounting Officer and EVP at Duties included directing Ocwen’s CEO of Ocwen Financial from Ocwen Financial, Ocwen Asset Advance Facility January 1988 to May 1998 Management and Ocwen Loan Servicing Previously held several positions at Managing General Partner of The AT&T, including CFO of National Oxford Financial Group (predecessor Duties included directing Ocwen’s Business Markets, Online Markets of Ocwen) from 1983 to 1995 Advance Facility and BellSouth Community Technologies Richard Delgado Michael J. McElroy Bryon E. Stevens Serves as Treasurer and SVP General Counsel and SVP of Investor Relations and Capital Markets Previously served as Senior VP and Previously served as Senior VP and Treasurer of Ocwen Financial Deputy General Counsel of Ocwen Previously served as investment Financial banker at UBS and J.P. Morgan Worked at Ocwen since 1995, Duties included directing Duties included capital raising for primarily in Treasury, Capital Markets transactional legal matters financial services companies, and Servicing Acquisitions Served as Associate General including Ocwen Previously employed by Deloitte as a Counsel at Fannie Mae prior to Ran Alternative Capital Markets group Senior Analyst on the CMO team joining Ocwen at UBS New York Certified Public Accountant 8
|

|
Assets Are a 5% First-Priority Claim HLSS Overview Note: Data as of Q2 2013 HLSS Assets1 $4.2 Billion1 Servicing Advances $99.9 Billion $95.7 Billion $3.7 Billion or 87% Portfolio Downside UPB Protection Cash & Reserves1,2 $0.1 Billion or 3% Rights to MSRs $0.4 Billion or 10% 1 Assets exclude proceeds of $661.5 million from the June issuance of debt and equity that was deployed on July 1 2 Reserves associated with the Advance Financing Facility 1 HLSS’ total assets are 25 times over collateralized by ending UPB of $99.9 billion 90% of assets are Servicing Advances or Cash which are carried at par and have no MTM 10% of assets are non-agency MSRs that have a stable valuation history No change in servicing asset valuations since inception Advances are recovered at “top-of-the-waterfall” from loan proceeds ~95% decline in real estate value would be required to impair HLSS’ assets 9
|
|
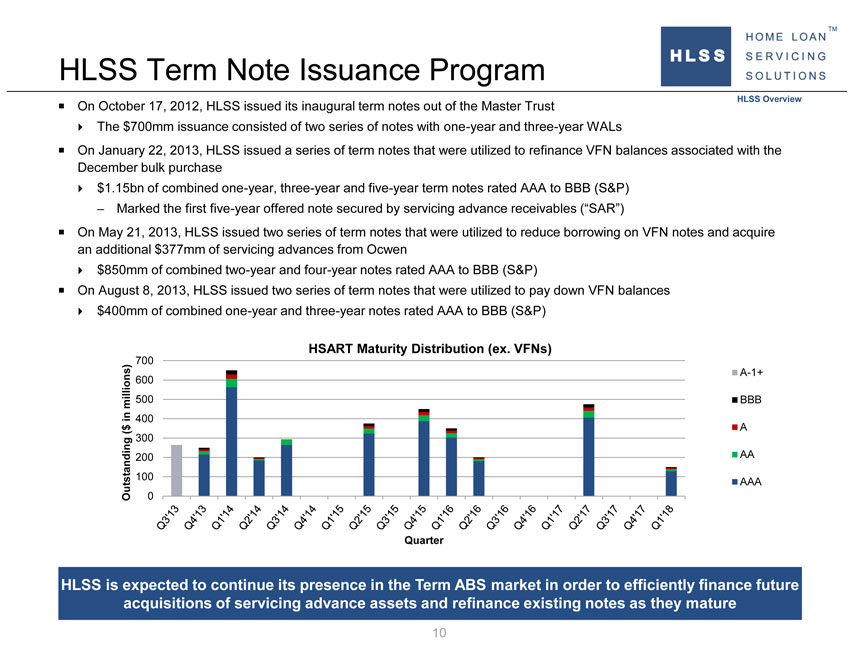
HLSS Term Note Issuance Program HLSS Overview On October 17, 2012, HLSS issued its inaugural term notes out of the Master Trust The $700mm issuance consisted of two series of notes with one-year and three-year WALs On January 22, 2013, HLSS issued a series of term notes that were utilized to refinance VFN balances associated with the December bulk purchase $1.15bn of combined one-year, three-year and five-year term notes rated AAA to BBB (S&P) – Marked the first five-year offered note secured by servicing advance receivables (“SAR”) On May 21, 2013, HLSS issued two series of term notes that were utilized to reduce borrowing on VFN notes and acquire an additional $377mm of servicing advances from Owen $850mm of combined two-year and four-year notes rated AAA to BBB (S&P) On August 8, 2013, HLSS issued two series of term notes that were utilized to pay down VFN balances $400mm of combined one-year and three-year notes rated AAA to BBB (S&P) HSART Maturity Distribution (ex. VFNs) 700A-1+600millions) 500 BBB in 400$ A( 300200 AA 100 AAA Outstanding 0 Quarter HLSS is expected to continue its presence in the Term ABS market in order to efficiently finance future acquisitions of servicing advance assets and refinance existing notes as they mature 10
|
|
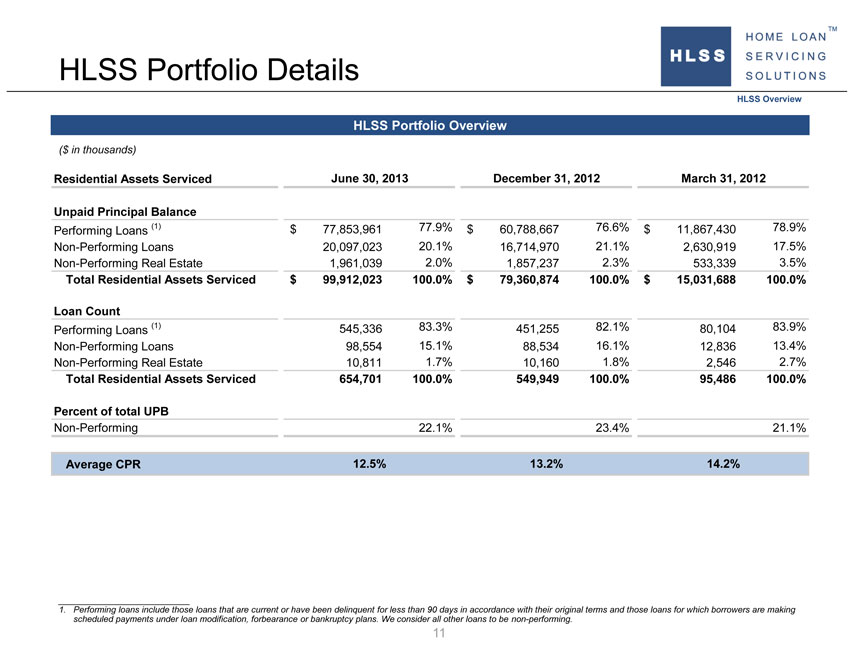
HLSS Portfolio Details HLSS Overview HLSS Portfolio Overview ($ in thousands) Residential Assets Serviced June 30, 2013 December 31, 2012 March 31, 2012 Unpaid Principal Balance Performing Loans (1) $ 77,853,961 77.9% $ 60,788,667 76.6% $ 11,867,430 78.9% Non-Performing Loans 20,097,023 20.1% 16,714,970 21.1% 2,630,919 17.5% Non-Performing Real Estate 1,961,039 2.0% 1,857,237 2.3% 533,339 3.5% Total Residential Assets Serviced $ 99,912,023 100.0% $ 79,360,874 100.0% $ 15,031,688 100.0% Loan Count Performing Loans (1) 545,336 83.3% 451,255 82.1% 80,104 83.9% Non-Performing Loans 98,554 15.1% 88,534 16.1% 12,836 13.4% Non-Performing Real Estate 10,811 1.7% 10,160 1.8% 2,546 2.7% Total Residential Assets Serviced 654,701 100.0% 549,949 100.0% 95,486 100.0% Percent of total UPB Non-Performing 22.1% 23.4% 21.1% Average CPR 12.5% 13.2% 14.2% 1. Performing loans include those loans that are current or have been delinquent for less than 90 days in accordance with their original terms and those loans for which borrowers are making scheduled payments under loan modification, forbearance or bankruptcy plans. We consider all other loans to be non-performing. 11
|
|
Ocwen Overview 12
|
|
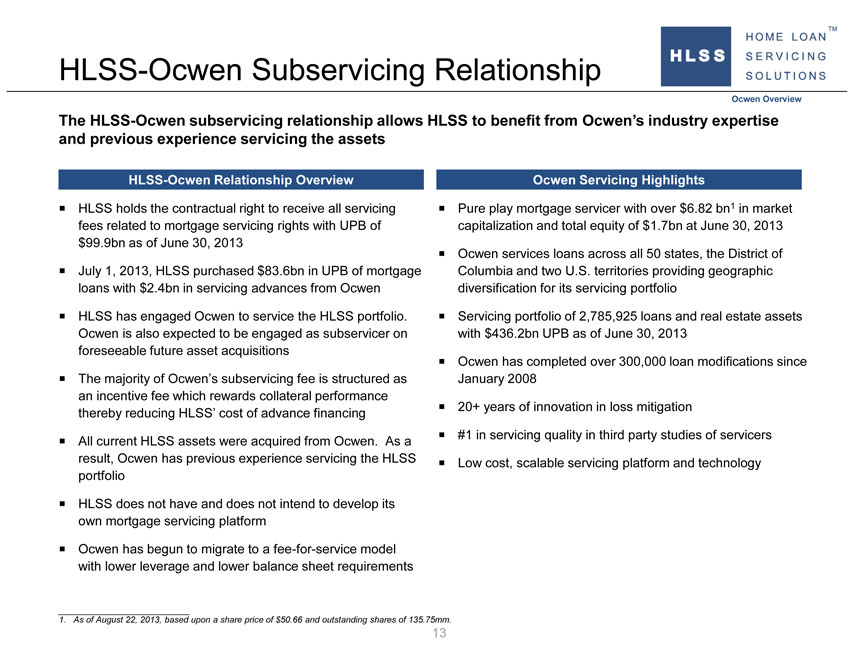
HLSS-Ocwen Subservicing Relationship Ocwen Overview The HLSS-Ocwen subservicing relationship allows HLSS to benefit from Ocwen’s industry expertise and previous experience servicing the assets HLSS-Ocwen Relationship Overview Ocwen Servicing Highlights HLSS holds the contractual right to receive all servicing Pure play mortgage servicer with over $6.82 bn1 in market fees related to mortgage servicing rights with UPB of capitalization and total equity of $1.7bn at June 30, 2013 $99.9bn as of June 30, 2013 Ocwen services loans across all 50 states, the District of July 1, 2013, HLSS purchased $83.6bn in UPB of mortgage Columbia and two U.S. territories providing geographic loans with $2.4bn in servicing advances from Ocwen diversification for its servicing portfolio HLSS has engaged Ocwen to service the HLSS portfolio. Servicing portfolio of 2,785,925 loans and real estate assets Ocwen is also expected to be engaged as subservicer on with $436.2bn UPB as of June 30, 2013 foreseeable future asset acquisitions Ocwen has completed over 300,000 loan modifications since The majority of Ocwen’s subservicing fee is structured as January 2008 an incentive fee which rewards collateral performance 20+ years of innovation in loss mitigation thereby reducing HLSS’ cost of advance financing #1 in servicing quality in third party studies of servicers All current HLSS assets were acquired from Ocwen. As a result, Ocwen has previous experience servicing the HLSS ? Low cost, scalable servicing platform and technology portfolio HLSS does not have and does not intend to develop its own mortgage servicing platform ? Ocwen has begun to migrate to a fee-for-service model with lower leverage and lower balance sheet requirements 1. As of August 22, 2013, based upon a share price of $50.66 and outstanding shares of 135.75mm. 13
|
|
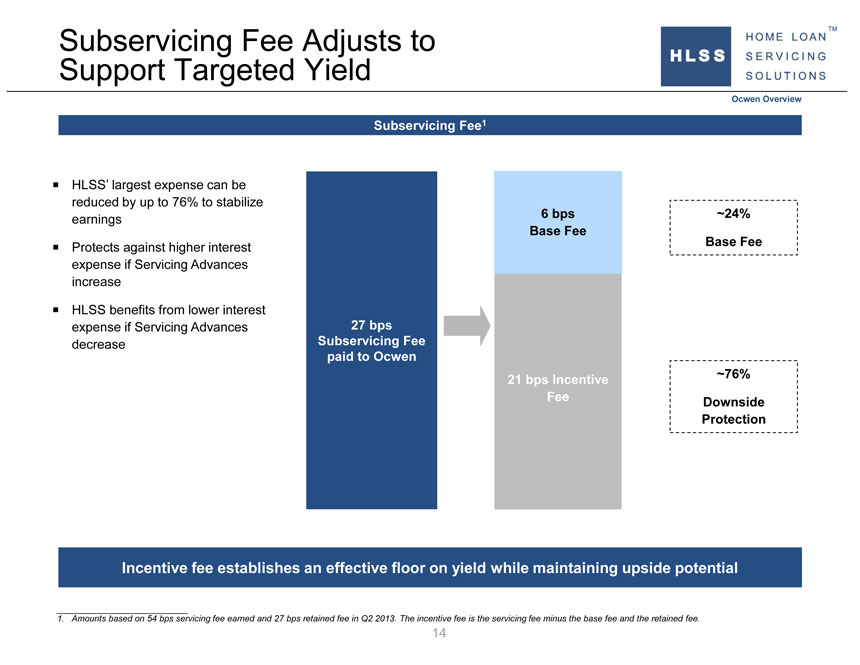
Subservicing Fee Adjusts to Support Targeted Yield Ocwen Overview Subservicing Fee1 ? HLSS’ largest expense can be reduced by up to 76% to stabilize 6 bps ~24% earnings Base Fee Protects higher interest Base Fee ? against expense if Servicing Advances increase ? HLSS benefits from lower interest expense if Servicing Advances 27 bps decrease Subservicing Fee paid to Ocwen 21 bps Incentive ~76% Fee Downside Protection Incentive fee establishes an effective floor on yield while maintaining upside potential 1. Amounts based on 54 bps servicing fee earned and 27 bps retained fee in Q2 2013. The incentive fee is the servicing fee minus the base fee and the retained fee.
14
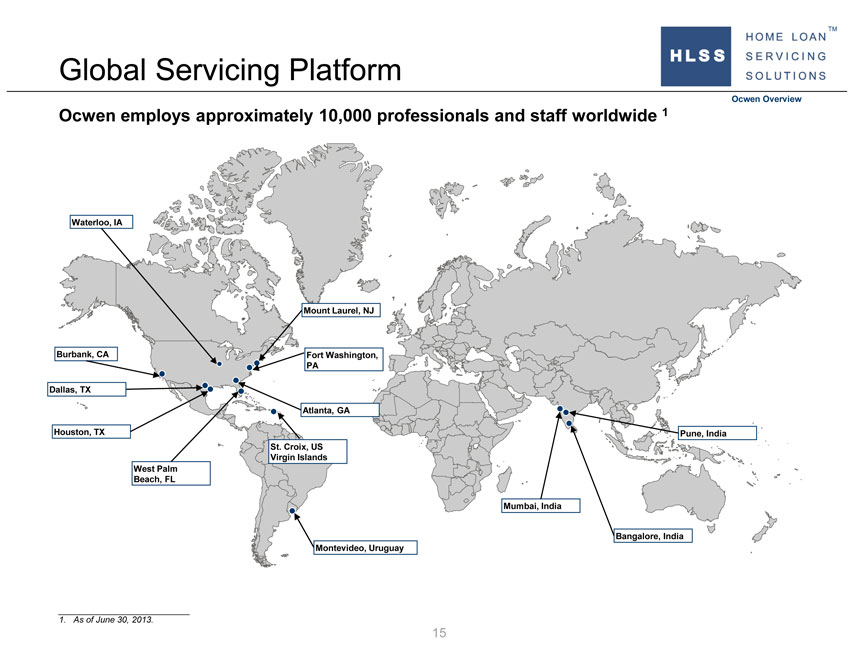
Global Servicing Platform Ocwen Overview Ocwen employs approximately 10,000 professionals and staff worldwide 1 Waterloo, IA Mount Laurel, NJ Burbank, CA Fort Washington, PA Dallas, TX Atlanta, GA Houston, TX Pune, India St. Croix, US Virgin Islands West Palm Beach, FL Mumbai, India Bangalore, India Montevideo, Uruguay 1. As of June 30, 2013. 15
|
|
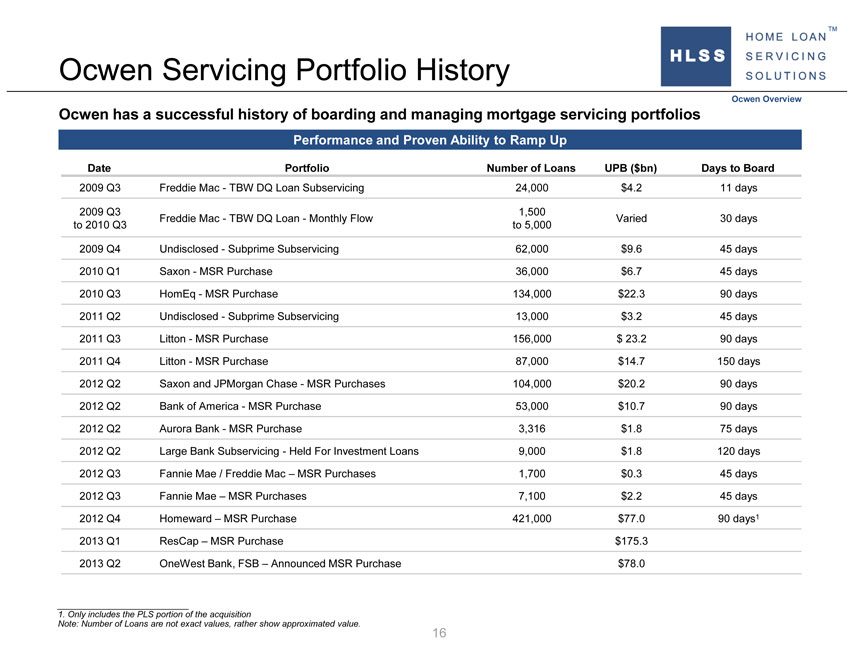
Ocwen Servicing Portfolio History Ocwen Overview Ocwen has a successful history of boarding and managing mortgage servicing portfolios Performance and Proven Ability to Ramp Up Date Portfolio Number of Loans UPB ($bn) Days to Board 2009 Q3 Freddie Mac—TBW DQ Loan Subservicing 24,000 $4.2 11 days 2009 Q3 1,500 Freddie Mac—TBW DQ Loan—Monthly Flow Varied 30 days to 2010 Q3 to 5,000 2009 Q4 Undisclosed—Subprime Subservicing 62,000 $9.6 45 days 2010 Q1 Saxon—MSR Purchase 36,000 $6.7 45 days 2010 Q3 HomEq—MSR Purchase 134,000 $22.3 90 days 2011 Q2 Undisclosed—Subprime Subservicing 13,000 $3.2 45 days 2011 Q3 Litton—MSR Purchase 156,000 $ 23.2 90 days 2011 Q4 Litton—MSR Purchase 87,000 $14.7 150 days 2012 Q2 Saxon and JPMorgan Chase—MSR Purchases 104,000 $20.2 90 days 2012 Q2 Bank of America—MSR Purchase 53,000 $10.7 90 days 2012 Q2 Aurora Bank—MSR Purchase 3,316 $1.8 75 days 2012 Q2 Large Bank Subservicing—Held For Investment Loans 9,000 $1.8 120 days 2012 Q3 Fannie Mae / Freddie Mac – MSR Purchases 1,700 $0.3 45 days 2012 Q3 Fannie Mae – MSR Purchases 7,100 $2.2 45 days 2012 Q4 Homeward – MSR Purchase 421,000 $77.0 90 days1 2013 Q1 ResCap – MSR Purchase $175.3 2013 Q2 OneWest Bank, FSB – Announced MSR Purchase $78.0 1. Only includes the PLS portion of the acquisition Note: Number of Loans are not exact values, rather show approximated value. 16
|
|
Ocwen Servicing Portfolio Update ? Litton Ocwen Overview ? Acquisition exceeding pro forma expectations ? Delinquencies have been reduced substantially since boarding, 9 point drop in delinquencies ? Boarded approximately 240,000 loans of which 1/3 were 60+days delinquent while quickly improving performance and proving the scalability of Ocwen’s servicing platform ? Saxon ? MSR portfolio of approximately $22.2bn UPB of Agency and Non-Agency mortgages acquired April 2, 2012 ? Also included acquisition of subservicing agreements relating to $2.7bn UPB of Agency and Non-Agency mortgages ? Ocwen already sub-serviced approximately $9.9bn of this UPB ? Acquisition already showing good results in delinquency and advance reduction ? JPM Chase ? Acquired MSRs for approximately $8.0bn UPB of non-prime loans on April 2, 2012 ? Simultaneous close of 104,000 Saxon and Chase loans demonstrates the flexibility and scalability of Ocwen’s platform ? Aurora Commercial Portfolio ? Acquired servicing of 3,316 commercial mortgage loans with $1.8bn UPB on May 31, 2012 ? Bank of America ? Boarding completed for the GSE portfolio of $10.7bn UPB acquired on May 22, 2012 ? Homeward ? Acquired Homeward Residential Holdings, Inc., existing origination and residential mortgage loan servicing platform of approximately 421,000 loans and $77bn in UPB on December 27, 2012 ? Boarding of PLS portfolio completed on March 15, 2012 ? ResCap ? On February 15, 2012, acquired MSRs to “private label” loans of approximately $49.6bn in UPB, $19.2bn of Freddie Mac loans, $38.5bn of Ginnie Mae loans and $42.1bn of loans under master servicing agreements, $1.5bn of related servicing advance receivables and related elements of the servicing platform for these MSRs and advances ? Genworth ? Acquired Genworth Financial Home Equity Access, Inc. reverse mortgage business (Liberty) on April 3, 2013 ? OneWest ? On June 13, 2013, announced the planned acquisition of mortgage servicing rights with $78bn in UPB from OneWest Bank, FSB 17
|
|
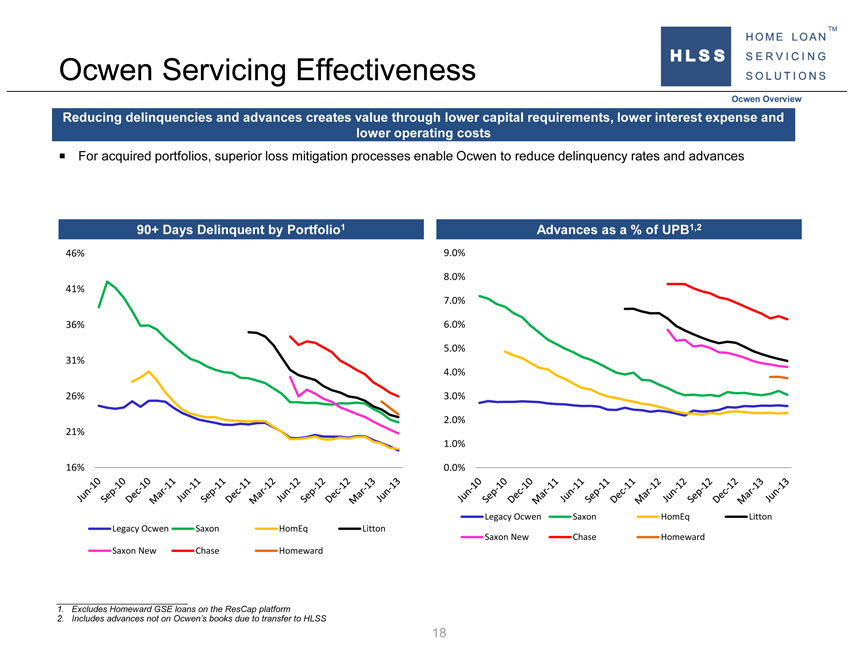
Ocwen Servicing Effectiveness Ocwen Overview Reducing delinquencies and advances creates value through lower capital requirements, lower interest expense and lower operating costs ? For acquired portfolios, superior loss mitigation processes enable Ocwen to reduce delinquency rates and advances 90+ Days Delinquent by Portfolio1 Advances as a % of UPB1,2 46% 9.0% 8.0% 41% 7.0% 36% 6.0% 5.0% 31% 4.0% 26% 3.0% 2.0% 21% 1.0% 16% 0.0% Legacy Ocwen Saxon HomEq Litton Legacy Ocwen Saxon HomEq Litton Saxon New Chase Homeward Saxon New Chase Homeward 1. Excludes Homeward GSE loans on the ResCap platform 2. Includes advances not on Ocwen’s books due to transfer to HLSS 18
|
|
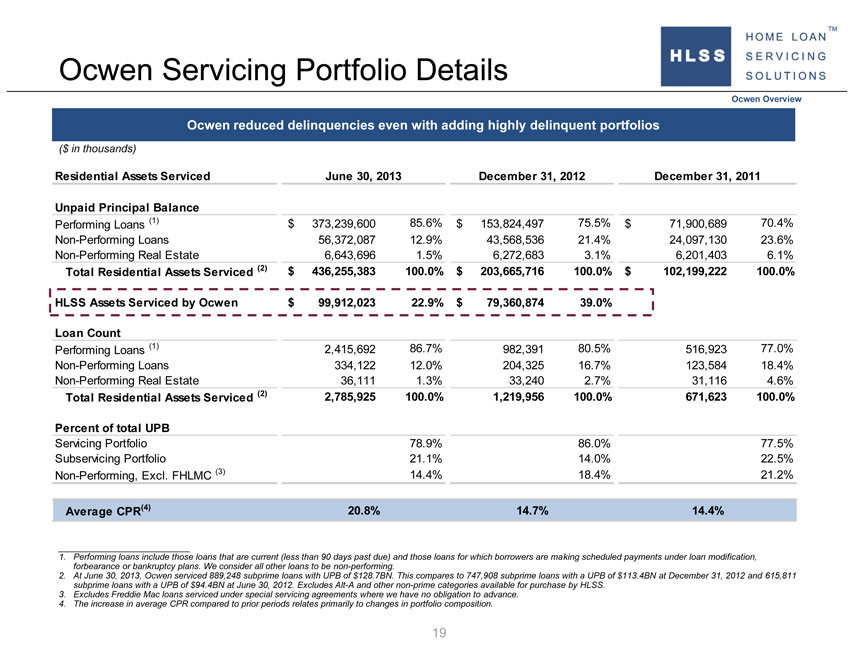
Ocwen Servicing Portfolio Details Ocwen Overview Ocwen reduced delinquencies even with adding highly delinquent portfolios ($ in thousands) Residential Assets Serviced June 30, 2013 December 31, 2012 December 31, 2011 Unpaid Principal Balance Performing Loans (1) $ 373,239,600 85.6% $ 153,824,497 75.5% $ 71,900,689 70.4% Non-Performing Loans 56,372,087 12.9% 43,568,536 21.4% 24,097,130 23.6% Non-Performing Real Estate 6,643,696 1.5% 6,272,683 3.1% 6,201,403 6.1% Total Residential Assets Serviced (2) $ 436,255,383 100.0% $ 203,665,716 100.0% $ 102,199,222 100.0% HLSS Assets Serviced by Ocwen $ 99,912,023 22.9% $ 79,360,874 39.0% Loan Count Performing Loans (1) 2,415,692 86.7% 982,391 80.5% 516,923 77.0% Non-Performing Loans 334,122 12.0% 204,325 16.7% 123,584 18.4% Non-Performing Real Estate 36,111 1.3% 33,240 2.7% 31,116 4.6% Total Residential Assets Serviced (2) 2,785,925 100.0% 1,219,956 100.0% 671,623 100.0% Percent of total UPB Servicing Portfolio 78.9% 86.0% 77.5% Subservicing Portfolio 21.1% 14.0% 22.5% Non-Performing, Excl. FHLMC (3) 14.4% 18.4% 21.2% Average CPR(4) 20.8% 14.7% 14.4% 1. Performing loans include those loans that are current (less than 90 days past due) and those loans for which borrowers are making scheduled payments under loan modification, forbearance or bankruptcy plans. We consider all other loans to be non-performing. 2. At June 30, 2013, Ocwen serviced 889,248 subprime loans with UPB of $128.7BN. This compares to 747,908 subprime loans with a UPB of $113.4BN at December 31, 2012 and 615,811 subprime loans with a UPB of $94.4BN at June 30, 2012. Excludes Alt-A and other non-prime categories available for purchase by HLSS. 3. Excludes Freddie Mac loans serviced under special servicing agreements where we have no obligation to advance. 4. The increase in average CPR compared to prior periods relates primarily to changes in portfolio composition. 19
|
|
HSART Master Trust Overview 20
|
|
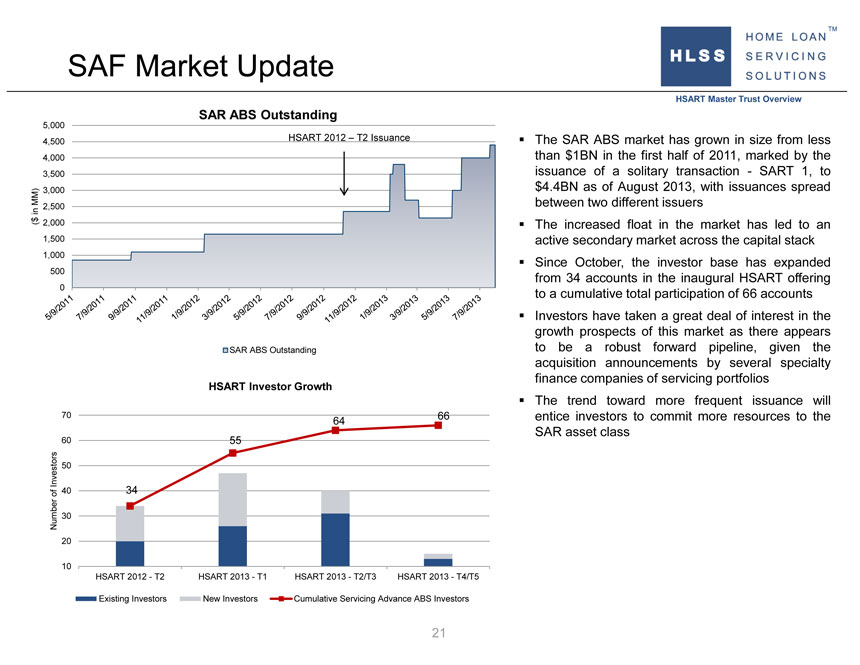
SAF Market Update HSART Master Trust Overview SAR ABS Outstanding 5,000 4,500 HSART 2012 – T2 Issuance ? The SAR ABS market has grown in size from less 4,000 than $1BN in the first half of 2011, marked by the 3,500 issuance of a solitary transaction—SART 1, to MM) 3,000 $4.4BN as of August 2013, with issuances spread between two different issuers in 2,500 $ ( 2,000? The increased float in the market has led to an 1,500 active secondary market across the capital stack 1,000 500? Since October, the investor base has expanded from 34 accounts in the inaugural HSART offering 0 to a cumulative total participation of 66 accounts ? Investors have taken a great deal of interest in the growth prospects of this market as there appears SAR ABS Outstanding to be a robust forward pipeline, given the acquisition announcements by several specialty finance companies of servicing portfolios HSART Investor Growth ? The trend toward more frequent issuance will 70 66 entice investors to commit more resources to the 64 SAR asset class 60 55 50 Investors of 40 34 Number 30 20 10 HSART 2012—T2 HSART 2013—T1 HSART 2013—T2/T3 HSART 2013—T4/T5 Existing Investors New Investors Cumulative Servicing Advance ABS Investors 21
|
|
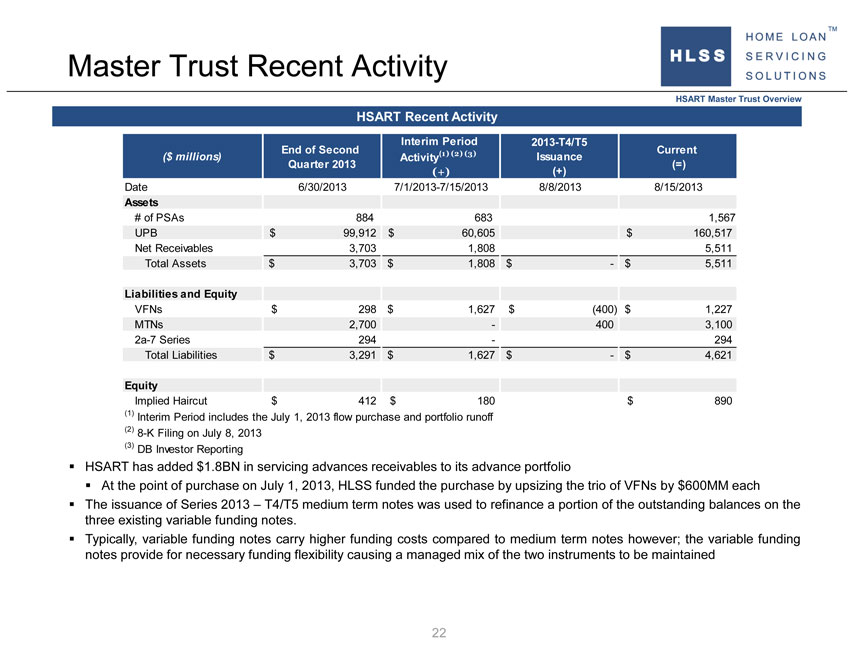
Master Trust Recent Activity HSART Master Trust Overview HSART Recent Activity Interim Period 2013-T4/T5 End of Second (1) (2) (3) Current ($ millions) Activity Issuance Quarter 2013 (=) (+) (+) Date 6/30/2013 7/1/2013-7/15/2013 8/8/2013 8/15/2013 Assets # of PSAs 884 683 1,567 UPB $ 99,912 $ 60,605 $ 160,517 Net Receivables 3,703 1,808 5,511 Total Assets $ 3,703 $ 1,808 $ —$ 5,511 Liabilities and Equity VFNs $ 298 $ 1,627 $ (400) $ 1,227 MTNs 2,700 — 400 3,100 2a-7 Series 294 — 294 Total Liabilities $ 3,291 $ 1,627 $ —$ 4,621 Equity Implied Haircut $ 412 $ 180 $ 890 (1) Interim Period includes the July 1, 2013 flow purchase and portfolio runoff (2) 8-K Filing on July 8, 2013 (3) DB Investor Reporting ? HSART has added $1.8BN in servicing advances receivables to its advance portfolio ? At the point of purchase on July 1, 2013, HLSS funded the purchase by upsizing the trio of VFNs by $600MM each ? The issuance of Series 2013 – T4/T5 medium term notes was used to refinance a portion of the outstanding balances on the three existing variable funding notes. ? Typically, variable funding notes carry higher funding costs compared to medium term notes however; the variable funding notes provide for necessary funding flexibility causing a managed mix of the two instruments to be maintained 22
|
|
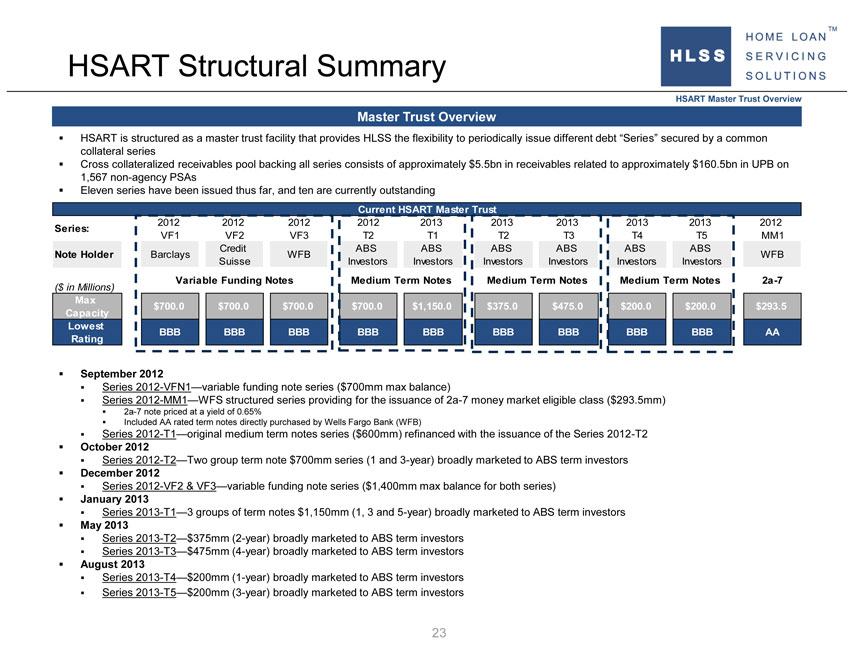
HSART Structural Summary HSART Master Trust Overview Master Trust Overview ? HSART is structured as a master trust facility that provides HLSS the flexibility to periodically issue different debt “Series” secured by a common collateral series ? Cross collateralized receivables pool backing all series consists of approximately $5.5bn in receivables related to approximately $160.5bn in UPB on 1,567 non-agency PSAs ? Eleven series have been issued thus far, and ten are currently outstanding Current HSART Master Trust 2012 2012 2012 2012 2013 2013 2013 2013 2013 2012 Series: VF1 VF2 VF3 T2 T1 T2 T3 T4 T5 MM1 Credit ABS ABS ABS ABS ABS ABS Note Holder Barclays WFB WFB Suisse Investors Investors Investors Investors Investors Investors Variable Funding Notes Medium Term Notes Medium Term Notes Medium Term Notes 2a-7 ($ in Millions) Max $700.0 $700.0 $700.0 $700.0 $1,150.0 $375.0 $475.0 $200.0 $200.0 $293.5 Capacity Lowest BBB BBB BBB BBB BBB BBB BBB BBB BBB AA Rating ? September 2012 ? Series 2012-VFN1—variable funding note series ($700mm max balance) ? Series 2012-MM1—WFS structured series providing for the issuance of 2a-7 money market eligible class ($293.5mm) ? 2a-7 note priced at a yield of 0.65% ? Included AA rated term notes directly purchased by Wells Fargo Bank (WFB) ? Series 2012-T1—original medium term notes series ($600mm) refinanced with the issuance of the Series 2012-T2 ? October 2012 ? Series 2012-T2—Two group term note $700mm series (1 and 3-year) broadly marketed to ABS term investors ? December 2012 ? Series 2012-VF2 & VF3—variable funding note series ($1,400mm max balance for both series) ? January 2013 ? Series 2013-T1—3 groups of term notes $1,150mm (1, 3 and 5-year) broadly marketed to ABS term investors ? May 2013 ? Series 2013-T2—$375mm (2-year) broadly marketed to ABS term investors ? Series 2013-T3—$475mm (4-year) broadly marketed to ABS term investors ? August 2013 ? Series 2013-T4—$200mm (1-year) broadly marketed to ABS term investors ? Series 2013-T5—$200mm (3-year) broadly marketed to ABS term investors 23
|
|
HSART Transaction Phases HSART Master Trust Overview Transaction Phases ? Revolving Period ? For any class or series, commences on the issuance date and ends on the earlier to occur of (i) a targeted amortization event and (ii) an early amortization event ? MTN Holders – Interest only period for MTNs, no principal is due or paid ? Targeted Amortization Period (“TAP”) ? For any class or series, commences upon the occurrence of a targeted amortization event. During a TAP for any class or series, new receivables are still funded while collections are used to amortize such class or series on a scheduled basis ? MTN Holders – Holders of MTN series notes will be contractually entitled to repayment over a six or twelve-month repayment of principal which are to be paid from collections. In the event, collections are unable to support the scheduled amortization of all notes in TAP, the full transaction would enter the early amortization period described below ? Facility Early Amortization Period (“EAP”) ? For all classes within the HSART facility, commences upon the occurrence of an early amortization event. During the EAP, new advances are not funded and all collections are used to fully turbo all outstandings series on a pro-rata and pari passu basis ? MTN Holders – Upon an early amortization event, all Series are allocated a pro-rata portion of collections according to their respective “Invested Amounts”. Classes within each Series are paid sequentially according to seniority 24
|
|
HSART Investor Protections HSART Master Trust Overview Investor Protections ? Target Amortization Events ? Earlier of the related expected repayment date or the occurrence of the following events: ? The interest coverage ratio is < 5x as determined on the payment date and the two (2) proceeding payment dates ? Servicer termination events on servicing agreements represents > 15.00% of all eligible servicing agreements included in the facility ? Monthly reimbursement rate < 5.00% ? Redemption Option Trigger Condition (Collateral Value of all Facility Eligible Receivables / Aggregate Note Balance) < 100% for 2 months ? Facility Eligible Receivables and Servicing Agreements ? Criteria includes but not limited to: ? Mortgage loan is secured by a first lien on the property ? All PSAs provide for “first-in, first-out” or “FIFO” reimbursement of advances ? Only 15% of PSAs provide for non-pool level recoverability provisions, which are subject to further loan level collateral tests Collateral Value Exclusions ? Advances in excess of the below established thresholds are excluded from the collateral base calculation thereby reducing the effective Advance Rate Test Threshold Explanation For each designated servicing agreement, stressed non-recoverable advances divided by Advance Ratio >100% scheduled P&I remittances for a given month cannot exceed 100% PSA level test—ratio of funded receivables to aggregate mortgage net property market value Market Value Ratio >25% cannot exceed 25% Small UPB and mortgage loan sublimit >2.5% Advances from Small Threshold PSAs cannot exceed 2.5% of all eligible receivables 1 Advances from Small Threshold PSAs and Low Threshold PSAs cannot exceed 7.5% of all Low UPB and mortgage loan sublimit >7.5% eligible receivables 1 Advances from Small Threshold PSAs, Low Threshold PSAs, and Middle Threshold PSA cannot Middle UPB and mortgage loan sublimit >15% exceed 15% of all eligible receivables Total receivables balance associated with any one REMIC cannot exceed 15% of all master trust Single PSA funded limit >15% receivables funded Loan level PSA sublimit >15% Advances from Loan-Level Receivables cannot exceed 15% of all eligible receivables The total loan level receivables with respect to any loan, cannot exceed 50% of the net property Loan Level Market Value Ratio >50% value of such mortgaged property Loan-level DSFs and not immediately recoverable (upon termination) DSFs cannot exceed 3.25% Restricted DSFs >3.25% of all master trust receivables 1. Low UPB sublimit is cumulative to include Small UPB test; Middle UPB sublimit includes both Small and Low tests. 25
|
|
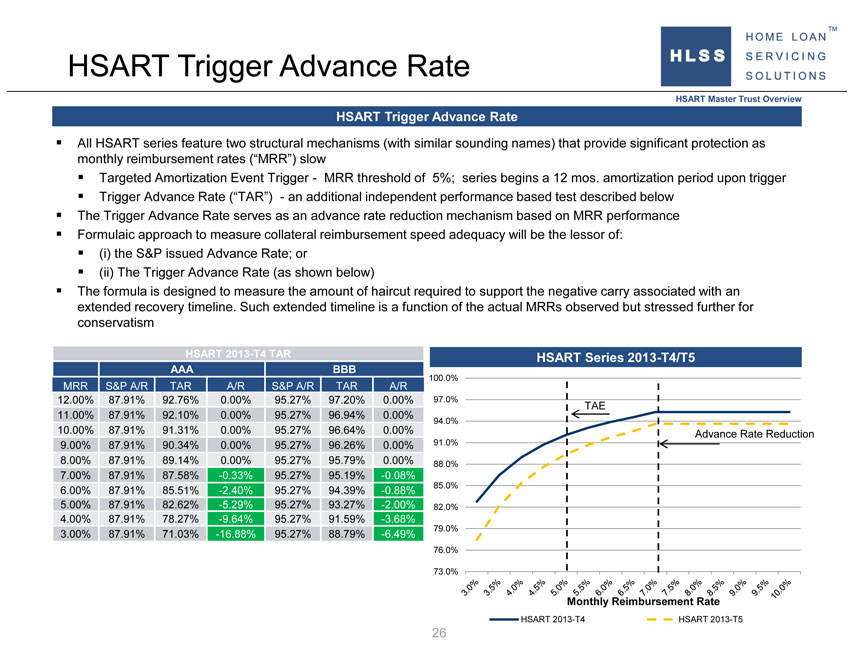
HSART Trigger Advance Rate HSART Master Trust Overview HSART Trigger Advance Rate ? All HSART series feature two structural mechanisms (with similar sounding names) that provide significant protection as monthly reimbursement rates (“MRR”) slow ? Targeted Amortization Event Trigger— MRR threshold of 5%; series begins a 12 mos. amortization period upon trigger ? Trigger Advance Rate (“TAR”) —an additional independent performance based test described below ? The Trigger Advance Rate serves as an advance rate reduction mechanism based on MRR performance ? Formulaic approach to measure collateral reimbursement speed adequacy will be the lessor of: ? (i) the S&P issued Advance Rate; or ? (ii) The Trigger Advance Rate (as shown below) ? The formula is designed to measure the amount of haircut required to support the negative carry associated with an extended recovery timeline. Such extended timeline is a function of the actual MRRs observed but stressed further for conservatism HSART 2013-T4 TAR HSART Series 2013-T4/T5 AAA BBB 100.0% MRR S&P A/R TAR A/R S&P A/R TAR A/R 12.00% 87.91% 92.76% 0.00% 95.27% 97.20% 0.00% 97.0% 11.00% 87.91% 92.10% 0.00% 95.27% 96.94% 0.00% TAE 10.00% 87.91% 91.31% 0.00% 95.27% 96.64% 0.00% 94.0% 91.0% Advance Rate Reduction 9.00% 87.91% 90.34% 0.00% 95.27% 96.26% 0.00% 8.00% 87.91% 89.14% 0.00% 95.27% 95.79% 0.00% 88.0% 7.00% 87.91% 87.58% -0.33% 95.27% 95.19% -0.08% 6.00% 87.91% 85.51% -2.40% 95.27% 94.39% -0.88% 85.0% 5.00% 87.91% 82.62% -5.29% 95.27% 93.27% -2.00% 82.0% 4.00% 87.91% 78.27% -9.64% 95.27% 91.59% -3.68% 79.0% 3.00% 87.91% 71.03% -16.88% 95.27% 88.79% -6.49% 76.0% 73.0% Monthly Reimbursement Rate HSART 2013-T4 HSART 2013-T5 26
|

|
HSART Master Trust Comparison HSART Master Trust Overview Issued: 8/8/2013 Series: 2013-T4 2013-T5 2012-VF1, VF2, VF3 Size: $ 200,000,000 $ 200,000,000 $ 2,100,000,000 BBB Advance Rate: 95.20% 93.54% 90.81% Invested Amount (estimated): $ 210,081,302 $ 213,810,695 $ 2,312,556,562 Structural Comparisons WALT: No No WAFT: No No DSF Eligible: Yes Yes Redemption Option Yes No Elimination Test: Redemption Option Trigger Yes No Condition: Collateral Value Exclusions UPB Ratio: No No Market Value Ratio: 25.00% 25.00% Small Sized PSA: 2.50% 2.50% Low Sized PSA: 7.50% 7.50% Middle Sized PSA: 15.00% 15.00% Loan Level PSA: 15.00% 10.00% Loan Level Market Value: 50.00% 50.00% DSF Loan Level MV Test: 10.00% 10.00% Restricted DSF: 3.25% 3.25% Test General Reserve Account: 4 Months 4 Months Trigger Advance Rate: 7.50% 8.00% Targeted Am Event (TAE): 5.00% 5.00% Targeted Am Period: 4 Months 1 Month Rating Downgrade of Notes: No No 27
Appendices 28
Appendix: Past Transactions 29
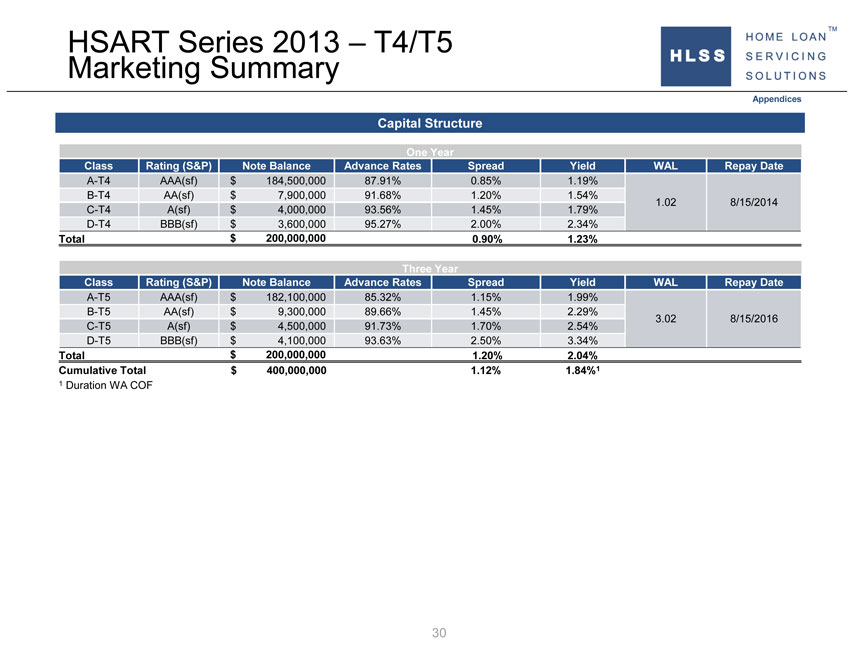
HSART Series 2013 – T4/T5 Marketing Summary Appendices Capital Structure One Year Class Rating (S&P) Note Balance Advance Rates Spread Yield WAL Repay Date A-T4 AAA(sf) $ 184,500,000 87.91% 0.85% 1.19% B-T4 AA(sf) $ 7,900,000 91.68% 1.20% 1.54% 1.02 8/15/2014 C-T4 A(sf) $ 4,000,000 93.56% 1.45% 1.79% D-T4 BBB(sf) $ 3,600,000 95.27% 2.00% 2.34% Total $ 200,000,000 0.90% 1.23% Three Year Class Rating (S&P) Note Balance Advance Rates Spread Yield WAL Repay Date A-T5 AAA(sf) $ 182,100,000 85.32% 1.15% 1.99% B-T5 AA(sf) $ 9,300,000 89.66% 1.45% 2.29% 3.02 8/15/2016 C-T5 A(sf) $ 4,500,000 91.73% 1.70% 2.54% D-T5 BBB(sf) $ 4,100,000 93.63% 2.50% 3.34% Total $ 200,000,000 1.20% 2.04% Cumulative Total $ 400,000,000 1.12% 1.84%1 1 Duration WA COF 30
|
|
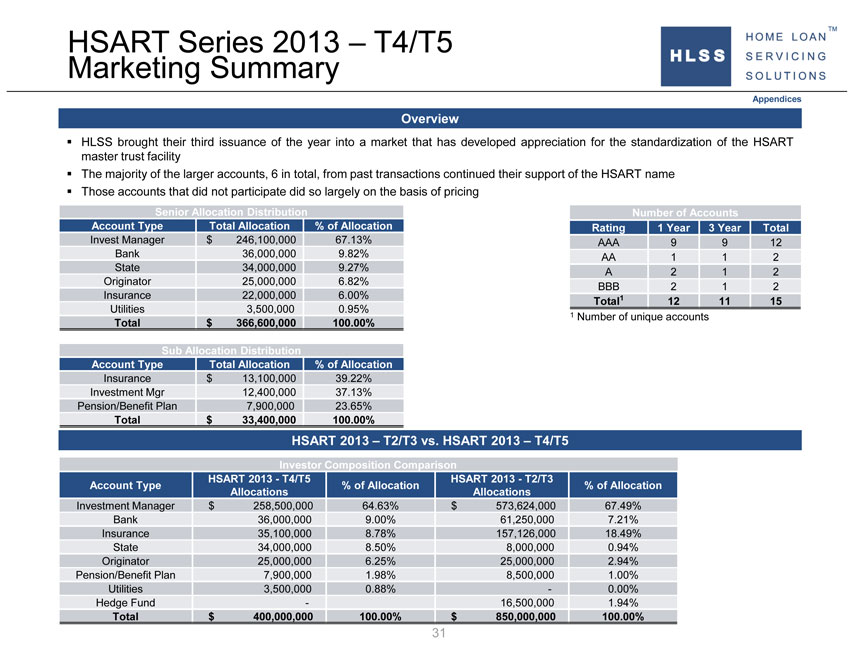
HSART Series 2013 – T4/T5 Marketing Summary Appendices Overview ? HLSS brought their third issuance of the year into a market that has developed appreciation for the standardization of the HSART master trust facility ? The majority of the larger accounts, 6 in total, from past transactions continued their support of the HSART name ? Those accounts that did not participate did so largely on the basis of pricing Senior Allocation Distribution Number of Accounts Account Type Total Allocation % of Allocation Rating 1 Year 3 Year Total Invest Manager $ 246,100,000 67.13% AAA 9 9 12 Bank 36,000,000 9.82% AA 1 1 2 State 34,000,000 9.27% A 2 1 2 Originator 25,000,000 6.82% BBB 2 1 2 Insurance 22,000,000 6.00% 1 Total 12 11 15 Utilities 3,500,000 0.95% Total $ 366,600,000 100.00% 1 Number of unique accounts Sub Allocation Distribution Account Type Total Allocation % of Allocation Insurance $ 13,100,000 39.22% Investment Mgr 12,400,000 37.13% Pension/Benefit Plan 7,900,000 23.65% Total $ 33,400,000 100.00% HSART 2013 – T2/T3 vs. HSART 2013 – T4/T5 Investor Composition Comparison HSART 2013—T4/T5 HSART 2013—T2/T3 Account Type % of Allocation % of Allocation Allocations Allocations Investment Manager $ 258,500,000 64.63% $ 573,624,000 67.49% Bank 36,000,000 9.00% 61,250,000 7.21% Insurance 35,100,000 8.78% 157,126,000 18.49% State 34,000,000 8.50% 8,000,000 0.94% Originator 25,000,000 6.25% 25,000,000 2.94% Pension/Benefit Plan 7,900,000 1.98% 8,500,000 1.00% Utilities 3,500,000 0.88% — 0.00% Hedge Fund — 16,500,000 1.94% Total $ 400,000,000 100.00% $ 850,000,000 100.00% 31
|
|
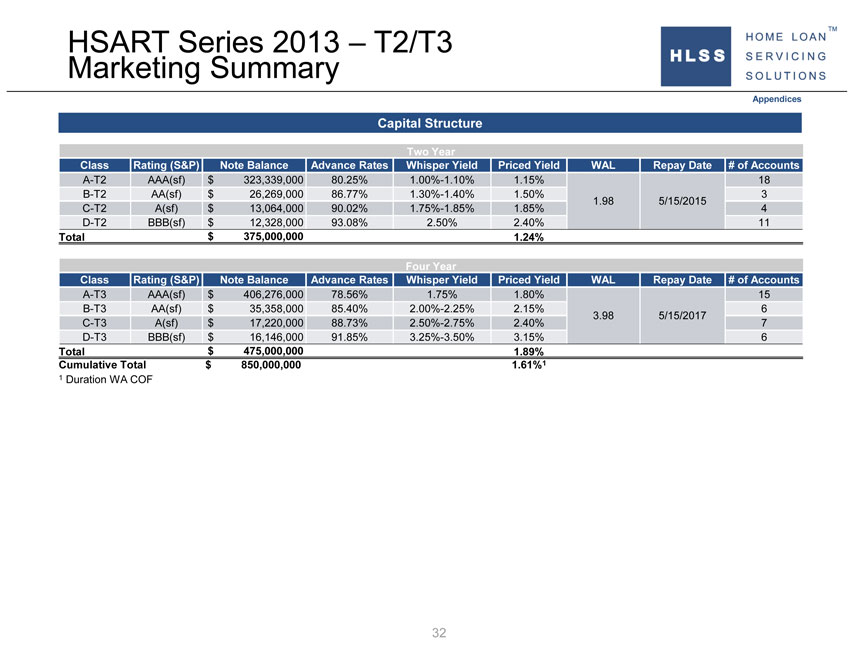
HSART Series 2013 – T2/T3 Marketing Summary Appendices Capital Structure Two Year Class Rating (S&P) Note Balance Advance Rates Whisper Yield Priced Yield WAL Repay Date # of Accounts A-T2 AAA(sf) $ 323,339,000 80.25% 1.00%-1.10% 1.15% 18 B-T2 AA(sf) $ 26,269,000 86.77% 1.30%-1.40% 1.50% 3 1.98 5/15/2015 C-T2 A(sf) $ 13,064,000 90.02% 1.75%-1.85% 1.85% 4 D-T2 BBB(sf) $ 12,328,000 93.08% 2.50% 2.40% 11 Total $ 375,000,000 1.24% Four Year Class Rating (S&P) Note Balance Advance Rates Whisper Yield Priced Yield WAL Repay Date # of Accounts A-T3 AAA(sf) $ 406,276,000 78.56% 1.75% 1.80% 15 B-T3 AA(sf) $ 35,358,000 85.40% 2.00%-2.25% 2.15% 6 3.98 5/15/2017 C-T3 A(sf) $ 17,220,000 88.73% 2.50%-2.75% 2.40% 7 D-T3 BBB(sf) $ 16,146,000 91.85% 3.25%-3.50% 3.15% 6 Total $ 475,000,000 1.89% Cumulative Total $ 850,000,000 1.61%1 1 Duration WA COF 32
|
|
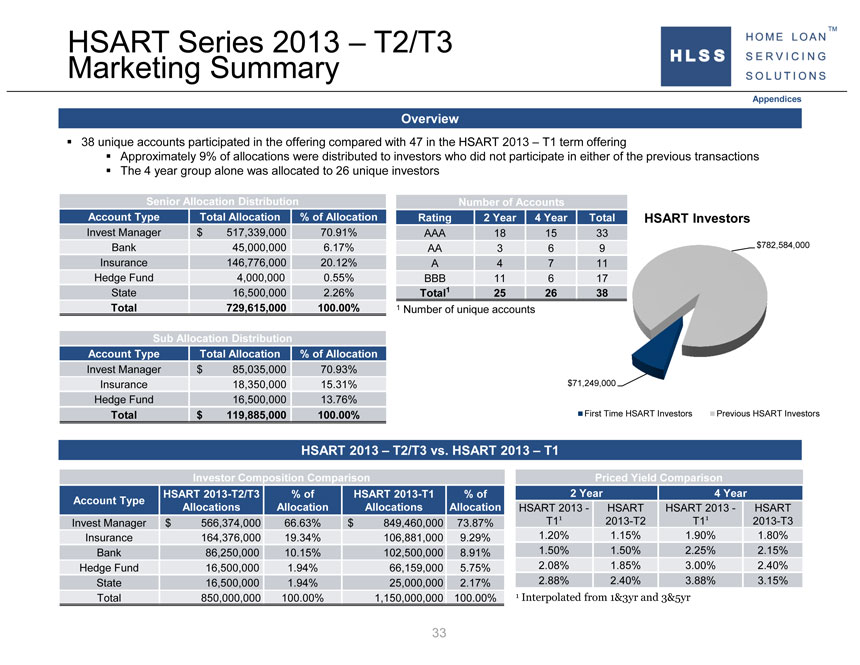
HSART Series 2013 – T2/T3 Marketing Summary Appendices Overview ? 38 unique accounts participated in the offering compared with 47 in the HSART 2013 – T1 term offering ? Approximately 9% of allocations were distributed to investors who did not participate in either of the previous transactions ? The 4 year group alone was allocated to 26 unique investors Senior Allocation Distribution Number of Accounts Account Type Total Allocation % of Allocation Rating 2 Year 4 Year Total HSART Investors Invest Manager $ 517,339,000 70.91% AAA 18 15 33 Bank 45,000,000 6.17% AA 3 6 9 $782,584,000 Insurance 146,776,000 20.12% A 4 7 11 Hedge Fund 4,000,000 0.55% BBB 11 6 17 State 16,500,000 2.26% Total1 25 26 38 Total 729,615,000 100.00% 1 Number of unique accounts Sub Allocation Distribution Account Type Total Allocation % of Allocation Invest Manager $ 85,035,000 70.93% Insurance 18,350,000 15.31% $71,249,000 Hedge Fund 16,500,000 13.76% Total $ 119,885,000 100.00% First Time HSART Investors Previous HSART Investors HSART 2013 – T2/T3 vs. HSART 2013 – T1 Investor Composition Comparison Priced Yield Comparison HSART 2013-T2/T3 % of HSART 2013-T1 % of 2 Year 4 Year Account Type Allocations Allocation Allocations Allocation HSART 2013—HSART HSART 2013—HSART T11 2013-T2 T11 2013-T3 Invest Manager $ 566,374,000 66.63% $ 849,460,000 73.87% Insurance 164,376,000 19.34% 106,881,000 9.29% 1.20% 1.15% 1.90% 1.80% Bank 86,250,000 10.15% 102,500,000 8.91% 1.50% 1.50% 2.25% 2.15% Hedge Fund 16,500,000 1.94% 66,159,000 5.75% 2.08% 1.85% 3.00% 2.40% State 16,500,000 1.94% 25,000,000 2.17% 2.88% 2.40% 3.88% 3.15% Total 850,000,000 100.00% 1,150,000,000 100.00% 1 Interpolated from 1&3yr and 3&5yr 33
|
|
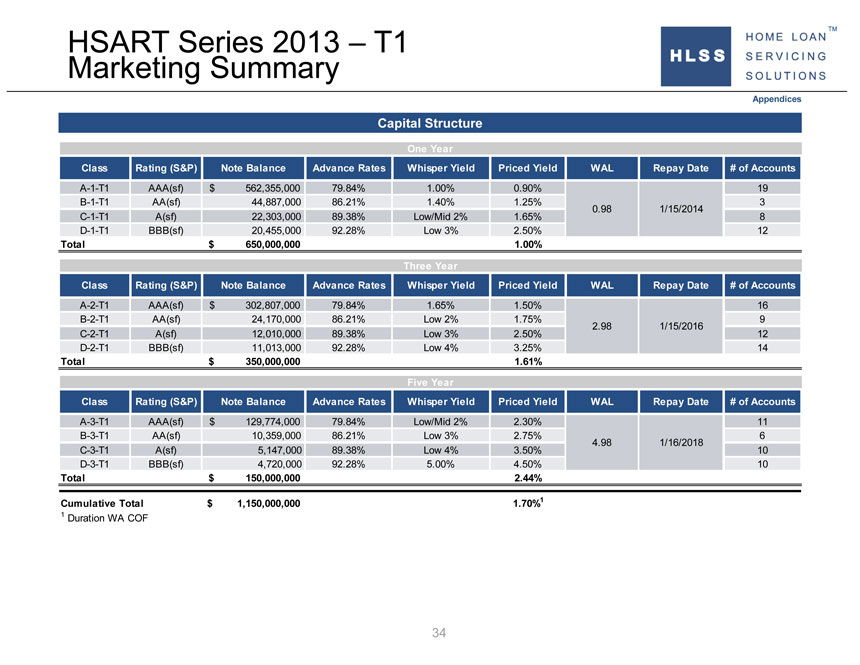
HSART Series 2013 – T1 Marketing Summary Appendices Capital Structure One Year Class Rating (S&P) Note Balance Advance Rates Whisper Yield Priced Yield WAL Repay Date # of Accounts A-1-T1 AAA(sf) $ 562,355,000 79.84% 1.00% 0.90% 19 B-1-T1 AA(sf) 44,887,000 86.21% 1.40% 1.25% 3 0.98 1/15/2014 C-1-T1 A(sf) 22,303,000 89.38% Low/Mid 2% 1.65% 8 D-1-T1 BBB(sf) 20,455,000 92.28% Low 3% 2.50% 12 Total $ 650,000,000 1.00% Three Year Class Rating (S&P) Note Balance Advance Rates Whisper Yield Priced Yield WAL Repay Date # of Accounts A-2-T1 AAA(sf) $ 302,807,000 79.84% 1.65% 1.50% 16 B-2-T1 AA(sf) 24,170,000 86.21% Low 2% 1.75% 9 2.98 1/15/2016 C-2-T1 A(sf) 12,010,000 89.38% Low 3% 2.50% 12 D-2-T1 BBB(sf) 11,013,000 92.28% Low 4% 3.25% 14 Total $ 350,000,000 1.61% Five Year Class Rating (S&P) Note Balance Advance Rates Whisper Yield Priced Yield WAL Repay Date # of Accounts A-3-T1 AAA(sf) $ 129,774,000 79.84% Low/Mid 2% 2.30% 11 B-3-T1 AA(sf) 10,359,000 86.21% Low 3% 2.75% 6 4.98 1/16/2018 C-3-T1 A(sf) 5,147,000 89.38% Low 4% 3.50% 10 D-3-T1 BBB(sf) 4,720,000 92.28% 5.00% 4.50% 10 Total $ 150,000,000 2.44% Cumulative Total $ 1,150,000,000 1.70%1 1 Duration WA COF 34
|
|
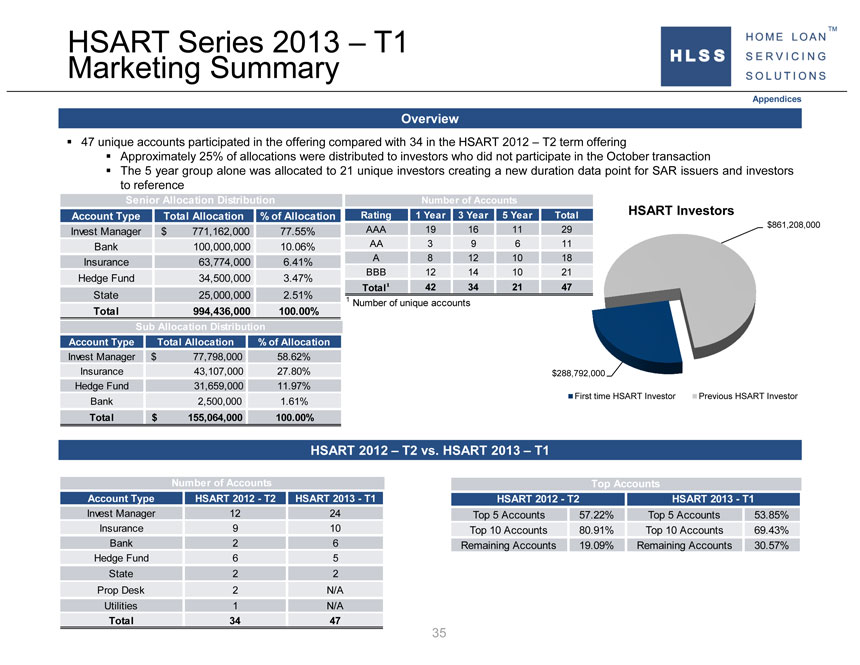
HSART Series 2013 – T1 Marketing Summary Appendices Overview ? 47 unique accounts participated in the offering compared with 34 in the HSART 2012 – T2 term offering ? Approximately 25% of allocations were distributed to investors who did not participate in the October transaction ? The 5 year group alone was allocated to 21 unique investors creating a new duration data point for SAR issuers and investors to reference Senior Allocation Distribution Number of Accounts HSART Investors Account Type Total Allocation % of Allocation Rating 1 Year 3 Year 5 Year Total $861,208,000 Invest Manager $ 771,162,000 77.55% AAA 19 16 11 29 Bank 100,000,000 10.06% AA 3 9 6 11 Insurance 63,774,000 6.41% A 8 12 10 18 BBB 12 14 10 21 Hedge Fund 34,500,000 3.47% Total1 42 34 21 47 State 25,000,000 2.51% 1 Total 994,436,000 100.00% Number of unique accounts Sub Allocation Distribution Account Type Total Allocation % of Allocation Invest Manager $ 77,798,000 58.62% Insurance 43,107,000 27.80% $288,792,000 Hedge Fund 31,659,000 11.97% First time HSART Investor Previous HSART Investor Bank 2,500,000 1.61% Total $ 155,064,000 100.00% HSART 2012 – T2 vs. HSART 2013 – T1 Number of Accounts Top Accounts Account Type HSART 2012—T2 HSART 2013—T1 HSART 2012—T2 HSART 2013—T1 Invest Manager 12 24 Top 5 Accounts 57.22% Top 5 Accounts 53.85% Insurance 9 10 Top 10 Accounts 80.91% Top 10 Accounts 69.43% Bank 2 6 Remaining Accounts 19.09% Remaining Accounts 30.57% Hedge Fund 6 5 State 2 2 Prop Desk 2 N/A Utilities 1 N/A Total 34 47 35
|
|
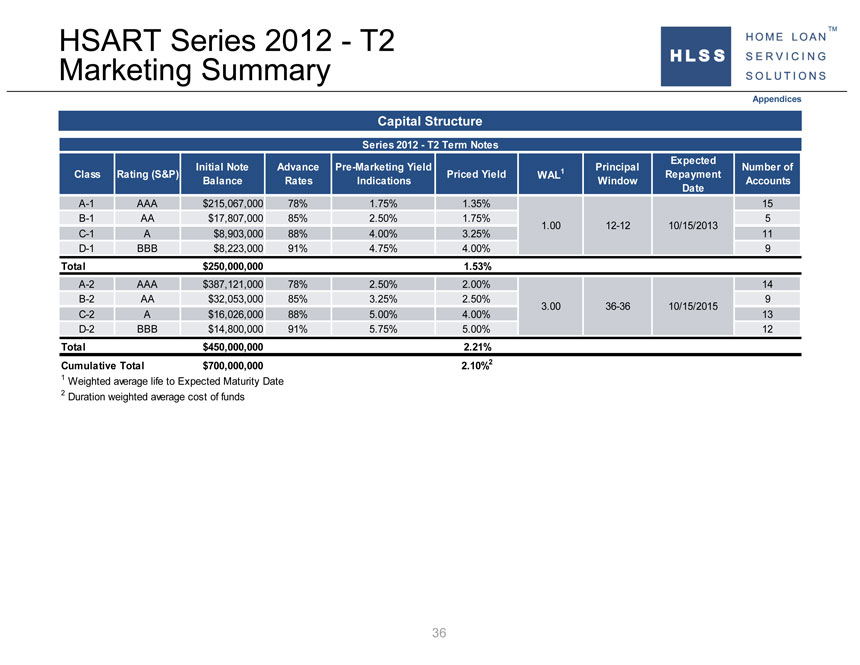
HSART Series 2012—T2 Marketing Summary Appendices Capital Structure Series 2012—T2 Term Notes Expected Initial Note Advance Pre-Marketing Yield Principal Number of Class Rating (S&P) Priced Yield WAL1 Repayment Balance Rates Indications Window Accounts Date A-1 AAA $215,067,000 78% 1.75% 1.35% 15 B-1 AA $17,807,000 85% 2.50% 1.75% 5 1.00 12-12 10/15/2013 C-1 A $8,903,000 88% 4.00% 3.25% 11 D-1 BBB $8,223,000 91% 4.75% 4.00% 9 Total $250,000,000 1.53% A-2 AAA $387,121,000 78% 2.50% 2.00% 14 B-2 AA $32,053,000 85% 3.25% 2.50% 9 3.00 36-36 10/15/2015 C-2 A $16,026,000 88% 5.00% 4.00% 13 D-2 BBB $14,800,000 91% 5.75% 5.00% 12 Total $450,000,000 2.21% Cumulative Total $700,000,000 2.10%2 1 Weighted average life to Expected Maturity Date 2 Duration weighted average cost of funds 36
|
|
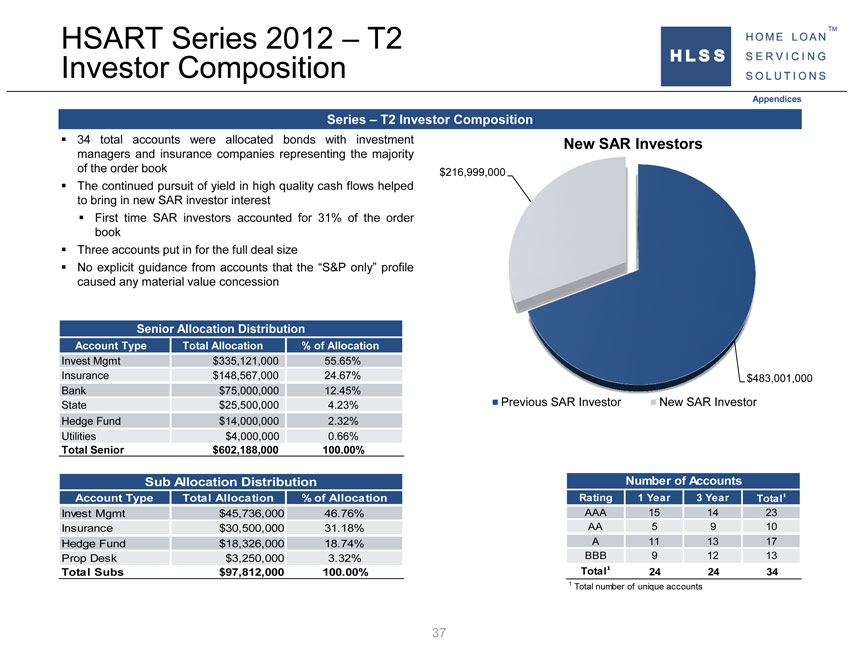
HSART Series 2012 – T2 Investor Composition Appendices Series – T2 Investor Composition ? 34 total accounts were allocated bonds with investment New SAR Investors managers and insurance companies representing the majority of the order book $216,999,000 ? The continued pursuit of yield in high quality cash flows helped to bring in new SAR investor interest ? First time SAR investors accounted for 31% of the order book ? Three accounts put in for the full deal size ? No explicit guidance from accounts that the “S&P only” profile caused any material value concession Senior Allocation Distribution Account Type Total Allocation % of Allocation Invest Mgmt $335,121,000 55.65% Insurance $148,567,000 24.67% $483,001,000 Bank $75,000,000 12.45% State $25,500,000 4.23% Previous SAR Investor New SAR Investor Hedge Fund $14,000,000 2.32% Utilities $4,000,000 0.66% Total Senior $602,188,000 100.00% Sub Allocation Distribution Number of Accounts Account Type Total Allocation % of Allocation Rating 1 Year 3 Year Total1 Invest Mgmt $45,736,000 46.76% AAA 15 14 23 Insurance $30,500,000 31.18% AA 5 9 10 Hedge Fund $18,326,000 18.74% A 11 13 17 Prop Desk $3,250,000 3.32% BBB 9 12 13 Total Subs $97,812,000 100.00% Total1 24 24 34 1 Total number of unique accounts 37
|
|
Appendix: Performance 38
|
|
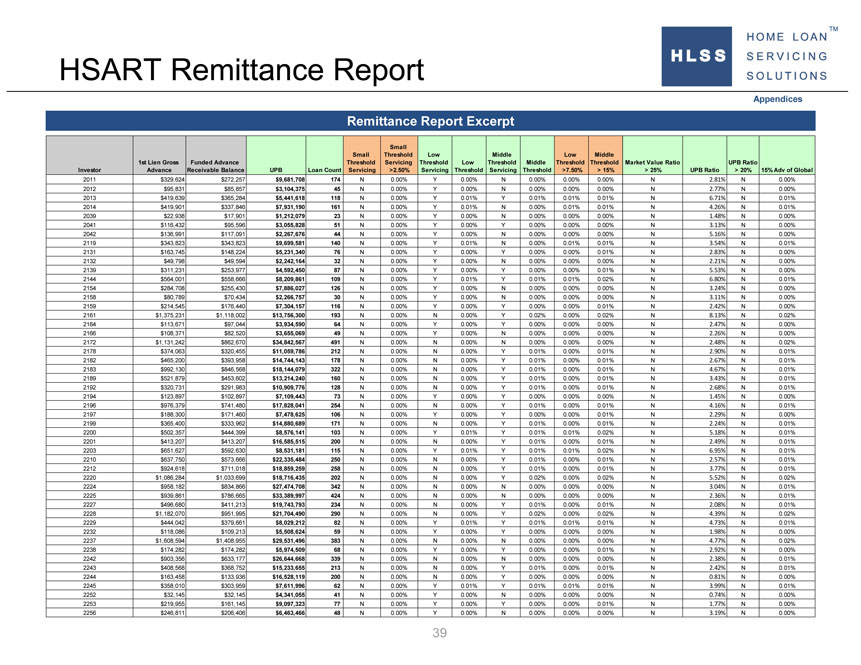
HSART Remittance Report Appendices Remittance Report Excerpt Small Small Threshold Low Middle Low Middle 1st Lien Gross Funded Advance Threshold Servicing Threshold Low Threshold Middle Threshold Threshold Market Value Ratio UPB Ratio Investor Advance Receivable Balance UPB Loan Count Servicing >2.50% Servicing Threshold Servicing Threshold >7.50% > 15% > 25% UPB Ratio > 20% 15% Adv of Global 2011 $329,624 $272,257 $9,681,708 174 N 0.00% Y 0.00% N 0.00% 0.00% 0.00% N 2.81% N 0.00% 2012 $95,831 $85,857 $3,104,375 45 N 0.00% Y 0.00% N 0.00% 0.00% 0.00% N 2.77% N 0.00% 2013 $419,639 $365,284 $5,441,618 118 N 0.00% Y 0.01% Y 0.01% 0.01% 0.01% N 6.71% N 0.01% 2014 $419,901 $337,846 $7,931,190 161 N 0.00% Y 0.01% N 0.00% 0.01% 0.01% N 4.26% N 0.01% 2039 $22,938 $17,901 $1,212,079 23 N 0.00% Y 0.00% N 0.00% 0.00% 0.00% N 1.48% N 0.00% 2041 $116,432 $95,596 $3,055,828 51 N 0.00% Y 0.00% Y 0.00% 0.00% 0.00% N 3.13% N 0.00% 2042 $136,991 $117,091 $2,267,676 44 N 0.00% Y 0.00% N 0.00% 0.00% 0.00% N 5.16% N 0.00% 2119 $343,823 $343,823 $9,699,581 140 N 0.00% Y 0.01% N 0.00% 0.01% 0.01% N 3.54% N 0.01% 2131 $163,745 $148,224 $5,231,340 76 N 0.00% Y 0.00% Y 0.00% 0.00% 0.01% N 2.83% N 0.00% 2132 $49,798 $49,594 $2,242,164 32 N 0.00% Y 0.00% N 0.00% 0.00% 0.00% N 2.21% N 0.00% 2139 $311,231 $253,977 $4,592,450 87 N 0.00% Y 0.00% Y 0.00% 0.00% 0.01% N 5.53% N 0.00% 2144 $564,001 $558,666 $8,209,861 109 N 0.00% Y 0.01% Y 0.01% 0.01% 0.02% N 6.80% N 0.01% 2154 $284,708 $255,430 $7,886,027 126 N 0.00% Y 0.00% N 0.00% 0.00% 0.00% N 3.24% N 0.00% 2158 $80,789 $70,434 $2,266,757 30 N 0.00% Y 0.00% N 0.00% 0.00% 0.00% N 3.11% N 0.00% 2159 $214,545 $176,440 $7,304,157 116 N 0.00% Y 0.00% Y 0.00% 0.00% 0.01% N 2.42% N 0.00% 2161 $1,375,231 $1,118,002 $13,756,300 193 N 0.00% N 0.00% Y 0.02% 0.00% 0.02% N 8.13% N 0.02% 2164 $113,671 $97,044 $3,934,590 64 N 0.00% Y 0.00% Y 0.00% 0.00% 0.00% N 2.47% N 0.00% 2166 $108,371 $82,520 $3,655,069 49 N 0.00% Y 0.00% N 0.00% 0.00% 0.00% N 2.26% N 0.00% 2172 $1,131,242 $862,670 $34,842,567 491 N 0.00% N 0.00% N 0.00% 0.00% 0.00% N 2.48% N 0.02% 2178 $374,063 $320,455 $11,059,786 212 N 0.00% N 0.00% Y 0.01% 0.00% 0.01% N 2.90% N 0.01% 2182 $465,200 $393,958 $14,744,143 178 N 0.00% N 0.00% Y 0.01% 0.00% 0.01% N 2.67% N 0.01% 2183 $992,130 $846,568 $18,144,079 322 N 0.00% N 0.00% Y 0.01% 0.00% 0.01% N 4.67% N 0.01% 2189 $521,879 $453,602 $13,214,240 160 N 0.00% N 0.00% Y 0.01% 0.00% 0.01% N 3.43% N 0.01% 2192 $320,731 $291,983 $10,909,776 128 N 0.00% N 0.00% Y 0.01% 0.00% 0.01% N 2.68% N 0.01% 2194 $123,897 $102,897 $7,109,443 73 N 0.00% Y 0.00% Y 0.00% 0.00% 0.00% N 1.45% N 0.00% 2196 $976,379 $741,480 $17,828,041 254 N 0.00% N 0.00% Y 0.01% 0.00% 0.01% N 4.16% N 0.01% 2197 $188,300 $171,460 $7,478,625 106 N 0.00% Y 0.00% Y 0.00% 0.00% 0.01% N 2.29% N 0.00% 2199 $365,400 $333,962 $14,880,689 171 N 0.00% N 0.00% Y 0.01% 0.00% 0.01% N 2.24% N 0.01% 2200 $502,357 $444,399 $8,576,141 103 N 0.00% Y 0.01% Y 0.01% 0.01% 0.02% N 5.18% N 0.01% 2201 $413,207 $413,207 $16,585,515 200 N 0.00% N 0.00% Y 0.01% 0.00% 0.01% N 2.49% N 0.01% 2203 $651,627 $592,630 $8,531,181 115 N 0.00% Y 0.01% Y 0.01% 0.01% 0.02% N 6.95% N 0.01% 2210 $637,750 $573,666 $22,335,484 250 N 0.00% N 0.00% Y 0.01% 0.00% 0.01% N 2.57% N 0.01% 2212 $924,618 $711,018 $18,859,259 258 N 0.00% N 0.00% Y 0.01% 0.00% 0.01% N 3.77% N 0.01% 2220 $1,086,284 $1,033,699 $18,716,435 202 N 0.00% N 0.00% Y 0.02% 0.00% 0.02% N 5.52% N 0.02% 2224 $958,182 $834,866 $27,474,708 342 N 0.00% N 0.00% N 0.00% 0.00% 0.00% N 3.04% N 0.01% 2225 $939,861 $786,665 $33,389,997 424 N 0.00% N 0.00% N 0.00% 0.00% 0.00% N 2.36% N 0.01% 2227 $496,680 $411,213 $19,743,793 234 N 0.00% N 0.00% Y 0.01% 0.00% 0.01% N 2.08% N 0.01% 2228 $1,182,070 $951,995 $21,704,490 290 N 0.00% N 0.00% Y 0.02% 0.00% 0.02% N 4.39% N 0.02% 2229 $444,042 $379,661 $8,029,212 82 N 0.00% Y 0.01% Y 0.01% 0.01% 0.01% N 4.73% N 0.01% 2232 $118,086 $109,213 $5,508,624 59 N 0.00% Y 0.00% Y 0.00% 0.00% 0.00% N 1.98% N 0.00% 2237 $1,608,594 $1,408,955 $29,531,496 383 N 0.00% N 0.00% N 0.00% 0.00% 0.00% N 4.77% N 0.02% 2238 $174,282 $174,282 $5,974,509 68 N 0.00% Y 0.00% Y 0.00% 0.00% 0.01% N 2.92% N 0.00% 2242 $903,356 $633,177 $26,644,668 339 N 0.00% N 0.00% N 0.00% 0.00% 0.00% N 2.38% N 0.01% 2243 $408,568 $368,752 $15,233,655 213 N 0.00% N 0.00% Y 0.01% 0.00% 0.01% N 2.42% N 0.01% 2244 $163,458 $133,936 $16,528,119 200 N 0.00% N 0.00% Y 0.00% 0.00% 0.00% N 0.81% N 0.00% 2245 $358,010 $303,959 $7,611,996 62 N 0.00% Y 0.01% Y 0.01% 0.01% 0.01% N 3.99% N 0.01% 2252 $32,145 $32,145 $4,341,055 41 N 0.00% Y 0.00% N 0.00% 0.00% 0.00% N 0.74% N 0.00% 2253 $219,955 $161,145 $9,097,323 77 N 0.00% Y 0.00% Y 0.00% 0.00% 0.01% N 1.77% N 0.00% 2256 $246,811 $206,406 $6,463,466 48 N 0.00% Y 0.00% N 0.00% 0.00% 0.00% N 3.19% N 0.00% 39
|
|
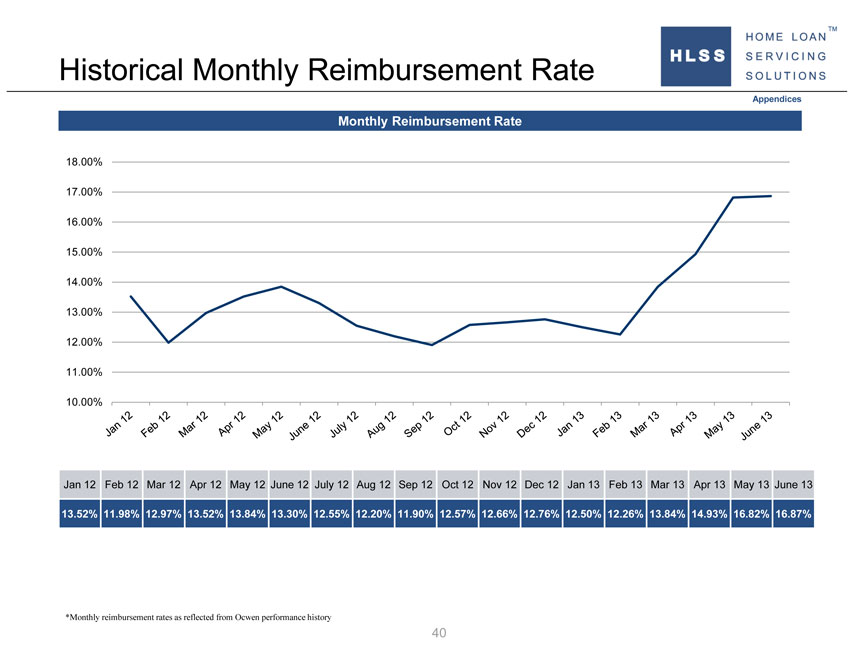
Historical Monthly Reimbursement Rate Appendices Monthly Reimbursement Rate 18.00% 17.00% 16.00% 15.00% 14.00% 13.00% 12.00% 11.00% 10.00% Jan 12 Feb 12 Mar 12 Apr 12 May 12 June 12 July 12 Aug 12 Sep 12 Oct 12 Nov 12 Dec 12 Jan 13 Feb 13 Mar 13 Apr 13 May 13 June 13 13.52% 11.98% 12.97% 13.52% 13.84% 13.30% 12.55% 12.20% 11.90% 12.57% 12.66% 12.76% 12.50% 12.26% 13.84% 14.93% 16.82% 16.87% *Monthly reimbursement rates as reflected from Ocwen performance history 40
|
|
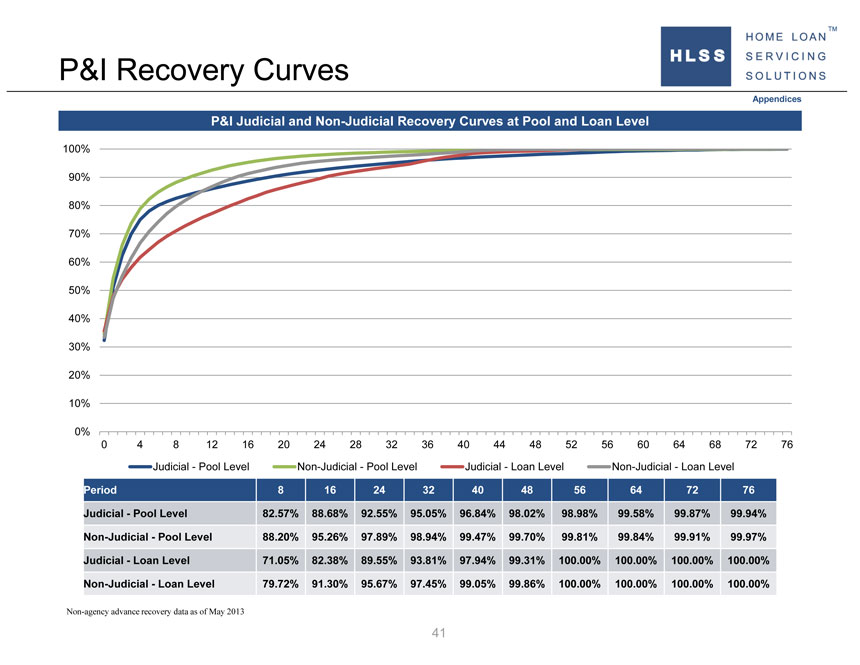
P&I Recovery Curves Appendices P&I Judicial and Non-Judicial Recovery Curves at Pool and Loan Level 100% 90% 80% 70% 60% 50% 40% 30% 20% 10% 0% 0 4 8 12 16 20 24 28 32 36 40 44 48 52 56 60 64 68 72 76 Judicial—Pool Level Non-Judicial—Pool Level Judicial—Loan Level Non-Judicial—Loan Level Period 8 16 24 32 40 48 56 64 72 76 Judicial—Pool Level 82.57% 88.68% 92.55% 95.05% 96.84% 98.02% 98.98% 99.58% 99.87% 99.94% Non-Judicial—Pool Level 88.20% 95.26% 97.89% 98.94% 99.47% 99.70% 99.81% 99.84% 99.91% 99.97% Judicial—Loan Level 71.05% 82.38% 89.55% 93.81% 97.94% 99.31% 100.00% 100.00% 100.00% 100.00% Non-Judicial—Loan Level 79.72% 91.30% 95.67% 97.45% 99.05% 99.86% 100.00% 100.00% 100.00% 100.00% Non-agency advance recovery data as of May 2013 41
|
|
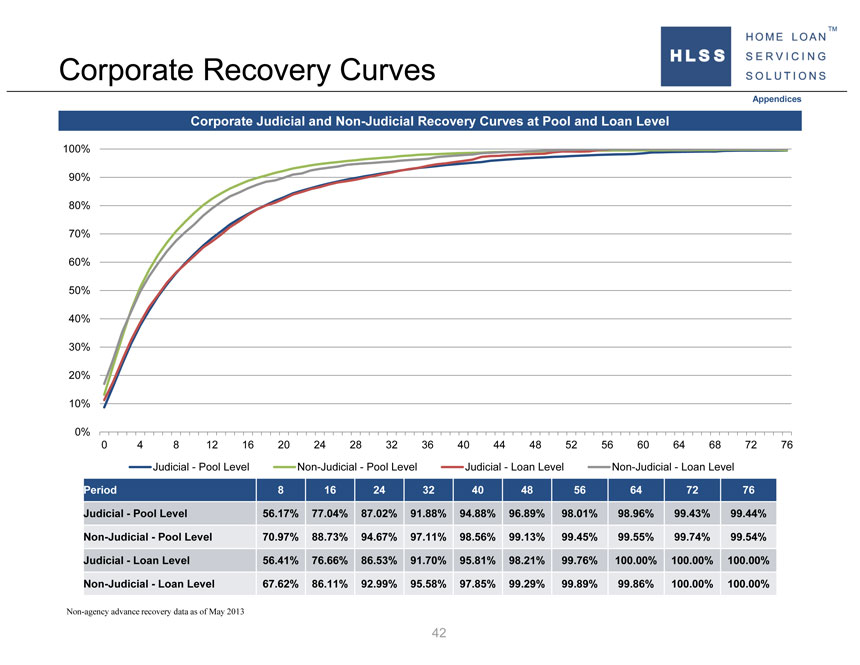
Corporate Recovery Curves Appendices Corporate Judicial and Non-Judicial Recovery Curves at Pool and Loan Level 100% 90% 80% 70% 60% 50% 40% 30% 20% 10% 0% 0 4 8 12 16 20 24 28 32 36 40 44 48 52 56 60 64 68 72 76 Judicial—Pool Level Non-Judicial—Pool Level Judicial—Loan Level Non-Judicial—Loan Level Period 8 16 24 32 40 48 56 64 72 76 Judicial—Pool Level 56.17% 77.04% 87.02% 91.88% 94.88% 96.89% 98.01% 98.96% 99.43% 99.44% Non-Judicial—Pool Level 70.97% 88.73% 94.67% 97.11% 98.56% 99.13% 99.45% 99.55% 99.74% 99.54% Judicial—Loan Level 56.41% 76.66% 86.53% 91.70% 95.81% 98.21% 99.76% 100.00% 100.00% 100.00% Non-Judicial—Loan Level 67.62% 86.11% 92.99% 95.58% 97.85% 99.29% 99.89% 99.86% 100.00% 100.00% Non-agency advance recovery data as of May 2013 42
|
|
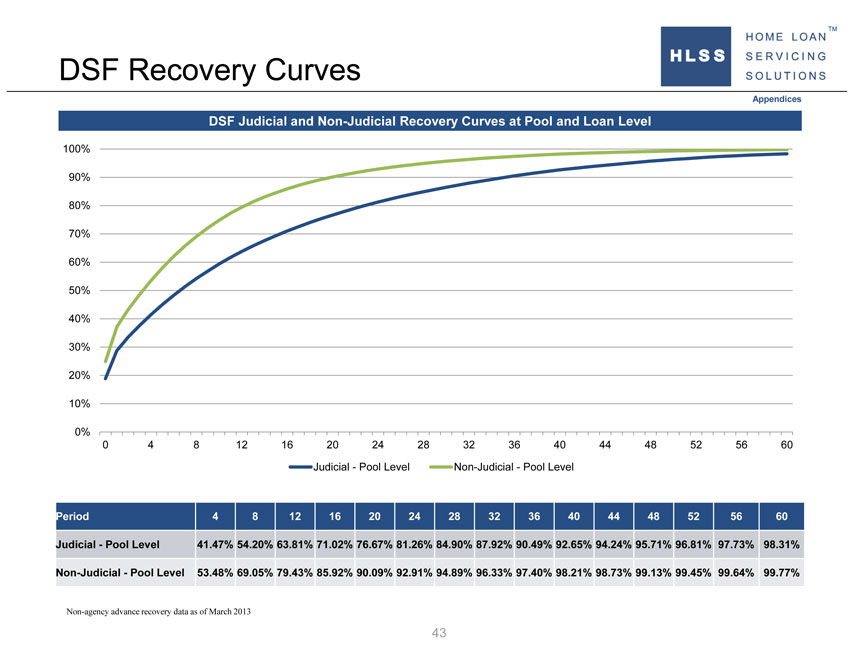
DSF Recovery Curves Appendices DSF Judicial and Non-Judicial Recovery Curves at Pool and Loan Level 100% 90% 80% 70% 60% 50% 40% 30% 20% 10% 0% 0 4 8 12 16 20 24 28 32 36 40 44 48 52 56 60 Judicial—Pool Level Non-Judicial—Pool Level Period 4 8 12 16 20 24 28 32 36 40 44 48 52 56 60 Judicial—Pool Level 41.47% 54.20% 63.81% 71.02% 76.67% 81.26% 84.90% 87.92% 90.49% 92.65% 94.24% 95.71% 96.81% 97.73% 98.31% Non-Judicial—Pool Level 53.48% 69.05% 79.43% 85.92% 90.09% 92.91% 94.89% 96.33% 97.40% 98.21% 98.73% 99.13% 99.45% 99.64% 99.77% Non-agency advance recovery data as of March 2013 43
|
|
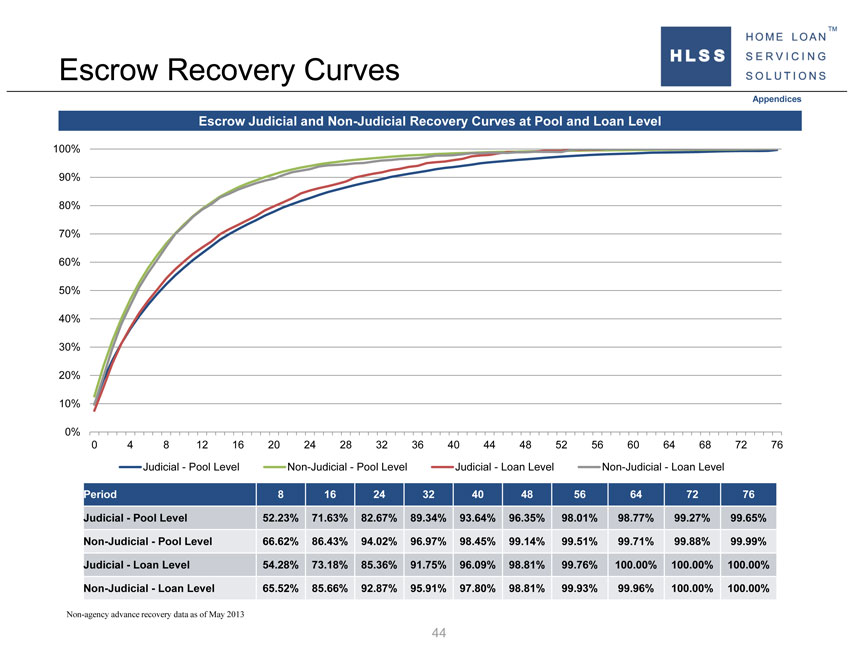
Escrow Recovery Curves Appendices Escrow Judicial and Non-Judicial Recovery Curves at Pool and Loan Level 100% 90% 80% 70% 60% 50% 40% 30% 20% 10% 0% 0 4 8 12 16 20 24 28 32 36 40 44 48 52 56 60 64 68 72 76 Judicial—Pool Level Non-Judicial—Pool Level Judicial—Loan Level Non-Judicial—Loan Level Period 8 16 24 32 40 48 56 64 72 76 Judicial—Pool Level 52.23% 71.63% 82.67% 89.34% 93.64% 96.35% 98.01% 98.77% 99.27% 99.65% Non-Judicial—Pool Level 66.62% 86.43% 94.02% 96.97% 98.45% 99.14% 99.51% 99.71% 99.88% 99.99% Judicial—Loan Level 54.28% 73.18% 85.36% 91.75% 96.09% 98.81% 99.76% 100.00% 100.00% 100.00% Non-Judicial—Loan Level 65.52% 85.66% 92.87% 95.91% 97.80% 98.81% 99.93% 99.96% 100.00% 100.00% Non-agency advance recovery data as of May 2013 44
TM HLSS Servicer Advance Receivables Trust