Exhibit 99.2
(An exploration stage company)
MANAGEMENT’S DISCUSSION AND ANALYSIS
OF AURYN RESOURCES INC.
FOR THE SIX MONTHS ENDED JUNE 30, 2018
Dated: August 9, 2018
AURYN RESOURCES INC.
Management’s Discussion and Analysis of Financial Condition and
Results of Operations for the Six Months Ended June 30, 2018
(In thousands of Canadian dollars, unless otherwise noted)
TABLE OF CONTENTS
| HIGHLIGHTS FOR THE SIX MONTHS ENDED JUNE 30, 2018 AND THE PERIOD UP TO AUGUST 9, 2018 | 3 |
| 1.1. Date and forward-looking statements | 4 |
| 1.1.1 Forward-looking statements and risk factors | 4 |
| 1.2.1 Description of business | 5 |
| 1.2.2 Committee Bay and Gibson MacQuoid projects | 5 |
| Ownership | 6 |
| Mineral resources | 6 |
| 2018 Resupply and staging operations at Committee Bay | 6 |
| Gibson MacQuoid | 8 |
| 1.2.3 Homestake Ridge project | 8 |
| 1.2.3 Homestake Ridge project (continued) | 9 |
| 2018 Exploration Plans | 9 |
| 1.2.4 Peruvian exploration projects | 9 |
| Sombrero gold-copper project | 9 |
| 1.2.4 Peruvian exploration projects (continued) | 10 |
| Huilacollo Project | 10 |
| Baños del Indio | 10 |
| 1.2.5 Qualified persons and technical disclosures | 10 |
| 1.2.5 Qualified persons and technical disclosures (continued) | 11 |
| 1.2.5 Qualified persons and technical disclosures (continued) | 12 |
| 1.3 Selected annual financial information | 12 |
| 1.4 Discussion of operations | 12 |
| 1.5 Summary of quarterly results | 15 |
| 1.6/1.7 Financial position and liquidity and capital resources | 15 |
| 1.8 Off-balance sheet arrangements | 19 |
| 1.9 Transactions with related parties | 20 |
| 1.10 Subsequent events | 20 |
| 1.11 Proposed transactions | 20 |
| 1.12 Critical accounting estimates | 20 |
| 1.12 Critical accounting estimates (continued) | 21 |
| 1.13 Changes in accounting policies including initial adoption | 22 |
| 1.13 Changes in accounting policies including initial adoption (continued) | 23 |
| 1.13 Changes in accounting policies including initial adoption (continued) | 24 |
| 1.14 Financial instruments and other instruments | 24 |
| 1.15 Other requirements | 24 |
| Capital structure | 24 |
| 1.15 Other requirements (continued) | 25 |
| Controls and procedures | 25 |
AURYN RESOURCES INC.
Management’s Discussion and Analysis of Financial Condition and
Results of Operations for the Six Months Ended June 30, 2018
(In thousands of Canadian dollars, unless otherwise noted)
HIGHLIGHTS FOR THE SIX MONTHS ENDED JUNE 30, 2018 AND THE PERIOD UP TO AUGUST 9, 2018
Corporate highlights
| · | On July 30, 2018 the Company announced that it has arranged a $4.6 million non-brokered flow-through private placement. The placement will consist of approximately 1.25 million flow-through common shares priced at CAD$1.60 per flow-through share and approximately 1.5 million charity flow-through shares priced at CAD$ 1.75 per charity flow-through share. |
| · | On June 25, 2018, April 26, 2018 and April 17, 2018, the Company announced the expansion of claim holdings at its Sombrero copper and gold project, in Southern Peru. The culmination of two different staking efforts and the signing of an option agreement have increased the Company’s Sombrero project to over 100,000 hectares encapsulating areas that produced the highest geochemical responses from a regional scale stream sediment survey conducted in late 2017. |
| · | On March 23, 2018, the Company closed a bought deal offering (the “2018 Offering”) for gross proceeds of US$ 7.8 million. A total of 6,015,385 common shares of the Company were sold at a price of US$1.30 per share. In addition, the Company completed a concurrent private placement financing involving the sale of 1,091,826 flow-through common shares of the Company at a price equal to the Canadian dollar equivalent of US$1.82 per share, for gross proceeds of US$2.0 million. |
Operational highlights
| · | On July 15, 2018, the Company commenced drilling at its Committee Bay gold project located in Nunavut Canada. The Company intends to drill approximately 10,000 meters across several targets including follow up drilling to its 2017 discovery hole at the Aiviq target. |
| · | On June 19, 2018, the Company released results from its on-going surface program at the Sombrero gold and copper project located in Southern Peru. Highlights from these results include trenches with 99 meters of 0.46% copper equivalent and 105 meters of 0.3% copper equivalent, where mineralization remains open, and several high-grade gold structures, which sampled up to 193 g/t gold. |
| · | On April 17, 2018, the Company announced the commencement of surface exploration at its Sombrero gold and copper project located in Southern Peru. The program was initiated through the completion of a long-term access agreement with the Huancasancos Community allowing Auryn to follow-up on the previously recognized surface mineralization and to delineate drill targets on the southern half of the project. |
| · | On April 13, 2018, the Company announced the results from the initial five holes of drilling at its Huilacollo project in the Tacna Province, Peru. The highlight from the program was hole 17HUI-002 which returned an intercept of 62 meters of 0.45 g/t Au (including 22 meters of 0.71g/t Au) 100 meters to the northwest of the previously drilled mineralization on the project. |
| · | On February 6, 2018, the Company announced its preliminary drill plans and staging efforts for its Committee Bay project in Nunavut. During the months of March and April, the Company mobilized fuel and other critical supplies. |
< Refer to the page 4 for cautionary wording concerning forward-looking information>
AURYN RESOURCES INC.
Management’s Discussion and Analysis of Financial Condition and
Results of Operations for the Six Months Ended June 30, 2018
(In thousands of Canadian dollars, unless otherwise noted)
1.1. Date and forward-looking statements
This Management Discussion and Analysis (“MD&A”) of Auryn Resources Inc. (the “Company” or “Auryn”) has been prepared by management to assist the reader to assess material changes in the condensed consolidated interim financial condition and results of operations of the Company as at June 30, 2018 and for the six months then ended. This MD&A should be read in conjunction with the condensed consolidated interim financial statements of the Company and related notes thereto as at and for the three and six months ended June 30, 2018 and 2017. The condensed consolidated interim financial statements have been prepared in accordance with International Accounting Standard (“IAS”) 34, “Interim Financial Reporting” using accounting policies consistent with International Financial Reporting Standards (“IFRS”) as issued by the International Accounting Standards Board (“IASB”) and Interpretations issued by the International Financial Reporting Interpretations Committee (“IFRIC”). The accounting policies followed in these condensed consolidated interim financial statements are the same as those applied in the Company’s most recent audited annual consolidated financial statements for the year ended December 31, 2017, except as outlined in note 2 of the June 30, 2018 condensed consolidated interim financial statements. All financial information has been prepared in accordance with International Financial Reporting Standards (“IFRS” or “GAAP”) and all dollar amounts presented are Canadian dollars unless otherwise stated.
The effective date of this MD&A is August 9, 2018.
1.1.1 Forward-looking statements and risk factors
This MD&A may contain “forward-looking statements” which reflect the Company’s current expectations regarding the future results of operations, performance and achievements of the Company, including but not limited to statements with respect to the Company’s plans or future financial or operating performance, the estimation of mineral reserves and resources, conclusions of economic assessments of projects, the timing and amount of estimated future production, costs of future production, future capital expenditures, costs and timing of the development of deposits, success of exploration activities, permitting time lines, requirements for additional capital, sources and timing of additional financing, realization of unused tax benefits and future outcome of legal and tax matters.
The Company has tried, wherever possible, to identify these forward-looking statements by, among other things, using words such as “anticipate”, “believe”, “estimate”, “expect”, “budget”, or variations of such words and phrases or state that certain actions, events or results “may”, “could”, “would”, “might” or “will be taken”, “occur” or “be achieved”.
The statements reflect the current beliefs of the management of the Company, and are based on currently available information. Accordingly, these statements are subject to known and unknown risks, uncertainties and other factors, which could cause the actual results, performance, or achievements of the Company to differ materially from those expressed in, or implied by, these statements. These uncertainties are factors that include but are not limited to risks related to international operations; risks related to general economic conditions; actual results of current exploration activities and unanticipated reclamation expenses; fluctuations in prices of gold and other commodities; fluctuations in foreign currency exchange rates; increases in market prices of mining consumables; possible variations in mineral resources, grade or recovery rates; accidents, labour disputes, title disputes, claims and limitations on insurance coverage and other risks of the mining industry; delays in obtaining governmental approvals or financing or in the completion of development or construction activities; changes in national and local government regulation of mining operations, tax rules and regulations, and political and economic developments in countries in which the Company operates; as well as other factors. Additional information relating to the Company and its operations is available on SEDAR at www.sedar.com and on the Company’s web site at www.aurynresources.com.
The Company’s management periodically reviews information reflected in forward-looking statements. The Company has and continues to disclose in its MD&A and other publicly filed documents, changes to material factors or assumptions underlying the forward-looking statements and to the validity of the statements themselves, in the period the changes occur. Historical results of operations and trends that may be inferred from the following discussions and analysis may not necessarily indicate future results from operations.
AURYN RESOURCES INC.
Management’s Discussion and Analysis of Financial Condition and
Results of Operations for the Six Months Ended June 30, 2018
(In thousands of Canadian dollars, unless otherwise noted)
1.1.1 Forward-looking statements and risk factors (continued)
The operations of the Company are speculative due to the high-risk nature of its business which is the exploration of mining properties. For a comprehensive list of the risks and uncertainties facing the Company, please see “Risk Factors” in the Company’s most recent annual information form. These are not the only risks and uncertainties that Auryn faces. Additional risks and uncertainties not presently known to the Company or that the Company currently considers immaterial may also impair its business operations. These risk factors could materially affect the Company's future operating results and could cause actual events to differ materially from those described in forward-looking statements relating to the Company. Readers should refer to the risks discussed in the Company’s Annual Information Form and MD&A for the year ended December 31, 2017 and subsequent continuous disclosure filings with the Canadian Securities Administrators available at www.sedar.com and the Company’s registration statement on Form 40-F filed with the United States Securities and Exchange Commission and available at www.sec.gov. These documents are for information purposes only and not incorporated by reference in this MD&A.
1.2.1 Description of business
Auryn is an exploration company focused on the acquisition, exploration and development of mineral resource properties. Auryn’s principal mineral properties are the Committee Bay gold project located in Nunavut, Canada and the Homestake Ridge Project located within the Iskut-Stewart-Kitsault belt, in northwestern British Columbia. The Company also holds a substantial project portfolio in Peru.
The Company was incorporated under the British Columbia Business Corporations Act on June 9, 2008 under the name Georgetown Capital Corp. Subsequently on October 15, 2013, the Company changed its name to Auryn Resources Inc. and is a reporting issuer in the provinces of British Columbia, Ontario and Alberta. The Company is listed on the Toronto Stock Exchange under the symbol AUG and effective July 17, 2017, the Company’s common shares commenced trading on the NYSE American under the US symbol AUG.
The Company’s principal business activities include the acquisition, exploration and development of resource properties. The head office and principal address of the Company are located at 1199 West Hastings Street, Suite 600, Vancouver, British Columbia, V6E 3T5.
1.2.2 Committee Bay and Gibson MacQuoid projects
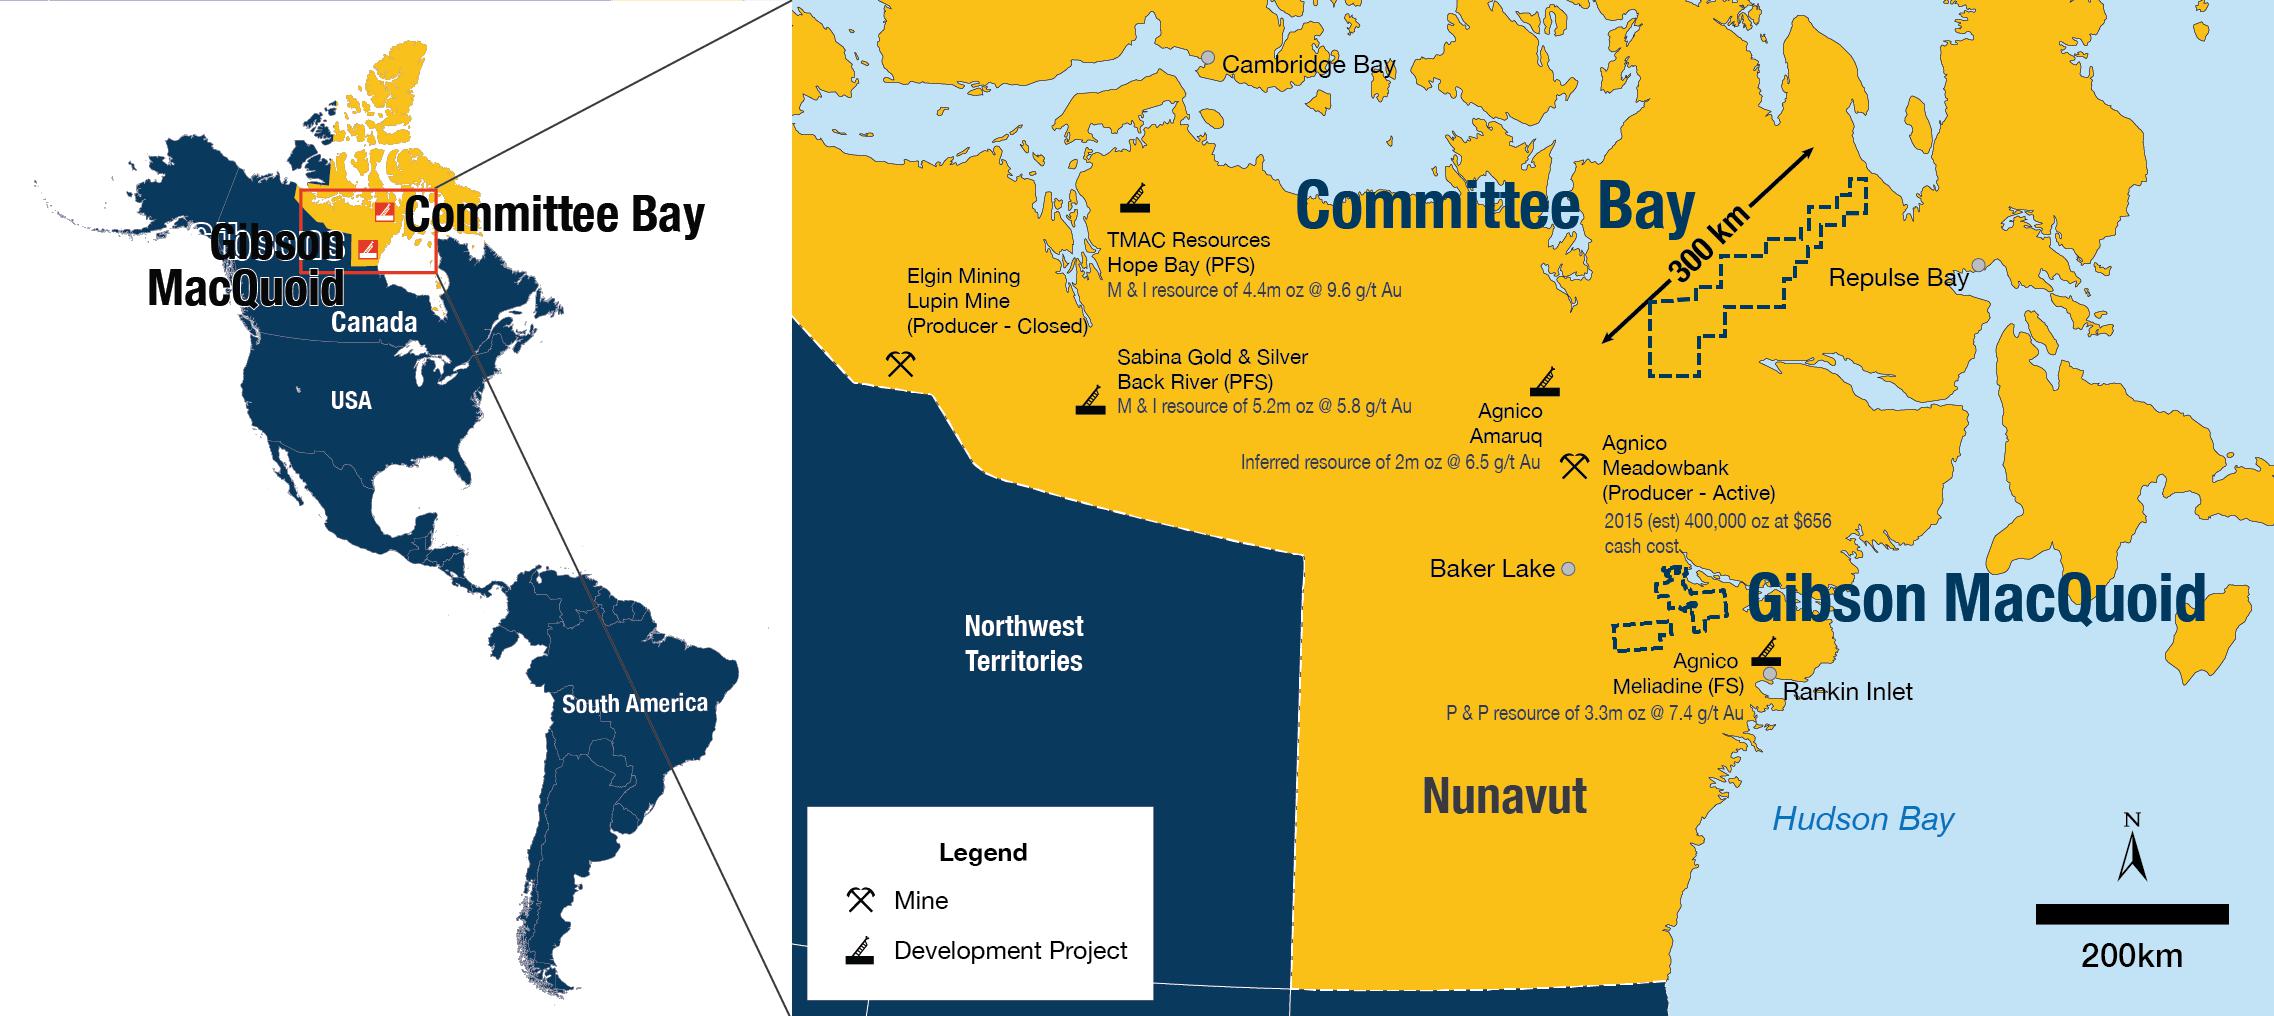
Figure 1 – regional map showing the locations of the Committee Bay and Gibson MacQuoid projects
AURYN RESOURCES INC.
Management’s Discussion and Analysis of Financial Condition and
Results of Operations for the Six Months Ended June 30, 2018
(In thousands of Canadian dollars, unless otherwise noted)
1.2.2 Committee Bay and Gibson MacQuoid projects (continued)
The Committee Bay Project is comprised of more than 380,000 hectares situated along the Committee Bay Greenstone Belt approximately 180 km northeast of the Meadowbank mine operated by Agnico Eagle Mines Limited and extends more than 300 km northeast.
The Committee Bay belt comprises one of a number of Archean aged greenstone belts occurring within the larger Western Churchill province of north-eastern Canada. The character and history of rock packages, and the timing and nature of mineralization occurring within the belt is considered to be equivalent to that of other significant gold bearing Archean greenstones within the Western Churchill Province, which hosts deposits such as Meadowbank, Meliadine and the newly discovered Amuraq.
Ownership
The Committee Bay project is held 100% by Auryn subject to a 1% Net Smelter Royalty (“NSR”) on the entire project and an additional 1.5% NSR on a small portion of the project. The 1.5% NSR is payable on only 7,596 hectares and is buyable within two years of the commencement of commercial production for $2.0 million for each one-third (0.5%) of the NSR.
Mineral resources
High-grade gold occurrences are found throughout the 300 km strike length with the most advanced being the Three Bluffs deposit that contains the mineral resource as listed in the table below: *(refer to NI43-101 report dated May 31, 2017 as amended October 23, 2017 filed under Auryn’s profile at www.sedar.com).
| Class | | Cut off grade
(g/t Au) | Tonnes
(t) | Gold grade
(g/t Au) | Contained Au
(oz) |
| May 31, 2017 Resource |
| Indicated | Near Surface
Underground | 3.0
4.0 | 1,760,000
310,000 | 7.72
8.57 | 437,000
86,000 |
| | | | 2,070,000 | 7.85 | 524,000 |
| Inferred | Near Surface
Underground | 3.0
4.0 | 590,000
2,340,000 | 7.56
7.65 | 144,000
576,000 |
| | | | 2,930,000 | 7.64 | 720,000 |
| | | | | | | |
Table 1: Three Bluffs indicated and inferred resource. See section 1.2.6 for cautionary language concerning mineral resources.
The Three Bluffs deposit remains open along strike and at depth. Future programs will aim to significantly expand upon the current resource.
2018 Resupply and staging operations at Committee Bay
During the months of March and April 2018, the Company completed staging operations for the 2018 exploration program at Committee Bay. Fuel for approximately 20,000 meters of helicopter supported drilling as well as other critical supplies were mobilized to the project’s Hayes Camp from Baker Lake, Yellowknife and Rankin Inlet. The total cost of this mobilization effort was approximately $1.4 million.
AURYN RESOURCES INC.
Management’s Discussion and Analysis of Financial Condition and
Results of Operations for the Six Months Ended June 30, 2018
(In thousands of Canadian dollars, unless otherwise noted)
1.2.2 Committee Bay and Gibson MacQuoid projects (continued)
2018 Exploration Plans
On July 15, 2018, the Company commenced its summer drill program. The Company has identified six target areas for approximately 10,000 m of drilling, which is presented below in the table below. The drill program is based primarily on gold assays from the high resolution tills, boulder mapping, and previous drill intercepts from its 2016 and 2017 programs.
| Prospect | Meters* | Number of drill holes |
| Aiviq Discovery Follow-up | 3200 | 12 (diamond drill holes) |
| Aiviq Exploration | 1800 | 9 |
| Kalulik | 1800 | 9 |
| Tulugaq | 600 | 3 |
| Aarluk | 1200 | 6 |
| Castle Pebble | 800 | 4 |
| Koffy | 600 | 3 |
| *This drill plan is subject to change based on observations made during the drill program |
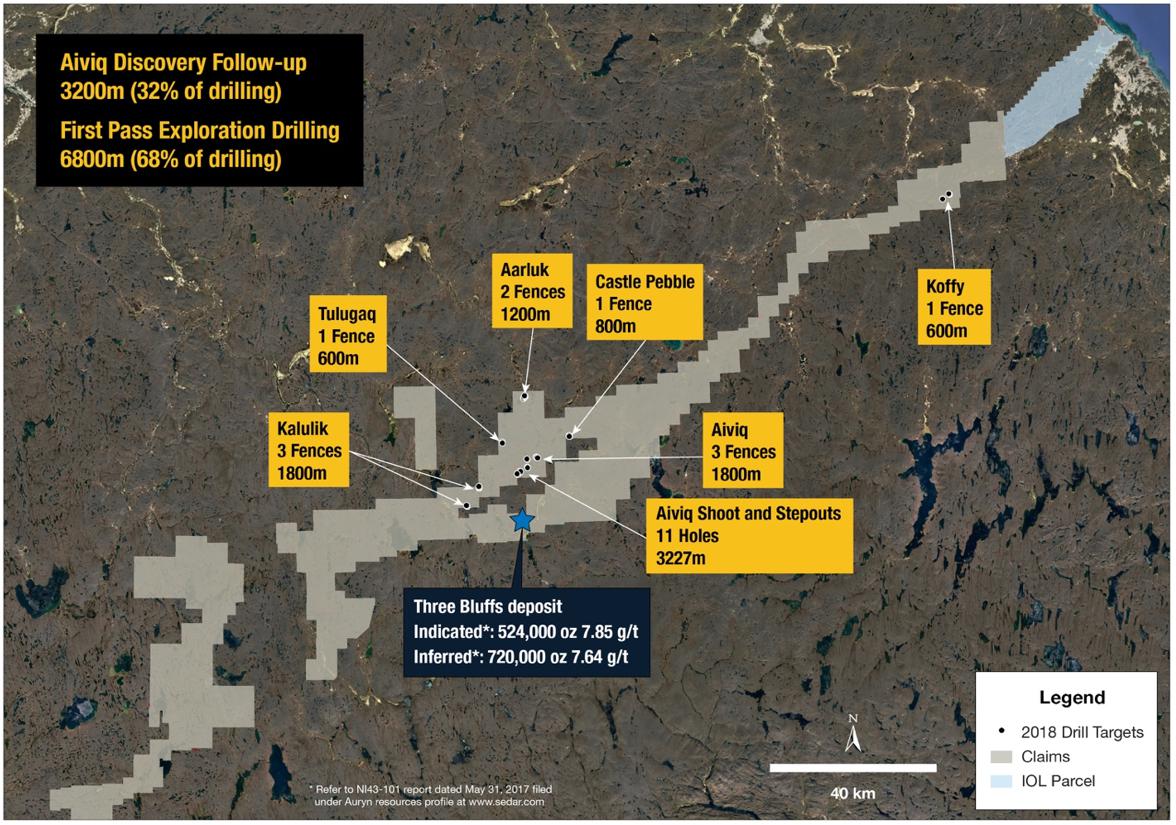
Figure 2 – partial map of the Committee Bay project showing the planned 2018 drill plan. Note: Each fence refers to a series of 2 to 3 hole targeting across a single geological structure.
AURYN RESOURCES INC.
Management’s Discussion and Analysis of Financial Condition and
Results of Operations for the Six Months Ended June 30, 2018
(In thousands of Canadian dollars, unless otherwise noted)
1.2.2 Committee Bay and Gibson MacQuoid projects (continued)
Further high-resolution till sampling is planned for the West Plains and Anuri prospects both of which have historical high-grade drill intercepts. The aim of this surface work is to continue to develop the next series of drill targets as the Company’s technical team believes these prospects continue to show geologic promise. In addition, regional till sampling (500 meter by 1 kilometer spaced samples) will occur to the northeast of the Inuk prospect to determine the areas potential for gold mineralization.
Gibson MacQuoid
The Gibson MacQuoid project is an early stage gold exploration project situated between the Meliadine deposit and Meadowbank mine in Nunavut, Canada. The 19 prospecting permits and 57 mineral claims that make up the project encompass approximately 120 km of strike length of the prospective greenstone belt and total 375,000 hectares collectively.
The Gibson MacQuoid Greenstone belt is one of a number of Archean aged greenstone belts located in the Western Churchill province of north-eastern Canada. These gold bearing Archean greenstone belts host deposits such as the Meadowbank, Amaruq, and Meliadine deposits. In particular, the highly magnetic signature of the Gibson MacQuoid Belt is consistent with the other productive greenstone belts in the eastern Arctic that host large-scale gold deposits.
2018 Exploration Plans
During the year ended December 31, 2017, the Company conducted a belt wide geochemical survey at Gibson MacQuoid. The survey was completed in mid-October 2017 and identified 8 high priority gold-in-till anomalies detailed below. Starting in mid-August, the Company will commence its follow up program which will involve tightly spaced till samples taken across the most robust of these anomalies. The program is estimated to cost approximately $1 million and is designed to develop drill targets for future programs.
1.2.3 Homestake Ridge project
The Homestake Ridge project is located in the Kitsault Mineral district in north-western British Columbia and covers approximately 7,500 hectares. The project is host to a high-grade underground gold, silver, copper, lead resource which remains open at depth and along strike in several zones.
| | Tonnage | Gold | Gold | Silver | Silver | Copper | Copper |
| | (Mt) | (g/t) | (oz) | (g/t) | (Moz) | (%) | (Mlb) |
| Indicated | 0.624 | 6.25 | 125,000 | 47.9 | 1.0 | 0.18 | 2.4 |
| Inferred | 7.245 | 4.00 | 932,000 | 90.9 | 21.2 | 0.11 | 16.9 |
Table 2: Combined Main Homestake, Homestake Silver and South Reef Resources at a 2 g/t AuEq cut-offs. See section 1.2.6 for cautionary language concerning mineral resources and refer to 43-101 report dated September 29, 2017 as amended October 23, 2017 filed under the Company’s SEDAR profile at www.sedar.com).
AURYN RESOURCES INC.
Management’s Discussion and Analysis of Financial Condition and
Results of Operations for the Six Months Ended June 30, 2018
(In thousands of Canadian dollars, unless otherwise noted)
1.2.3 Homestake Ridge project (continued)
2018 Exploration Plans
During 2017, the Company’s drill program intercepted high grade gold mineralization along strike and down plunge of the existing South Reef zone. Highlights from this drilling included 30 meters of 2.00 g/t Au (including 4m @ 6.03 g/t Au & 2m @ 11.80 g/t Au), 10 meters of 4.12 g/t Au (including 2m @ 18.01 g/t Au) and 18m of 1.29 g/t Au (including 4m of 4.18 g/t Au). These results identified the geometry of the high-grade mineralization at the main South Reef zone that remains open to the northwest and importantly have identified an emerging parallel high-grade structure (Upper zone) 175 meters to the north of the main South Reef zone. The goal of the 2018 exploration season will be to follow-up on these intercepts along strike of both structures with the objective of significantly expanding upon the known mineralization. See the Company’s press release dated December 12, 2017 for complete results from the 2017 program.
1.2.4 Peruvian exploration projects
Sombrero gold-copper project
The Sombrero Project lies within the north-western most projections of the Andahuaylas-Yauri Belt of southern Peru, an emerging and increasingly important porphyry copper and skarn belt. The belt strikes NW-SE and can be traced for more than 300 kilometers of strike length hosting important copper-gold-molybdenum deposits at Las Bambas, Haquira, Los Chancas, Cotambambas, Antapacay, Tintaya and Constancia, and is probably a northern extension of the copper-rich belt of the same Eocene-Oligocene age that strikes broadly N-S in Chile.
The current project consists of over 100,000 hectares of mineral claims defined by coincident gold and copper geochemical anomalies. The most explored area of the project was acquired through an option agreement the Company entered into in 2016 with Alturas Minerals Corp. Under the terms of this option, the Company may earn a 100% interest in the 6 mineral claims by completing US$2.1 million in work expenditures within a five-year period and make a final payment of US$5.0 million. As at June 30, 2018, the Company has satisfied the cash payment requirements of the option and has incurred approximately US$0.6 million in exploration work on the project.
Additionally on June 22, 2018, the Company acquired the rights to the Mollecruz concessions. Under the terms of an option agreement dated June 22, 2018, the Company may acquire a 100% interest in the Mollecruz concessions by completing US$3,000,000 in work expenditures and by making payments totaling US$1,600,000 to the underlying owner over a five year period. At signing, Auryn paid US$50,000 and upon exercise of the option, the underlying owner will retain 0.5% NSR royalty with an advance annual royalty payment of US$50,000.
2018 Exploration
The Company’s phase 1 surface work at Sombrero will consist of mapping, soil and rock sampling, trenching and ground magnetics expected to be completed prior to an initial drill program. The aim of the surface program is to expand upon the previously recognized surface mineralization and to delineate drill targets on the southern half of the project where the Company has secured a long-term agreement with the Huancasancos community. Additional community agreements for the northern portion of the project are currently being negotiated.
On June 19, 2018, the Company released results from its on-going surface program at the Sombrero Project. Highlights from these results include trenches with 99 meters of 0.46% copper equivalent and 105 meters of 0.3% copper equivalent, where mineralization remains open, and several high-grade gold structures, which sampled up to 193 g/t gold.
AURYN RESOURCES INC.
Management’s Discussion and Analysis of Financial Condition and
Results of Operations for the Six Months Ended June 30, 2018
(In thousands of Canadian dollars, unless otherwise noted)
1.2.4 Peruvian exploration projects (continued)
Throughout the remainder of 2018, the Company will continue its surface exploration of Sombrero with the goal of bringing the project to a drill ready state by the end of the year.
Huilacollo Project
The Huilacollo epithermal property is comprised of 2,000 hectares of intense hydrothermal alteration that is consistent with epithermal Au/Ag mineralization over a 4 by 6 km area located in the Tacna province of southern Peru. Historic drilling has resulted in the identification of a continuously mineralized gold/silver zone open in all directions. Contained within this area, there appears to be higher grade mineralization focused along well defined feeder structures as highlighted by trench intercepts up to 38m at 6.7 g/t Au and drill holes including 34m @ 2.14 g/t.
The Company acquired the rights to Huilacollo through an option agreement (the “Huilacollo Option”) with a local Peruvian company, Inversiones Sol S.A.C., under which the Company may acquire 100% interest, subject to an NSR, through a combination of work expenditures and cash payments.
2017/2018 Drill Program and Exploration
On April 13, 2018, the Company announced the results from the initial five holes of drilling at its Huilacollo project in the Tacna Province, Peru. The highlight from the program was hole 17HUI-002 which returned an intercept of 62 meters of 0.45 g/t Au (including 22 meters of 0.71g/t Au) 100 meters to the northwest of the previously drilled mineralization on the project. Further drilling will expand upon this step out and target the surface mineralization discovered on the Tacora concession at depth (See the Company press release dated June 1, 2018 for results from Trenching at Tacora).
Baños del Indio
The Baños del Indio epithermal property is comprised of 5,000 hectares of well-developed high-level steam heated epithermal style alteration and is considered by Auryn to be one of the largest untested epithermal alteration centers in Peru. Baños del Indio shares many similarities with the La Coipa mine complex in northern Chile where economic mineralization is principally located beneath similar high-level steam heated epithermal alteration. Initial exploration to define drill targets will focus on structural mapping, multi-spectral analysis to identify high temperature clays, volumetric sampling and induced polarization geophysical surveys. Baños del Indio is held through an option where the Company may acquire a 100% interest, subject to a 3.0% NSR, through a combination of work expenditures and cash payments.
1.2.5 Qualified persons and technical disclosures
Michael Henrichsen, P. Geo., Chief Operating Officer of Auryn, is the Qualified Person with respect to the technical disclosures in this MD&A.
Core Drilling (Huilacollo, Southern Peru)– Drilling Intercepts were calculated using a minimum of a 0.1 g/t Au cut off at beginning and end of the intercept and allowing for no more than five consecutive meters of less than 0.1 g/t Au. Analytical samples were taken by sawing HQ diameter core into equal halves on site and sent one of the halves to ALS Lab in Arequipa, Peru for preparation and then to ALS Lab in Lima, Peru for analysis. All samples are assayed using 30g nominal weight fire assay with atomic absorption finish (Au-AA25) and multi-element aqua regia digest ICP-AES/ICP-MS method (ME-MS41). QA/QC programs using internal standard samples, field and lab duplicates and blanks indicate good accuracy and precision in a large majority of standards assayed.
AURYN RESOURCES INC.
Management’s Discussion and Analysis of Financial Condition and
Results of Operations for the Six Months Ended June 30, 2018
(In thousands of Canadian dollars, unless otherwise noted)
1.2.5 Qualified persons and technical disclosures (continued)
Trenches 2018 (Sombrero, Peru) -Analytical samples were taken from each 1 meter interval of trench floor resulting in approximately 2-3kg of rock chips material per sample. Collected samples were sent to ALS Lab in Lima, Peru for preparation and analysis. All samples are assayed using 30g nominal weight fire assay with atomic absorption finish (Au-AA25) and multi-element four acid digest ICP-AES/ICP-MS method (ME-MS61). Where MS61 results were greater or near 10,000 ppm Cu, Zn or Pb the assays were repeated with ore grade four acid digest method (OG62). QA/QC programs for 2016 trench grab samples using internal standard and blank samples; field and lab duplicates indicate good overall accuracy and precision.
Intervals were calculated using a minimum of a 0.1% Cu cut-off at beginning and end of the interval and allowing for no more than five consecutive samples (five meters) of less than 0.1% Cu with a minimum length of the resulting composite of 5m. Copper and gold equivalent grades (CuEq and AuEq) were calculated using gold price of $1300/oz and copper price of $3.28/lb.
Cautionary Note to United States Investors concerning Estimates of Measured, Indicated and Inferred Resource Estimates
This disclosure has been prepared in accordance with the requirements of Canadian provincial securities laws which differ from the requirements of U.S. securities laws. Unless otherwise indicated, all mineral resource estimates included in this disclosure have been prepared in accordance with Canadian National Instrument 43-101 Standards of Disclosure for Mineral Projects (“NI 43-101”) and the Canadian Institute of Mining, Metallurgy and Petroleum classification systems. NI 43-101 is a rule developed by the Canadian Securities Administrators that establishes standards for all public disclosure an issuer makes of scientific and technical information concerning mineral projects. These standards differ significantly from the requirements of the United States Securities and Exchange Commission (the “SEC”), and resource estimates disclosed may not be comparable to similar information disclosed by U.S. companies.
In addition, this disclosure uses the terms “measured and indicated resources” and “inferred resources” to comply with the reporting standards in Canada. The Company advises United States investors that while those terms are recognized and required by Canadian regulations, the SEC does not recognize them. United States investors are cautioned not to assume that any part of the mineral deposits in these categories will ever be converted into mineral reserves. Further, “inferred resources” have a great amount of uncertainty as to their existence and as to whether they can be mined legally or economically. Therefore, United States investors are cautioned not to assume that all or any part of the “inferred resources” exist. In accordance with Canadian securities laws, estimates of “inferred resources” cannot form the basis of feasibility or other economic studies. It cannot be assumed that all or any part of “measured and indicated resources” or “inferred resources” will ever be upgraded to a higher category or are economically or legally mineable.
Three Bluffs resource estimations were completed by Roscoe Postle Associates Inc. (���RPA”) (see the Technical Report on the Three Bluffs Project, Nunavut Territory, Canada filed on the SEDAR on May 31, 2017 as amended October 23, 2017).
The Homestake Ridge resource estimate was prepared by RPA (see Technical Report on the Homestake Ridge Project, Skeena Mining Division, Northwestern British Columbia, September 29, 2017 as amended October 23, 2017 filed under the Company’s SEDAR profile at www.sedar.com).
AURYN RESOURCES INC.
Management’s Discussion and Analysis of Financial Condition and
Results of Operations for the Six Months Ended June 30, 2018
(In thousands of Canadian dollars, unless otherwise noted)
1.2.5 Qualified persons and technical disclosures (continued)
Peruvian interests within a special economic zone - Auryn holds its interests in Peru through Corisur Peru SAC, which controls (among other) certain licenses (including the Huilacollo and Baños del Indio projects) that are located within a special legal zone which runs 50km back from the Peruvian border. As a non-Peruvian company, Auryn’s right to ultimately acquire title over the shares issued by Corisur Peru SAC and to own and/or exploit these licenses requires approval from the Peruvian government. While Auryn is in the process of submitting its applications and does not foresee any legal reason why it would be denied the approval, some risk of denial or delay should be assumed to exist.
1.3 Selected annual financial information
| | | Twelve Months | | | Twelve Months | | | Six Months | | | Twelve Months | |
| | | December 31,
2017 | | | December 31,
2016 | | | December 31,
2015 | | | June 30,
2015 | |
| | | (Restated) | | | (Restated) | | | (Restated) | | | (Restated) | |
| Comprehensive loss for the period | | $ | 36,578 | | | $ | 20,539 | | | $ | 7,012 | | | $ | 3,403 | |
| Net loss for the period | | $ | 36,500 | | | $ | 20,376 | | | $ | 6,490 | | | $ | 3,925 | |
| Basic and diluted loss per share | | $ | 0.47 | | | $ | 0.35 | | | $ | 0.16 | | | $ | 0.16 | |
| Total assets | | $ | 43,759 | | | $ | 41,747 | | | $ | 24,399 | | | $ | 6,795 | |
| Total long-term liabilities | | $ | 1,662 | | | $ | 1,747 | | | $ | 1,100 | | | $ | - | |
The Company generated no revenues from operations during the above periods.
1.4 Discussion of operations
Three months ended June 30, 2018 and 2017 (Q2 2018 vs. Restated Q2 2017)
During the three months ended June 30, 2018, the Company reported a net loss of $4,372 and loss per share of $0.05 compared to net loss of $9,348 and loss per share of $0.12 for the same period in 2017. The $4,976 decrease in net loss in the current quarter is driven by a $5,691 decrease in the exploration and evaluation costs and a $403 decrease in the fees, salaries and other employee benefits, offset by a $1,443 decrease in the amortization of the flow through liability premium. Significant variances within operating expenses and other expenses are discussed as follows:
Operating expenses
| (1) | Exploration and evaluation costs in Q2 2018 were $3,272 compared to $8,963 in Q2 2017, a decrease of $5,691, due to the following: |
| | | |
| a. | Committee Bay decrease of $5,170 – During Q2 of the prior year, the Company was actively drilling at the Committee Bay project as part of its 30,000 meter regional drill campaign. In the current quarter, the costs incurred were significantly lower as the only work completed was the Committee Bay spring mobilization. The Company’s 2018 drill program and work at Gibson MacQuoid is scheduled for Q3. |
| | | |
| b. | Homestake decrease of $198 and Peru decrease of $323 – The decrease in costs incurred at both the Homestake Ridge and Peru projects during Q2 2018 compared to Q2 2017 were due to lower activity levels than during the same period in the prior year. |
| | | |
| (2) | Fees, salaries and other employee benefits, which includes share-based compensation, decreased by $403 in Q2 2018 compared to Q2 2017. The main reason for the decrease in the current quarter is lower share-based compensation as the share options expensed during the current quarter had a lower fair value driven by the decline in share price and the vesting schedules of outstanding options. |
AURYN RESOURCES INC.
Management’s Discussion and Analysis of Financial Condition and
Results of Operations for the Six Months Ended June 30, 2018
(In thousands of Canadian dollars, unless otherwise noted)
1.4 Discussion of operations (continued)
Other expenses and income:
| (3) | During the three months ended June 30, 2018, the Company recorded other income of $459 related to the amortization of the flow-through share premium liability compared to $1,902 for the three months ended June 30, 2017. The amortization of the liability is driven by the amount of flow-through eligible Canadian exploration and evaluation expenditures incurred in the period which for the current quarter was $1,608 compared to $7,112 for the same period in the previous year. |
| | | |
| (4) | During the three months ended June 30, 2018, the Company recognized a fair value gain of $14 on its marketable securities due to an increase in the market value of the underlying securities, compared to a loss of $132 for the three months ended June 30, 2017. |
Six months ended June 30, 2018 and 2017 (YTD 2018 vs. Restated YTD 2017)
During the six months ended June 30, 2018, the Company reported a net loss of $7,835 and loss per share of $0.09 compared to net loss of $13,420 and loss per share of $0.18 for the same period in 2017. The $5,585 decrease in net loss in the current period is driven by a $6,659 decrease in the exploration and evaluation costs and a $762 decrease in the fees, salaries and other employee benefits, offset by a $1,893 decrease in the amortization of the flow through liability premium. Significant variances within operating expenses and other expenses are discussed as follows:
Operating expenses
| (1) | Exploration and evaluation costs for the six months ended June 30, 2018 were $5,563 compared to $12,222 in prior year period, a decrease of $6,659, due to the following: |
| | | |
| a. | Committee Bay decrease of $6,445 – As noted above in the quarterly comparisons, the 2017 Committee Bay drill campaign commenced early in the year with the mobilization being completed in Q1 2017 and the drilling starting in June. With a more focused program in 2018, the mobilization costs incurred in the first half of the year were not as high and the drilling had not started as of June 30, 2018. |
| | | |
| (2) | Fees, salaries and other employee benefits, which includes share-based compensation, decreased by $762 for the six months ended June 30, 2018 compared to the prior year. As discussed above, the main driver for the decrease in the current period is lower share-based compensation as various prior year grants were fully vested prior to the start of 2018 and those options that were granted in Q2 2018 had a lower fair value because of the drop in the Company’s share price. |
| | | |
Other expenses and income:
| (3) | During the six months ended June 30, 2018, the Company recorded other income of $615 related to the amortization of the flow-through share premium liability compared to $2,508 for the six months ended June 30, 2017. The amortization of the liability is driven by the amount of flow-through eligible Canadian exploration and evaluation expenditures incurred in the period which for the current period was $2,157 compared to $9,377 for the same period in the previous year. |
Summary of Project Costs
During the six months ended June 30, 2018, the Company spent $1.1 million in mineral property acquisition costs and $5.6 million in exploration and evaluation costs on its projects as outlined below:
AURYN RESOURCES INC.
Management’s Discussion and Analysis of Financial Condition and
Results of Operations for the Six Months Ended June 30, 2018
(In thousands of Canadian dollars, unless otherwise noted)
1.4 Discussion of operations (continued)
| | | Committee Bay
& Gibson
MacQuoid | | | Homestake
Ridge | | | Peru | | | Total | |
| Acquisition costs | | | | | | | | | | | | | | | | |
| Balance as at December 31, 2017 | | $ | 18,681 | | | $ | 16,060 | | | $ | 2,517 | | | $ | 37,258 | |
| Additions | | | - | | | | - | | | | 1,027 | | | | 1,027 | |
| Currency translation adjustment | | | - | | | | - | | | | 117 | | | | 117 | |
| Balance June 30, 2018 | | $ | 18,681 | | | $ | 16,060 | | | $ | 3,661 | | | $ | 38,402 | |
| | | | | | | | | | | | | | | | | |
| Exploration and evaluation costs | | | | | | | | | | | | | | | | |
| Assaying | | $ | 104 | | | $ | 27 | | | $ | 101 | | | $ | 232 | |
| Exploration drilling | | | 128 | | | | - | | | | 307 | | | | 435 | |
| Camp cost, equipment and field supplies | | | 356 | | | | 52 | | | | 516 | | | | 924 | |
| Geological consulting services | | | 125 | | | | 140 | | | | 456 | | | | 721 | |
| Geophysical analysis | | | 2 | | | | - | | | | 101 | | | | 103 | |
| Permitting, environmental and community costs | | | 145 | | | | 54 | | | | 681 | | | | 880 | |
| Expediting and mobilization | | | 77 | | | | 41 | | | | 19 | | | | 137 | |
| Salaries and wages | | | 564 | | | | 132 | | | | 244 | | | | 940 | |
| Fuel and consumables | | | 10 | | | | - | | | | 9 | | | | 19 | |
| Aircraft and travel | | | 933 | | | | 4 | | | | 65 | | | | 1,002 | |
| Stock based compensation | | | 63 | | | | 10 | | | | 97 | | | | 170 | |
| Exploration and evaluation costs for the six months ended June 30, 2018 | | $ | 2,507 | | | $ | 460 | | | $ | 2,596 | | | $ | 5,563 | |
Future operations and 2018 expenditure forecast
The Company's business objectives for the next twelve to eighteen months will include the continued exploration of the Committee Bay and Homestake Ridge projects and its portfolio of earlier stage projects in Peru.
During fiscal 2018, the Company anticipates expending between $10 to $15 million on its mineral properties though this amount may be increased subject to market conditions. Planned programs for 2018 may include the following:
| · | At the Committee Bay Project, programs will include follow-up drilling at the Aiviq prospect and testing of some near by till anomalies (10,000 meters of drilling). |
| | |
| · | At the Homestake Ridge Project, the Company will conduct a follow up drill program on the mineralization intercepted at the South Reef deposit during its 2017 campaign (3,000 meters of drilling) |
| · | Conduct extensive surface exploration across the recently expanded Sombrero Gold Copper Project in Southern Peru and follow-up on mineralization identified through the 2017 trenching and sampling programs. |
| | |
| · | Complete the remaining 3,500 meters of its initial drill program at the Huilacollo project. |
| | |
| · | Conduct surface exploration and potentially drilling at a number of its earlier stage projects which may include the Gibson MacQuoid projects, Baños del Indio and Sombrero in Peru. |
AURYN RESOURCES INC.
Management’s Discussion and Analysis of Financial Condition and
Results of Operations for the Six Months Ended June 30, 2018
(In thousands of Canadian dollars, unless otherwise noted)
1.5 Summary of quarterly results
| Three months ended | | Interest income | | | Net loss | | | Comprehensive
loss | | | Loss per
share | |
| In thousands of Canadian dollars except per share amounts |
| | | | $ | | | | $ | | | | $ | | | | $ | |
| June 30, 2018 | | | 34 | | | | 4,372 | | | | 4,281 | | | | 0.05 | |
| March 31, 2018 | | | 12 | | | | 3,463 | | | | 3,397 | | | | 0.04 | |
| December 31, 20171 | | | 39 | | | | 13,170 | | | | 13,179 | | | | 0.17 | |
| September 30, 20171 | | | 67 | | | | 18,374 | | | | 18,422 | | | | 0.24 | |
| June 30, 20171 | | | 78 | | | | 9,348 | | | | 9,368 | | | | 0.12 | |
| March 31, 20171 | | | 64 | | | | 4,072 | | | | 4,073 | | | | 0.05 | |
| December 31, 20161 | | | 12 | | | | 4,121 | | | | 4,098 | | | | 0.06 | |
| September 30, 20161 | | | 24 | | | | 9,177 | | | | 9,184 | | | | 0.14 | |
1 Restated for change in accounting policy (see section 1.13)
During the last eight quarters, the Company’s net loss has ranged between $18,374 and $3,463. The Company’s expenditures have generally increased during this period as the Company has progressed from project investigation and acquisition to exploration and evaluation. The reason for the decrease in loss in the current quarter compared to the same quarter in the prior year, is due to the timing and size of the Company’s Committee Bay drill program in 2017 which meant that the mobilization and drilling had to get underway earlier in the year.
1.6/1.7 Financial position and liquidity and capital resources
| | | June 30, 2018 | | | December 31, 2017
(Restated) | |
| | | $ | | | $ | |
| Cash and restricted cash | | | 5,715 | | | | 2,589 | |
| Mineral property interests | | | 38,402 | | | | 37,258 | |
| Current liabilities | | | 1,372 | | | | 1,238 | |
| Non-current liabilities | | | 1,681 | | | | 1,662 | |
As at June 30, 2018, the Company had unrestricted cash of $ 5.6 million (December 31, 2017 - $2.5 million) and working capital of $6.1 million (December 31, 2017 - $3.7 million). Current liabilities that are to be settled in cash as at June 30, 2018 include accounts payable and accrued liabilities of $1.1 million, which have primarily been incurred in connection with the preparation for the summer program at the Company’s Committee Bay project and corporate costs related to keeping the Company’s public listings in good standing.
During the three and six months ended June 30, 2018, the Company used net cash of $4.5 million and $7.1 million, respectively, in operating activities compared to $10.9 million and 15.4 million during the comparative periods in the prior year.
Cash used in investing activities during the three and six months ended June 30, 2018 was $1.1 million for both periods while cash used in investing activities in the comparable periods in 2017 was negligible.
AURYN RESOURCES INC.
Management’s Discussion and Analysis of Financial Condition and
Results of Operations for the Six Months Ended June 30, 2018
(In thousands of Canadian dollars, unless otherwise noted)
1.6/1.7 Financial position and liquidity and capital resources (continued)
During the three and six months ended June 30, 2018, the Company generated net proceeds of nil and $11.3 million, respectively, from financing activities through the issuance of common shares compared to $0.4 million and $39.8 million, respectively, in the previous year’s periods.
The Company’s current working capital provides sufficient capital for the Company to meet its immediate liquidity requirements as well as the planned exploration programs on its mineral interest properties for the next 12 months. If market conditions warrant, the Company may raise additional capital to expand its exploration programs.
Common shares issued
On July 30, 2018 the Company announced that it has arranged a $4.6 million non-brokered flow-through private placement. The placement will consist of approximately 1.25 million flow-through common shares priced at CAD$1.60 per flow-through share and approximately 1.5 million charity flow-through shares priced at CAD$ 1.75 per charity flow-through share.
March 2018 Offering
On March 23, 2018 the Company closed the “2018 Offering” by issuing a total of 6,015,385 common shares of the Company at a price of US$1.30 per share for gross proceeds of US$7.8 million. The 2018 Offering was completed pursuant to an underwriting agreement dated March 13, 2018 among the Company and Cantor Fitzgerald Canada Corporation and a syndicate of underwriters. The Company paid a 6% commission to the Underwriters.
In addition, the Company completed a concurrent private placement financing involving the sale of 1,091,826 flow-through common shares of the Company (the “2018 Flow-Through Shares”) at a price equal to the Canadian dollar equivalent of US$1.82 per share, for gross proceeds of US$2.0 million. The 2018 Flow-Through Shares formed part of a donation arrangement and were ultimately purchased by Goldcorp Inc. (“Goldcorp”) and enabled Goldcorp to maintain its 12.5% interest in the Company under the terms of the January 2017 Investor Rights and Obligations Agreement between Goldcorp and the Company. The proceeds from the sale of the 2018 Flow-Through Shares will be used exclusively for exploration on the Company’s Committee Bay project.
Share issue costs related to the 2018 Offering totalled $1,335, which included $756 in commissions, and $579 in other issuance costs. The gross proceeds from the 2018 Offering were also offset by $737, an amount related to the flow-through share premium liability. A reconciliation of the impact of the 2018 Offering on share capital is as follows:
| | | Number of
common shares | | | Impact on
share capital | |
| Common shares issued at US$1.30 per share | | | 6,015,385 | | | $ | 10,054 | |
| Flow-through shares issued at US$1.82 per share | | | 1,091,826 | | | | 2,561 | |
| Cash share issue costs | | | - | | | | (1,335 | ) |
| Proceeds net of share issue costs | | | 7,107,211 | | | | 11,280 | |
| Flow-through share premium liability | | | - | | | | (737 | ) |
| | | | 7,107,211 | | | $ | 10,543 | |
AURYN RESOURCES INC.
Management’s Discussion and Analysis of Financial Condition and
Results of Operations for the Six Months Ended June 30, 2018
(In thousands of Canadian dollars, unless otherwise noted)
1.6/1.7 Financial position and liquidity and capital resources (continued)
A summary of the intended use of the net cash proceeds of $11.3 million is presented as follows:
| | Use of Proceeds:
Proposed 12 Month Budget | Intended
Use of
Proceeds
of the 2018
Offering | Actual activities
(March 23-June 30,
2018) | Actual Use
of Proceeds
of the
Offering to
June 30,
2018 | (Over)/under
expenditure |
| Committee Bay & Gibson MacQuoid | Flow-through eligible funds - 2018 drill and exploration programs Non-flow -through funds - Technical studies, permitting and other non-flow-through eligible exploration costs to be incurred in connection with its 2018 exploration program | $ 2,561 1,928 | - flow through E&E - other E&E | $ 1,885 58 | $ 676 1,870 |
| Homestake | Non-flow -through funds - Technical studies, permitting and other non-flow-through eligible exploration costs to be incurred in connection with its 2018 exploration program | 1,286 | - other E&E | 65 | 1,221 |
| Peru | Non-flow -through funds - Exploration expenditures in Peru including the continuation of the Company’s drill program at the Huilacollo project and initial surface work at it Sombrero project | 2,571 | - Acquisition costs - E&E | 1,005 1,333 | 234 |
Other | General working capital | 2,934 | | 1,755 | 1,179 |
| | Total | $ 11,280 | | $ 6,100 | $ 5,179 |
| Explanation of variances and the impact of variances on the ability of the Company to achieve its business objectives and milestones. | The financing was completed on March 23, 2018 and $6.1 in funds have been used since then which included both flow-through funds expended on the Committee Bay mobilization as well as non-flow through funds spent on mineral property acquisitions and exploration in Peru. |
AURYN RESOURCES INC.
Management’s Discussion and Analysis of Financial Condition and
Results of Operations for the Six Months Ended June 30, 2018
(In thousands of Canadian dollars, unless otherwise noted)
1.6/1.7 Financial position and liquidity and capital resources (continued)
January 2017 Offering
On January 24, 2017, the Company closed a brokered equity offering for gross proceeds of $41.2 million (the “January Offering”). Under the terms of the January Offering, the Company issued an aggregate of 4,590,818 flow-through shares at a price of $5.01 per flow-through share and 4,951,584 common shares at a price of $3.67 per common share. Share issue costs related to the January Offering totalled $2.2 million, which included $2.0 million in commissions, and $0.2 million in other issuance costs. The gross proceeds from the Offering were also offset by $6.1 million, an amount related to the flow-through share premium liability. A reconciliation of the impact of the January Offering on share capital is as follows:
| | Number of
common shares | | | Impact on
share capital | |
| Common shares issued at $3.67 per share | | | 4,951,584 | | | $ | 18,172 | |
| Flow-through shares issued at $5.01 per share | | | 4,590,818 | | | | 23,000 | |
| Cash share issue costs | | | - | | | | (2,261 | ) |
| Proceeds net of share issue costs | | | 9,542,402 | | | | 38,911 | |
| Flow-through share premium liability | | | - | | | | (6,151 | ) |
| | | | 9,542,402 | | | $ | 32,760 | |
A summary of the intended use of the net cash proceeds of $38.9 million is presented as follows:
| | Use of Proceeds:
Proposed 12 Month
Budget | Intended Use
of Proceeds
of the
January 2017
Offering | Actual activities | Actual Use of
Proceeds of
the Offering to
June 30, 2018 | (Over)/under
expenditure |
| Committee Bay & Gibson MacQuoid | Flow-through eligible - 25,000 metres of drilling - geophysical and till survey programs - Logistics and staging for 2017 programs | $15,500 | - 2017 flow through E&E - 2017 acquisition costs - 2017 other E&E | $22,980 80 185 | $(7,745) |
| Homestake | Flow-through eligible - 15,000 metres of drilling - geophysical and geochemical surveys | 7,500 | - 2017 flow through E&E - 2018 flow through E&E | 6,807 272 | 421 |
| Peru & Other | Non-flow-through eligible Peruvian exploration and general working capital | 15,911 | - Peru acquisition costs and E&E - Working capital | 6,767 1,398 | 7,745 |
| | Total | $38,911 | | $38,490 | $421 |
| Explanation of variances and the impact of variances on the ability of the Company to achieve its business objectives and milestones. | The Committee Bay programs were completed in 2017 with additional expenditures being incurred due to the expansion of the initially budgeted drill program. Most of the 2017 planned Homestake exploration was completed but some of the funds will be used for 2018 exploration. |
AURYN RESOURCES INC.
Management’s Discussion and Analysis of Financial Condition and
Results of Operations for the Six Months Ended June 30, 2018
(In thousands of Canadian dollars, unless otherwise noted)
1.6/1.7 Financial position and liquidity and capital resources (continued)
Exercise of Share Options
During the six months ended June 30, 2018, 70,000 shares were issued as a result of share options being exercised with a weighted average exercise price of $0.51 for gross proceeds of $35. Attributed to these share options, fair value of $35 was transferred from the equity reserves and recorded against share capital.
Exercise of Warrants
During the three and six months ended June 30, 2018, 15,000 shares were issued as a result of share purchase warrants being exercised with an exercise price of $1.40 for gross proceeds of $21. Attributed to these share purchase warrants, fair value of $12 was transferred from the equity reserves and recorded against share capital.
Other sources of funds
As at June 30, 2018, the other sources of funds potentially available to the Company are through the exercise of outstanding stock options with terms as follows:
Stock options
| | | Outstanding | | | Exercisable | |
| Expiry date | | Number of
options | | | Exercise
price | | | Remaining
contractual
life (years) | | | Number of
options | | | Exercise
price | | | Remaining
contractual
life (years) | |
| Feb 17, 2019 | | | 890,000 | | | $ | .51 | | | | 0.64 | | | | 890,000 | | | $ | 0.51 | | | | 0.64 | |
| Aug 17, 2020 | | | 1,070,000 | | | | 1.30 | | | | 2.13 | | | | 1,070,000 | | | | 1.30 | | | | 2.13 | |
| June 21, 2021 | | | 2,195,000 | | | | 2.63 | | | | 2.98 | | | | 2,195,000 | | | | 2.63 | | | | 2.98 | |
| Jan 10, 2022 | | | 440,000 | | | | 3.22 | | | | 3.53 | | | | 385,000 | | | | 3.22 | | | | 3.53 | |
| May 5, 2022 | | | 83,750 | | | | 3.04 | | | | 3.85 | | | | 67,500 | | | | 3.04 | | | | 3.85 | |
| June 20, 2023 | | | 875,000 | | | | 1.42 | | | | 4.98 | | | | 218,750 | | | | 1.42 | | | | 4.98 | |
| June 26, 2023 | | | 900,000 | | | | 1.42 | | | | 4.99 | | | | 225,000 | | | | 1.42 | | | | 4.99 | |
| | | | 6,453,750 | | | $ | 1.83 | | | | 3.12 | | | | 5,051,250 | | | $ | 1.92 | | | | 2.62 | |
In the future, the Company may have capital requirements in excess of its currently available resources and may be required to seek additional financing. There can be no assurance that the Company will have sufficient financing to meet its future capital requirements or that additional financing will be available on terms acceptable to the Company in the future.
1.8 Off-balance sheet arrangements
The Company does not utilize off-balance sheet arrangements.
AURYN RESOURCES INC.
Management’s Discussion and Analysis of Financial Condition and
Results of Operations for the Six Months Ended June 30, 2018
(In thousands of Canadian dollars, unless otherwise noted)
1.9 Transactions with related parties
All transactions with related parties have occurred in the normal course of operations. All amounts are unsecured, non-interest bearing and have no specific terms of settlement, unless otherwise noted.
| | | Three months ended | | | Six months ended | |
| | June 30,
2018 | | | June 30,
2017 | | | June 30,
2018 | | | June 30,
2017 | |
| Universal Mineral Services Ltd.1 | | | | | | | | | | | | | | | | |
| Fees, salaries and other employee benefits | | $ | 139 | | | $ | 178 | | | $ | 303 | | | $ | 295 | |
| Legal and professional fees | | | 6 | | | | - | | | | 6 | | | | - | |
| Marketing and investor relations | | | 18 | | | | 3 | | | | 18 | | | | 3 | |
| Insurance | | | - | | | | - | | | | 1 | | | | - | |
| Office and administration | | | 96 | | | | 110 | | | | 171 | | | | 221 | |
| Regulatory, transfer agent and shareholder information | | | - | | | | 1 | | | | - | | | | 3 | |
| Project investigation costs | | | - | | | | 5 | | | | 6 | | | | 10 | |
| Exploration and evaluation costs: | | | | | | | | | | | | | | | | |
| Committee Bay | | | 107 | | | | 198 | | | | 283 | | | | 299 | |
| Homestake | | | 71 | | | | 31 | | | | 98 | | | | 55 | |
| Peru | | | 18 | | | | 111 | | | | 44 | | | | 196 | |
| Total transactions for the period | | $ | 455 | | | $ | 637 | | | $ | 930 | | | $ | 1,082 | |
| 1. | Universal Mineral Services Ltd., (“UMS”) is a private company with certain directors and officers in common that, pursuant to an agreement dated March 30, 2012 and as amended on December 30, 2015, provides office space and geological and administrative services to the Company on a cost recovery basis. |
The outstanding balance owing at June 30, 2018 was $160 (December 31, 2017 – $179). In addition, the Company had $150 on deposit with UMS as at June 30, 2018 (December 31, 2017 - $150).
1.10 Subsequent events
Noted throughout the other sections of this MD&A
1.11 Proposed transactions
None
1.12 Critical accounting estimates
The preparation of the financial statements in conformity with IFRS requires management to select accounting policies and make estimates and judgments that may have a significant impact on the consolidated financial statements. Estimates are continuously evaluated and are based on management’s experience and expectations of future events that are believed to be reasonable under the circumstances.
Key sources of estimation uncertainty that have a significant risk of causing a material adjustment to the carrying amounts of assets and liabilities are:
AURYN RESOURCES INC.
Management’s Discussion and Analysis of Financial Condition and
Results of Operations for the Six Months Ended June 30, 2018
(In thousands of Canadian dollars, unless otherwise noted)
1.12 Critical accounting estimates (continued)
| i. | Share-based compensation |
The Company determines the fair value of stock options granted using the Black-Scholes option pricing model. This option pricing model requires the development of market-based subjective inputs, including the risk-free interest rate, expected price volatility and expected life of the option. Changes in these inputs and the underlying assumption used to develop them can materially affect the fair value estimate.
The fair value of the share-based options granted during the three and six months ended June 30, 2018 and 2017 were estimated using the Black-Scholes option valuation model with the following assumptions:
| | | Three months ended June 30, | | | Six months ended June 30, | |
| | | 2018 | | | 2017 | | | 2018 | | | 2017 | |
| Risk-free interest rate | | | 1.97 | % | | | 0.87 | % | | | 1.97 | % | | | 0.94 | % |
| Expected dividend yield | | | Nil | | | | nil | | | | Nil | | | | nil | |
| Share price volatility | | | 67 | % | | | 76 | % | | | 67 | % | | | 77 | % |
| Expected life in years | | | 4.36 | | | | 4.35 | | | | 4.36 | | | | 4.34 | |
| ii. | Deferred tax assets and liabilities |
Management judgment and estimates are required in assessing whether deferred tax assets and deferred tax liabilities are recognized in the consolidated statements of financial position. Judgments are made as to whether future taxable profits will be available in order to recognize deferred tax assets. Assumptions about the generation of future taxable profits depend on management’s estimates of future cash flows. These depend on estimates of future production and sales volumes, commodity prices, reserves, operating costs, and other capital management transactions. These judgments and assumptions are subject to risk and uncertainty and changes in circumstances may alter expectations, which may impact the amount of deferred tax assets and deferred tax liabilities recognized on the consolidated statements of financial position and the benefit of other tax losses and temporary differences not yet recognized.
The Company’s deferred tax assets and liabilities were determined using a future income tax rate in Canada of 26% and 29.5% in Peru.
| iii. | Reclamation obligations |
Management assesses its reclamation obligations annually and when circumstances suggest that a material change to the obligations have occurred. Significant estimates and assumptions are made in determining the provision for rehabilitation and site restoration, as there are numerous factors that will affect the ultimate liability payable. These factors include estimates of the extent, the timing and the cost of reclamation activities, regulatory change, cost increases, and changes in discount rates. Those uncertainties may result in actual expenditure differing from the amounts currently provided. The provision at the reporting date represents management’s best estimate of the present value of the future reclamation costs required. Changes to estimated future costs are recognized in the statement of financial position by adjusting the reclamation asset and liability.
AURYN RESOURCES INC.
Management’s Discussion and Analysis of Financial Condition and
Results of Operations for the Six Months Ended June 30, 2018
(In thousands of Canadian dollars, unless otherwise noted)
1.13 Changes in accounting policies including initial adoption
The Company has adopted the following new accounting standards and policies during the six months ended June 30, 2018:
Revenue Recognition
Effective January 1, 2018 the Company adopted IFRS 15 – Revenue from Contracts with Customers ("IFRS 15") which supersedes IAS 11 – Construction Contracts, IAS 18 – Revenue, IFRIC 13 – Customer Loyalty Programs, IFRIC 15 – Agreements for the Construction of Real Estate, IFRIC 18 – Transfers of Assets from Customers, and SIC 31 – Revenue – Barter Transactions Involving Advertising Services. IFRS 15 establishes a single five-step model framework for determining the nature, amount, timing and uncertainty of revenue and cash flows arising from a contract with a customer. The adoption of this standard did not impact the Company’s financial statements, as currently the Company does not earn revenues.
Financial instruments
Effective January 1, 2018 the Company adopted IFRS 9 – Financial Instruments ("IFRS 9") to replace IAS 39 – Financial Instruments: Recognition and Measurement. IFRS 9 provides a revised model for recognition and measurement of financial instruments and a single, forward-looking “expected loss” impairment model. IFRS 9 also includes a substantially reformed approach to hedge accounting. The adoption of this standard did not impact the Company’s financial statements as currently the Company does not hold any financial instruments for which the underlying accounting will be impacted.
Voluntary accounting policy change
Effective January 1, 2018 the Company elected to change its accounting policy for exploration and evaluation costs incurred subsequent to the acquisition of a mineral property interest. Previously the Company had capitalized these costs as part of mineral property interests in accordance with IFRS 6 which allows for mining exploration companies to either capitalize or expense such costs.
Management determined that expensing exploration and evaluation costs would provide more relevant information to many of its financial statements users, as it would allow for comparisons to be drawn against both its Canadian peers, many of which choose to expense such costs, as well as its American peers as the policy is more in line with United States Generally Accepted Accounting Policies (“US GAAP”) requirements to expense costs, other than those incurred to acquire the right to explore a mineral property, until the economic viability of a project is established.
The Company will continue to capitalize the costs incurred to acquire the right to explore a mineral property until the right is lost or the value of the mineral property is determined to be impaired.
See note 2 (a) of the Company’s June 30, 2018 condensed consolidated interim financial statements for the Company’s revised accounting policy on exploration and evaluation costs and mineral property interests.
As a result of this voluntary change in accounting policy, the Company has restated certain prior period amounts within the June 30, 2018 condensed consolidated interim financial statements to be in accordance with this new policy. The impact on prior period amounts is outlined below:
AURYN RESOURCES INC.
Management’s Discussion and Analysis of Financial Condition and
Results of Operations for the Six Months Ended June 30, 2018
(In thousands of Canadian dollars, unless otherwise noted)
1.13 Changes in accounting policies including initial adoption (continued)
Statements of Financial Position
| As at January 1, 2017 | | As previously
reported | | | Adjustment | | | Restated | |
| Mineral property interests | | | 58,815 | | | | (22,765 | ) | | | 36,050 | |
| Accumulated other comprehensive income | | | (29 | ) | | | 11 | | | | (18 | ) |
| Deficit | | | 11,743 | | | | 22,754 | | | | 34,497 | |
| As at December 31, 2017 | | | As previously
reported | | | | Adjustment | | | | Restated | |
| Mineral property interests | | | 95,986 | | | | (58,728 | ) | | | 37,258 | |
| Accumulated other comprehensive income | | | 256 | | | | (196 | ) | | | 60 | |
| Deficit | | | 12,073 | | | | 58,924 | | | | 70,997 | |
Statements of Loss and Comprehensive Loss
| Three months ended June 30, 2017 | | As previously
reported | | | Adjustment | | | Restated | |
| Exploration and evaluation costs | | | - | | | | 8,963 | | | | 8,963 | |
| Loss for the period | | | 385 | | | | 8,963 | | | | 9,348 | |
| Unrealized currency gain (loss) on translation of foreign operations | | | 110 | | | | (90 | ) | | | 20 | |
| Net comprehensive loss | | | 495 | | | | 8,873 | | | | 9,368 | |
| | | | | | | | | | | | | |
| Loss per share (basic and diluted) | | $ | 0.01 | | | $ | 0.12 | | | $ | 0.12 | |
| Six months ended June 30, 2017 | | As previously
reported | | | Adjustment | | | Restated | |
| Exploration and evaluation costs | | | - | | | | 12,222 | | | | 12,222 | |
| Loss for the period | | | 1,198 | | | | 12,222 | | | | 13,420 | |
| Unrealized currency gain (loss) on translation of foreign operations | | | 118 | | | | (97 | ) | | | 21 | |
| Net comprehensive loss | | | 1,316 | | | | 12,125 | | | | 13,441 | |
| | | | | | | | | | | | | |
| Loss per share (basic and diluted) | | $ | 0.02 | | | $ | 0.16 | | | $ | 0.18 | |
Statement of Cash Flows
| Three months ended June 30, 2017 | | As previously
reported | | | Adjustment | | | Restated | |
| Loss for the period | | | (385 | ) | | | (8,963 | ) | | | (9,348 | ) |
| Share-based compensation | | | 315 | | | | 168 | | | | 483 | |
| Depreciation of fixed assets | | | - | | | | 60 | | | | 60 | |
| Unrealized foreign exchange (loss) gain | | | 50 | | | | (12 | ) | | | 38 | |
| Changes in non-cash working capital | | | | | | | | | | | | |
| Prepaid expenses and deposits | | | 23 | | | | (1,520 | ) | | | (1,497 | ) |
| Accounts payable and accrued liabilities | | | (96 | ) | | | 1,583 | | | | 1,487 | |
| Cash used in operating activities | | | (2,258 | ) | | | (8,684 | ) | | | (10,942 | ) |
| Exploration and evaluation costs | | | (8,699 | ) | | | 8,699 | | | | - | |
| Acquisition of mineral property interests | | | - | | | | (15 | ) | | | (15 | ) |
| Cash used in investing activities | | | (8,711 | ) | | | 8,684 | | | | (27 | ) |
AURYN RESOURCES INC.
Management’s Discussion and Analysis of Financial Condition and
Results of Operations for the Six Months Ended June 30, 2018
(In thousands of Canadian dollars, unless otherwise noted)
1.13 Changes in accounting policies including initial adoption (continued)
Statement of Cash Flows
| Six months ended June 30, 2017 | | As previously
reported | | | Adjustment | | | Restated | |
| Loss for the period | | | (1,198 | ) | | | (12,222 | ) | | | (13,420 | ) |
| Share-based compensation | | | 787 | | | | 580 | | | | 1,367 | |
| Depreciation of fixed assets | | | - | | | | 117 | | | | 117 | |
| Unrealized foreign exchange (loss) gain | | | 36 | | | | 7 | | | | 43 | |
| Changes in non-cash working capital | | | | | | | | | | | | |
| Prepaid expenses and deposits | | | (188 | ) | | | (2,939 | ) | | | (3,127 | ) |
| Accounts payable and accrued liabilities | | | (18 | ) | | | 2,438 | | | | 2,420 | |
| Cash used in operating activities | | | (3,365 | ) | | | (12,019 | ) | | | (15,384 | ) |
| Exploration and evaluation costs | | | (12,047 | ) | | | 12,047 | | | | - | |
| Acquisition of mineral property interests | | | - | | | | (29 | ) | | | (29 | ) |
| Cash used in investing activities | | | (12,046 | ) | | | 12,019 | | | | (27 | ) |
New and amended accounting standards not yet effective as at June 30, 2018 are summarized as follows:
Leases - In January 2016, the IASB published a new accounting standard, IFRS 16 – Leases ("IFRS 16") which supersedes IAS 17 – Leases. IFRS 16 specifies how to recognize, measure, present and disclose leases. The standard provides a single lessee accounting model, requiring the recognition of assets and liabilities for all leases, unless the lease term is 12 months or less or the underlying asset has a low value. The standard is effective for annual periods beginning on or after January 1, 2019, with early adoption permitted if IFRS 15, has also been applied. The Company does not have any material lease agreements and does not expect the adoption of this standard to materially impact its condensed consolidated interim financial statements.
1.14 Financial instruments and other instruments
As at June 30, 2018, the Company’s financial instruments consist of cash, marketable securities, amounts receivable, deposits and accounts payables and accrued liabilities. The fair values of these financial instruments approximate their carrying values due to their short-term to maturity. The Company’s financial instruments are exposed to certain financial risks including, credit risk, currency risks, liquidity risk, interest rate risk and capital risk management. Details of the primary risks that the Company is exposed to are laid out in the notes to the Company’s condensed consolidated interim financial statements.
It has been determined that these risks, individually and in aggregate, are not material to the Company as a whole.
1.15 Other requirements
Capital structure
Authorized: Unlimited number of common shares
Number of common shares issued and outstanding as at August 9, 2018: 87,297,816
Number of common shares issued and outstanding as at June 30, 2018: 85,938,441
AURYN RESOURCES INC.
Management’s Discussion and Analysis of Financial Condition and
Results of Operations for the Six Months Ended June 30, 2018
(In thousands of Canadian dollars, unless otherwise noted)
1.15 Other requirements (continued)
Share based options as at August 9, 2018:
| | | Outstanding | | | Exercisable | |
| Expiry date | | Number of
options | | | Exercise
price | | | Remaining
contractual
life (years) | | | Number of
options | | | Exercise
price | | | Remaining
contractual
life (years) | |
| Feb 17, 2019 | | | 890,000 | | | $ | .51 | | | | 0.53 | | | | 890,000 | | | $ | 0.51 | | | | 0.53 | |
| Aug 17, 2020 | | | 1,070,000 | | | | 1.30 | | | | 2.02 | | | | 1,070,000 | | | | 1.30 | | | | 2.02 | |
| June 21, 2021 | | | 2,195,000 | | | | 2.63 | | | | 2.87 | | | | 2,195,000 | | | | 2.63 | | | | 2.87 | |
| Jan 10, 2022 | | | 440,000 | | | | 3.22 | | | | 3.42 | | | | 440,000 | | | | 3.22 | | | | 3.42 | |
| May 5, 2022 | | | 65,000 | | | | 3.04 | | | | 3.74 | | | | 56,875 | | | | 3.04 | | | | 3.74 | |
| June 20, 2023 | | | 875,000 | | | | 1.42 | | | | 4.87 | | | | 218,750 | | | | 1.42 | | | | 4.87 | |
| June 26, 2023 | | | 900,000 | | | | 1.42 | | | | 4.88 | | | | 225,000 | | | | 1.42 | | | | 4.88 | |
| | | | 6,435,000 | | | $ | 1.83 | | | | 3.00 | | | | 5,095,625 | | | $ | 1.93 | | | | 2.51 | |
There are no share purchase warrants outstanding as at August 9, 2018.
Controls and procedures
Disclosure controls and procedures (“DC&P”) are designed to provide reasonable assurance that material information related to the Company, including its consolidated subsidiaries, is made known to the Company’s certifying officers. The Company’s Chief Executive Officer (“CEO”) and Chief Financial Officer (“CFO”) are responsible for establishing and maintaining adequate DC&P and have concluded that the DC&P the Company have in place are effective in providing reasonable assurance that information required to be disclosed under applicable securities regulations is recorded, processed, summarized and reported within the time periods specified.
The Company’s management, with the involvement of the CEO and CFO, performs regular reviews of its DC&P to ensure they are designed and operating effectively. As there are inherent limitations in all control systems, any economically feasible control system can only provide reasonable, not absolute, assurance that the control system will prevent or detect all misstatements due to error or fraud.
Management’s most recent evaluation of the DC&P was conducted for the year ended December 31, 2017 from which management concluded that the Company’s DC&P are effective in providing reasonable assurance that information required to be disclosed under applicable securities regulations is recorded, processed, summarized and reported within the time periods specified as of the date of this report.
Internal control over financial reporting
Internal control over financial reporting (“ICFR”) includes those policies and procedures that:
| • | pertain to the maintenance of records that in reasonable detail accurately and fairly reflect the transactions and dispositions of the assets of the Company; |
| | | |
| • | provide reasonable assurance that transactions are recorded as necessary to permit preparation of consolidated financial statements in accordance with IFRS, and that receipts and expenditures of the Company are being made only in accordance with authorizations of management and directors of the Company; and |
| | | |
| • | provide reasonable assurance regarding prevention or timely detection of unauthorized acquisition, use or disposition of the Company assets or incurring liabilities or other obligations that could have a material effect on the consolidated financial statements. |
AURYN RESOURCES INC.
Management’s Discussion and Analysis of Financial Condition and
Results of Operations for the Six Months Ended June 30, 2018
(In thousands of Canadian dollars, unless otherwise noted)
1.15 Other requirements (continued)
It is management’s responsibility to establish and maintain adequate ICFR to provide reasonable assurance regarding the reliability of financial reporting and the preparation of consolidated financial statements for external purposes in accordance with IFRS.
At December 31, 2017, under the supervision of the CEO and CFO, management evaluated the effectiveness of the Company’s ICFR based on the framework in Internal Control - Integrated Framework (2013) issued by the Committee of Sponsoring Organizations of the Treadway Commission (“COSO”). Based on its evaluation, management concluded that the Company’s ICFR was effective as of that date. There have been no material changes in the DC&P or the ICFR during the six months ended June 30, 2018.
Additional disclosures pertaining to the Company’s management information circulars, material change reports, press releases and other information are available on the SEDAR website at www.sedar.com.
On behalf of the Board of Directors,
| “Shawn Wallace” | | |
| Shawn Wallace | | |
| President and Chief Executive Officer | | |
| August 9, 2018 | | |
26 of 26