Technical Report,
Updated Mineral Resource Estimate and
Preliminary Economic Assessment
on the
HOMESTAKE RIDGE GOLD PROJECT
SKEENA MINING DIVISION
BRITISH COLUMBIA
Latitude 55° 45' 12.6" N and Longitude 129° 34' 39.8" W
Qualified Persons:
Paul Chamois, P.Geo.
Philip Geusebroek, P.Geo.
Mary Mioska, P.Eng.
David M.R. Stone, P.Eng.
Prepared by:
MINEFILL SERVICES, INC.
PO BOX 725
BOTHELL, WASHINGTON
Effective Date: May 29, 2020
Amended and Restated: June 24, 2020
IMPORTANT NOTICE
This report was prepared as a National Instrument 43-101 Technical Report for the exclusive use of Auryn Resources Ltd. (Auryn) by MineFill Services, Inc., (MineFill). The quality of information, conclusions, and estimates contained herein is consistent with industry standards based on i) information available at the time of preparation, ii) data supplied by outside sources, and iii) the assumptions, conditions, and qualifications as set forth in this report. This report is intended for use by Auryn subject to the terms and conditions of its contract with MineFill. Except for the purposes legislated under Canadian provincial and territorial securities law, any other use of this report by any third party is at that party’s sole risk.
Homestake Ridge Project
NI43-101F1 Technical Report
Table of Contents
| | | Page |
| 1 | SUMMARY | 1-1 |
| 1.1 | Overview | 1-1 |
| 1.2 | Geology | 1-1 |
| 1.3 | Mineralization | 1-2 |
| 1.4 | Exploration Highlights | 1-3 |
| 1.5 | Mineral Resources | 1-3 |
| 1.6 | Mineral Reserves | 1-4 |
| 1.7 | Mining Operations | 1-4 |
| 1.8 | Processing | 1-4 |
| 1.9 | Site Infrastructure | 1-5 |
| 1.1 | Capital Costs | 1-6 |
| 1.11 | Operating Costs | 1-6 |
| 1.12 | Financial Model | 1-6 |
| 1.13 | Qualified Persons Opinion | 1-7 |
| 2 | INTRODUCTION | 2-1 |
| 2.1 | The Issuer | 2-1 |
| 2.2 | Terms of Reference | 2-1 |
| 2.3 | Sources of Information | 2-1 |
| 2.4 | Qualified Persons | 2-3 |
| 2.5 | Personal Inspection
| 2-3 |
| 2.6 | Terms and Definitions | 2-4 |
| 3 | RELIANCE ON OTHER EXPERTS | 3-1 |
| 4 | PROPERTY DESCRIPTION AND LOCATION | 4-1 |
| 4.1 | Location | 4-1 |
| 4.2 | Project Ownership | 4-2 |
| 4.3 | Mineral Tenure | 4-2 |
| 4.4 | Royalties and Encumbrances | 4-2 |
| 4.5 | Property Agreements | 4-2 |
| 4.6 | Permitting Considerations | 4-2 |
| 4.7 | Environmental Considerations | 4-4 |
| 4.8 | Social License Considerations | 4-4 |
| 4.9 | Comments on Section 4 | 4-4 |
| 5 | ACCESSIBILITY, CLIMATE, LOCAL RESOURCES, INFRASTRUCTURE, AND PHYSIOGRAPHY | 5-1 |
| 5.1 | Site Access | 5-1 |
| 5.2 | Climate | 5-1 |
| 5.3 | Local Resources and Infrastructure | 5-3 |
| 5.4 | Physiography | 5-4 |
| 5.4.1 | Terrain | 5-4 |
| 5.4.2 | Vegetation | 5-4 |
Effective Date: May 29, 2020 Project No. TRQ-06 | |
|
Page i
Homestake Ridge Project
NI43-101F1 Technical Report
| 5.5 | Seismicity | 5-5 |
| 5.6 | Comments on Section 5 | 5-6 |
| 6 | HISTORY | 6-1 |
| 6.1 | Prior Ownership | 6-1 |
| 6.2 | Exploration History | 6-1 |
| 6.3 | Production | 6-3 |
| 7 | GEOLOGICAL SETTING AND MINERALIZATION | 7-1 |
| 7.1 | Regional Geology | 7-1 |
| 7.2 | Local Geology | 7-4 |
| 7.3 | Property Geology | 7-6 |
| 7.4 | Mineralization | 7-10 |
| 7.4.1 | Homestake Main Deposit | 7-12 |
| 7.4.2 | Homestake Silver Deposit | 7-12 |
| 7.4.3 | South Reef Zone | 7-13 |
| 7.5 | Prospects/Exploration Targets | 7-13 |
| 7.5.1 | Vanguard Cu and Au Zones | 7-15 |
| 7.5.2 | Sericite Zone (Gold Reef, Fox Reef) | 7-15 |
| 7.5.3 | Dilly and Dilly West Zones | 7-15 |
| 7.5.4 | North Homestake Zone (North Dome) | 7-16 |
| 7.5.5 | KNHSR1 | 7-16 |
| 7.5.6 | Kombi | 7-17 |
| 7.5.7 | Bria | 7-17 |
| 8 | DEPOSIT TYPES | 8-1 |
| 9 | EXPLORATION | 9-1 |
| 9.1 | Rock Sampling | 9-1 |
| 9.1.1 | Rock Sampling Methodology | 9-1 |
| 9.1.2 | Rock Sampling Results | 9-1 |
| 9.2 | Soil Sampling | 9-1 |
| 9.2.1 | 2017 Ah Horizon Soil Sampling Methodology | 9-1 |
| 9.2.2 | 2017 Talus Fines Sampling Methodology
| 9-1 |
| 9.2.3 | B-Horizon Soil Sampling Methodology
| 9-1 |
| 9.2.4 | Soil Sample Results
| 9-1 |
| 9.3 | Induced Polarization Survey | 9-2 |
| 9.4 | Re-log of Historic Drill Core | 9-2 |
| 9.5 | Geochronological Study | 9-2 |
| 9.6 | Airborne Geophysics | 9-3 |
| 10 | DRILLING | 10-1 |
| 10.1 | Historical Drilling | 10-1 |
| 10.2 | Auryn Resources Inc. Drilling | 10-1 |
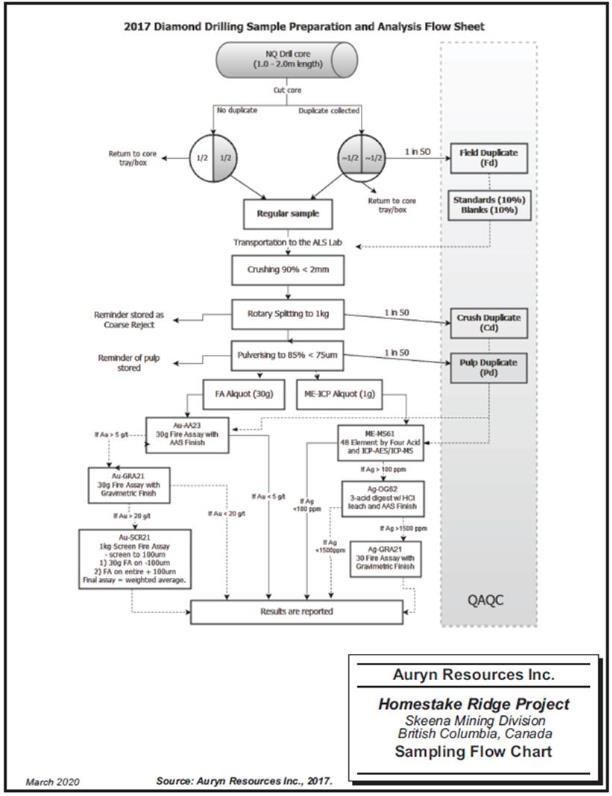
| 11 | SAMPLE PREPARATION, ANALYSES, AND SECURITY | 11-5 |
| 11.1 | Historic Sampling | 11-5 |
| 11.2 | Homestake Resources Corporation Sampling | 11-5 |
| 11.3 | Assaying of Drill Core | 11-6 |
| 11.3.1 | 2003 to 2006 Procedure | 11-6 |
| 11.3.2 | 2007 to 2008 Procedure | 11-7 |
| 11.3.3 | 2009 to 2012 Procedure | 11-7 |
| 11.4 | Agnico Eagle Mines Limited Sampling | 11-8 |
Effective Date: May 29, 2020 Project No. TRQ-06 | |
|
Page ii
Homestake Ridge Project
NI43-101F1 Technical Report
| 11.5 | Auryn Sampling | 11-9 |
| 11.6 | Laboratory Methods | 11-11 |
| 11.7 | QC Sampling | 11-13 |
| 11.8 | 2017 to 2019 QC Programs | 11-13 |
| 12 | DATA VERIFICATION | 12-1 |
| 12.1 | Site Visit | 12-1 |
| 12.2 | Historical Verification | 12-1 |
| 12.3 | 2017 to 2019 Verification Work | 12-1 |
| 12.4 | Assay Verification | 12-2 |
| 13 | MINERAL PROCESSING AND METALLURGICAL TESTING | 13-1 |
| 13.1 | Overview | 13-1 |
| 13.2 | Base Metal Laboratories 2016 | 13-1 |
| 13.3 | Ore Sorting | 13-2 |
| 13.4 | Gravity Concentration | 13-3 |
| 13.5 | Main Composite Rougher Flotation Testing | 13-3 |
| 13.6 | Silver Composite Rougher Flotation Testing | 13-4 |
| 13.7 | Main Composite Cleaner Flotation Testing | 13-4 |
| 13.8 | Silver Composite Cleaner Flotation Testing | 13-5 |
| 13.9 | Cyanide Leaching of Flotation Products | 13-6 |
| 13.1 | Concentrate Quality Estimates | 13-6 |
| 13.11 | Comment on Metallurgical Sampling | 13-7 |
| 13.12 | Qualified Persons Opinion | 13-7 |
| 14 | MINERAL RESOURCE ESTIMATES | 14-1 |
| 14.1 | Resource Database | 14-1 |
| 14.2 | Geological Interpretation | 14-3 |
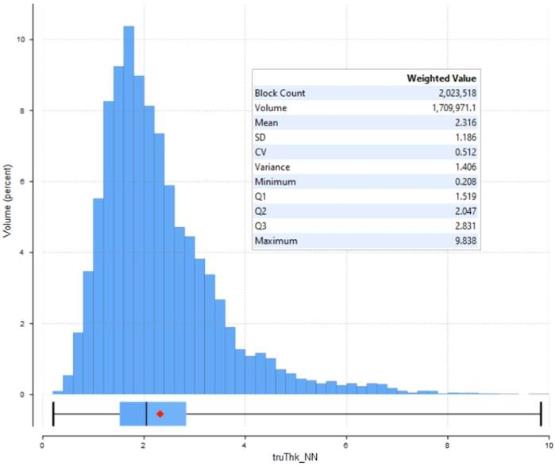
| 14.3 | True Thickness | 14-5 |
| 14.4 | Treatment of High-Grade Assays | 14-6 |
| 14.4.1 | Capping Levels | 14-6 |
| 14.5 | High-Grade Restriction | 14-8 |
| 14.6 | Compositing | 14-8 |
| 14.7 | Variography | 14-9 |
| 14.8 | Search Strategy and Grade Interpolation Parameters | 14-11 |
| 14.9 | Bulk Density | 14-12 |
| 14.1 | Block Models | 14-14 |
| 14.11 | Cut-off Grade | 14-18 |
| 14.12 | Classification | 14-19 |
| 14.13 | Block Model Validation | 14-20 |
| 14.14 | Mineral Resource Reporting | 14-24 |
| 14.15 | Comparison to Previous Estimates | 14-26 |
| 14.16 | Comments on Section 14 | 14-28 |
| 15 | MINERAL RESERVE ESTIMATES | 15-1 |
Effective Date: May 29, 2020 Project No. TRQ-06 | |
|
Page iii
Homestake Ridge Project
NI43-101F1 Technical Report
| 16 | MINING METHODS | 16-1 |
| 16.1 | Overview | 16-1 |
| 16.2 | Geotechnical Considerations | 16-1 |
| 16.3 | Cut-Off Grade | 16-1 |
| 16.4 | Mining Method | 16-2 |
| 16.5 | Production Schedule | 16-3 |
| 16.6 | Dilution | 16-5 |
| 16.7 | Mine Development | 16-6 |
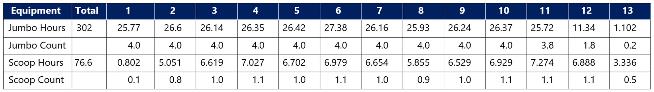
| 16.7.1 | Equipment Utilization | 16-7 |
| 16.8 | Mine Backfill | 16-7 |
| 16.9 | Mine Services | 16-8 |
| 16.9.1 | Ventilation | 16-8 |
| 16.9.2 | Compressed Air | 16-8 |
| 16.9.3 | Water | 16-8 |
| 16.9.4 | Mine Dewatering | 16-8 |
| 16.9.5 | Electrical Power | 16-8 |
| 16.9.6 | Emergency Egress and Refuge | 16-8 |
| 17 | RECOVERY METHODS | 17-1 |
| 17.1 | Flowsheet Development | 17-1 |
| 17.2 | Deleterious Elements | 17-4 |
| 18 | PROJECT INFRASTRUCTURE | 18-1 |
| 18.1 | Site Access | 18-1 |
| 18.2 | Barge Landing | 18-3 |
| 18.3 | Power | 18-3 |
| 18.3.1 | Transmission Line Alternative | 18-3 |
| 18.3.2 | Hydropower Alternatives | 18-4 |
| 18.3.3 | Diesel Power Alternative | 18-4 |
| 18.4 | Water Supply | 18-4 |
| 18.5 | Waste Rock Storage | 18-5 |
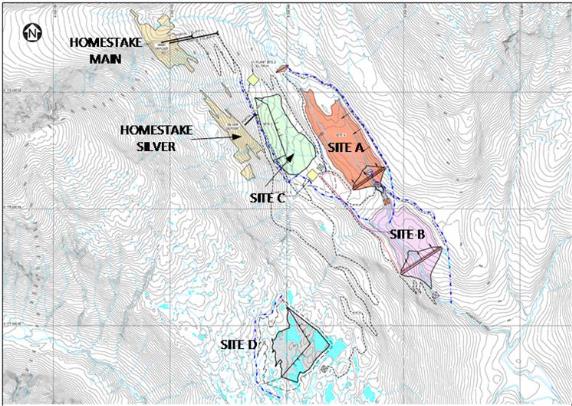
| 18.6 | Tailings Storage Facility | 18-5 |
| 18.6.1 | Slurried Tailings Options – Sites A and B | 18-6 |
| 18.6.2 | Filtered Tailings Options – Site C and Site D | 18-7 |
| 18.6.3 | Site Selection | 18-9 |
| 18.7 | Process Plant | 18-9 |
| 18.8 | Ancillary Facilities | 18-9 |
| 18.8.1 | Person-Camp | 18-9 |
| 18.8.2 | Core Shack | 18-9 |
| 18.8.3 | Assay Laboratory | 18-9 |
| 18.8.4 | Maintenance Shop and Warehouse | 18-10 |
| 18.8.5 | Mine Administration/Technical Offices | 18-10 |
| 18.8.6 | Underground Dry | 18-10 |
| 18.9 | Storage | 18-10 |
| 18.9.1 | Diesel Fuel | 18-10 |
| 18.9.2 | Potable Water | 18-10 |
| 18.9.3 | Fire Water | 18-10 |
| 18.9.4 | Explosives | 18-10 |
| 18.9.5 | Reagents | 18-11 |
Effective Date: May 29, 2020 Project No. TRQ-06 | |
|
Page iv
Homestake Ridge Project
NI43-101F1 Technical Report
| 19 | MARKET STUDIES AND CONTRACTS | 19-1 |
| 19.1 | Commodity Pricing | 19-1 |
| 19.2 | Material Contracts | 19-4 |
| 20 | ENVIRONMENTAL STUDIES, PERMITTING, AND SOCIAL OR COMMUNITY IMPACT | 20-1 |
| 20.1 | Environmental Studies Overview | 20-1 |
| 20.2 | Pre-Existing Conditions | 20-2 |
| 20.3 | Waste Rock Characterization | 20-2 |
| 20.4 | Tailings Geochemistry | 20-3 |
| 20.5 | Metals Leaching | 20-4 |
| 20.6 | Environmental Considerations/Monitoring Programs | 20-4 |
| 20.6.1 | Waste Rock Monitoring | 20-4 |
| 20.6.2 | Tailings Surface Water Management | 20-4 |
| 20.6.3 | Groundwater Monitoring | 20-4 |
| 20.6.4 | Surface Water Monitoring | 20-5 |
| 20.6.5 | Surface Runoff Water Management | 20-5 |
| 20.7 | Closure Plan | 20-6 |
| 20.8 | Permitting | 20-7 |
| 20.8.1 | Land Use Plans | 20-7 |
| 20.8.2 | Federal Permits, Approvals, Licences and Authorizations | 20-11 |
| 20.8.3 | Provincial Permits, Approvals and Licences | 20-12 |
| 20.8.4 | Access Road Permitting | 20-15 |
| 20.9 | Considerations of Social and Community Impacts | 20-15 |
| 20.1 | Comments on Section 20 | 20-18 |
| 21 | CAPITAL AND OPERATING COSTS | 21-1 |
| 21.1 | Capital Cost Estimates | 21-1 |
| 21.1.1 | Basis of Estimate | 21-1 |
| 21.1.2 | Direct Costs | 21-1 |
| 21.1.3 | Indirect Costs | 21-3 |
| 21.1.4 | Sustaining Capital | 21-4 |
| 21.2 | Operating Cost Estimates | 21-6 |
| 21.2.1 | Mining Operating Costs | 21-6 |
| 21.2.2 | Process Operating Costs | 21-6 |
| 21.2.3 | General and Administrative Operating Costs | 21-6 |
| 21.2.4 | Environmental Costs | 21-7 |
| 21.2.5 | Community and Social | 21-7 |
Effective Date: May 29, 2020 Project No. TRQ-06 | |
|
Page v
Homestake Ridge Project
NI43-101F1 Technical Report
| 22 | ECONOMIC ANALYSIS | 22-1 |
| 22.1 | Introduction | 22-1 |
| 22.2 | Mine Production Schedule | 22-1 |
| 22.3 | Metal Production | 22-2 |
| 22.4 | Concentrate Freight and Insurance | 22-2 |
| 22.5 | Smelting and Refining Terms | 22-2 |
| 22.6 | Concentrate Marketing Terms | 22-3 |
| 22.7 | Capital Costs | 22-3 |
| 22.7.1 | Sustaining Capital | 22-4 |
| 22.7.2 | Working Capital | 22-4 |
| 22.7.3 | Salvage Value | 22-4 |
| 22.8 | Net of Smelter Revenues | 22-4 |
| 22.9 | Royalties | 22-5 |
| 22.1 | Operating Costs | 22-5 |
| 22.11 | Other Cash Costs | 22-5 |
| 22.12 | Taxes | 22-6 |
| 22.13 | Financial Indicators | 22-6 |
| 22.14 | Sensitivity Analysis | 22-7 |
| 22.15 | Financial Model | 22-8 |
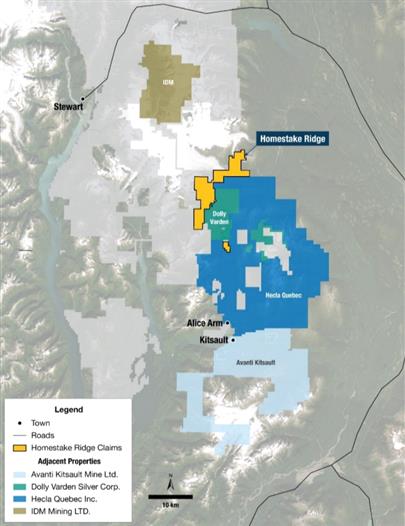
| 23 | ADJACENT PROPERTIES | 23-1 |
| 23.1 | Kinskuch (Extracted from the Hecla website) | 23-2 |
| 23.2 | Dolly Varden | 23-3 |
| 23.3 | Kitsault | 23-4 |
| 24 | OTHER RELEVANT DATA AND INFORMATION | 24-1 |
| 25 | INTERPRETATION AND CONCLUSIONS | 25-1 |
| 25.1 | Mineral Resource Conclusions | 25-2 |
| 25.2 | Risk | 25-3 |
| 25.3 | Opportunities | 25-4 |
| 26 | RECOMMENDATIONS | 26-1 |
| 26.1 | Future Studies | 26-1 |
| 26.1.1 | Geology and Mineral Resources | 26-1 |
| 26.1.2 | Resource Drilling | 26-2 |
| 26.1.3 | Geotechnical Studies | 26-2 |
| 26.1.4 | Environmental Testing | 26-2 |
| 26.1.5 | Environmental Monitoring | 26-2 |
| 26.1.6 | Surface Hydrology and Water Balance | 26-3 |
| 26.1.7 | Metallurgical Testing | 26-3 |
| 26.1.8 | Power Source | 26-3 |
| 26.2 | Proposed Budget | 26-4 |
| 27 | REFERENCES | 27-1 |
| 28 | QUALIFIED PERSONS CERTIFICATES | 28-1 |
Effective Date: May 29, 2020 Project No. TRQ-06 | |
|
Page vi
Homestake Ridge Project
NI43-101F1 Technical Report
List of Tables
| Table 1-1 Mineral Resources – Effective Date: December 31, 2019 Auryn Resources Inc. | |
| – Homestake Ridge Project | 1-3 |
| Table 1-2 Financial Indicators (US$ M) | 1-6 |
| Table 2-1 Qualified Persons | 2-3 |
| Table 4-1 Homestake Mineral Claims | 4-3 |
| Table 4-2 Crown Grants | 4-4 |
| Table 5-1 Climatic Data | 5-3 |
| Table 9-1 Summary of Geochronology Results | 9-3 |
| Table 9-2 VTEM Survey Summary | 9-3 |
| Table 10-1 Historical Drilling | 10-1 |
| Table 11-1 Certified Reference Material | 11-13 |
| Table 14-1 Mineral Resource Assay Statistics | 14-2 |
| Table 14-2 Capping: Au and Ag | 14-6 |
| Table 14-3 Capping: Cu, Pb, As, Sb | 14-7 |
| Table 14-4 Composite Statistics | 14-9 |
| Table 14-5 Variography Results | 14-10 |
| Table 14-6 Bulk Density by Zone | 14-14 |
| Table 14-7 Bulk Density by Domain | 14-14 |
| Table 14-8 Block Model Geometry: HM and HS | 14-15 |
| Table 14-9 Block Model Geometry: SR | 14-16 |
| Table 14-10 Key Block Model Variables | 14-16 |
| Table 14-11 Statistical Comparison of Block Model Grades | 14-21 |
| Table 14-12 Mineral Resources – December 31, 2019 Auryn Resources Inc. | |
| – Homestake Ridge Project | 14-24 |
| Table 14-13 Mineral Resources – Sensitivity by Cut-Off Grade Auryn Resources Inc. | |
| – Homestake Ridge Project | 14-25 |
| Table 14-14 Deleterious Element Content of Mineral Resources | 14-26 |
| Table 14-15 Comparison of 2017 and 2019 Mineral Resource Estimates | 14-27 |
| Table 16-1 Cutoff Grade Calculation | 16-2 |
| Table 16-2 Life of Mine Production Schedule | 16-4 |
| Table 16-3 Stope Tonnage Dilution | 16-5 |
| Table 16-4 Life of Mine Development Lengths | 16-6 |
| Table 16-5 Lateral Development Summary | 16-6 |
| Table 16-6 Major Equipment Utilization (hours x 1000) by Project Year | 16-7 |
| Table 16-7 Backfill Demand by Project Year (m3) | 16-7 |
| Table 17-1 Metals Distribution at Homestake Ridge | 17-1 |
| Table 17-2 Metallurgical Recoveries | 17-3 |
| Table 17-3 Concentrate Grades | 17-3 |
| Table 17-4 Concentrate Production – Life of Mine | 17-3 |
| Table 17-5 Deleterious Elements in the Concentrates | 17-4 |
| Table 19-1 Historical Metal Prices effective March 26, 2020 – US Dollars | 19-1 |
| Table 20-1 Federal Permits and Approvals Potentially Applicable to the Project | 20-11 |
| Table 20-2 Provincial Permits and Approvals Potentially Applicable to the Project | 20-13 |
| Table 21-1 Capital Cost Summary | 21-2 |
| Table 21-2 Environmental Monitoring Costs (C$) | 21-4 |
| Table 21-3 Sustaining Capital Costs – Life of Mine | 21-5 |
| Table 21-4 Operating Cost Summary (US$) | 21-6 |
| Table 21-5 Unit Mining Costs (US$) | 21-6 |
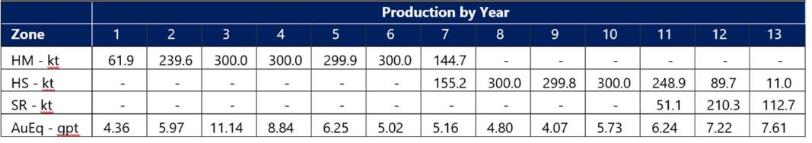
| Table 22-1 Production by Year (kt) | 22-1 |
| Table 22-2 Life of Mine Metal Production | 22-2 |
| Table 22-3 Concentrate Freight and Insurance (US$) | 22-2 |
| Table 22-4 Treatment and Refining Costs (US$) | 22-3 |
| Table 22-5 Concentrate Marketing Terms | 22-3 |
| Table 22-6 Sustaining Capital Expenditures over the Life of Mine(US$ Millions) | 22-4 |
| Table 22-7 Base Case Metal Prices (US$) | 22-4 |
| Table 22-8 Life of Mine Metal Revenues – (US$) | 22-5 |
| Table 22-9 Financial Indicators | 22-7 |
| Table 22-10 Metal Price Sensitivity – After-Tax | 22-7 |
| Table 22-11 Operating Cost Sensitivity – After-Tax | 22-8 |
| Table 22-12 Capital Cost Sensitivity – After-Tax | 22-8 |
| Table 22-13 Base Case Financial Model (US$ Millions) | 22-9 |
| Table 26-1 Future Work Tasks and Budget (US$) | 26-4 |
Effective Date: May 29, 2020 Project No. TRQ-06 | |
|
Page vii
Homestake Ridge Project
NI43-101F1 Technical Report
List of Figures
| Figure 4.2: Mineral Claims | 4-1 |
| Figure 4.3: Claims Subject to Royalty | 4-3 |
| Figure 5.1: Site Access | 5-2 |
| Figure 5.2: Earthquake Epicenter Map for Events in the Past 50 Years | 5-5 |
| Figure 7.1: Regional Geology | 7-3 |
| Figure 7.2: Local Geology | 7-5 |
| Figure 7.3: Property Geology | 7-7 |
| Figure 7.4: Deposit Locations | 7-11 |
| Figure 7.5: Longitudinal Section Through the Homestake Ridge Deposit Looking North-East | 7-11 |
| Figure 7.6: Prospects/Exploration Targets | 7-14 |
| Figure 9.1: Homestake Merged Magnetics | 9-4 |
| Figure 9.2: Homestake Merged Conductivity | 9-5 |
| Figure 10.1: Drilling Collar Locations | 10-3 |
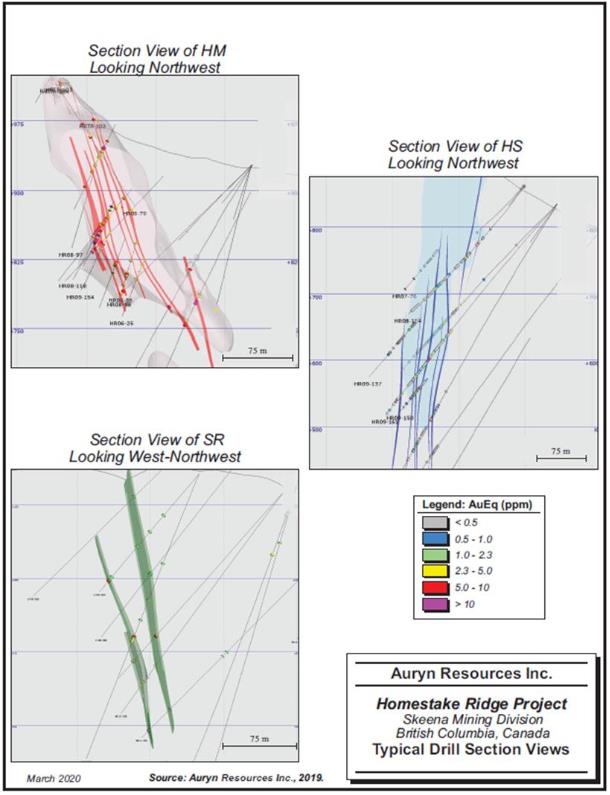
| Figure 10.2: Typical Drill Section Views | 10-4 |
| Figure 11.1: Core Handling Flow Chart | 11-10 |
| Figure 11.2: Sampling Flow Chart | 11-12 |
| Figure 13.1: Metallurgical Sample Locations | 13-8 |
| Figure 14.1: Oblique View of HM (Left Side) And HS (Right Side) Veins | 14-4 |
| Figure 14.2: Histogram of TT Where GTT > 4.0 | 14-5 |
| Figure 14.3: Plan View of Bulk Density Sample Distribution | 14-13 |
| Figure 14.4: Plan View of Block Models | 14-17 |
| Figure 14.5: Visual Validation Example | 14-22 |
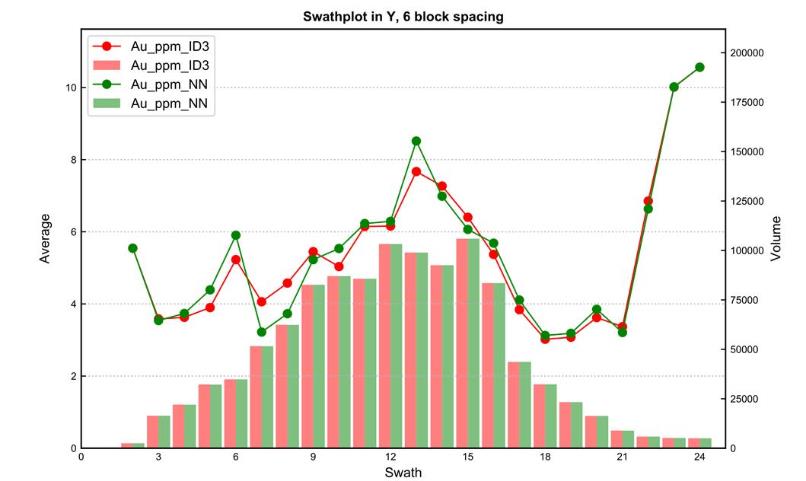
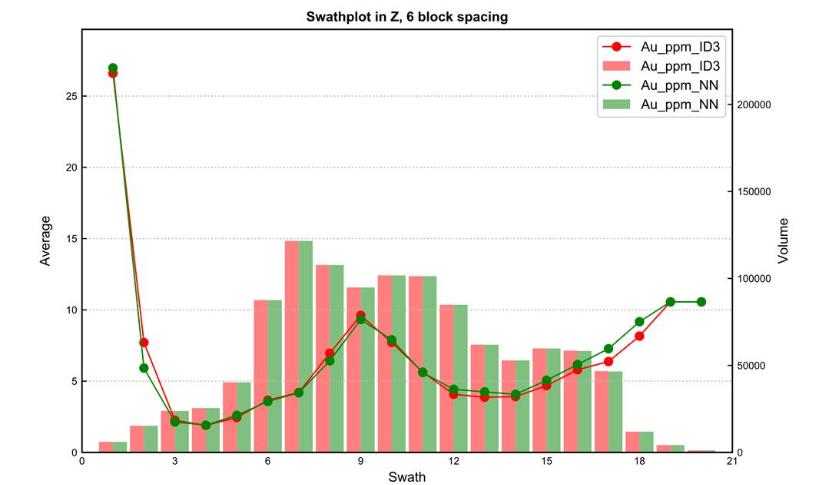
| Figure 14.6: Swath Plot Example (HM Y and Z, Width 30 m) | 14-23 |
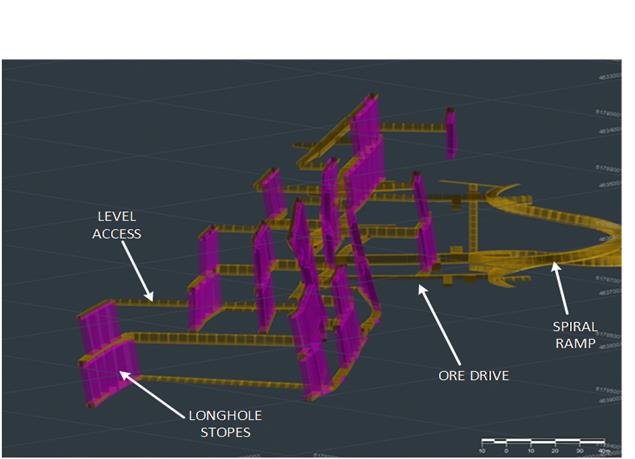
| Figure 16.1: Longhole Open Stoping at Homestake Ridge | 16-3 |
| Figure 16.2: Life of Mine Production Schedule | 16-5 |
| Figure 17.1: Proposed Flowsheets for Homestake Main (Copper Circuit) and |
| Homestake Silver (Lead/Zinc Circuit) | 17-2 |
| Figure 18.1: Site Development Plan | 18-1 |
| Figure 18.2: Site Access | 18-2 |
| Figure 18.3: Potential Tailings Storage Options | 18-6 |
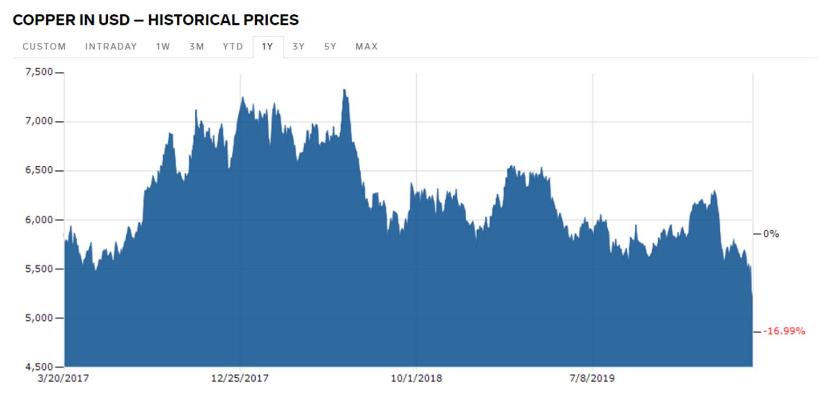
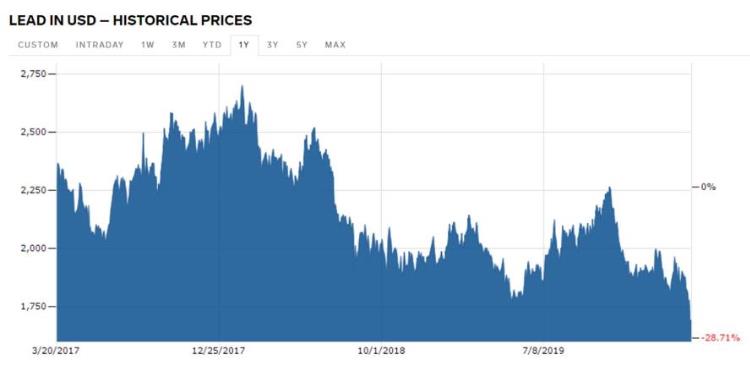
| Figure 19.1: 3-Year Historical Price Trends for Gold (top) and Silver (bottom) | 19-2 |
| Figure 19.2: 3-Year Historical Price Trends for Copper (top) and Lead (bottom) | 19-3 |
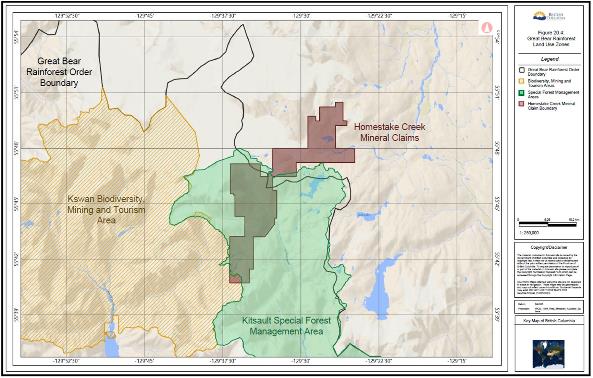
| Figure 20.1: Great Bear Rainforest Land Use Zones | 20-8 |
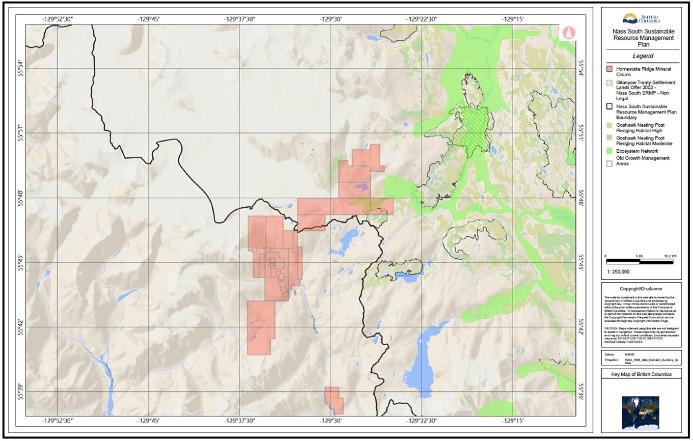
| Figure 20.2: Nass South Sustainable Resource Management Plan Areas | 20-10 |
| Figure 23.1: Mineral Properties in the Vicinity of Homestake Ridge | 23-1 |
Effective Date: May 29, 2020 Project No. TRQ-06 | |
|
Page viii
Homestake Ridge Project
NI43-101F1 Technical Report
The subject of this document is the Homestake Ridge gold project located in the so-called Golden Triangle of north-central British Columbia. The Project is owned and operated by Auryn Resources Inc. (the “Company” or “Auryn”) of Vancouver, B.C. Auryn is listed on the Toronto stock exchange and the New York Stock Exchange.
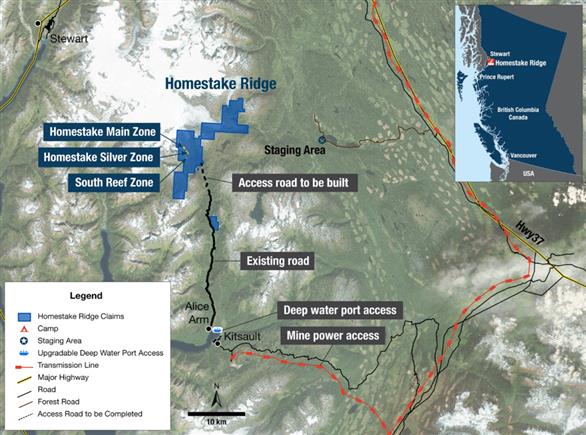
The Homestake Ridge Project comprises 7,484.37 hectares (ha) of mineral claims and crown grants and is located approximately 32 km north-northwest of the tidewater communities of Alice Arm and Kitsault, BC.
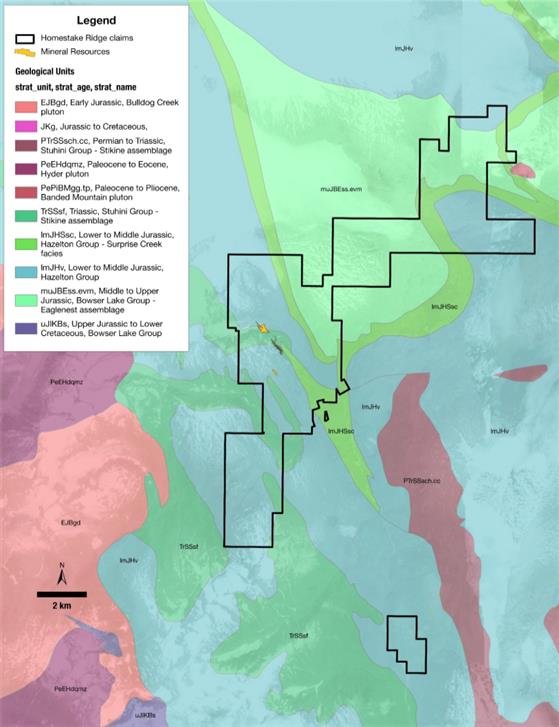
The Project is located within the prolific Iskut-Stewart-Kitsault Belt which hosts several precious and base metal mineral deposits. Diverse mineralization styles include stratabound sulphide and silica-rich zones, sulphide veins, and disseminated or stockwork sulphides. Mineralization is related to Early Jurassic feldspar-hornblende-phyric sub-volcanic intrusions and felsic volcanism, which commonly occurs with zones of pyrite-sericite alteration. Numerous genetic models can be proposed for the area and local deposits present a broad range of characteristics.
The Project lies within the metallogenic region known as the Stewart Complex. Described as the contact of the eastern Coast Plutonic Complex with the west-central margin of the successor Bowser Basin, the Stewart Complex ranges from Middle Triassic to Quaternary in age and is comprised of sedimentary, volcanic, and metamorphic rocks.
The Project covers the transition between the sedimentary and volcanic rocks of the Upper Triassic to Lower Jurassic Stuhini Group, a complex sequence of Lower to Middle Jurassic sedimentary, volcanic, and intrusive rocks of the Hazelton Group and sedimentary rocks of the Upper to Middle Jurassic Bowser Lake Group.
In the northern portion of the Project, at the headwaters of Homestake Creek, rhyolitic volcanic rocks occur at the base of the Salmon River sediments.
The eastern portion of the Project is dominated by the Middle to Upper Jurassic Bowser Basin Group which conformably overlies the thin bedded graphitic argillites of the Salmon River formation.
Effective Date: May 29, 2020 Project No. TRQ-06 | |
|
Page 1-1
Homestake Ridge Project
NI43-101F1 Technical Report
Structure on the Project largely reflects northeast-southwest compression that has continued from the Jurassic to present day. Recent drilling and mapping suggest that the local stratigraphy has undergone several deformation events including uplift and local extension of the Stuhini and lower Hazelton stratigraphy. Large northeast trending ankerite bearing faults have been mapped and related to Tertiary east-west extension.
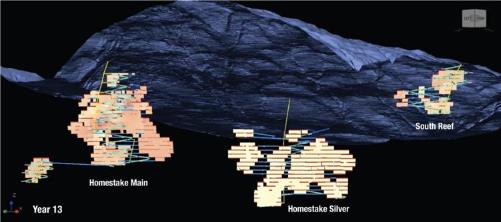
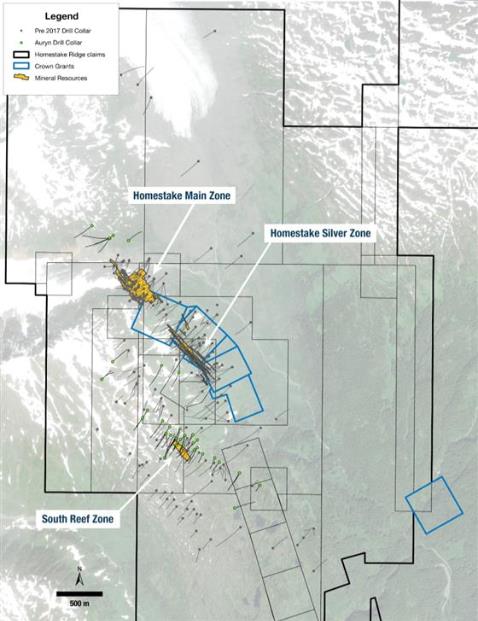
The main zones of the Homestake Ridge deposit are the Homestake Main (HM), Homestake Silver (HS), and South Reef (SR).
The Homestake Main zone is the more copper-rich of the zones, with both gold-rich and silver-rich variants and an apparent trend of increasing copper grade with depth. Grades for gold typically range from 0.1 g/t Au to 2 g/t Au with some intercepts measuring into the hundreds of grams per tonne and averaged at 7.75 g/t Au. Silver grades are generally in the 1.0 g/t Ag to 100 g/t Ag range but can be as high as hundreds and even thousands of grams per tonne. The average silver grade in the Homestake Main zone is 68.6 g/t Ag. Copper grades vary from parts per million to several percent, with mean grades observed to increase significantly with depth.
The Homestake Silver zone, located approximately 0.5 km southeast of Homestake Main, contains very little copper, and is relatively higher in silver content. Silver grades at Homestake Silver average 154 g/t Ag, approximately double that of the Homestake Main zone (68.6 g/t Ag) and 26 times that of South Reef (5.8 g/t Ag). Gold grades at Homestake Silver typically range up to several g/t Au and averaged 3.5 g/t Au in the samples contained within the interpreted zone boundaries. Copper content is comparatively low, however, geochemically significant, and generally measures between 10 ppm Cu and 500 ppm Cu.
The South Reef zone is comprised of two narrow sub-parallel tabular bodies which strike at approximately 120° to 130° and dip 70°NE to 80°NE. To date, only twelve holes have intersected significant mineralization, as such characterization of the structure and grades is preliminary. The zones measure one metre to three metres in thickness and have been traced for approximately 300 m vertically and 400 m along strike. Silver grades at SR average 5.8 g/t Ag in the vein samples. This is offset by high gold values, which average 5.9 g/t Au.
The Homestake deposits are commonly vertically zoned from a base metal poor Au-Ag-rich top to an Ag-rich base metal zone over a vertical range of 250 m to 350 m. The silver-galena-sphalerite veins of the Homestake Silver Zone exhibit many of these features.
Effective Date: May 29, 2020 Project No. TRQ-06 | |
|
Page 1-2
Homestake Ridge Project
NI43-101F1 Technical Report
1.4
Exploration Highlights
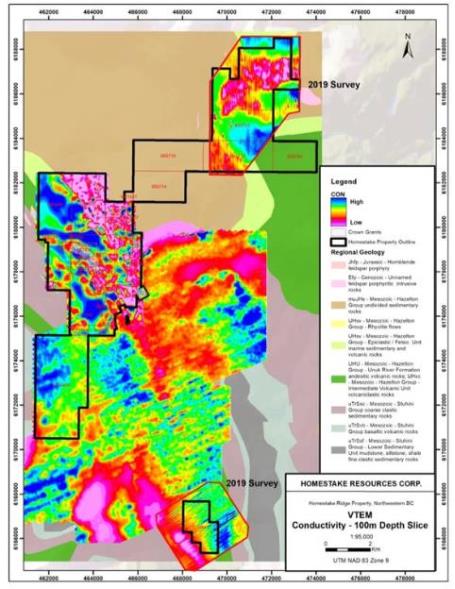
Since acquiring the Homestake Ridge Project in late 2016, Auryn has completed extensive exploration across the Property to advance additional targets to the drill ready stage. This work has included geological mapping, rock and soil geochemical sampling, portable X-ray fluorescence and shortwave infrared surveys, geophysical (IP) surveying, the re-logging of historical drill core, geochronological studies and airborne VTEM geophysical surveys along with reprocessing of historic geophysical survey data.
The Homestake Ridge property hosts a number of other mineral occurrences, however, none of these targets have NI43-101 complaint Mineral Resources.
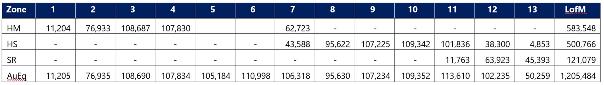
Mineral Resources were estimated considering a potential underground mining scenario. At a cut-off grade of 2.0 g/t gold equivalent (AuEq), Indicated Mineral Resources were estimated to total 0.736 million tonnes (Mt) at average grades of 7.02 g/t Au, 74.8 g/t Ag, and 0.18 percent Cu. At the same cut-off grade, Inferred Mineral Resources were estimated to total 5.545 Mt at average grades of 4.58 g/t Au, 100.0 g/t Ag, and 0.13 percent Cu as shown in Table 1-1.
Mineral Resources – Effective Date: December 31, 2019
Auryn Resources Inc. – Homestake Ridge Project
Classification And Zone | Tonnes (Mt) | Average Grade | Contained Metal |
| Gold (g/t Au) | Silver (g/t Ag) | Copper (% Cu) | Lead(% Pb) | Gold (oz Au) | Silver (Moz Ag) | Copper (Mlb Cu) | Lead (Mlb Pb) |
| Indicated | | | | | | | | | |
| HM | 0.736 | 7.02 | 74.8 | 0.18 | 0.077 | 165,993 | 1.8 | 2.87 | 1.25 |
| Total Indicated | 0.736 | 7.02 | 74.8 | 0.18 | 0.077 | 165,993 | 1.8 | 2.87 | 1.25 |
| | | | | | | | | | |
| Inferred | | | | | | | | | |
| HM | 1.747 | 6.33 | 35.9 | 0.35 | 0.107 | 355,553 | 2.0 | 13.32 | 4.14 |
| HS | 3.354 | 3.13 | 146.0 | 0.03 | 0.178 | 337,013 | 15.7 | 2.19 | 13.20 |
| SR | 0.445 | 8.68 | 4.9 | 0.04 | 0.001 | 124,153 | 0.1 | 0.36 | 0.00 |
| Total Inferred | 5.545 | 4.58 | 100.0 | 0.13 | 0.142 | 816,719 | 17.8 | 15.87 | 17.34 |
Notes:
1.
Canadian Institute of Mining, Metallurgy and Petroleum (CIM) Definition Standards for Mineral Resources and Mineral Reserves dated May 10, 2014 (CIM (2014) definitions), as incorporated by reference in NI43-101, were followed for Mineral Resource estimation.
2.
Mineral Resources are estimated at a cut-off grade of 2.0 g/t AuEq.
Effective Date: May 29, 2020 Project No. TRQ-06 | |
|
Page 1-3
Homestake Ridge Project
NI43-101F1 Technical Report
3.
AuEq values were calculated using a long-term gold price of US$1,300 per ounce, silver price at US$20 per ounce, and copper price at US$2.50 per pound and a US$/C$ exchange rate of 1.2. The AuEq calculation included provisions for metallurgical recoveries, treatment charges, refining costs, and transportation.
4.
Bulk density ranges from 2.69 t/m3 to 3.03 t/m3 depending on the domain.
5.
Differences may occur in totals due to rounding.
6.
The Qualified Person responsible for this Mineral Resource Estimate is Philip A. Geusebroek of Roscoe Postle Associates Inc. (RPA), now part of SLR Consulting Ltd (SLR).
7.
The reader is cautioned that Mineral Resources that are not Mineral Reserves do not have demonstrated economic viability.
8.
HM=Homestake Main Zone, HS= Homestake Silver Zone, and SR= South Reef Zone.
The Qualified Person is of the opinion that the practices and methods used by Auryn to estimate Mineral Resources at the Project are in accordance with the CIM (2014) definitions, and that the December 31, 2019 Mineral Resource estimate is reasonable and acceptable for use in the Preliminary Economic Assessment (PEA).
There are no Mineral Reserves on the Homestake Ridge Project.
The PEA mine plan and production schedule were generated with Deswik Stope Optimizer software on the basis of the undated block model and resource wireframes supplied by Auryn. The principal mining method was longhole open stoping in a longitudinal direction, with a minimum mining width of 2.5 m. A mining cutoff grade of 3.5 gpt gold-equivalent was used to define the stope outlines.
The resulting mine production schedule consists of 2.87 M stope tonnes and 0.55 M mineralized development tonnes for a total of 3.42 Mt grading 5.41 gpt Au, 84.31 gpt Ag, 0.13 percent Cu and 0.12 percent Pb. The nominal mining rate is 900 tpd for an overall mine life of 13 years.
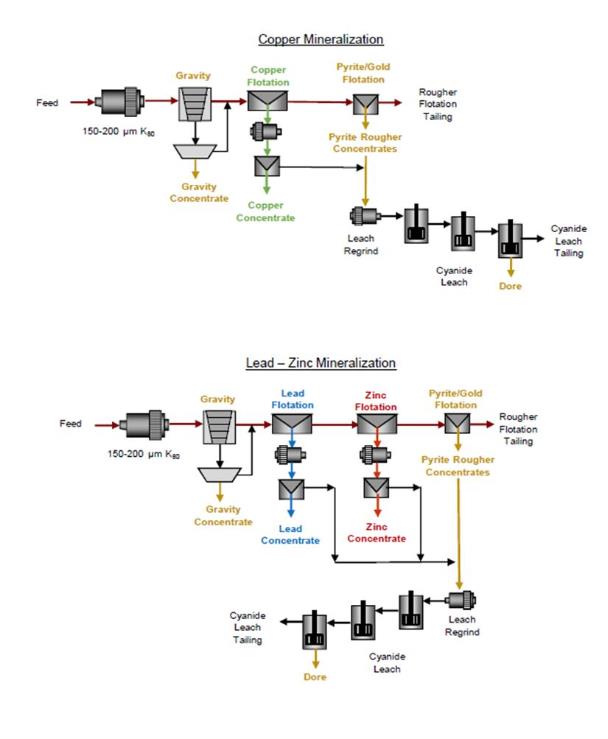
Processing of Homestake Ridge mineralization will be complicated by the difference in metal contents across the 3 principal deposits. The Homestake Main mineralization is high in copper, low in lead, and moderate in zinc. The Homestake Silver and South Reef mineralization has low copper grades. Homestake Silver has relatively low gold grades but high lead, zinc, and silver grades. South Reef is essentially just gold with a minor amount of copper.
Effective Date: May 29, 2020 Project No. TRQ-06 | |
|
Page 1-4
Homestake Ridge Project
NI43-101F1 Technical Report
The PEA focuses on an optimal process strategy consisting of crushing and grinding, followed by gravity recovery of a gold concentrate, then selective flotation to produce base metal concentrates (one for copper and one for lead/zinc) and finally regrinding and flotation to produce a pyrite concentrate. Cyanide leaching of the pyrite concentrate would be used to produce doré bars.
The Homestake Ridge Project is a remote greenfields site with no existing roads, power, water or camp infrastructure. Development of the project will require:
■
Upgrading and extending the current access road to allow the movement of freight, consumable supplies and manpower
■
Installing local hydro or diesel power, or connecting to the nearby BC Hydro grid
■
Construction of a person-camp to allow drive-in, drive-out (DIDO) manpower rosters
■
Construction of a 900 tpd metallurgical plant
■
Construction of a tailings dam and tailings storage facilities.
The ancillary mine facilities include:
■
Core storage and exploration offices
■
Equipment maintenance shops
■
Mine administration and technical offices
■
Storage for diesel fuel and lubricants
■
Potable and fire water.
Effective Date: May 29, 2020 Project No. TRQ-06 | |
|
Page 1-5
Homestake Ridge Project
NI43-101F1 Technical Report
The pre-production capital cost has been estimated at US$88.4 million (C$126.3 million) including all direct and indirect costs. The PEA is based on contractor owned and operated equipment and manpower. A contingency of 15 percent has been applied to all direct facility costs.
Sustaining costs have been estimated at US$85.8 million after a US$3.5 million credit for the end-of-mine salvage.
Operating costs were developed from unit rate costs and benchmark costs for projects of a similar size and scope. The all-in operating costs have been estimated at US$89.40 per tonne milled.
The economic analysis was carried out using standard discounted cashflow modelling techniques. The production and capital estimates were estimated on an annual basis for the life of mine.
Applicable royalties were applied along with current Federal and Provincial taxes and incorporated into the cashflow model. The economic analysis was carried out on a 100 percent project basis. Given the location and relatively uncomplicated nature of the project, the Base Case uses a 5 percent discount factor in arriving at the project Net Present Value (NPV). Standard payback calculation methodology was also utilized.
The project generates a Before-Tax cashflow of US$277 million (US$184 million After-Tax) over 13 years or roughly US$21 million in free cashflow per year as shown in Table 1-2 below.
Financial Indicators
| Qualified Person | Pre-Tax | After Tax |
| NPV @ 0% (US$ M) | 277.82 | 183.99 |
| NPV @ 5% (US$ M) | 170.18 | 108.09 |
| NPV @ 7% (US$ M) | 140.04 | 86.73 |
| IRR % | 30.1% | 23.6% |
| Payback (mo) | 34 | 36 |
As required by NI43-101, the author cautions the reader that the PEA is preliminary in nature, that it includes Inferred mineral resources that are considered too speculative geologically to have the economic considerations applied to them that would enable them to be categorized as mineral reserves, and there is no certainty that the preliminary economic assessment will be realized.
1.13
Qualified Persons Opinion
Based on the analyses herein, it is the opinion of the Qualified Person that the Homestake Ridge Project requires further study. MineFill recommends the project be advanced to a Feasibility level of evaluation.
Effective Date: May 29, 2020 Project No. TRQ-06 | |
|
Page 1-6
This Technical Report has been prepared for Auryn which is incorporated in British Columbia, Canada. The Company has offices in Vancouver, B.C., and is listed on the Toronto Stock Exchange and the NYSE-American, with its common shares trading under the symbols AUG.TO and AUG, respectively.
The subject of this document is the Homestake Ridge Gold Project located in the so-called Golden Triangle of north-central British Columbia. The Company is the 100 percent owner and operator of the Homestake Ridge Project which comprises 7,484.37 ha of mineral claims and crown grants.
This document presents the results of an updated Mineral Resource Estimate and Preliminary Economic Assessment (PEA) of the Homestake Ridge Project. The PEA was prepared in accordance with standard industry practices and in accordance with CIM Definition Standards on Mineral Resources and Reserves (dated May 10, 2014), and Canadian Securities Administrators National Instrument 43-101 (Standards of Disclosure for Mineral Projects) dated June 30, 2011. The effective date of this Technical Report is May 29, 2020.
2.3
Sources of Information
The Homestake Ridge Project has been the subject of several prior NI43-101 compliant Technical Reports. The most recent was completed by Roscoe Postle Associates Inc. (RPA) dated September 29, 2017 (later amended on October 23, 2017). This document included an updated mineral resource estimate.
Prior Technical Reports on Homestake Ridge include:
■
A 2013 Technical Report dated June 7, 2013 by Macdonald and Rennie for Homestake Resource Corporation.
■
A 2011 Technical Report dated May 20, 2011 by RPA for Bravo Gold Corp.
■
A 2010 Technical Report dated June 28, 2010 by Scott Wilson RPA for Bravo Gold Corp.
■
A 2007 Technical Report dated April 11, 2007 and amended on June 3, 2008 by Folk and Makepeace for Bravo Venture Group.
Effective Date: May 29, 2020 Project No. TRQ-06 | |
|
Page 2-1
Bravo Gold also completed a number of engineering studies on the site including:
■
A January 24, 2012 geotechnical assessment of the proposed new road extension for the Homestake Ridge Access Road by Golder Associates.
■
A February 27, 2012 preliminary geotechnical assessment of the proposed mine infrastructure sites for the Homestake Ridge Project by Golder Associates.
■
A Road Design Package for the Homestake Ridge access road by AllNorth Consultants dated March 20, 2009.
■
A Kitsault River Road Review Inspection report by AllNorth Consultants dated August 26, 2010.
■
A Homestake Ridge Mainline Access Road Feasibility Study by AllNorth Consultants dated March 3, 2012.
■
Conceptual mine site layouts and run of river hydropower assessments by Knight Piesold dated June 1, 2011.
■
A preliminary power study supply assessment by Knight Piesold dated April 23, 2011.
■
A report on integration of Hydroelectric power within the mine development concepts by Knight Piesold dated June 1, 2011.
■
A plant site and tailings storage facility alternatives assessment by Knight Piesold dated May 19, 2011.
■
A conceptual cost estimate for tailings disposal by Knight Piesold dated May 13, 2011.
■
An October 11, 2011 site inspection report by Knight Piesold.
■
A preliminary ore sorting investigation and benchtop amenability test by Commodas Ultrasort/Tomra Sorting Solutions dated June 14, 2012.
The project library includes a number of other supporting documents, drawings and historical data related to hydroelectric power in the Kitsault region, at the adjacent Kitsault Lake, and at Anyox.
Effective Date: May 29, 2020 Project No. TRQ-06 | |
|
Page 2-2
The Qualified Persons for this Technical Report are as listed in Table 2-1 below.
Qualified Persons
| Qualified Person | Company | Responsible Sections | Site Visit Dates |
| Dr. David Stone, P.E. | MineFill Services, Inc. | All report sections except: Sections 5-12, Section 14 Section 20 | None |
| Philip Geusebroek, P.Geo. | RPA | Sections 10-12 Section 14 | None |
| Paul Chamois, P.Geo. | RPA | Sections 5 – 9 | Aug. 26-28, 2017 |
| Mary Mioska, P.Eng. | OneEighty Consulting | Section 5.4 Section 20 | None |
Paul Chamois, M.Sc. (A), P.Geo., Principal Geologist with RPA and an independent QP, visited the Project from August 26 to 28, 2017. During the visit, Mr. Chamois examined core from the on-going drilling program, confirmed the local geological setting, reviewed the core handling and data collection methodologies, and investigated factors that may affect the Project. Due to the advanced nature of the Project, no independent samples were taken during the visit.
In the QP’s opinion, the limited work carried out during 2018 and 2019 is not material to the project. None of the post-2017 exploration work was utilized in the resource estimation outlined in Section 14, nor in the Preliminary Economic Assessment. The QP’s have reviewed Auryn’s regulatory filings, assessment reports, news releases and databases to verify that no material work was completed on the property post 2017.
None of the other Qualified Persons have visited the project site.
Effective Date: May 29, 2020 Project No. TRQ-06 | |
|
Page 2-3
2.6
Terms and Definitions
Units of measurement used in this report conform to the metric system.
| a | annum | L | litre |
| A | ampere | lb | pound |
| bbl | barrels | L/s | litres per second |
| btu | British thermal units | m | metre |
| °C | degree Celsius | M | mega (million); molar |
| C$ | Canadian dollars | m2 | square metre |
| cal | calorie | m3 | cubic metre |
| cfm | cubic feet per minute | | micron |
| cm | centimetre | MASL | metres above sea level |
cm2 | square centimetre | g | microgram |
| d | day | m3/h | cubic metres per hour |
| dia | diameter | mi | mile |
| dmt | dry metric tonne | min | minute |
| dwt | dead-weight ton | m | micrometre |
°F | degree Fahrenheit | mm | millimetre |
| ft | foot | mo | month |
ft2 | square foot | mph | miles per hour |
ft3 | cubic foot | Mtpa | Million tonnes per annum |
| ft/s | foot per second | Mtpd | Million tonnes per day |
| g | gram | MVA | megavolt-amperes |
| G | giga (billion) | MW | megawatt |
| Gal | Imperial gallon | MWh | megawatt-hour |
| g/L | gram per litre | oz | Troy ounce (31.1035g) |
| Gpm | Imperial gallons per minute | oz/st, opt | ounce per short ton |
| gpt | gram per tonne | ppb | part per billion |
gr/ft3 | grain per cubic foot | ppm | part per million |
gr/m3 | grain per cubic metre | psia | pound per square inch absolute |
| ha | hectare | psig | pound per square inch gauge |
| hp | horsepower | RL | relative elevation |
| hr | hour | s | second |
| Hz | hertz | t | tonne |
in2 | square inch | tpa | tonnes per year |
| J | joule | tpd | tonnes per day |
| k | kilo (thousand) | US$ | United States dollar |
| kcal | kilocalorie | USg | United States gallon |
| kg | kilogram | USgpm | US gallon per minute |
| km | kilometre | V | volt |
km2 | square kilometre | W | watt |
| km/h | kilometre per hour | wmt | wet metric tonne |
| kPa | kilopascal | wt% | weight percent |
| kVA | kilovolt-amperes | yd3 | cubic yard |
| kW | kilowatt | yr | year |
| kWh | kilowatt-hour | | |
Effective Date: May 29, 2020 Project No. TRQ-06 | |
|
Page 2-4
3.
RELIANCE ON OTHER EXPERTS
The authors are not qualified to provide an opinion or comment on issues related to legal agreements, royalties, permitting matters, and taxes.
The authors of this Technical Report have relied on non-QPs for Section 4.3, Mineral Tenure.
For the purpose of this report, the Qualified Person’s have relied on ownership information provided by Auryn and Broughton Law Corporation (Broughton Law), regarding title to the Homestake Ridge Project. Broughton Law provided a legal review and opinion dated September 7, 2016. This information was used in Sections 1 and 4 of this report. The Qualified Persons have not researched property title or mineral rights for the Homestake Ridge Project and expresses no opinion as to the ownership status of the property.
Effective Date: May 29, 2020 Project No. TRQ-06 | |
|
Page 3-1
4.
PROPERTY DESCRIPTION AND LOCATION
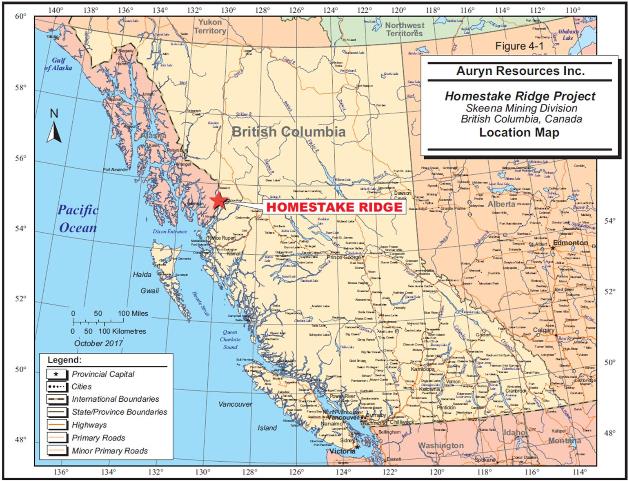
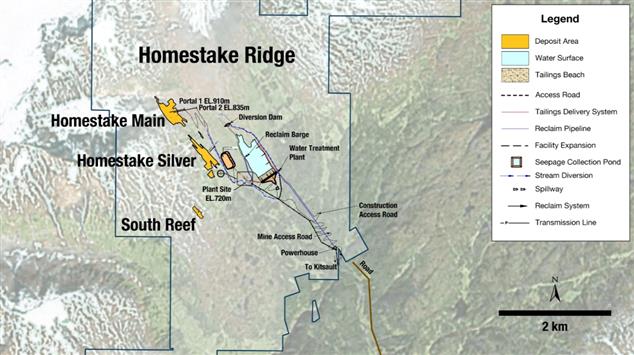
The Homestake Ridge Project covers 7,484.37 hectares and is located 32 km southeast of Stewart, BC, and approximately 32 km north-northwest of the tidewater communities of Alice Arm and Kitsault, BC (Figure 4.1). The property is located on 1:50,000 scale NTS map 102/P13.
The four claim blocks comprising the Project are located within a rectangular area extending for a distance of approximately 23 km in a north-south direction and approximately 13 km in an east-west direction. The claim block hosting the known Mineral Resources is centered on approximately 55° 45' 12.6" N latitude and 129° 34' 39.8" W longitude on Terrain Resource Integrated Management (TRIM) maps 103P072 and 103P073 and lies within Zone 9 of the UTM projection using the NAD’83 datum.
Figure 4.1: Homestake Ridge Project Location Map
Effective Date: May 29, 2020 Project No. TRQ-06 | |
|
Page 4-1
On June 14, 2016, Auryn announced that it had entered into a binding letter agreement with Homestake Resource Corporation (Homestake) whereby it would acquire Homestake under a plan of arrangement (the Arrangement). In consideration for 100 percent of Homestake’s issued and outstanding shares, Auryn would issue approximately 3.3 million shares to Homestake shareholders. During the Arrangement process, Auryn also agreed to provide Homestake with a demand loan of up to C$150,000 on an interest free, unsecured basis. On September 8, 2016, Auryn announced that it had completed the Arrangement and that Homestake had become a wholly owned subsidiary of Auryn.
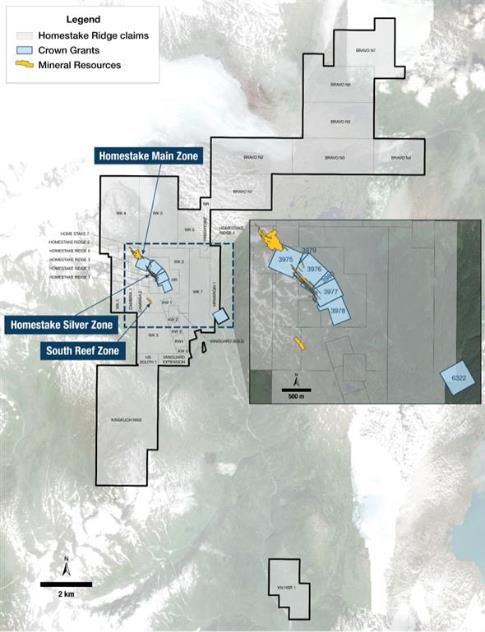
The Project comprises four non-contiguous blocks consisting of seven crown granted claims covering 96.712 ha and 37 mineral claims covering 7,484.37 ha (Figure 4.2). Table 4-1 lists the mineral claims along with the relevant individual tenure information including tenure number and name, issue and expiry dates, title type, and area. Table 4-2 lists the crown granted claims.
The crown grants include surface rights whereas the mineral claims do not.
There are no holding costs or work expenditure requirements for the crown grants other than roughly C$300 per year in property taxes.
The mineral claims are subject to minimum work requirements of:
■
C$5 per hectare for anniversary years 1 and 2;
■
C$10 per hectare for anniversary years 3 and 4;
■
C$15 per hectare for anniversary years 5 and 6; and
■
C$20 per hectare for subsequent anniversary years.
Expenditures in 2019, on the mineral claims shown in Table 4-1, amounted to C$860,000.
Effective Date: May 29, 2020 Project No. TRQ-06 | |
|
Page 4-2
NI43-101F1 Technical Report
Homestake Mineral Claims
| Title Number | Claim Name | Owner Name | Client # | Issue Date | Good to Date | Area (ha) | Protected | Tenure Sub Type Description | Title Type Description | Title Type Code | Tenure Type Code |
| 950714 | BRAVO N1 | HOMESTAKE RESOURCE CORPORATION | 202433 | February 19, 2012 | June 13, 2029 | 327.49 | N | CLAIM | Mineral Cell Title Submission | MCX | M |
| 950719 | BRAVO N2 | HOMESTAKE RESOURCE CORPORATION | 202433 | February 19, 2012 | June 13, 2029 | 436.51 | N | CLAIM | Mineral Cell Title Submission | MCX | M |
| 950722 | BRAVO N3 | HOMESTAKE RESOURCE CORPORATION | 202433 | February 19, 2012 | June 13, 2029 | 436.50 | N | CLAIM | Mineral Cell Title Submission | MCX | M |
| 950724 | BRAVO N4 | HOMESTAKE RESOURCE CORPORATION | 202433 | February 19, 2012 | June 13, 2029 | 272.81 | N | CLAIM | Mineral Cell Title Submission | MCX | M |
| 950725 | BRAVO N5 | HOMESTAKE RESOURCE CORPORATION | 202433 | February 19, 2012 | June 13, 2029 | 381.82 | N | CLAIM | Mineral Cell Title Submission | MCX | M |
| 950726 | BRAVO N6 | HOMESTAKE RESOURCE CORPORATION | 202433 | February 19, 2012 | June 13, 2029 | 418.04 | N | CLAIM | Mineral Cell Title Submission | MCX | M |
| 950727 | BRAVO N7 | HOMESTAKE RESOURCE CORPORATION | 202433 | February 19, 2012 | June 13, 2029 | 417.96 | N | CLAIM | Mineral Cell Title Submission | MCX | M |
| 1011645 | KN HSR 1 | HOMESTAKE RESOURCE CORPORATION | 202433 | August 1, 2012 | March 9, 2023 | 273.86 | N | CLAIM | Mineral Cell Title Submission | MCX | M |
| 1061421 | NR | HOMESTAKE RESOURCE CORPORATION | 202433 | August 25, 2006 | August 30, 2029 | 18.20 | N | CLAIM | Mineral Cell Title Submission | MCX | M |
| 251427 | CAMBRIA 1 | HOMESTAKE RESOURCE CORPORATION | 202433 | May 6, 1986 | December 17, 2029 | 100.00 | N | CLAIM | Four Post Claim | MC4 | M |
| 251428 | CAMBRIA 2 | HOMESTAKE RESOURCE CORPORATION | 202433 | May 6, 1986 | December 17, 2029 | 75.00 | N | CLAIM | Four Post Claim | MC4 | M |
| 377241 | WK 1 | HOMESTAKE RESOURCE CORPORATION | 202433 | May 23, 2000 | December 17, 2029 | 250.00 | N | CLAIM | Four Post Claim | MC4 | M |
| 377242 | WK 2 | HOMESTAKE RESOURCE CORPORATION | 202433 | May 23, 2000 | December 17, 2029 | 500.00 | N | CLAIM | Four Post Claim | MC4 | M |
| 377243 | WK 3 | HOMESTAKE RESOURCE CORPORATION | 202433 | May 23, 2000 | December 17, 2029 | 400.00 | N | CLAIM | Four Post Claim | MC4 | M |
| 380949 | WK 4 | HOMESTAKE RESOURCE CORPORATION | 202433 | September 20, 2000 | December 17, 2029 | 450.00 | N | CLAIM | Four Post Claim | MC4 | M |
| 380950 | WK 5 | HOMESTAKE RESOURCE CORPORATION | 202433 | September 20, 2000 | December 17, 2029 | 450.00 | N | CLAIM | Four Post Claim | MC4 | M |
| 380951 | KW 1 | HOMESTAKE RESOURCE CORPORATION | 202433 | September 20, 2000 | December 17, 2029 | 25.00 | N | CLAIM | Two Post Claim | MC2 | M |
| 380952 | KW 2 | HOMESTAKE RESOURCE CORPORATION | 202433 | September 20, 2000 | December 17, 2029 | 25.00 | N | CLAIM | Two Post Claim | MC2 | M |
| 380953 | KW 3 | HOMESTAKE RESOURCE CORPORATION | 202433 | September 20, 2000 | December 17, 2029 | 25.00 | N | CLAIM | Two Post Claim | MC2 | M |
| 383016 | KW 5 | HOMESTAKE RESOURCE CORPORATION | 202433 | November 28, 2000 | December 17, 2029 | 25.00 | N | CLAIM | Two Post Claim | MC2 | M |
| 383017 | KW4 | HOMESTAKE RESOURCE CORPORATION | 202433 | November 28, 2000 | December 17, 2029 | 25.00 | N | CLAIM | Two Post Claim | MC2 | M |
| 383037 | WK 6 | HOMESTAKE RESOURCE CORPORATION | 202433 | November 28, 2000 | December 17, 2029 | 150.00 | N | CLAIM | Four Post Claim | MC4 | M |
| 383038 | WK 7 | HOMESTAKE RESOURCE CORPORATION | 202433 | November 28, 2000 | December 17, 2029 | 400.00 | N | CLAIM | Four Post Claim | MC4 | M |
| 537435 | HR | HOMESTAKE RESOURCE CORPORATION | 202433 | July 20, 2006 | December 17, 2029 | 127.45 | N | CLAIM | Mineral Cell Title Submission | MCX | M |
| 537436 | HRMARGIN 1 | HOMESTAKE RESOURCE CORPORATION | 202433 | July 20, 2006 | December 17, 2029 | 109.25 | N | CLAIM | Mineral Cell Title Submission | MCX | M |
| 537437 | HRMARGIN2 | HOMESTAKE RESOURCE CORPORATION | 202433 | July 20, 2006 | December 17, 2029 | 54.60 | N | CLAIM | Mineral Cell Title Submission | MCX | M |
| 538791 | HOMESTAKE RIDGE 1 | HOMESTAKE RESOURCE CORPORATION | 202433 | August 5, 2006 | December 17, 2029 | 18.21 | N | CLAIM | Mineral Cell Title Submission | MCX | M |
| 540533 | HOMESTAKE RIDGE 2 | HOMESTAKE RESOURCE CORPORATION | 202433 | September 6, 2006 | December 17, 2029 | 18.20 | N | CLAIM | Mineral Cell Title Submission | MCX | M |
| 540540 | HOMESTAKE RIDGE 3 | HOMESTAKE RESOURCE CORPORATION | 202433 | September 6, 2006 | December 17, 2029 | 18.21 | N | CLAIM | Mineral Cell Title Submission | MCX | M |
| 545945 | HOMESTAKE RIDGE 4 | HOMESTAKE RESOURCE CORPORATION | 202433 | November 27, 2006 | December 17, 2029 | 18.20 | N | CLAIM | Mineral Cell Title Submission | MCX | M |
| 565708 | HOMESTAKE RIDGE 5 | HOMESTAKE RESOURCE CORPORATION | 202433 | September 7, 2007 | December 17, 2029 | 36.42 | N | CLAIM | Mineral Cell Title Submission | MCX | M |
| 565709 | HOMESTAKE RIDGE 6 | HOMESTAKE RESOURCE CORPORATION | 202433 | September 7, 2007 | December 17, 2029 | 18.21 | N | CLAIM | Mineral Cell Title Submission | MCX | M |
| 565710 | HOME STAKE 7 | HOMESTAKE RESOURCE CORPORATION | 202433 | September 7, 2007 | December 17, 2029 | 18.20 | N | CLAIM | Mineral Cell Title Submission | MCX | M |
| 598667 | VANGUARD GOLD | HOMESTAKE RESOURCE CORPORATION | 202433 | February 3, 2009 | December 17, 2029 | 18.21 | N | CLAIM | Mineral Cell Title Submission | MCX | M |
| 598668 | VANGUARD EXTENSION | HOMESTAKE RESOURCE CORPORATION | 202433 | February 3, 2009 | December 17, 2029 | 54.66 | N | CLAIM | Mineral Cell Title Submission | MCX | M |
| 1015450 | KINSKUCH NW2 | HOMESTAKE RESOURCE CORPORATION | 202433 | December 22, 2012 | December 17, 2029 | 1039.18 | N | CLAIM | Mineral Cell Title Submission | MCX | M |
| 1015588 | HS SOUTH 1 | HOMESTAKE RESOURCE CORPORATION | 202433 | December 31, 2012 | December 17, 2029 | 36.44 | N | CLAIM | Mineral Cell Title Submission | MCX | M |
| | | Number of Claims: | 37 | | Total Area (ha): | 7468.64 | | | | | |
Source: Auryn, 2019
Effective Date: May 29, 2020 Project No. TRQ-06 | |
|
Page 4-3
NI43-101F1 Technical Report
Crown Grants
| District Lot | Claim Name | CTGVRNNGPR | PRCLTP | SRVRGNRLPL | STTFPRCLSR | Area (ha) | CRWNGRNTNO | Mining Division | Lot Status |
| 3975 | HOMESTAKE | Mineral Tenure Act | Primary | 37TR7 CASSIAR | Active | 20.902 | 4004/511 | SKEENA | CROWN GRANTED |
| 3978 | HOMESTAKE NO. 3 | Mineral Tenure Act | Primary | 37TR7 CASSIAR | Active | 13.962 | 4007/311 | SKEENA | CROWN GRANTED |
| 3977 | HOMESTAKE NO. 2 | Mineral Tenure Act | Primary | 37TR7 CASSIAR | Active | 15.042 | 4006/511 | SKEENA | CROWN GRANTED |
| 3976 | HOMESTAKE NO. 1 | Mineral Tenure Act | Primary | 37TR7 CASSIAR | Active | 20.283 | 4005/511 | SKEENA | CROWN GRANTED |
| 3980 | HOMESTAKE NO. 1 FRACTION | Mineral Tenure Act | Primary | 37TR7 CASSIAR | Active | 4.702 | 5622/527 | SKEENA | CROWN GRANTED |
| 3979 | HOMESTAKE FRACTION | Mineral Tenure Act | Primary | 37TR7 CASSIAR | Active | 0.919 | 5621/527 | SKEENA | CROWN GRANTED |
| 6322 | MILLSITE | Land Act | Primary | 1TR8 CASSIAR | Active | 20.902 | 8826/859 | SKEENA | CROWN GRANTED |
| | | Total Crown Grant: | 7 | | Total Area (ha): | 96.712 | | | |
Source: Auryn, 2019
Effective Date: May 29, 2020 Project No. TRQ-06 | |
|
Page 4-4
Homestake Ridge Project
NI43-101F1 Technical Report
Source: Auryn
Figure 4.2: Mineral Claims
Effective Date: May 29, 2020 Project No. TRQ-06 | |
|
Page 4-5
Homestake Ridge Project
NI43-101F1 Technical Report
4.4
Royalties and Encumbrances
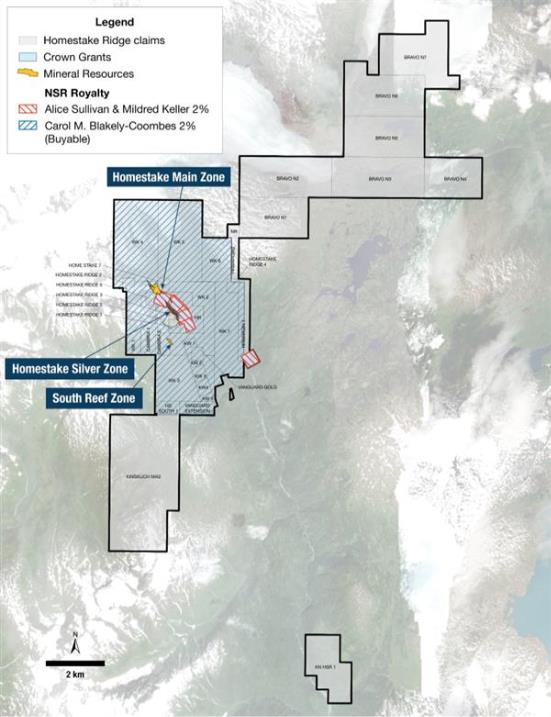
Homestake earned a 100 percent interest in 14 Homestake Ridge mineral claims through its option with Teck Cominco Limited, now Teck Resources (Teck). Teck failed to exercise its back-in rights in 2008 but retained a 2 percent net smelter return (NSR) royalty, 1 percent of which could be purchased at a future date for C$1.0 million. On May 16, 2016 Homestake announced that it had closed an agreement with Teck to purchase the 2 percent royalty and ancillary rights for C$100,000, effectively extinguishing this royalty.
The Coombes Claims (including Cambria 1, Cambria 2, KW1, KW2, KW3, KW4, KW5, WK1, WK3, WK4, WK6 and WK7) are subject to a 2 percent NSR royalty by virtue of an option agreement dated July 5, 2000. The royalty includes a purchase right in favour of Homestake for C$1,000,000.
The crown grants (including DL 3975, DL 3976, DL 3977, DL 3978, DL 3979, DL 3980, and DL 6322) are subject to a 2 percent NSR royalty which includes an annual advanced minimum royalty of C$50,000 in favour of Alice Sullivan and Mildred Keller.
A map of the claims subject to royalty is attached in Figure 4.3.
The authors are not aware of any other underlying agreements, obligations or back-in rights related to the Property other than those disclosed herein.
4.6
Permitting Considerations
Auryn Resources currently holds a Mineral and Coal Activities and Reclamation Permit (Permit No. MX-1-603) that includes the following approved work:
■
Camp with 1.0 ha of disturbance
■
Geophysical surveys of 50 line km
■
Surface drilling at 500 drill sites
■
2 km of exploration trails.
The above permit is secured with a C$68,000 reclamation bond and all work must be complete by March 23, 2023.
The Company has also been granted a Free Use Permit (No. MX-1-603:2018-2023) for the harvesting of Crown timber on the Crown granted lands.
Effective Date: May 29, 2020 Project No. TRQ-06 | |
|
Page 4-6
Homestake Ridge Project
NI43-101F1 Technical Report
Source: Auryn
Figure 4.3: Claims Subject to Royalty
Effective Date: May 29, 2020 Project No. TRQ-06 | |
|
Page 4-7
Homestake Ridge Project
NI43-101F1 Technical Report
4.7
Environmental Considerations
The Homestake Ridge Property is a greenfield site with no known pre-existing development or environmental liabilities.
4.8
Social License Considerations
Auryn does not have any Community or Social Agreements in place.
4.9
Comments on Section 4
The authors are not aware of any significant factors or risks that may affect access to the project site, or the right and ability to perform work on the property.
Effective Date: May 29, 2020 Project No. TRQ-06 | |
|
Page 4-8
Homestake Ridge Project
NI43-101F1 Technical Report
5.
ACCESSIBILITY, CLIMATE, LOCAL RESOURCES,INFRASTRUCTURE, AND PHYSIOGRAPHY
The Homestake Ridge Project is located 32 km southeast of Stewart, BC, at the southern extent of the Cambria ice field. Access to the Project from the town of Kitsault is by boat/barge to the community of Alice Arm. From there, an upgraded tractor trail follows an old railway bed for a distance of 32 km into the area of the past producing Dolly Varden silver mine, approximately four kilometres from the southern boundary of the Project. From there, overgrown mule trails lead to the historic workings of the Vanguard and Homestake areas of the Project (Figure 5.1).
In the absence of upgraded road access, the site is only accessible by helicopter as shown in Figure 5.1. Helicopters are available for charter from either Prince Rupert, Terrace, or Stewart.
Climate in the area is transitional, with moderately wet to dry, warm summers, and cool, wet winters (Ministry of Forests, 1993) driven by moist Pacific air that brings intense precipitation to the windward slopes and adjacent mountains, and by the cold Arctic air to pass down the Portland Canal through onto the Dixon Entrance (Demarchi, 2011). The area is classified as Oceanic or Marine West Coast and is characterized by moderately cool summers and mild winters with a narrower annual range of temperatures compared to sites of similar latitude. Climate data derived from historic monitoring stations at Alice Arm, and more recent long-ranging monitoring at Stewart and Nass Camp Table 5-1) indicates that temperatures range from an average low of - 6°C in January to an average high of 15°C in July. The mean temperature for the year is 5°C.
The area receives between 984 – 1,838 mm of precipitation each year (expressed in mm of water Table 5-1). Rainfall peaks in October with 150 mm. Snowfall is highest in December and January when accumulations are 287 cm and 86 cm, respectively, at Nass Camp (Government of Canada, 2019). Precipitation and heavy fog often impact on airborne access to the Project (RPA, 2017).
The property is reported to be covered in snow from late September to late June (Bryson, 2007). The ground is generally frozen throughout the winter and breakup occurs between early March and late May (Ministry of Forests, 1993). Rainfall / snowfall distribution ranges from 45 – 55 percent (Knight Piesold, 2011).
Effective Date: May 29, 2020 Project No. TRQ-06 | |
|
Page 5-1
Homestake Ridge Project
NI43-101F1 Technical Report
Source: MineFill Services, Inc.
Effective Date: May 29, 2020 Project No. TRQ-06 | |
|
Page 5-2
Homestake Ridge Project
NI43-101F1 Technical Report
Climatic Data
| | Alice Arm | Stewart | Nass Camp |
| Meteorological Location ID | 1060330 & 1060331 | 1067742 | 1075384 |
| Latitude | 55°28'00" N | 55°56'10" N | 55°14'15" N |
| Longitude | 129°28'00" W | 129°59'06" W | 129°01'47" W |
| Elevation | 1.50 m | 7.3 | 191 |
| Distance from Project | 31 km | 34 km | 65.5 |
| Period of Record | 1948-1964 & 1973-1978 | 1974-2016 | 1971-2017 |
| Mean January Temperature | -5.7 | -3.0 | -5.4 |
| Mean July Temperature | 14.5 | 15.1 | 15.8 |
| Extreme Maximum Temperature | 33.9 | 33.4 | 36.0 |
| Extreme Minimum Temperature | -25.0 | -25.6 | -32.5 |
| Average Annual Precipitation | 1792.0 | 1837.8 | 984.2 |
| Average Annual Rainfall | 1192.3 | 1317.3 | 725.1 |
| Average Annual Snowfall | 530.6 | 548.5 | 259.2 |
5.3
Local Resources and Infrastructure
The nearest communities to the Homestake project site include the towns of Kitsault and Alice Arm, roughly 35 km distant. Both of these towns are essentially ghost towns with few residents and no services.
Labour and supplies for the project can be brought in from the community of Terrace, which lies 185 km to the south, along Highway 113. Terrace has a population of 11,643 (2016 census) and hosts a wide range of supplies, services, and trained labour. Terrace is serviced by three air carriers with daily scheduled flights.
Stewart with a population of 400 (2016 census) is located 240 km, by road, from Kitsault. Stewart is well serviced, has trained labour with mining expertise, and hosts a deep-sea port that has been used for shipping ore and concentrate from other mines. Concentrates and bulk supplies, such fuel, could be barged between Alice Arm and Stewart, an ocean distance of some 225 km.
Kitwanga, 180 km by road from Kitsault, lies on the Canadian National Railway mainline and Trans-Canada Highway 16. Like Stewart, Kitwanga has served as a shipping centre for mineral ores and concentrates. Mining is supported in the local communities and, historically, companies have been able to form productive joint venture partnerships with local First Nations.
Effective Date: May 29, 2020 Project No. TRQ-06 | |
|
Page 5-3
Homestake Ridge Project
NI43-101F1 Technical Report
The project area is situated in steep terrain on the geologic boundary between the Coastal Belt and the Intermontane Belt, within an elevation range of 500 to 1100 masl (Knight Piesold, 2011). The project area lies at the transition from the Southern Boundary Ranges to the Meziadin Mountains ecosections (iMapBC, 2020). The Southern Boundary Ranges ecosection is an area of wet rugged mountains that are capped with glaciers, small icefields and exposed granitic and metamorphic bedrock. This area was heavily impacted by large sheets of ice that originated along the crest of the mountains and the area south of the Homestake Ridge Project is bisected by the Portland Canal (Demarchi, 2011). The Meziadin Mountains comprise the leeward side of the main Boundary Ranges and extend west of the low Nass Basin. Ice that formed in the Boundary Ranges moved east into the Nass Basin, coalescing with ice moving south from the adjacent Skeena Mountains, then the entire ice mass moved down out the Nass Valley to the Dixon Entrance or south through Cranberry Upland Ecosection to the Skeena River valley. The mountain summits still have small icefields or glaciers (Demarchi, 2011).
The area is characterized by steep headwater streams and gullies that drain the mountainsides, carrying water, sediment and organic materials to the fans and floodplains that line valley bottoms. Lakes head some valleys. Small wetlands are common on floodplains, but extensive wetlands are uncommon (Price and McLennan, 2001).
The Project overlays a south-southeast trending ridge at the headwaters of the Kitsault River and the lower portions of the Kitsault and Little Kitsault Glaciers. The eastern and southern portions of the property at lower elevations is subalpine forest, comprised of subalpine fir, western hemlock, Roche spruce, and mountain hemlock. East of this ridge, the subalpine forest is broken up by a large slide area that is covered by slide alder, grass, and lichen. Alpine areas are extensive at higher elevations, but are mainly barren rock or ice covered. Many large remnant icefields and glaciers remain on the summits north-west of the project area (Demarchi, 2011). The upper slopes are populated by alpine grass, moss, and lichen with intermittent patches of dwarf alpine spruce (Knight and Macdonald, 2010).
Regionally, the vegetation in the area is driven by the transitional nature of the climate on the leeward side of the Coast Mountains, and consequently combines elements of both coastal and interior flora (BC Ministry of Forests, 1993). In the valley bottoms, in the subalpine area, the understory vegetation includes a wide variety of shrub and herbaceous species, including salmonberry, bunchberry, various currants, five-leaf bramble, common snowberry, vine maple, sword fern, twinflower, deer fern, western trillium and others (Wright and Ebnet, nd). In the lower slopes of Portland Canal, the forests are either very wet, such as coastal western hemlock or, cold and wet, such as the subalpine mountain hemlock forests that occur on all the middle elevation slopes (Demarchi, 2011).
Effective Date: May 29, 2020 Project No. TRQ-06 | |
|
Page5-4
Homestake Ridge Project
NI43-101F1 Technical Report
There are no federally or provincially identified plant species at risk in the project area (BC Conservation Data Centre, 2020). The nearest observed plant species at risk is Polystichum setigerum (Alaska holly fern), observed in 1975 in lower Kitsault River approximately 2.5 km upstream from Alice Arm, classified as being of “special concern” (BC Conservation Data Centre, 2020).
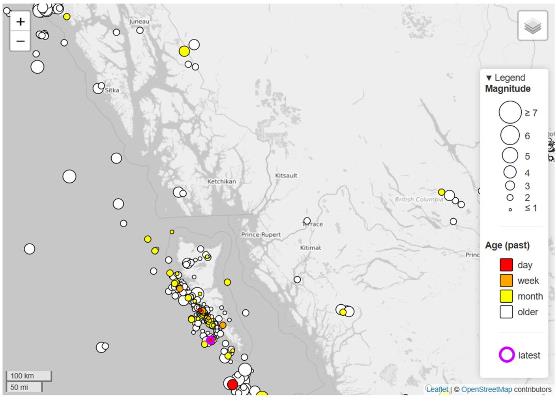
The town of Stewart is located in a zone of low to moderate seismicity with a peak ground acceleration of 0.031g for events with a 10 percent exceedance in 50 years (e.g. one in 1000-year event). As can be seen in Figure 5.2 earthquake frequency map, the main source of seismic risk is from the Cascadia subduction zone, located 200 km from the Project site, off the coast of British Columbia.
Source: Natural Resources Canada
Figure 5.2: Earthquake Epicenter Map for Events in the Past 50 Years
Effective Date: May 29, 2020 Project No. TRQ-06 | |
|
Page 5-5
Homestake Ridge Project
NI43-101F1 Technical Report
5.6
Comments on Section 5
The Homestake Ridge Project is a remote greenfields site with no existing roads, power, water or camp infrastructure. Development of the project will require:
■
Upgrading and extending the current access road to allow the movement of freight, consumable supplies and manpower
■
Installing local hydro or diesel power, or connecting to the nearby BC Hydro grid
■
Construction of a person-camp to allow drive-in, drive-out (DIDO) manpower rosters
■
Development of local water resources for potable and non-potable water consumption.
In the opinion of the Qualified Persons, the Homestake Ridge Project site offers adequate surface rights and land suitable for the construction of a processing plant, tailings facility, waste rock dumps, and a person-camp. The project site has several suitable sources of water pending the necessary approvals.
The required infrastructure for project development is discussed in Section 18 of this Technical Report, and the capital required is included in the Financial models.
Winter conditions are expected to prevail from October through to the following May, and this may impair year-round operations if the property were to be placed in production.
Effective Date: May 29, 2020 Project No. TRQ-06 | |
|
Page 5-6
The following Property History is taken from RPA (2017).
Claims were first staked at the Homestake group between 1914 and 1917 and, in 1918, the claims were bonded to the Mineral Claims Development Company (MCDC). MCDC was reorganized into the Homestake Mining and Development Company (Homestake Development) in 1921.
The following is taken from Macdonald and Rennie (2016).
The Homestake Ridge property comprises two areas of historic exploration. The Homestake and the Vanguard groups have been tested by past explorers starting in the early 1900s after the discoveries at Anyox and in the Stewart region. Claims were first staked at the Homestake group between 1914 and 1917 and, in 1918, the claims were bonded to the MCDC. MCDC was reorganized into Homestake Development in 1921. Limited surface and underground work was done on the property. In 1925, the claims were given “Crown Grant” status. In 1926,
Homestake Development and three other groups bonded to the interests of C. Spencer. The option was abandoned, with no further work being done on the property (Knight and Macdonald, 2010).Arm staked the area and conducted surface trenching, limited underground work and drilled seven holes to an aggregate depth of 58.2 m, on the Lucky Strike and Cascade claims which comprise part of the Homestake group (Knight and Macdonald, 2010).
In 1966, Canex Aerial Exploration Ltd. (Canex) undertook a program of prospecting, geochemical sampling, electromagnetic (EM) surveying, and chip sampling in the Vanguard area. In 1967, Amax Exploration conducted and extended examination of the Vanguard group but did not return (Folk and Makepeace, 2007). Dwight Collison died in 1979.
In 1979, Newmont Exploration of Canada Ltd. (Newmont) optioned part the property, known as the Wilberforce group, from Collison’s widow, Ruby Collison. The Wilberforce group excluded the original Homestake and Vanguard claims. Newmont explored for near surface, massive sulphides conducting magnetometer and Max-Min geophysical surveys, geological mapping, and trenching. A total of 595 soil samples and 82 rock samples were assayed.
Newmont terminated the option in late 1980 (Folk and Makepeace, 2007).
Effective Date: May 29, 2020 Project No. TRQ-06 | |
|
Page 6-1
Caulfield Resources Ltd. explored over the Vanguard group in 1981 taking 102 soil samples and conducting 5.25 line km of ground magnetic surveys, but no subsequent work was done (Folk and Makepeace, 2007).
Homeridge Resources Ltd. optioned the property from Ruby Collison in 1984, but no work was done (Bryson, 2007). The claims were allowed to lapse in 1986, were re-staked and optioned to Cambria Resources Ltd. (Cambria), which completed geological mapping, lithogeochemical sampling, trenching, and 4.3 line km of IP and resistivity surveying. Weather deferred drilling for that year and the ground was eventually optioned to Noranda Exploration Company Limited (Noranda) (Folk and Makepeace, 2007).
Between 1989 and 1991, Noranda consolidated ground by optioning more area including the Cambria (formerly Collison), Homestake, and Vanguard claims. A 44.3 km grid was cut along which magnetometer and IP surveys were performed in addition to geological mapping. A total of 1,930 rock samples and 1,943 silt and soil samples were taken. Twelve diamond drill holes were cored (diameter unknown) for an aggregate depth of 1,450.05 m (Folk and Makepeace, 2007).
Teck acquired the current Homestake Ridge property in 2000 via option agreements and staking. From 2000 to 2002, Teck conducted geochemical and geological surveys, trenching, and diamond drilling, exploring for volcanogenic massive sulphide (VMS) deposits. A total of 21 NQ (47.6 mm dia.) holes were drilled to an aggregate depth of 4,374.6 m yielding 618 core samples. In addition, 778 rock samples were analyzed by Inductively Coupled Plasma (ICP) multi-element geochemistry plus Au and another 31 samples were subjected to “whole rock” X-Ray Fluorescence (XRF) analysis (Folk and Makepeace, 2007).
From 2010 to 2012, Homestake completed additional surface exploration including further mapping, soil and rock sampling and 13.54 line km of IP geophysical surveys, and diamond drilling.
In 2011 a new discovery was made 800 m to the southwest of, and parallel to, the previously discovered Main Homestake and Homestake Silver deposits. This area, known as the South Reef target was tested by three holes with all three intersecting +30 g/t gold mineralization.
During 2012, Homestake completed two phases of drilling focussed on the delineation and extension of the South Reef target. The second phase of drilling was funded by Agnico Eagle Mines Limited (Agnico Eagle) as part of an option agreement (see below). The 2012 drilling was successful in identifying an approximate 250 m strike by 250 m down dip before ending in, or being offset by, a major fault structure. Mineralization is open along strike to the northwest. Other targets on the property remain to be explored.
Effective Date: May 29, 2020 Project No. TRQ-06 | |
|
Page 6-2
Agnico Eagle optioned the property from Homestake in 2012. In 2013, Agnico Eagle completed an exploration program consisting of geological mapping, soil sampling (785 samples), approximately 21 line km of ground geophysical surveying including IP/resistivity and magnetics and a 10-hole drilling program totalling 3,947.24 m. The drilling was meant to test various exploration targets outside of the Homestake Main and Homestake Silver deposits (Swanton et al., 2013). In 2014, Agnico Eagle completed a limited amount of prospecting, reconnaissance geological mapping and rock sampling (57 samples) as well as a 6-hole drilling program totalling 2,578 m designed to test the Slide Zone. The drilling suggested that the Slide Zone is concordant with the Homestake Main and Homestake Silver Zones and trends north northwesterly and dips steeply to the northeast.
There has been no historic production at the Homestake Ridge property.
Effective Date: May 29, 2020 Project No. TRQ-06 | |
|
Page 6-3
7.
GEOLOGICAL SETTING AND MINERALIZATION
Section 7 of this report is taken from Macdonald and Rennie (2016).
Four major building blocks constitute the terrane superstructure of northwestern British Columbia (Colpron and Nelson (2011): a western block of poly-deformed, metamorphosed Proterozoic to middle Paleozoic peri-continental rocks (Nisling Assemblage); an eastern block of exotic oceanic crustal and low-latitude marine strata (Cache Creek Terrane); central blocks including Paleozoic Stikine Assemblage and Triassic arcvolcanic and flanking sedimentary rocks of Stikine Terrane; and overlying Late Triassic to Middle Jurassic arc-derived strata of the Whitehorse Trough (including the Inklin overlap assemblage).
The following description of the Regional Geology is derived from Kasper and Metcalfe (2004), Knight and Macdonald (2010).
The Homestake Ridge property is located within a lobe of Upper Triassic to Middle Jurassic strata exposed along the western edge of the Bowser Basin within the Stikinia Terrane of the Intermontane Belt. Stikinia formed in the Pacific Ocean during Carboniferous to Early Jurassic (320 Ma to 190 Ma) and collided with North America during the Middle Jurassic (Folk and Makepeace, 2007).
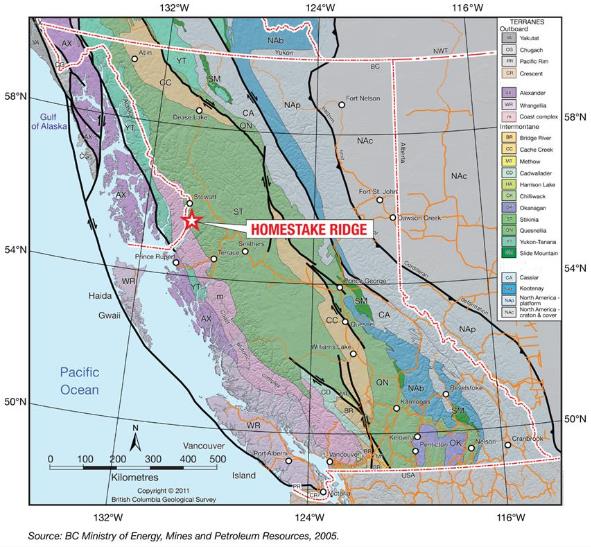
The Project occurs within the metallogenic region known as the Stewart Complex (Grove 1986, Aldrick, 1993). Described as the contact of the eastern Coast Plutonic Complex with the west-central margin of the successor Bowser Basin, the Stewart Complex ranges from Middle Triassic to Quaternary in age and is comprised of sedimentary, volcanic, and metamorphic rocks (Grove, 1986). The Stewart Complex is one of the largest volcanic arc terranes in the Canadian Cordilleran. It forms a northwest-trending belt extending from the Iskut River in the north and Alice Arm in the south. The Coast Plutonic Complex forms the western boundary of the prospective stratigraphy; continental derived sediments of the Bowser Lake Group form the eastern border. The Stewart Complex is host to more than 200 mineral occurrences including the historic gold mines Eskay Creek, Silbak-Premier and SNIP, as well as the Granduc, Anyox, and Dolly Varden-Torbrit base-metal and silver mines. The dominant mineral occurrences are precious metal vein type, with related skarn, porphyry, and massive sulphide occurrences (Knight and Macdonald, 2010).
Effective Date: May 29, 2020 Project No. TRQ-06 | |
|
Page 7-1
Stikinia, which contains both the Stewart Complex and the Homestake Ridge property, is comprised of at least four Paleozoic to Cenozoic tectonostratigraphic packages (Kasper and Metcalfe, 2004) including: Paleozoic Stikine Assemblage consisting of quartz-rich rocks, carbonate slope deposits, and minor mafic to felsic volcanic rocks; Early Mesozoic volcanic and inter-arc and back-arc basin sedimentary rocks; Middle to Upper Jurassic Bowser Basin turbiditic sedimentary rocks; and Tertiary post-kinematic granitoid intrusions of the Coast Plutonic Complex.
Magmatic episodes of Stikinia alternated with the development of sedimentary basins. These basins formed during the Late Triassic to Early Jurassic, the Toarcian to Bajocian (183 to 168 Ma) and the Bathonian to Oxfordian (168 Ma to157 Ma) ages. The basin which formed during the Toarcian-Bajocian is of considerable importance because this west-facing, north-trending back arc basin contains the Eskay Creek “contact zone” rocks (Hazelton Group), which are overlain by Middle and Upper Jurassic marine basin sediments (Bowser Lake Group).
At least two periods of deformation occurred in the region, a contractional deformation during the post-Norian-pre-Hettangian (204 Ma to 197 Ma) and an Early Jurassic hiatus. These periods of deformation are represented by unconformities one of which also separates two metalliferous events that took place in the Early Jurassic (e.g., Silbak-Premier and SNIP) and Middle Jurassic (e.g., Eskay Creek). Regional geology is shown in Figure 7.1.
Effective Date: May 29, 2020 Project No. TRQ-06 | |
|
Page 7-2
Figure 7.1: Regional Geology
Effective Date: May 29, 2020 Project No. TRQ-06 | |
|
Page 7-3
This section is derived from Kasper and Metcalfe (2004) and Knight and Macdonald (2010).
The Stuhini Group rocks are found in the cores of anticlines and represent the oldest known rocks in the area. These rocks are composed of a thick sequence of volcanic and sedimentary rocks of Upper Triassic (Norian) age, interpreted as the products of a volcanic arc. The volcanic Stuhini Group rocks are generally pyroxene-bearing, a contrast to the well-defined early crystallized hornblende phenocrysts commonly found in the Lower Jurassic Hazelton Group volcanic rocks. Kasper and Metcalfe noted that the re-evaluation of bedrock mapping in the Homestake Ridge area in 2002 resulted in the assignation of some lithologies on the property to the Stuhini Group.
The Hazelton Group overlies the Stuhini Group. The Lower Jurassic Hazelton Group is represented by a lower unit comprising massive, hornblende+feldspar-phyric andesitic to latitic ignimbrites, flows, and associated volcanic sedimentary rocks. Overlying these intermediate volcanic rocks is the Lower-Middle Jurassic Eskay Creek stratigraphy composed of marine felsic volcanic rocks and associated epiclastic sedimentary rocks and fossiliferous clastic sedimentary rocks. Kasper and Metcalfe noted that rocks of similar lithology and stratigraphic relationship have been identified in the Homestake Ridge area.
The dominant local intrusive rocks are of Cretaceous to Eocene age associated with the Coast Plutonic Complex. However, intrusive rocks identified in the Homestake Ridge area are hornblende+feldspar phyric and resemble Early Jurassic Texas Creek Suite rocks, which are related to important mineralization elsewhere in the Stewart Complex.
Important local deposits include the Dolly Varden-Torbrit Silver camp located ten kilometres south of the Homestake Ridge property, which produced 19.9 million oz Ag and 11 million lb Pb, and various properties in the Stewart area such as Red Mountain, Granduc, Silbak- Premier, and Brucejack Lake. Some of the mineralization on the Homestake Ridge property is thought to be similar in age and genesis to the VMS deposit at Eskay Creek, located about 115 km to the north-northwest. Figure 7.2 illustrates the Local Geology.
Effective Date: May 29, 2020 Project No. TRQ-06 | |
|
Page 7-4
Source: BC Energy and Mines Petroleum Resources, 2005
Figure 7.2: Local Geology
Effective Date: May 29, 2020 Project No. TRQ-06 | |
|
Page 7-5
This section is derived from Kasper and Metcalfe (2004), Knight and Macdonald (2010), and the results of mapping on the property by Auryn over the last several years (Figure 7.3).
The Property covers the transition between the sedimentary and volcanic rocks of the Upper Triassic to Lower Jurassic Stuhini Group, a complex sequence of Lower to Middle Jurassic sedimentary, volcanic, and intrusive rocks of the Hazelton Group and sedimentary rocks of the Upper to Middle Jurassic Bowser Lake Group. The Hazelton Group rocks on the Homestake property mark a transition from a high-energy volcanic dominated lower stratigraphy through a hiatus and into a fining sequence of volcanic tuffs and sediments punctuated by bi-modal mafic and felsic volcanism and finally into fine clastic sedimentation of the Salmon River Formation (Upper Hazelton Stratigraphy) and the Bowser Lake Group (Evans and Lehtinen, 2001). This sequence hosts many sulphide occurrences and extensive areas of alteration on the property which are associated with the Lower to Middle Jurassic stratigraphy.
Interpretation of the geophysical data paired with field mapping define the boundaries and internal stratigraphy of 4 northwest-trending domains numbered from SW to NE.
Domain 1 comprises Triassic sedimentary and volcaniclastic Stuhini Group rocks, underlie the southwest portion of the property. Intruded and silicified by sills and dikes of rhyolite/porphyritic monzonite. Posses a low relative magnetic signature. A second unit of relatively low magnetic signature which occupies the footwall of the Vanguard fault and a second fault panel in Domain 1 are pervasively altered Early Jurassic andesitic volcanic and volcaniclastic Hazelton Group rocks (V2UN) these are intruded along strike by similar sills and plugs of hornblende monzonite.
Early Jurassic Hazelton Group Betty Creek andesite, dacite and Brucejack Lake member (192 Ma) rhyolite/monzonite, comprise Domain 2. The western margin of Domain 2 is overthrust by the Triassic/Jurassic package of Domain 1 and is unconformably overlain by Middle Jurassic Salmon River sediments northwest of the Vanquard showing.
Effective Date: May 29, 2020 Project No. TRQ-06 | |
|
Page 7-6
Source: Auryn
Figure 7.3: Property Geology
Effective Date: May 29, 2020 Project No. TRQ-06 | |
|
Page 7-7
Early to earliest Mid-Jurassic Hazelton Group volcanic and volcaniclastic rocks of Betty Creek and Salmon River Bruce Glacier member (~174 Ma) comprise the central Domain 3, a northwest-trending package of varied- and strong magnetic signatures which locally depict south trending fabrics related to south-plunging folds and faults and younger southeasterly trending thrusting. The Lower Hazelton rocks comprise fine-grained to feldspar-hornblende phyric volcanic and volcaniclastic rocks of andesite to latite/trachyte composition and may include some phases of hypabyssal monzonite. This lower stratigraphy of the Hazelton extends along the length of the Homestake Ridge from the Main Homestake to the Vanguard Copper showings and is the host rock and footwall sequences to the three known mineral deposits, the Main Homestake, Homestake Silver and South Reef zones, as well as numerous other showings. Porphyritic monzonite dykes and hypabyssal domes intrude the Stuhini sediments and are believed to be coeval with the Lower Hazelton volcanic rocks. Greig et al. (1994) has related the Lower Hazelton Group feldspar-hornblende porphyry volcanic package to the Goldslide Intrusions at Red Mountain.
Thin, locally discontinuous units of matrix supported, feldspar-phyric volcanic breccias and heterolithic debris flow with tuffaceous and mudstone to sandstone interbeds cap the lower volcanic stratigraphy and are in turn unconformably overlain by maroon to green andesitic and dacitic volcaniclastic rocks and tuffs which form much of the central part of the Homestake Ridge property. These polylithic andesitic and dacitic pyroclastic to epiclastic rocks contain discrete mafic flows, tuffaceous beds, and debris flows. This andesitic volcanic package has been equated to the Betty Creek Formation (Evans and Macdonald, 2003).
The southwestern bounding structure to domain 3 is a southwest-verging thrust fault that occupies the north side of the Homestake glacier with hornblende monzonite (I2F) either in the immediate hanging wall or footwall of the fault.
Middle Jurassic Salmon River/Quock Formation and overlying Bowser Lake Group sedimentary rocks comprise Domain 4, covering the northeastern portion of the Property. Pyritic horizons within the Salmon River Formation define strong chargeability anomalies which parallel stratigraphy. These fine grained carbonaceous and sulphidic horizons are economic targets and are prone to localize slip and shear zones. North-northwest and northeast- trending dikes crosscut the Bowser Lake sediments.
The Salmon River sediments form a band of rock which unconformably overlie the volcanic flows and conglomerates of the underlying stratigraphy from the toe of the Kitsault Glacier southeast along the margins of Homestake Creek on the eastern side of the property. A tongue of these sediments infills a basin which formed to the southeast of the Homestake Silver Deposit. The fining-up nature of this unit reflects the general fining up nature of the Salmon River Formation as it progresses into the Bowser basin, and reflects the development of a large-scale basin at the end of Hazelton volcanism (Evans and Lehtinen, 2001).
Effective Date: May 29, 2020 Project No. TRQ-06 | |
|
Page 7-8
In the northern part of the property at the headwaters of Homestake Creek, rhyolitic volcanic rocks occur at the base of the Salmon River sediments. Greig et al. (1994) mapped this unit and suggested a correlation with the Mount Dilworth Formation of the Eskay Creek area. The rhyolites are light to dark grey, massive and vary from aphanitic to fine grained feldspar porphyritic banded flows to tuffs and breccias. Pyrite is ubiquitous throughout, occurring either as fine dissemination or infilling fractures and joints. A series of Mafic Dykes with chilled margins and an elevated Niobium signature were encountered intruding the Hazelton Group Rocks in the Homestake Silver Zone. Similar dykes have been mapped at surface intruding the Lower Hazelton Stratigraphy. These dykes are of unknown age.
The eastern part of the property is dominated by grey, interbedded siltstones and sandstones thought to be part of the Middle to Upper Jurassic Bowser Basin Group which conformably overlie the thin bedded graphitic argillites of the Salmon River formation.
Structure on the property largely reflects NE-SW compression that has continued from the Jurassic to present day (Folk and Makepeace, 2007), recent drilling and mapping suggest that the local stratigraphy has undergone several deformation events including uplift and local extension of the Stuhini and lower Hazelton stratigraphy resulting in a marked unconformity between the lower and upper Hazelton rocks.
In general, the structural development is reflected by the magnetic signature of strata in Domain 3 (andesites, +/- pyroxene basalts, rhyolite, dacite). The NW-SE fabric (lithology/folds) results from primarily north-trending folding and thrusting. This fabric is crosscut by North and North-east striking faults and dykes.
These compressional tectonics have resulted in an antiformal (or horsted) block of Triassic and lower Jurassic stratigraphy in the western side of the property and a synformal (graben like) block of middle to upper Jurassic rocks on the eastern side of the property. In the southeastern part of the property, these two regimes are separated by a northwest-striking, westerly dipping structure known as the Vanguard fault. The Vanguard fault is a northwest-trending, ~60o southwest dipping northeast verging structure characterized by up to 50 m of variably sheared QSP altered rock.
Uplift and local extension of the lower stratigraphy may have occurred during the same Early Jurassic compressional event. The earliest period of movement along the Vanguard fault may have occurred at this time.
Effective Date: May 29, 2020 Project No. TRQ-06 | |
|
Page 7-9
Northwest-southeast oriented normal faults occur along the northeastern slopes of Homestake Ridge and locally represent the southwestern wall of the “Hazelton Basin”. These faults would have been active from the Early to Middle Jurassic as pyroclastic and volcanic flows of the PC unit infilled the basin. Mineralizing fluids which lead to the deposition of the gold and silver deposits on the Project are thought to have been channelled along these faults. Northeast-southwest faults offset the Hazelton Group volcanic and older sedimentary rocks throughout the property. Younger Tertiary extensional faults may have been superimposed on these faults.
Large northeast trending ankerite bearing faults have been mapped and related to Tertiary east-west extension (Evans and Lehtinen, 2001).
The main zones of the Homestake Ridge deposit are the Homestake Main (HM), Homestake Silver (HS), and Silver Reef (SR). The HM is the more copper-rich of the zones, with both gold-rich and silver-rich variants and an apparent trend of increasing copper grade with depth. The Homestake Silver zone is primarily silver with elevated lead values, and South Reef is essentially high-grade gold, with minor copper and lead. Their locations are shown on Figure 7.4 below and a long section is shown on Figure 7.5.
The Homestake deposits are commonly vertically zoned from a base metal poor Au-Ag-rich top to an Ag-rich base metal zone over a vertical range of 250 m to 350 m. The silver-galena-sphalerite veins of the Homestake Silver Zone exhibit many of these features.
Effective Date: May 29, 2020 Project No. TRQ-06 | |
|
Page 7-10
Source: Auryn
Figure 7.4: Deposit Locations
Source: Auryn
Figure 7.5: Longitudinal Section Through the Homestake Ridge Deposit Looking North-East
Effective Date: May 29, 2020 Project No. TRQ-06 | |
|
Page 7-11
7.4.1
Homestake Main Deposit
The Homestake Main deposit consists of a series of silica to silica-carbonate-chlorite altered lenses and hydrothermal breccias, which have a northwest strike and dip moderately northeast at slightly steeper than the topographic dip-slope. Gold and silver mineralization occurs with pyrite, chalcopyrite, and lesser galena and sphalerite in stronger areas of silica alteration or hydrothermal brecciation within zones of sericite-pyrite altered feldspar-hornblende phyric volcanic rocks. Only along the southwestern flank of the Homestake Main deposit does lower grade gold mineralization penetrate up into the overlying package of basinal filling volcano-sedimentary and andesitic rocks which comprise the “hanging wall” sequence. Native gold along with pyrargyrite and acanthite have been observed hosted within quartz veins and quartz-carbonate hydrothermal breccias in drill core.
The Homestake Main deposit as currently known is about 700 m long and has been traced down-dip by drilling for a distance of approximately 500 m. At the surface, the northwestern extent of the mineralization is obscured by a glacier; while to the southeast surface geochemistry indicates that the zone continues towards the Homestake Silver deposit 700 m to the southeast. Widths of the Homestake Main Zone vary up to about 60 m (approximate true width) and are defined by assay grades due to the diffuse nature of the mineralization.
Grades for gold typically range from 0.1 g/t Au to 2 g/t Au with some intercepts measuring into the hundreds of grams per tonne and averaged at 7.75 g/t Au. Silver grades are generally in the 1.0 g/t Ag to 100 g/t Ag range but can be as high as hundreds and even thousands of grams per tonne. The average silver grade in the HM is 68.6 g/t Ag. Copper grades vary from parts per million to several percent, with mean grades observed to increase significantly with depth.
Gold distribution appears to be inhomogeneous and grades display a great deal of local variability. The zone has a complex form which may consist of a faulted series of lenses and related steeply dipping feeders.
7.4.2
Homestake Silver Deposit
Located 300 m to the southeast of the Homestake Main zone, the Homestake Silver deposit is comprised of a series of northwest trending, vertically to sub-vertically dipping hydrothermal breccias. Mineralization occurs as galena, sphalerite and silver in contrast to the gold enriched chalcopyrite seen the Homestake Main deposit. Modelling indicates that the Homestake Silver deposit can be traced over 700 m strike and 550 m down dip.
The Homestake Silver zone comprises a cluster of parallel structurally controlled zones, striking approximately 140° with near-vertical dips. The individual sub-zones in the Homestake Silver zone are narrower than the Homestake Main zones on average, with true thickness rarely exciding three metres. The Homestake Silver zone has been traced by drilling for a total vertical extent of approximately 600 m, along a strike length measuring just under 800 m.
Effective Date: May 29, 2020 Project No. TRQ-06 | |
|
Page 7-12
Silver grades at Homestake Silver average 154 g/t Ag, approximately double that of the HM (68.6 g/t Ag) and 26 times that of SR (5.8 g/t Ag). Gold grades at Homestake Silver typically range up to several g/t Au and averaged 3.5 g/t Au in the samples contained within the interpreted zone boundaries. Copper content is comparatively low, however, geochemically significant, and generally measures between 10 ppm Cu and 500 ppm Cu. There are elevated levels of lead and zinc, typically measuring in the 10 ppm to 1,000 ppm range, with some intercepts assaying as high as several percent lead and/or zinc. The lead and zinc grades at Homestake Silver are not expected to be consistently high to contribute significantly to the Project economics, although lead grades were estimated in the block model to facilitate metallurgical classification.
The South Reef deposit is located approximately 800 m to the south-southwest of the Homestake Silver deposit. Gold mineralization is variably associated with strong quartz-chlorite alteration, pyrite and minor base metal sulphides interspersed with intervals of sericite and pyrite alteration in two en-echelon, northwest-trending sub-vertical mineral zones that can be traced with drilling for over 250 m strike-length and 250 m dip. Several base-metal enriched intercepts are identified up-section from the gold-enriched zone but have yet to be fully defined by drilling.
The South Reef zone is comprised of two narrow sub-parallel tabular bodies which strike at approximately 120° to 130° and dip 70°NE to 80°NE. To date, only twelve holes have intersected significant mineralization, as such characterization of the structure and grades is preliminary. The zones measure one metre to three metres in thickness and have been traced for approximately 300 m vertically and 400 m along strike. Silver grades at South Reef average 5.8 g/t Ag in the vein samples. This is offset by high gold values, which average 5.9 g/t Au.
All three zones have elevated arsenic and antimony contents, typically averaging in the tens to low hundreds of parts per million.
7.5
Prospects/Exploration Targets
Numerous other mineral occurrences of interest are present on the project site. The significant mineral occurrences are described in the following sections. Locations are shown on Figure 7.6 None of the exploration targets have NI43-101 complaint Mineral Resources.
Effective Date: May 29, 2020 Project No. TRQ-06 | |
|
Page 7-13
Source: Auryn
Figure 7.6: Prospects/Exploration Targets
Effective Date: May 29, 2020 Project No. TRQ-06 | |
|
Page 7-14
7.5.1
Vanguard Cu and Au Zones
Located approximately 2.5 km southeast of the Homestake Zone, the Vanguard is an 1,800 m long, 150 m wide structural zone hosted in various pyroclastic and volcanic rocks. This area has undergone extensive exploration including 36 trenches and short adits. Most showings are located within a northwest striking, sub-vertically dipping zone containing diffuse sulphide veins, stockworks, sulphide breccia zones, and calcite-barite veins related to pervasive chlorite alteration. Gold-enriched mineralization occurs in the northern part of this belt and adjacent to and up-section from the South Reef gold zone. To the south, the mineralization is characterized by high grade copper with gold and silver (Folk and Makepeace, 2007).
Homestake drilled 13 holes in this area for a total 3,286 m aggregate depth.
7.5.2
Sericite Zone (Gold Reef, Fox Reef)
Located in a large area southwest of the Homestake Zone, the Sericite Zone comprises over 50 mineral occurrences hosted within pervasively sericite-pyrite altered FHP intrusives and volcanic rocks. These occurrences bear the historic names of Tip Top, Foxreef, Goldreef, Matilda, Silver Tip, among others. Gold is found in quartz-calcite-barite veins up to six metres wide with pyrite+chalcopyrite+galena+sphalerite mineralization. Geochemical surveys show an anomalous north-south trend along the volcanic-FHP contact (Folk and Makepeace, 2007).
Homestake drilled 15 holes along the Goldreef – Foxreef trend for a total of 3,630 m aggregate depth.
7.5.3
Dilly and Dilly West Zones
Historic zones named Cascade Falls, Lucky Strike, Silver Crown, and Camp Zone are collectively known as Dilly and Dilly West and occur southwest of the Homestake zones.
Exploration has been active in this area with over 40 pits, trenches, and adits excavated. The zones are hosted by silicified mudstones and siltstones overlying rhyolites. Mineralization consists of syngenetic sulphide bands anomalous in Au, Ag, As, Bi, Pb, Zn, Hg, and Sb. The zones are stratiform and display a linear trend with strike lengths of 1,500 m for the Dilly Zone and 600 m for the Dilly West Zone. The underlying rhyolite is cross-cut by veins with similar mineralization to the sulphide bands and these veins are interpreted to be “feeders”. Stratigraphically above the sediments is a thin, silicified and mineralized rhyolite pyroclastic. Silica decrease on the north end of the Dilly Zone, and base metals and barite occur within the sediments. Also present is semi-massive to massive arsenopyrite within sulphide stockwork and FHP sills (Folk and Makepeace, 2007).
Effective Date: May 29, 2020 Project No. TRQ-06 | |
|
Page 7-15
7.5.4
North Homestake Zone (North Dome)
The North Homestake Zone is described as a large sericite-pyrite-silica altered felsic dome approximately 3.2 km north of the Homestake Silver deposit and occupies a 125 ha area. The geology is massive feldspar-phyric, fine grained felsic volcanic rock of dacite to latite composition that occurs in the upper part of the volcano-sedimentary stratigraphy. Sheeted northeast trending pyritic fractures occur in the strongly silicified southern and western margins. These fractures are strongly anomalous in pathfinder elements such as As, Sb, and Hg.
The upper contact of the rhyolite is projected to be in contact with sediments that are thought to be analogous to those at Eskay Creek. The Kitsault Glacier, however, partially obscures the projected two-kilometre contact. Previous drilling of this horizon by Homestake in 2009 to 2010 intersected thick intervals of altered felsic rocks and strong silver enrichment over tens of metres in two holes. An attempt was made in 2002 by Teck to drill test this geological target, but the hole was abandoned.
The KNHSR1 target lies directly south of the Dolly Varden silver deposit. Historic sampling from the Silver King Min File occurrence has returned up to 34.28 g/t Au and 576 g/t Ag as well as 2.9 percent lead.
Work by Auryn at the KNHSR1 target confirmed the presence of significant base and precious metal mineralization with peak assays of 1.35 g/t Au, 62.1 g/t Ag, 1.66 percent Cu and 20.3 percent Zn from boulders and outcrop at the Silver King occurrence. The VTEM airborne geophysical survey highlighted a major NW-SE trending structure that coincided with the anomalous drainage basin identified in 2018. Follow up of the magnetics and stream sediment anomaly with soils and rock sampling identified a coherent gold + silver soil anomaly centered around the Silver King occurrence. The highly anomalous base and precious metals assays paired with strong quartz sericite alteration throughout the claim indicate that additional exploration is warranted at KNHSR1.
Effective Date: May 29, 2020 Project No. TRQ-06 | |
|
Page 7-16
The Kombi target lies along a north – south oriented shear zone evidenced from field mapping of silicified shears as well as linear breaks in the magnetics picture. Stream sediment samples collected from the area returned up to 910 ppb Au as well as anomalous silver, lead and copper.
Recent work by Auryn at Kombi has resulted in soil sampling up to 1.050 g/t Au paired with rock samples from quartz carbonate veining returning 6.3 g/t Au and 1.37 g/t Ag. The 2019 interpretation of historic airborne geophysics in the area outlined a NW trending block of fault bounded volcanics associated with the highly anomalous geochemical results.
The Bria target includes the Banded Mountain Min File occurrence and represents a potential Eocene Porphyry target. Stream sediment sampling in the target area has returned anomalous silver, lead, zinc and copper. Rock samples from the area have returned up to 11.05 g/t Au and 448 g/t Ag all from quartz veins hosted within intrusive rocks.
The 2019 VTEM survey over Bria highlighted a 3,000 x 500 m steeply dipping intrusive body within sedimentary rocks.
Effective Date: May 29, 2020 Project No. TRQ-06 | |
|
Page 7-17
8. DEPOSIT TYPES
The following section is derived from Folk and Makepeace (2007) and Bryson (2007) and is taken from Macdonald and Rennie (2016).
The Project lies within the highly prolific Iskut-Stewart-Kitsault Belt that is host to several precious and base metal mineral deposits. Homestake Ridge has over 80 mineral occurrences on the Property related in the emplacement of intrusive stocks and felsic domes into the volcanic-sedimentary host rocks.
Diverse mineralization styles on the property include stratabound sulphide zones, stratabound silica-rich zones, sulphide veins, and disseminated or stockwork sulphides. Mineralization is related to Early Jurassic feldspar-hornblende-phyric sub-volcanic intrusions and felsic volcanism and commonly occurs with zones of pyrite-sericite alteration. A later, less significant, mineralizing event occurred in the Tertiary and is characterized by ankerite-calcitepyrite veins. Numerous models can be proposed for the area and local deposits present a broad range of characteristics.
Mineralization displays characteristics of both epithermal gold and VMS deposition. Stratabound and vein (or replacement) mineralization is present that contains values in Ag, As, Au, Cu, Hg, Pb, Sb and Zn (Folk and Makepeace, 2007). The property geology is considered to be favourable for the discovery of “Subaqueous Hot Spring Au-Ag” or “Low Sulphidation Epithermal Au-Ag” type deposits.
The “Subaqueous Hot Spring Au-Ag” deposits, of which Eskay Creek is an example, are formed by “hot spring” fluids venting into a shallow water environment. These deposits may contain large, textureless massive sulphide pods, finely laminated, stratiform sulphide layers and lenses, reworked clastic sulphide sedimentary beds, and epithermal style vuggy breccia veins with coarse sulphides and chalcedonic silica. As such, they share characteristics of both VMS and epithermal deposits.
“Low Sulphidation Epithermal Au-Ag” deposits, of which Silbak-Premier is an example, are typically emplaced within a restricted stratigraphic interval with one kilometre of the paleosurface. Mineralization near surface takes place in hot spring systems with deeper, underlying hydrothermal conduits. Typically, mineralized zones are localized in structures but may occur in permeable lithologies. Veins may exhibit open-space filling, symmetrical and other layering, crustification, comb structure, colloform banding, and multiple brecciations.
Deposits are commonly vertically zoned from a base metal poor Au-Ag-rich top to an Ag-rich base metal zone over a vertical range of 250 m to 350 m. The silver-galena-sphalerite veins of the Homestake Silver Zone exhibit many of these features.
Effective Date: May 29, 2020 Project No. TRQ-06 | |
|
Page 8-1
9. EXPLORATION
Since acquiring the Homestake Ridge Project in late 2016 Auryn has completed extensive exploration across the property to advance additional targets to the drill ready stage. This work has included geological mapping, rock and soil geochemical sampling, portable X-Ray fluorescence and shortwave infrared surveys, geophysical (IP) surveying, the re-logging of historical drill core, geochronological studies and airborne VTEM geophysical surveys along with reprocessing of historic geophysical survey data.
During the rock and soil sampling programs, Auryn obtained representative samples of mineralization on the property. There are no known factors that may have resulted in sample bias.
9.1 Rock Sampling
A total of 274 rock samples (channel, chip and grab) were collected from the central Homestake claim block during the 2017 and 2019 programs.
A large proportion of the 2017 rock samples collected were located along ridges with gossanous outcrop, targeting a potential northern extension of the Homestake Main deposit. Additional samples were collected around historic mineral occurrences near the Homestake Main and South Reef Zones.
The majority of the 2019 rock samples were collected in a grid fashion at the Kombi target where recent recession of glaciers exposed large tracts of rock without soil developed or deposited on top.
9.1.1. Rock Sampling Methodology
Rock samples were generally selected based on favorable lithology and mineralization. Samples were collected using a hammer and placed in a poly ore bag with the sample number written on both sides in permanent marker. A sample tag marked with the unique sample number was placed inside each sample bag and sealed with a cable tie. The geological information and location were entered into an ArcGIS based application via Apple iPad devices.
All the rock sample bags are packaged in double bagged 20” x 40” polywoven rice bags (for added protection), labelled with the laboratory address, shipment number, bag number and shipper details. Prior to sealing the rice bags, a sample submittal form is be placed within the first bag of the sample shipment. The rice bags are sealed with security tags, which are scanned for the corresponding bag.
Completed sample shipments were slung with the helicopter to the staging area where Rugged Edge Holdings Ltd. (expeditor) picked up, transported the samples to their warehouse in Smithers, BC and then arranged for ground transportation via Bandstra Transportation Systems Ltd. to the ALS Global Laboratory in Vancouver, BC.
9.1.2. Rock Sampling Results
Highly anomalous results in gold, silver and base metals were returned from all areas of the property. Notably from Kombi, a sample of quartz veined rhyolite with trace pyrite returned 0.22 g/t Au with 4.11 g/t Ag. From the Bria target area a sample collected from a quartz carbonate vein returned 6.3 g/t Au with 1.37 g/t Ag. Sampling at the KNHSR target returned up to 1.35 g/t Au, 62.1 g/t Ag, 1.66% Cu and 20.3% Zn from a sulphide bearing quartz carbonate vein.
9.2 Soil Sampling
Soil sampling was completed in order to expand upon historic soil coverage as well as to ensure a consistent medium was sampled for levelling purposes. Homestake mineralization trends to the southeast and projects to an area covered by younger Salmon River sediments. It is postulated that the block of sediments are preserved due to a down-drop block within a graben. The sediments are estimated to be 50 to 100 m thick and it is anticipated that the same structures that control HS Silver mineralization form the boundaries of the graben.
To detect mineralization below the Salmon River sediments, an ultra trace geochemical analysis method was used on samples collected from the Ah organic soil horizon.
Anomalous Ah horizon soil samples suggest a northwestern extension to the Homestake Silver Mineralized Zone. Additionally, anomalous Ah horizon soil samples correlate well with the South Reef mineralized zone and suggest a southeastern extension.
Anomalous talus fines samples further suggest a northwestern extension to the South Reef zone.
BC horizon soil sample results follow a similar anomalous trend to the Ah and talus samples, having a strong northwest-southeast orientation in the vicinity of Homestake Main, Homestake Silver and South Reef mineralization.
Effective Date: May 29, 2020 Project No. TRQ-06 | |
|
Page 9-1
Soil sampling at regional targets, Bria, Kombi and KNHSR1 returned highly anomalous values in precious and base metals which require additional follow up work. BC soil samples at Bria and KNHSR target areas returned peak values of 1.05 and 0.283 ppm Au respectively. At KNHSR a coincident silver anomaly occurs with the gold anomaly with a peak value of 13.8 ppm Ag. Anomalous silver values were also returned from the southern portion of the Kombi soil grid with a peak value of 5.7 ppm Ag. Spotty arsenic and molybdenum anomalies are present at all three target areas.
9.3 Induced Polarization Survey
During 2017 17.5 line km of Induced Polarization (IP) ground geophysical surveying was completed using a pole-dipole array with 50 m dipole spacing. The 2017 survey data was combined with the 2013 IP data and depth slices from both the resistivity and chargeability were used to create 3D inversion models. The 3D inversions were used in conjunction with drill hole logging to reinterpret the geological setting of the Homestake property and confirmed the apparent extensional regime and graben geometry.
9.4 Re-log of Historic Drill Core
The relog program was designed to evaluate criteria not previously captured as part of historic logging including identifying fluid flow characteristics, mineralization, and fluid chemistry evaluation through short wave infrared (“SWIR”) analysis. This data was then used to refine the geological model of Homestake Main, Homestake Silver, the Slide Zone and South Reef.
The relog was very effective at identifying the variables which correspond to mineralization. These included texturally destructive strong silicification, high sulphide content, hematite and hydrothermal chlorite, multiphase and single-phase hydrothermal breccia, high crystallinity (both kaolinite and sericite), high wavelength white mica minerals >2,208 nm, and Mg rich chlorite. The correlation of faults and mineralization lead to the model of down dropped blocks with fault bound lower contacts as conduits for mineralization. It is possible the faults have been reactivated causing the offsets seen in mineralization throughout the deposit.
9.5 Geochronological Study
Five (5) geochronology samples were collected to help constrain the crystallization age of intrusions and establish the age of a rhyolite tuff (Hazelton or Salmon River) using Uranium-Lead (U-Pb) Laser ablation techniques. Galena Pb-isotopes were used to establish ages for mineralization within mineralized veins. Ar-Ar step-heating techniques were utilized to establish the cooling age of the intrusions (Table 9-1).
Effective Date: May 29, 2020 Project No. TRQ-06 | |
|
Page 9-2
Summary of Geochronology Results
| Sample ID | Claim | Easting | Northing | Method | Age Determined |
| 17JLO-12 | Bravo N7 | 472931 | 6186238 | U-Pb Zircon | 55.62+/-0.65 Ma |
| 17JLO-15 | Bravo N6 | 470067 | 6185453 | U/Pb Zircon | 43.64+/-0.42Ma |
| 17JLO-16 | Bravo N7 | 472654 | 6188308 | U/Pb Zircon | 196.5 +/- 1.3 Ma |
| 17JLO-11 | Bravo N7 | 473130 | 6186212 | Ar-Ar Step Heating | 57.3+/-1.10 Ma (Plateau Age) |
| W725899 | Bravo N7 | 473108 | 6186248 | Galena Pb Isotopes | Tertiary |
9.6 Airborne Geophysics
A Versatile Time Domain Electromagnetic (VTEM) and Magnetics survey was flown by Geotech Ltd. over two blocks of the Homestake Property to augment the historic airborne geophysical data. The survey comprised 574 line kilometres covering the Bravo N1-N7 (Area 1) and KNHSR1 (Area 2) claims (Table 9-2). Computational Geosciences Inc. was contracted to complete interpretations and inversions of both the new survey data and the historic data.
VTEM Survey Summary
| Survey Block | Line Spacing (m) | Line Kilometres | Flight Directions |
| Area 1 | Traverse: 50 | 384 | N 0° E / N 180° E |
| Tie: 500 | N 90° E / N 270° E |
| Area 2 | Traverse: 50 | 190 | N 60° E / N 240° E |
| Tie: 500 | N 150° E / N 330° E |
3D inversions of the airborne electromagnetic and magnetic data were completed from a variety of surveys (AeroTEM 2009, VTEM 2010, ZTEM 2012 and VTEM 2019) over the Property. Individual electrical conductivity and magnetic susceptibility inversions were created for each dataset and joint electrical conductivity inversions were carried out for overlapping data regions.
Effective Date: May 29, 2020 Project No. TRQ-06 | |
|
Page 9-3
The property scale magnetics picture highlights several regional structures trending both NNE and NNW (Figure 9.1). The NNW trending structures are interpreted to be the basin bounding faults which parallel large-scale regional faulting. Conductive features identified from the electromagnetics data have helped to refine the geometry of several intrusive bodies throughout the Property, most notable at Kombi where the mineralization identified to date is associated with and hosted within intrusive rocks (Figure 9.2).
Figure 9.1: Homestake Merged Magnetics
Effective Date: May 29, 2020 Project No. TRQ-06 | |
|
Page 9-4
Figure 9.2: Homestake Merged Conductivity
Effective Date: May 29, 2020 Project No. TRQ-06 | |
|
Page 9-5
10. DRILLING
10.1 Historical Drilling
Historical drilling on the Homestake Ridge property is summarized in Table 10-1. Collar locations are shown in Figure 10.1, and representative sections of drilling in HM, HS, and SR are shown in Figure 10.2.
Historical Drilling
| Years | Company | Zones Drilled | Number of Holes Drilled | Metres Drilled |
| 1964-1979 | Dwight Collison | Lucky Strike (Homestake) | 7 | 58.2 |
| 1989-1991 | Noranda Exploration | Homestake & Vanguard | 12 | 1,450.05 |
| 2000 | Teck Cominco | All Zones | 21 | 4,374.6 |
| 2003-2012 | Bravo Ventures(Homestake Resources) | All Zones | 252 | 71,026 |
| 2013-2014 | Agnico Eagle | Exploration & Slide Zone | 16 | 6,525 |
Source: Auryn, 2020
10.2 Auryn Resources Inc. Drilling
Following acquisition of the Project, Auryn completed 13 drill holes totaling 5,571.3 m. RPA then prepared an updated Mineral Resource estimate with an effective date of September 1, 2017; and a supporting NI43-101 Technical Report dated September 29, 2017.
Auryn completed a total of 37 drill holes totaling 14,850 m in 2017 on the Homestake Main Zone (HM) and Homestake Silver Zone (HS) targets and six drill holes totaling 2,482 m in 2018 on the South Reef Zone (SR) target. Stream sediment sampling in 2019 led to the discovery of the southern Kombi target area.
Drilling was contracted to Cyr Drilling International Ltd. (Cyr) from Winnipeg, MB. Cyr used helicopter portable A-5 hydraulic drills manufactured by Zinex Mining Corp. to produce NQ2 (50.6 mm diameter) core. The drills were moved between drill sites and supported by an Astar 350 B-3 helicopter provided by Tseax Aviation from Terrace, BC.
The locations of drill hole pads were initially marked using a handheld GPS instrument and the azimuth of the holes was established by compass. Once the pad was built and the drill moved onto it, an Azimuth Aligner instrument manufactured by Minnovare Pty. Ltd. was used to establish the azimuth. An inclinometer was used to establish the dip.
Effective Date: May 29, 2020 Project No. TRQ-06 | |
|
Page 10-1
The attitude of the hole with depth was determined using a DeviShot instrument manufactured by Devico AS in single shot mode with readings taken by the drillers. The initial reading was taken at 6 m past the casing with subsequent readings taken nominally at 50 m intervals. An Auryn geologist checked the core before making the decision to terminate the holes. Upon completion of the hole, the casings were pulled and the location of a hole marked with a picket. Subsequently all hole locations were surveyed with differential GPS.
Drill core was placed sequentially in wooden core boxes at the drill by the drillers. The core boxes were transported by helicopter on a twice daily basis to the camp where depth markers and box numbers were checked and the core was carefully reconstructed. The core was logged geotechnically on a 3 m run by run basis including, core recovery, RQD, and magnetic susceptibility.
The core was descriptively logged and marked for sampling by Auryn geologists paying particular attention to lithology, structure, alteration, veining/brecciation, and sulphide mineralization.
Readings were taken at three metre intervals using a hand-held TerraSpec Halo NIR spectrometer manufactured by ASD Inc.
Logging and sampling information was entered into the GeoSpark core software package supplied by GeoSpark Consulting Inc. (2017) and MX Deposit cloud-based core logging application by MINALYTIX INC. (2018) which allowed for the integration of the data into the project acQuire database.
The core was photographed both wet and dry after logging but prior to sampling.
Effective Date: May 29, 2020 Project No. TRQ-06 | |
|
Page 10-2
Source: Auryn
Figure 10.1: Drilling Collar Locations
Effective Date: May 29, 2020 Project No. TRQ-06 | |
|
Page 10-3
Figure 10.2: Typical Drill Section Views
Effective Date: May 29, 2020 Project No. TRQ-06 | |
|
Page 10-4
11. SAMPLE PREPARATION, ANALYSES, AND SECURITY
11.1 Historic Sampling
The following is taken from Macdonald and Rennie (2016).
The Project has been explored by numerous historic trenches and adits. Auryn is not aware of any written procedures for sampling that predates Homestake’s acquisition of the Project. However, as the trenching and underground sampling were not used in the Mineral Resource estimate, they are not discussed in detail in this Technical Report.
On acquiring the Project in 2003, Homestake conducted several traverses to orient and ground truth existing database sites such as drill collars and individual sampling locations. Homestake concluded that Teck Resources’ (Teck) sampling was accurately located, but discrepancies were found with respect to the Noranda Exploration Company Limited (Noranda), Cambria Resources Ltd. (Cambria), and Newmont Exploration of Canada Ltd. (Newmont) sampling. Generally, previous operators’ sampling sites were clearly marked with flagging, tags, and paint. Samples that could not be verified in the field were dismissed.
11.2 Homestake Resources Corporation Sampling
The following is taken from Macdonald and Rennie (2016).
Homestake has conducted surface grab, chip, and soil sampling, plus diamond drilling on the Project area. A total of 417 grab and chip samples were taken from outcrops and old excavations. A total of 847 soil samples were collected at 25 m to 50 m intervals along a series of lines spaced from 100 m to 200 m apart in the 2004, 2011, and 2012 exploration programs. Soil samples were collected from the B-horizon, where possible, and placed in Kraft paper bags.
Rock samples were placed in plastic sample bags with sample tags and sealed with zip ties. Sample locations were marked with metal tags and flagging tape. Samples were secured in a locked facility until they were transported by a local freight to the assay laboratory. The assay laboratories used are summarized in the subsequent subsections.
Drill core was delivered to the logging facility by helicopter where it was inspected by the logging geologist and subjected to a quick log. The quick log comprised of a brief description of lithology, alteration, and mineralogy, as well as a description of any significant structural characteristics. The core was photographed and stored for future comprehensive logging.
Effective Date: May 29, 2020 Project No. TRQ-06 | |
|
Page 11-1
All drill core was logged for lithology, mineralization, type and intensity of alteration, vein mineralogy and component percentage, breccia intensity, fracture intensity and structural components such as faults, fractures, contacts, bedding, cleavage (primary and secondary), and veining, measured relative to the core axis. Geotechnical logging included recovery, RQD and, occasionally, bulk density.
Sample intervals, to a maximum length of three metres, were designated by the logging geologist based on lithology, mineralogy, alteration, and structure. Each sample was given an identifier from a three-part tag system. The core was cut in half longitudinally using a diamond saw, with half being sent for analysis and half remaining as a permanent record. One part of the waterproof tag was placed in the sample bag, one was placed with the remaining core at the start of the sample interval, and the third tag remained in the tag book as a reference. Unmarked standards and blanks were included in the samples submitted, roughly once in every 20 samples with a ratio of 2:1 standard to blank. Samples were secured in a locked facility until they were transported by local freight to the assay laboratory.
All of the core was transported to Prince Rupert and placed in a storage facility where it was reviewed periodically by Homestake Geologists.
Homestake took bulk density measurements of the core, using a water immersion method. Intact core specimens were weighed in air, then on a pan immersed in a bucket of water. The weight of displaced water was determined by subtracting the wet weight of the sample from the dry weight. The density is the ratio of the dry weight to the weight of the water displaced by the specimen. A total of 7,330 bulk density determinations had been collected to the end of the 2012 program.
In RPA’s opinion, the core was transported, handled, and stored in a safe and secure manner. Homestake’s sampling and logging procedures are appropriate for the deposit type and style of mineralization. The drill samples are representative of the mineralization.
11.3 Assaying of Drill Core
11.3.1 2003 to 2006 Procedure
The primary laboratory utilized for the 2003 to 2006 period was Acme Analytical Laboratories Ltd. (Acme) of Vancouver, although Eco-Tech Laboratories Ltd. (Eco-Tech) of Kamloops, BC was the primary laboratory in 2003. Both companies are independent laboratories and their accreditation during this time period is unknown. One kilogram samples were crushed to 80 percent passing 10 mesh from which a 250 g split was taken. This subsample was homogenized, riffle split, and pulverized to 85 percent passing 150 mesh. A one assay ton (AT) split was taken and subjected to fire assay (FA) fusion with Inductively Coupled Plasma Atomic Emission Spectroscopy (ICP-AES) analysis for gold and silver. Samples above 10 ppm Au or 200 ppm Ag were rerun using atomic absorption (AA) with gravimetric finish. Base metals were also commonly run on over-limit samples (Bryson, 2007).
Effective Date: May 29, 2020 Project No. TRQ-06 | |
|
Page 11-2
All samples were analyzed by Inductively Coupled Plasma Mass Spectrometry (ICP-MS) for 41 elements. A 0.25 g subsample was digested in an acid solution of H2O-HF-HClO4-HNO3 (2:2:1:1) and 50 percent HCl was added to the residue and heated. After cooling, the solutions were transferred to test-tubes and brought to volume using dilute HCl and then assayed.
Metallic analysis was done for over-limit samples during the 2005 to 2008 programs. Samples were crushed, pulverized, and a 500 g subsample was extracted. The samples were sieved and the +200 and -200 mesh fractions were collected and weighed. These fractions were assayed by FA with gravimetric finish. The final grade was calculated from a weighted average of the assays for the +200 and -200 mesh fractions.
11.3.2 2007 to 2008 Procedure
Initially, samples were sent to Acme, however, in order to address processing delays, some samples were sent to International Plasma Labs Ltd. (IPL) of Richmond, BC, an ISO 9001:2000 accredited facility. The sample preparation consisted of:
■
Crushing samples to approximately 80 percent passing 10 mesh and the entire charge was reduced to 250 g by repeated splitting through a riffle splitter.
■
Ground the 250 g split using and Ring and Puck pulverizer until approximately 90 percent passes 150 mesh.
■
Rolling the split to ensure homogeneous particle distribution and transferred to a computer labelled sample bag.
A one AT aliquot was assayed by FA with AA finish. Samples with gold values greater than 1,000 ppb Au (over-limit) were re-assayed using FA with gravimetric finish. In addition to the FA, each sample was subjected to a 30 element analysis by (AR)/ICP with aqua regia digestion.
11.3.3 2009 to 2012 Procedure
Acme was the primary laboratory for the 2009 and 2010 programs. Sample preparation procedures consisted of a one kilogram split being crushed to 80 percent passing 10 mesh from which a 500 g split was taken. This split was pulverized to 85 percent passing 150 mesh (later 200 mesh). A one AT split was taken and subjected to FA with Inductively Coupled Plasma Emission Spectroscopy (ICP-ES) finish for gold and silver. The upper detection limit for this method was 10 ppm Au and 200 ppm for Ag. Any determinations that exceeded 10 ppm Au or 200 ppm Ag were rerun by AA with gravimetric finish. Over-limit samples were also commonly run for base metals using four-acid digestion and ICP-ES analysis. A 0.25 g split was taken for all samples and run by ICP-MS after three-acid (HNO3-HCl4-HF) digestion.
Effective Date: May 29, 2020 Project No. TRQ-06 | |
|
Page 11-3
In RPA’s opinion, assaying was conducted using conventional methods commonly used and accepted within the industry and appropriate for the type of mineralization. The laboratories were certified commercial facilities. A reasonable practical level of sample security has been maintained throughout all of the drill programs.
11.4 Agnico Eagle Mines Limited Sampling
The following is taken from Swanton et al. (2013).
Half core samples were collected using a gas-powered core saw onsite at the site core shack. Samples were placed in sealed poly rock bags and sent to the ALS Minerals (ALS) preparation facility in Terrace for sampled preparation (crushing and pulverising). ALS re-directed some sample shipments directly to Vancouver for sample preparation depending on capacity at the Terrance facility. Geochemical analyses were completed at the main ALS facility in Vancouver. ALS is an accredited laboratory, recognized under accreditation No. 579, and conforms with requirements of CAN-P-1599, CAN-P-4E (ISOMEC 17025-20905)). Samples were analyzed for gold via fire assay (method code Au-AA23) and a 48-element ICP package utilizing four-acid, “near total” sample digestion (method code ME-MS61). Sample lengths varies between 1.5 m and 0.5 m at the prerogative of the logging geologist and a total of 3,658 (including quality assurance/quality control (QA/QC)) samples taken. Samples of Certified Reference Materials (CRMs) or blanks were inserted every ten samples on sample numbers ending in zero, alternating between one of three CRMs (CDN-GS-2L, CDN-GS-13A and CDN-CM-24) which were supplied by CDN Resource Laboratories Ltd (CDN) of Vancouver, British Columbia. Blank material comprised of gardening limestone acquired from a Canadian Tire retail outlet. Similarly, a duplicate was inserted every ten samples, on sample numbers ending in ‘5’. Half of the duplicates were field duplicates, where the half of the split core which would normally remain in the box was instead sampled. The other type of duplicate was a preparation duplicate, in which an empty bag (with sample tag) was inserted into the sample sequence and the preparatory laboratory instructed to take a split of the material after crushing and analyze it as the duplicate sample.
Effective Date: May 29, 2020 Project No. TRQ-06 | |
|
Page 11-4
ALS prepared additional splits of the master pulps and returned them to the Project site for analysis using a portable X-ray Fluorescence (XRF) analyser rented from Innov-X Systems. A total 326 samples were analyzed using both “Soil Mode” and “Mining Plus Mode” – a procedure designed to detect both trace and high concentration elements.
11.5 Auryn Sampling
Core recovery is generally very good to excellent, allowing for representative samples to be taken and accurate analyses to be performed. Sawn core samples, two metres long, were taken along the entire length of each hole. A total of 8,622 split core samples were taken.
Individual core samples were placed in rice bags which were sealed using uniquely numbered zip ties and flown to the staging area on a twice per week basis where they were immediately transferred to Rugged Edge Holdings Ltd., acting as Auryn’s expeditor, for transportation to Smithers. From Smithers, the samples were trucked by Banstra Transportation System Inc. to the ALS sample preparation facility in Terrace/Vancouver, BC.
Core boxes from completed and sampled holes were flown by helicopter to a staging site from where they were trucked to a secure sample storage site in Prince Rupert, BC.
Figure 11.1 illustrates Auryn’s core handling flow chart.
Effective Date: May 29, 2020 Project No. TRQ-06 | |
|
Page 11-5
Figure 11.1: Core Handling Flow Chart
Effective Date: May 29, 2020 Project No. TRQ-06 | |
|
Page 11-6
11.6 Laboratory Methods
In Terrace/Vancouver, the samples are logged into ALS’s sample tracking system, dried and fine crushed to better than 90 percent passing 2 mm. The sample is then split using a riffle splitter and a 250 g portion is pulverized to better than 85 percent passing 75 m (ALS Sample Preparation Code Prep-33D). The pulverized samples were forwarded to ALS’s analytical facility in Vancouver for analysis. ALS is an accredited laboratory, recognized under accreditation No. 579, and conforms with requirements of CAN-P-1599, CAN-P-4E (ISOMEC 17025-20905)). Auryn and RPA are independent of ALS.
In Vancouver, each sample was assayed for gold and analysed for a multi-element suite. Gold was determined by fire assay on a 30 g sample with an Atomic Absorption Spectroscopy (AAS) finish (ALS Code Au-AA23). Samples assaying greater than 5 g/t Au were re-assayed with a gravimetric finish (ALS Code Au-Grav21). One kilogram of pulverized material from samples assaying greater than 20 g/t Au were re-assayed by screened metallics fire assay (ALS Code Au-SCR21).
A one-gram sample of pulverized material was analysed for a 48-element suite, including silver and copper, by ICP-MS after a four-acid digestion (ALS Code ME-MS61). Samples yielding analyses of silver greater than 100 ppm Ag were re-analyzed by HCl leach with AAS finish after a three-acid digestion (ALS Code Ag-OG62). Thirty grams of material yielding analyses of silver greater than 1,500 ppm Ag were fire assayed with a gravimetric finish (ALS Code Ag-GRA21).
Effective Date: May 29, 2020 Project No. TRQ-06 | |
|
Page 11-7
Figure 11.2: Sampling Flow Chart
Effective Date: May 29, 2020 Project No. TRQ-06 | |
|
Page 11-8
11.7 QC Sampling
Quality Control (QC) samples were introduced into the sample stream at a rate of 1 in 20 for both blank samples and CRM samples. Field duplicates, in the form of quarter sawn samples, were introduced into the sample stream at a rate of 1 in 50 samples.
Certified blank material was acquired from Analytical Solutions. Four CRMs were acquired from OREAS to cover a range of grades and elements including gold, silver, and copper. Table 11-1 lists the CRMs and their respective expected values.
Certified Reference Material
| CRM | Certified Values |
| Au | Ag | Cu |
| OREAS 60C | 2.47 g/t | 4.87 ppm | N/A |
| OREAS 229 | 12.11 g/t | N/A | N/A |
| OREAS 600 | 0.20 g/t | 24.75 ppm | 482 ppm |
| OREAS 603 | 5.18 ppm | 284.34 ppm | 1.00% |
All holes were continuously sawn in two metre samples regardless of geological contacts.
11.8 2017 to 2019 QC Programs
RPA received QC reports for all 2017 to 2019 drilling. Auryn generated a standard report exported from acQuire with the results of each sample batch. Microsoft (MS) Excel files were provided summarizing the results for all QC standards, blanks, and duplicates. RPA has reviewed the reports and files, as well as the laboratory procedures outlined in the RPA (2017) report and concludes that the QC program for the 2017 to 2019 period is sufficient to support the Mineral Resource estimate. In some instances, the Auryn standards and duplicates did not perform as well as the laboratory control samples. QC standards MP-1b and OREAS 932 demonstrated consistent overestimation for the laboratory method Ag_OG62_ppm (an over-limit method), however, these standards were not used in the 2017 drill program since over-limit analysis did not occur. QC sample failures were dealt with on a case by case basis and were documented with commentary in the Dispatch Returns table within the acQuire database. RPA recommends Auryn produce MS Word style reports on QC sample performance for regular periods which describe the results and those of the MS Excel files, summarize measures taken, outline possible issues, and suggest any possible further improvements to the process.
RPA concurs with the adequacy of the samples taken, the security of the shipping procedures, and the sample preparation and analytical procedures at ALS. In RPA’s opinion, the QA/QC program as designed and implemented by Auryn is adequate and the assay results within the database are suitable for use in a Mineral Resource estimate.
Effective Date: May 29, 2020 Project No. TRQ-06 | |
|
Page 11-9
12. DATA VERIFICATION
12.1 Site Visit
Paul Chamois, M.Sc. (A), P.Geo., Principal Geologist with RPA and an independent QP, visited the Project from August 26 to 28, 2017. During the visit, Mr. Chamois examined core from the on-going drilling program, confirmed the local geological setting, reviewed the core handling and data collection methodologies, and investigated factors that may affect the Project. Due to the advanced nature of the Project, no independent samples were taken during the visit.
12.2 Historical Verification
Comprehensive data verification was performed by RPA both for the 2010 and 2011 Mineral Resource estimates as outlined in supporting NI43-101 reports (Rennie et al. 2010, Rennie, 2011). These included checks against original data sources, standard database checks such as from/to errors, and basic visual checks for discrepancies with respect to topography and drill hole deviations.
For the 2011 to 2012 data, Homestake and RPA conducted data validation procedures similar in some respects to those carried out for earlier drilling campaigns. The Mineral Resource database was imported by Homestake into Gemcom SURPAC software for management and manipulation of exploration and mining data. All samples and tables in the database relevant to the Mineral Resource estimate were audited using the database audit facility and no errors were found. As a secondary check, RPA extracted 4,229 samples from the 2011 to 2012 drilling results, representing 14 percent of the total samples in the database, and compared them to the original assay certificates. No errors were found (Rennie, pers. comm., 2013).
12.3 2017 to 2019 Verification Work
The Project drill and sample database is currently maintained in industry standard acQuire GIM software, which incorporates validated log entry and assay certificate imports. RPA reviewed the drill database provided in the Seequent’s Leapfrog Geo/EDGE (v5.0.3) (Leapfrog) Mineral Resource project. Overall, the database appears to be well-constructed with appropriate field names. Data from previous owner campaigns are incorporated with comments.
Effective Date: May 29, 2020 Project No. TRQ-06 | |
|
Page 12-1
Thirty-three NULL sampleIDs with no grades were explained as unsampled intervals in Auryn’s surface trenching. Minor work is still required to find and enter 225 drill hole dates and correct older collar positions which differ from topography (e.g., 1989 Noranda holes in the Project deposit area re-surveyed by Homestake in 2008 using differential GPS). These holes do not materially affect the Mineral Resource estimate. RPA also recommends adding a “YEAR” field to the collar table to easily query drilling summaries.
12.4 Assay Verification
Auryn provided RPA with 104 assay certificate CSV export files containing 14,201 gold, silver, and copper assays from 2017 to 2019 drilling. Previous drilling has been covered by previous verification exercises. Of this subset, 8,719 sample IDs matched with sample IDs in the Mineral Resource database. For Au, Ag and Cu, RPA found 100 percent grade matches with no errors.
RPA is of the opinion that database verification procedures for the Project comply with industry standards and are adequate for the purposes of Mineral Resource estimation.
Effective Date: May 29, 2020 Project No. TRQ-06 | |
|
Page 12-2
13. MINERAL PROCESSING AND METALLURGICAL TESTING
13.1 Overview
Historical metallurgical testwork on Homestake Ridge mineralization is fully documented in previous NI43-101 Technical Reports. The reader is directed to the 2017 Technical Report by RPA for details on the historical testwork.
The following sections outline the results of the most recent metallurgical testwork which is relevant to the proposed metallurgical flowsheet for processing Homestake Ridge mineralization. The reader is referred to Shouldice (2016) for additional information.
13.2 Base Metal Laboratories 2016
The process parameters adopted for this study were derived by Base Metal Laboratories in a 2016 test program that focussed on a hybrid of sulphide flotation and cyanide leaching to maximize the recovery of precious metals. Duplicate head cuts were taken from each composite and assayed for Au, Ag, Cu, Pb, Zn, and Fe. The Main composite had a measured head feed of 4.62 g/t Au and 6 g/t Ag and represented the copper dominant part of the Main deposit. The Silver composite had a measured head feed of 7.76 g/t Au and 198 g/t Ag and was much higher in Ag, Pb and Zn than the Main deposit.
The following description of the 2016 testwork at Base Metals Laboratory has been extracted from the 2017 RPA Technical Report.
For the Main zone, the process consisted of the sequential production of a gravity concentrate, copper concentrate, and gold bearing pyrite concentrate by flotation. The copper cleaner tailings and pyrite concentrate were cyanide leached together to extract gold and silver. For the Silver zone, the process was similar, however, the copper flotation stage was replaced by sequential flotation of lead and zinc concentrates. Tests were also conducted without gravity concentration to measure the effect on metallurgical performance.
The primary grinding was conducted in a mild steel rod mill using mild steel grinding charge. A 2 kg test charge was used for each test. Similarly, all regrinding was conducted in a smaller mill with stainless steel grinding charge.
Gravity concentration was conducted using a Knelson gravity concentrator with a 100 g bowl. The gravity concentrate was then panned to reduce the mass recovery and increase the grade of the gravity concentrate. The pan and Knelson tails were collected together and excess water was decanted for the following flotation stages.
Effective Date: May 29, 2020 Project No. TRQ-06 | |
|
Page 13-1
Flotation was conducted with a Denver D12 flotation machine. Rougher flotation was conducted in a 4.4 L cell and cleaner flotation was conducted in 2.5 L and 1.5 L flotation cells. Very selective reagent schemes were used in the base metal flotation stage to increase the probability of producing marketable concentrates. For copper flotation, NaCN was added to depress pyrite and a selective collector was used (Cytec 3418A). The flotation pulp was modulated to pH 9 to 9.5 with lime. For selective flotation of lead and zinc, zinc sulphate and cyanide were used to depress sphalerite and pyrite. Once complete, the pH was increased to 10 with lime and copper sulphate was added to recover sphalerite. The use of Cytec 3418A was continued in the lead and zinc circuit to aid in pyrite depression. Pyrite flotation was conducted with PAX.
All leaching was conducted as 24-hour bottle roll tests at relatively high cyanide dosage.
13.3 Ore Sorting
A 2012 investigation by Tomra Sorting Solutions evaluated the amenability of Homestake Ridge mineralization to ore sorting. One hundred and thirty-six samples were submitted from various locations at the project site, and were subjected to:
■
Dual energy X-Ray Transmission sorting (DEXRT)
■
Conductivity/magnetic susceptibility sorting (EM)
■
Near infra-red spectroscopy sorting (NIR)
■
Visible spectrum optical sorting (Optical)
■
X-Ray Fluorescence Spectroscopy sorting (XRF-S)
The results showed that DEXRT sorting showed good promise with recoveries approaching a perfect recovery curve at a 65 percent mass pull containing 99 percent of the payable metal. The same favorable results were also obtained on DEXRT sorting of concentrates.
The XRF-S showed some promise, especially with long exposure times. However, as the exposure time is reduced the precision of the sorting is greatly reduced.
The samples did not show any upgrading with the EM, NIR or optical sorting. These Homestake minerals do no appear to be amenable to sorting with these technologies.
Effective Date: May 29, 2020 Project No. TRQ-06 | |
|
Page 13-2
13.4 Gravity Concentration
Gravity concentration was performed after primary grinding. The entire primary mill discharge was passed through a Knelson Concentrator then the Knelson concentrate was panned to reduce the mass recovery to more typical recovery values achieved in operating plants.
The Main composite recovered approximately 21 percent of the gold in the feed into a concentrate grading 83 g/t Au. Further upgrading would be required to make the concentrate marketable, which often results in a further drop in recovery.
The Silver composite showed more promise, gold in the feed was 28 percent recovered into a gravity concentrate grading approximately 249 g/Au, on average. At these grades and recoveries, the gravity concentrate would have potential for sale.
13.5 Main Composite Rougher Flotation Testing
A total of three rougher flotation tests were completed, on the Main composite.
The selective flotation conditions applied to recover copper to a concentrate were mostly successful. Copper recoveries of between 85 percent and 90 percent can be achieved at rougher mass recoveries of 6 percent to 10 percent. The moderate level of mass recovery would indicate that process was somewhat selective against other sulphides and the rougher concentrate should be amenable to upgrading to high grade copper concentrates.
This copper recovery was insensitive to primary grind size. To assess gold metallurgical performance, the cumulative gold recovery of the gravity, copper rougher, and pyrite concentrates were compared to the total cumulative mass recoveries of these concentrates.
For either grind size, gold recovery was about 95 percent to concentrates at 30 percent mass recovery.
Gold recovery to concentrates did show some sensitivity at lower mass recoveries. Better gold recoveries were achieved at the finer primary grind size, with lower mass recovery. This is likely a result of improved mineral liberation at the finer grind size.
Similarly, the silver metallurgical performance data indicates that at 30 percent mass recovery, silver was about 90 percent recovered into concentrates. Marginally better silver recoveries were observed with the finer primary grind size at lower mass recoveries.
Finally, the inclusion of a gravity circuit was investigated with respect to overall gold recovery. The data was insensitive to gravity, indicating that high gold recoveries could be achieved with flotation alone.
Effective Date: May 29, 2020 Project No. TRQ-06 | |
|
Page 13-3
13.6 Silver Composite Rougher Flotation Testing
Three rougher tests were performed on the Silver composite. Selective flotation conditions were utilized to float sequential lead, zinc then gold bearing pyrite concentrates.
Lead recovery to the lead rougher concentrate reached a maximum of 80 percent. The rougher mass recovery to achieve this lead performance ranged from 2 percent to 5 percent. There was considerable scatter in the data making it difficult to determine if primary grind size had an influence on lead metallurgical performance.
There was a limited amount of testing to investigate zinc metallurgical performance. Zinc was about 25 percent recovered to the lead rougher concentrate and 60 percent recovered to the zinc rougher concentrate. While it may still be possible to produce high grade concentrates, further process development studies would be required. The zinc concentrates were low grade and there was a high deportment of gold and silver to the rougher concentrates. Payment terms for gold and silver are not as favorable for zinc concentrates, therefore zinc flotation was not developed further in this program.
The finer primary grind size had better initial gold recovery at low concentrate mass recovery.
As the concentrate mass recovery was increased to more than 20 percent, however, there was little effect on gold recovery. Total gold recovery to all concentrates was 95 percent at 20 percent mass recovery.
The effect of primary grind on silver was inconclusive. Overall total silver recovery to all concentrates ranged between 90 percent and 95 percent at 20 percent mass recovery.
The data indicates that omitting the gravity process will not reduce gold recovery to concentrates.
13.7 Main Composite Cleaner Flotation Testing
Selective flotation conditions were employed to suppress pyrite during copper flotation by using a low dosage of cyanide (5 g/t) and a collector selective against pyrite.
The test results showed that copper in the feed was 70 percent recovered into concentrates grading up to 28 percent copper. These results were achieved in batch cleaner tests and improvements in copper recovery would be expected during closed circuit operation.
During the testing, the regrind discharge size was relatively constant, ranging between 21 lm and 25 lm K80. This size is relatively fine; more testing would be required to fully optimize this parameter.
Effective Date: May 29, 2020 Project No. TRQ-06 | |
|
Page 13-4
Tests indicated that gold grade and recovery were reduced when gravity was utilized, indicating that some of the gold was already captured in the gravity concentrate.
Without gravity in the circuit, gold recoveries of between 50 percent and 55 percent would be expected at final copper concentrate grades that are marketable. The gold content at this recovery would be between 300 g/t and 380 g/t.
Similarly, including gravity concentration slightly reduced the recovery and grade of silver reporting to the copper concentrate. Overall, silver recovery to the final concentrate averaged 40 percent to 45 percent at grades of between 550 g/t and 650 g/t.
The batch cleaner tests clearly demonstrate that high grade copper concentrates can be produced with selective flotation conditions. Furthermore, the copper concentrate would be high value due to the gold and silver content.
Parameter optimization was limited and there is potential to improve the metallurgical results or reduce the cost of the process with additional optimization testing.
13.8 Silver Composite Cleaner Flotation Testing
The batch cleaner testing for the Silver zone utilized selective conditions to recover a lead concentrate. In lead flotation, cyanide and zinc sulphate were used to depress pyrite and sphalerite. In some of the tests, production of a zinc concentrate was attempted after lead flotation. A gold bearing pyrite concentrate was recovered after the flotation of the base metal concentrates.
The inclusion of gravity concentration into the process resulted in poorer lead, gold, and silver grade and recovery performance. Deportment of these metals to the gravity concentrate was the cause of the poor flotation performance.
Without gravity concentration included in the process, lead was about 65 percent recovered into a concentrate grading 30 percent lead. The concentrate grade and recovery profiles were relatively flat indicating potential to further improve lead concentrate grade.
Only two tests attempted to produce zinc concentrate. Low grade concentrates were produced at about 45 percent zinc recovery. These initial tests indicate that zinc concentrate production would be unlikely using basic conditions. It may, however, still be feasible to produce zinc concentrate with further testing and development.
Tests without gravity concentration demonstrated that gold in the feed could be 66 percent to 68 percent recovered to the final lead concentrate at gold grades of 800 g/t to 1,000 g/t.
Effective Date: May 29, 2020 Project No. TRQ-06 | |
|
Page 13-5
Silver recovery to the lead concentrate demonstrated much more variability than the other elements. Without gravity concentration, final silver content in the concentrates ranged from 7,000 g/t to 12,000 g/t. Recovery of silver to the concentrate varied from 23 percent to 50 percent to the final lead concentrate. The recalculated silver head matches were highly variable and typically lower than the measured head for this element. Due to the high measurement values, it is possible concentrate grades were under-reported, unfortunately there was insufficient concentrate mass to verify the silver assays.
13.9 Cyanide Leaching of Flotation Products
To maximize the gold and silver extraction from the project, the pyrite concentrate and cleaner tailings streams were leached with cyanide. The feed for each leach test was reground prior to leaching. Previous testing indicated that relatively fine grind sizes improved total extractions. Aggressive leach conditions were applied, primarily to accelerate the leaching of silver, which often has much slower leach kinetics than gold. Due to time constraints for project completion, 24-hour leach tests were performed. In retrospect, the kinetic rate curves for most of the tests indicated that leach was incomplete, particularly for silver.
For the Main composite, leaching of the pyrite concentrate and copper cleaner tailings without gravity indicated that extraction was 73 percent and 57 percent for gold and silver, respectively. The silver composite demonstrated better leach performance. Indicated gold and silver leach performances on concentrates without gravity were on average 80 percent and 65 percent for gold and silver, respectively.
Cyanide consumption was typical of concentrate leaching, averaging about 4.4 kg/t of leach feed. Lime consumption averaged about 0.4 kg/t of leach feed.
The results achieved were relatively good, but there is considerable scope for improving the performance. Finer regrind sizes should be investigated along with leach additives like lead nitrate to improve leach kinetics.
13.10 Concentrate Quality Estimates
Additional assays on the final concentrates from each composite were performed to determine levels of critical minor deleterious elements. The analyses conducted were limited due to the amount of concentrate available for testing. Most tests produced only 10 g to 15 g of base metal concentrate, which was mostly consumed for gold, silver, copper, lead, zinc, and iron.
Effective Date: May 29, 2020 Project No. TRQ-06 | |
|
Page 13-6
Arsenic, antimony, and mercury are indicating high values that will likely attract smelter penalties. Normally, some smelters may reject concentrates on the basis of the high arsenic, antimony, and mercury, however, due to the exceptionally high precious metal values of these concentrates, the concentrates should be readily marketable.
It is strongly recommended that these initial minor element assays are confirmed with additional assaying with element specific techniques. Due to the unusually high grade of the concentrates, advice on the concentrate marketing should also be sought from a concentrate marketing specialist.
13.11 Comment on Metallurgical Sampling
The authors are satisfied that the metallurgical sampling upon which the above results are based are representative of the major styles of mineralization hosted in the Homestake Ridge deposits considering the grade variability, metals distribution, mineralogy and degree of alteration. A long section showing the metallurgical sampling locations in the Homestake Main and Homestake Silver deposits is shown on Figure 13.1. Additional metallurgical sampling and testing will be performed at the Feasibility stage.
13.12 Qualified Persons Opinion
The report authors are satisfied there are no other metallurgical or metal recovery factors that could impact the recovery of metals, the sale-ability of concentrates, or the potential for economic extraction.
Effective Date: May 29, 2020 Project No. TRQ-06 | |
|
Page 13-7
Source: Auryn
Figure 13.1: Metallurgical Sample Locations
Effective Date: May 29, 2020 Project No. TRQ-06 | |
|
Page 13-8
14. MINERAL RESOURCE ESTIMATES
Auryn updated the Mineral Resource estimate for the Project using block models constrained by new wireframe models. Grades for gold, silver, copper, lead, arsenic and antimony were estimated into the blocks using inverse distance cubed (ID3) weighting. Two block models, one for the HM and HS, and another for the SR, were created using Leapfrog . Block sizes for both models were 5 m x 5 m x 5 m, subdivided in places to 0.5 m x 0.5 m x 0.5 m for better representation of mineralized zones. The wireframe models were constructed in Leapfrog by Auryn personnel. These wireframes include new drilling completed by Auryn during the 2017 to 2018 field season at the SR and the 2017 to 2018 core re-logging data focused on logging fluid pathway features. The assay data comprised drilling and trench sampling results from programs conducted by Auryn.
RPA’s audit focused on HM and HS, since they represent the vast majority of the Mineral Resource tonnage, and the methodology for the SR model is similar. Based on the audit review, RPA is of the opinion that the Mineral Resource estimation methodology and procedures used by Auryn are reasonable and acceptable. The Auryn procedures and RPA audit comments are documented in the following sections.
14.1 Resource Database
There are 377 drill holes and trenches in the Mineral Resource database, 43 of which were drilled since the previous Mineral Resource estimate was performed by RPA in 2013 and updated in 2017. A number of these holes were drilled on exploration targets remote from the Mineral Resource area and were not used for the Mineral Resource estimate. One drill hole (HR08-80) was excluded from the resource estimate as it is parallel to the zone.
Records from 270 drill holes were used for mineralized zone modelling. Of these, only 202 holes intersect interpreted zones used in the Mineral Resource estimation. There are 43,779 assays in the master acQuire assay database, of which 1,136 (685 in the HM, 396 in the HS, and 55 in the SR) are within interpreted zones (wireframes) in the Mineral Resource database. The Mineral Resource database includes tables for downhole surveys, lithology, and bulk density. The assay table contains results for gold, silver, and copper, as well as a suite of elements from ICP analyses.
Sample lengths within mineralized zones range from 0.15 m to 3.3 m. Orientations of both the holes and the mineralized zones vary significantly, so the apparent width of zones often differs substantially from the true width.
Effective Date: May 29, 2020 Project No. TRQ-06 | |
|
Page 14-1
RPA reviewed the methods and procedures used by Auryn to generate the Mineral Resource database including drilling, sampling, analysis, and data entry. RPA found the work to be appropriate for the deposit type and project goals, and the data to be suitable for Mineral Resource estimation. Mineral Resource assay statistics are listed in Table 14-1.
Mineral Resource Assay Statistics
| Zone and Statistic | Au(ppm) | Ag(ppm) | Cu(ppm) | Pb(ppm) | As(ppm) | Sb(ppm) | Length(m) |
| HM (Homestake Main) |
| Count | 685 | 685 | 666 | 666 | 638 | 638 | 685 |
| Length | 852.20 | 852.20 | 832.05 | 832.05 | 804.13 | 804.13 | 852.20 |
| Mean | 7.75 | 68.6 | 2112 | 981 | 194.7 | 84 | 1.24 |
| Standard deviation | 35.02 | 367.4 | 5549 | 4834 | 338.7 | 313 | 0.52 |
| Coefficient of variation | 4.53 | 5.36 | 2.63 | 4.93 | 1.74 | 3.73 | 0.42 |
| Minimum | 0 | 0 | 2 | 1.2 | 3.2 | 1 | 0.15 |
| Median | 2.31 | 6.5 | 140.1 | 61.3 | 101 | 15.8 | 1.15 |
| Maximum | 696.41 | 6798 | 69590 | 149600 | 4946 | 4000 | 3.30 |
| HS (Homestake Silver) |
| Count | 396 | 396 | 396 | 396 | 396 | 396 | 396 |
| Length | 486.70 | 486.70 | 486.70 | 486.70 | 486.70 | 486.70 | 486.70 |
| Mean | 3.49 | 154.2 | 280 | 1899 | 151.5 | 120 | 1.23 |
| Standard deviation | 9.57 | 499.7 | 556 | 7116 | 193.9 | 218 | 0.41 |
| Coefficient of variation | 2.74 | 3.24 | 1.99 | 3.75 | 1.28 | 1.82 | 0.34 |
| Minimum | 0.002 | 0.05 | 1 | 1 | 2 | 2.5 | 0.25 |
| Median | 1.51 | 23.1 | 99.7 | 227.1 | 91 | 47.1 | 1.20 |
| Maximum | 129.46 | 9027 | 4602.6 | 126700 | 1209 | 2369.1 | 2.90 |
| SR (South Reef) |
| Count | 55 | 55 | 55 | 55 | 55 | 55 | 55 |
| Length | 75.95 | 75.95 | 75.95 | 75.95 | 75.95 | 75.95 | 75.95 |
| Mean | 5.91 | 5.8 | 475 | 10 | 60.9 | 5 | 1.38 |
| Standard deviation | 10.91 | 11.1 | 1582 | 7 | 46.7 | 3 | 0.57 |
| Coefficient of variation | 1.84 | 1.91 | 3.33 | 0.71 | 0.77 | 0.60 | 0.42 |
| Minimum | 0.032 | 0.24 | 5.4 | 2.1 | 6.8 | 1.8 | 0.35 |
| Median | 2.07 | 2.49 | 39.1 | 7.2 | 52.8 | 4.3 | 1.25 |
| Maximum | 58.1 | 61.8 | 8899.7 | 33 | 223 | 14 | 2.00 |
Source: Auryn, 2019
Effective Date: May 29, 2020 Project No. TRQ-06 | |
|
Page 14-2
14.2 Geological Interpretation
Wireframe models of the mineralized zones were constructed in Leapfrog using a nominal 2.3 g/t AuEq cut-off grade over a minimum horizontal width of 2.0 m. In some cases, intervals with < 2.0 g/t AuEq, or intervals shorter than two metres, were included into the mineralized zones to preserve continuity. The wireframe models were allowed to extend along strike and down dip to the next drill hole intercept, regardless of distance (generally 100 m or less, due to the drill spacing). On peripheral boundaries, the models were generally constrained to a nominal 50 m distance from the outermost intercept, except for the basal portion of HS.
Auryn constructed low grade envelopes (at a nominal 0.1 g/t AuEq cut-off grade) in Leapfrog to capture some of the remnant assays, and then set the remaining blocks to zero grade. These low grade envelope solids were solely made to allow for some grade in dilution where appropriate. Their morphology is less well-defined than the more accurate vein models, but less important to the model. RPA recommends filtering out external minor inconsequential ‘blobs’ of dilution which occur away from the mineralized zones.
RPA reviewed the geological models for HM and HS in Leapfrog (Figure 14.1), and also compared them against the vein models of the previous Mineral Resource estimate (RPA, 2017). RPA is of the opinion that the vein solids appear to be better correlated as compared to the previous estimate.
Effective Date: May 29, 2020 Project No. TRQ-06 | |
|
Page 14-3
Source: RPA
Figure 14.1: Oblique View of HM (Left Side) And HS (Right Side) Veins
The HM and HS use slightly different methods with respect to how the veins pinchout. RPA notes that the vein solids are constructed using both a 0.2 m minimum thickness in the HM, but pinches out to zero thickness in the HS. Also, the deeper part of the HS has only been partially clipped to a polygonal boundary, many zones extend to the bottom of the model as the vein thickness approaches zero.
RPA reviewed the modelled vein sets in plan and sections and noted that significant proportions of the veins fall below the minimum nominal two metre horizontal thickness. RPA flagged the block model for horizontal thickness (TH) at regularly-spaced intervals, and calculated grade X horizontal thickness (GTH) for each block in order to determine how much of the deposit falls below a GTH threshold of 4.0 (2.0 g/t AuEq minimum cut-off grade at 2.0 m minimum TH, as per the Mineral Resource footnotes). RPA found that approximately 18 percent of the Mineral Resource tonnes above the cut-off grade occur in vein material one metre wide or less.
Effective Date: May 29, 2020 Project No. TRQ-06 | |
|
Page 14-4
For the next Mineral Resource estimate, RPA recommends updating the geological model with a minimum thickness integrated into the vein solids and making minor changes to the vein modelling methodology in the HS to be more in line with the methodology employed for the HM and eliminate minor pinchout artifacts in the peripheral HS material.
14.3 True Thickness
RPA flagged all blocks for “true thickness” (TT) by creating an array of intercepts perpendicular to the main trend of the zones and performing nearest neighbour (NN) estimate on the intercept centroids. A histogram of Mineral Resource blocks that meet the grade X true thickness (GTT) cut-off of 4.0 is shown in Figure 14.2.
Source: RPA
Figure 14.2: Histogram of TT Where GTT > 4.0
Effective Date: May 29, 2020 Project No. TRQ-06 | |
|
Page 14-5
RPA considers the geological modelling for 2019 to be of sufficient quality for Mineral Resource estimation.
14.4 reatment of High-Grade Assays
14.4.1 Capping Levels
Auryn performed capping on individual veins (domains) based on composite histograms and probability plots. RPA reviewed Auryn’s capping levels and performed its own independent capping checks on both assays and composites. RPA prefers to cap assays rather than composites to avoid bias caused by smearing very narrow, high grade samples into much longer composites. However, the Project sample population does not generally contain extremely high grade, narrow samples. Capping levels and statistics are shown in Table 14-2 and Table 14-3.
Capping: Au and Ag
| Domain | Element | Composites | Cap | Capped Count | Non- CappedMean | CappedMean | % Diff |
| hm_02 | Au (ppm) | 104 | 100 | 4 | 15.03 | 10.09 | -33% |
| hm_03 | Au (ppm) | 64 | 90 | 1 | 6.76 | 6.52 | -4% |
| hm_07 | Au (ppm) | 66 | 30 | 1 | 6.30 | 5.80 | -8% |
| hm_08 | Au (ppm) | 69 | 60 | 2 | 7.90 | 7.24 | -8% |
| hs_03 | Au (ppm) | 47 | 40 | 1 | 5.36 | 3.79 | -29 |
| hs_04 | Au (ppm) | 35 | 40 | 1 | 4.23 | 4.08 | -4% |
| hs_lg | Au (ppm) | 1,238 | 2 | 7 | 0.209 | 0.208 | -0.5% |
| sr_01 | Au (ppm) | 25 | 35 | 1 | 4.78 | 4.53 | -5% |
| sr_02 | Au (ppm) | 15 | 35 | 1 | 11.25 | 10.33 | -8% |
| | | | | | | | |
| hm_07 | Ag (ppm) | 66 | 1,000 | 2 | 15.1 | 10.1 | -33% |
| hm_08 | Ag (ppm) | 69 | 2,000 | 2 | 6.8 | 6.5 | -4% |
| hm_09 | Ag (ppm) | 15 | 1,000 | 1 | 6.3 | 5.8 | -8% |
| hm_lg | Ag (ppm) | 1,853 | 50 | 7 | 7.9 | 7.2 | -8% |
| hs_01 | Ag (ppm) | 26 | 500 | 2 | 5.4 | 3.79 | -29 |
| hs_02 | Ag (ppm) | 45 | 500 | 2 | 4.2 | 4.08 | -4% |
| hs_04 | Ag (ppm) | 35 | 1,500 | 3 | 0.209 | 0.208 | -0.5% |
| hs_05 | Ag (ppm) | 35 | 500 | 1 | 4.8 | 4.5 | -5% |
| hs_06 | Ag (ppm) | 55 | 2000 | 1 | 11.3 | 10.3 | -8% |
Effective Date: May 29, 2020 Project No. TRQ-06 | |
|
Page 14-6
RPA is of the opinion that capping levels are generally reasonable. Since capping is performed on a per domain basis, it is possible that small sample populations in each domain are leading to capping levels that may be unfair to the overall grade in some circumstances. RPA recommends reviewing the capping in future estimates, to see whether capping by zone would be more appropriate than capping by domain.
Capping: Cu, Pb, As, Sb
| Zone | Element | Composites | Cap | Capped Count | Non- CappedMean | CappedMean | % Diff |
| hm_01 | Cu (ppm) | 31 | 8,000 | 1 | 625 | 528 | -16% |
| hm_02 | Cu (ppm) | 95 | 20,000 | 3 | 3,032 | 2,739 | -10% |
| hm_03 | Cu (ppm) | 64 | 10,000 | 2 | 2,258 | 2,161 | -4% |
| hm_05 | Cu (ppm) | 55 | 20,000 | 2 | 2,301 | 2,037 | -11% |
| hm_07 | Cu (ppm) | 66 | 25,000 | 3 | 3,726 | 3,532 | -5% |
| hm_08 | Cu (ppm) | 68 | 10,000 | 3 | 1,474 | 1,330 | -10% |
| hm_lg | Cu (ppm) | 1,798 | 4,000 | 3 | 124 | 123 | -1% |
| hs_01 | Cu (ppm) | 26 | 3,000 | 1 | 261 | 250 | -4% |
| hs_03 | Cu (ppm) | 48 | 2,500 | 1 | 244 | 239 | -2% |
| hs_04 | Cu (ppm) | 35 | 2,500 | 1 | 404 | 388 | -4% |
| hs_lg | Cu (ppm) | 1,238 | 1,500 | 4 | 71 | 67 | -6% |
| sr_01 | Cu (ppm) | 25 | 3,000 | 1 | 440 | 262 | -40% |
| sr_02 | Cu (ppm) | 15 | 3,000 | 1 | 576 | 350 | -39% |
| hm_01 | Pb (ppm) | 31 | 5,000 | 1 | 536 | 385 | -28% |
| hm_02 | Pb (ppm) | 104 | 5,000 | 3 | 730 | 692 | -5% |
| hm_03 | Pb (ppm) | 64 | 15,000 | 1 | 1,710 | 1,404 | -18% |
| hm_05 | Pb (ppm) | 55 | 15,000 | 1 | 1,417 | 989 | -30% |
| hm_07 | Pb (ppm) | 66 | 10,000 | 1 | 644 | 599 | -7% |
| hm_08 | Pb (ppm) | 69 | 10,000 | 1 | 1,078 | 849 | -21% |
| hm_09 | Pb (ppm) | 15 | 10,000 | 1 | 1,894 | 1,822 | -4% |
| hm_lg | Pb (ppm) | 1,853 | 4,000 | 3 | 114 | 98 | -13% |
| hs_04 | Pb (ppm) | 35 | 25,000 | 1 | 3,566 | 3,454 | -3% |
| hs_06 | Pb (ppm) | 59 | 25,000 | 1 | 3,208 | 2,335 | -27% |
| hs_lg | Pb (ppm) | 1,238 | 4,000 | 8 | 241 | 234 | -3% |
| | | | | | | | |
| hm_lg | As (ppm) | 1,853 | 1,300 | 6 | 103 | 99 | -4% |
| hs_lg | As (ppm) | 1,238 | 1,300 | 2 | 151 | 149 | -1% |
| | | | | | | | |
| hm_lg | Sb (ppm) | 1,853 | 500 | 3 | 16 | 15 | -4% |
Effective Date: May 29, 2020 Project No. TRQ-06 | |
|
Page 14-7
14.5 High-Grade Restriction
No high yield restriction (HYR) was performed on the Mineral Resource model. RPA recommends investigating HYR as a precaution for smearing high grade assays. To date, drill coverage is insufficient to demonstrate that the highest grades in the deposit are being smeared unfairly. RPA recommends checking whether HYR should be implemented as more drilling is completed.
14.6 Compositing
Compositing and capping were done separately ‘on the fly’ for each ID3 or ordinary kriging (OK) estimator, rather than using one Leapfrog composite table for all the estimators. This procedure has the benefit of allowing flexibility in changes during grade estimation, at the cost of having one composite table for all the zones for validation purposes. Compositing is performed inside Leapfrog to a nominal 2 m length, with the remaining subsample length in each zone distributed equally between the intercept composites.
The zones are commonly narrow, and a rigid 2 m composite length would have produced a high number of orphans (short remnants at the margins of the wireframe models). In order to eliminate orphan composites, compositing parameters were adjusted to distribute an orphan sample length equally across all composites in the intercept. For instance, if the intercept length was 5.5 m from hanging wall to footwall contact, instead of two 2.0 m and one 1.5 m composites the software would produce two equal-length composites of 2.75 m each. This produced a range of composite lengths between 0.5 m and 2.99 m. Auryn conducted an analysis to determine if the composite length was correlated with grades. No correlation was found. Unsampled intervals were treated as zero grade for gold and silver, and ignored for copper, lead, arsenic, and antimony. Descriptive statistics for composites in each zone are shown in Table 14-4.
Effective Date: May 29, 2020 Project No. TRQ-06 | |
|
Page 14-8
Composite Statistics
| Zone and Statistic | Au(ppm) | Ag(ppm) | Cu(ppm) | Pb(ppm) | As(ppm) | Sb(ppm) | Length(m) |
| HM | | | | | | | |
| Count | 470 | 470 | 460 | 460 | 443 | 443 | 470 |
| Length (m) | 852.24 | 852.24 | 834.14 | 834.14 | 804.56 | 804.56 | 852.24 |
| Mean | 7.73 | 68.60 | 2,136.00 | 990.00 | 194.90 | 84.00 | 1.81 |
| Standard deviation | 25.03 | 307.60 | 4,803.00 | 3,384.00 | 319.40 | 268.00 | 0.44 |
| Coefficient of variation | 3.24 | 4.49 | 2.25 | 3.42 | 1.64 | 3.19 | 0.25 |
| Minimum | 0.00 | 0.10 | 2.12 | 2.80 | 7.00 | 1.30 | 0.49 |
| Median | 2.78 | 7.30 | 217.00 | 80.00 | 105.20 | 17.00 | 1.90 |
| Maximum | 399.81 | 3,904.30 | 34,780.00 | 38,592.00 | 4,946.00 | 2,851.00 | 2.98 |
| HS | | | | | | | |
| Count | 278 | 278 | 277 | 277 | 277 | 277 | 278 |
| Length | 491.72 | 491.72 | 490.64 | 490.64 | 490.64 | 490.64 | 491.72 |
| Mean | 3.46 | 152.7 | 278 | 1889 | 150.9 | 119 | 1.77 |
| Standard deviation | 8.66 | 373.7 | 476 | 5751 | 180.9 | 182 | 0.50 |
| Coefficient of variation | 2.50 | 2.45 | 1.71 | 3.04 | 1.20 | 1.52 | 0.28 |
| Minimum | 0.000 | 0.00 | 0.00 | 1 | 2 | 2.5 | 0.26 |
| Median | 1.84 | 25.9 | 107 | 347 | 90.1 | 54 | 1.82 |
| Maximum | 115.21 | 4143.0 | 3272 | 72164 | 1132.8 | 1579 | 2.99 |
| SR | | | | | | | |
| Count | 40 | 40 | 40 | 40 | 40 | 40 | 40 |
| Length (m) | 75.52 | 75.52 | 75.52 | 75.52 | 75.52 | 75.52 | 75.52 |
| Mean | 5.95 | 5.80 | 478.00 | 10.00 | 61.10 | 5.00 | 1.89 |
| Standard deviation | 10.08 | 11.10 | 1,490.00 | 7.00 | 45.20 | 3.00 | 0.41 |
| Coefficient of variation | 1.70 | 1.90 | 3.12 | 0.70 | 0.74 | 0.59 | 0.22 |
| Minimum | 0.03 | 0.34 | 7.11 | 2.10 | 6.80 | 1.90 | 0.80 |
| Median | 2.07 | 2.70 | 39.00 | 8.00 | 53.40 | 4.00 | 2.00 |
| Maximum | 46.50 | 61.80 | 7,460.00 | 32.00 | 223.00 | 14.00 | 2.90 |
14.7 Variography
Auryn carried out variogram analyses on the normal score transformed composited samples for gold, silver, and copper in the databases for the HM and gold and silver for the HS. There were not enough composites in the SR to generate meaningful variograms. For each zone, a downhole variogram was generated using all composites within the corresponding zone to estimate the nugget. A summary of the variogram models is provided in Table 14-5.
Effective Date: May 29, 2020 Project No. TRQ-06 | |
|
Page 14-9
NI43-101F1 Technical Report
Variography Results
| | Directions(°) | Normalised Sills(back transformed) | Orientations(°) | Ranges(m) |
| Metal | Model | Dip | Dip Az. | Plunge | Nugget | C1 | Major | Semi | Minor | Major | Semi | Minor |
| HM Combined | | | | | | | | | | | |
| Au | Sph | 71 | 41 | 135 | 0.56 | 0.44 | 40/114 | 44/331 | 19/221 | 80 | 70 | n/a |
| Ag | Sph | 71 | 41 | 75 | 0.42 | 0.58 | 44/152 | 43/308 | 12/230 | 185 | 150 | n/a |
| Cu | Sph | 71 | 41 | 135 | 0.13 | 0.87 | 40/114 | 44/331 | 19/221 | 120 | 120 | n/a |
| HS Combined | | | | | | | | | | | |
| Au | Sph | 78 | 230 | 165 | 0.45 | 0.55 | 13/143 | 72/278 | 12/230 | 120 | 120 | n/a |
| Ag | Sph | 78 | 230 | 45 | 0.42 | 0.58 | 44/152 | 44/308 | 12/230 | 250 | 180 | n/a |
| Cu | Could not be interpreted | | | | | | | | |
Note:
1.
Sph: spherical structure model applied to the variogram model
Effective Date: May 29, 2020 Project No. TRQ-06:: | |
|
Page 14-10
Homestake Ridge Project
NI43-101F1 Technical Report
RPA reviewed the variograms and found them to be reasonable. Search distances reflect this variography and are appropriate in context of the drill hole spacing. Auryn created ID3 estimators for grade estimation within mineralized zones, and OK estimators for grades within low grade (waste) zones. Estimators for each zone are combined before being added to the Leapfrog block model.
14.8 Search Strategy and Grade Interpolation Parameters
The variogram model ranges for silver and copper are significantly larger (Table 14-5) than those for gold. In RPA’s opinion, for multi-element estimates such as that of the Project the element with the shortest range should dictate what the search distances should be. For the 2010 estimate, this range was set from the gold variogram model at a maximum of 75 m. For this estimate, the maximum range was extended to 100 m, and the interpolations were run in three passes for all estimated elements. In the first pass, the search ellipsoid measured 30 m x 30 m x 10 m. For the second and third passes, the search distances were increased to 50 m x 50 m x 15 m and 100 m x 100 m x 25 m, respectively. The 100 m ellipsoid was rarely required for the interpolations since most blocks were captured within the 50 m range. The 75 m range was retained, however, for classification of Inferred Mineral Resources.
The block grade interpolations were constrained to a minimum of three and maximum of eight composites for the first two passes, with a minimum of one and maximum of five for the third. In all passes, the interpolations used a maximum of two composites from a single drill hole. ID3 estimation was used for grade estimation within mineralized zones, and OK estimation for estimating grades within low grade (waste) zones.
As most modelled mineralized zones are undulating, the Leapfrog variable search orientation approach was chosen using modelled mineralized veins for input orientations so that variable orientation searches vary according to the local orientations of the mineralization.
RPA reviewed the variable orientation methodology and noted that the block grades were being interpolated along the vein boundaries as intended, however, this produced the effect of “striping” the grade in parallel trends along vein orientations away from assays. RPA recommends that Auryn review the methodology in future Mineral Resource estimates to determine whether the effect is desirable, and if not, then consider using full-width composites given the drill spacing and the narrow thickness of the veins. RPA does not anticipate that this modification would have a material impact on the Mineral Resource estimate.
Effective Date: May 29, 2020 Project No. TRQ-06 | |
|
Page 14-11
Homestake Ridge Project
NI43-101F1 Technical Report
14.9 Bulk Density
Bulk density measurements collected by Auryn field personnel were used to estimate the densities for each of the zones. Density measurements were taken using a water immersion method on intact pieces of drill core. Results for a total of 11,333 density determinations were collected for the SR holes, although only a small proportion of these measurements were taken in the mineralized zones. 1,717 density measurements were taken on core from within the high-grade zones. The average of the measurements for each domain was assigned as the block density for that domain. Domains hm_02a and hm_10 had no measurements, so the global average for the HM was used.
RPA reviewed the bulk density sampling in plan, section, and oblique views in Leapfrog, and compared the bulk density statistics by zone to the Auryn (2019) report. A plan view of the bulk density measurements is shown in Figure 14.3 . Bulk density statistics by domain are reproduced from the Auryn (2019) report and are listed in Table 14-6 and Table 14-7.
RPA is of the opinion that bulk density measurement methodology, distribution, and coverage are appropriate for the deposit.
Effective Date: May 29, 2020 Project No. TRQ-06 | |
|
Page 14-12
Homestake Ridge Project
NI43-101F1 Technical Report
Source: RPA
Figure 14.3: Plan View of Bulk Density Sample Distribution
Effective Date: May 29, 2020 Project No. TRQ-06 | |
|
Page 14-13
Homestake Ridge Project
NI43-101F1 Technical Report
Bulk Density by Zone
| Statistics | Unit | HM | HS | SR | HMLow Grade | HSLow Grade |
| Count | | 602 | 1,065 | 50 | 2,389 | 3,379 |
| Mean | (t/m3) | 2.75 | 2.76 | 3.02 | 2.72 | 2.72 |
| Standard Deviation | | 0.12 | 0.17 | 0.18 | 0.07 | 0.09 |
| Covariance | | 0.04 | 0.06 | 0.06 | 0.02 | 0.03 |
| Minimum | (t/m3) | 2.55 | 2.53 | 2.71 | 2.35 | 2.24 |
| Median | (t/m3) | 2.72 | 2.72 | 2.98 | 2.70 | 2.70 |
| Maximum | (t/m3) | 3.65 | 4.41 | 3.77 | 3.42 | 3.91 |
Bulk Density by Domain
| Zone | Domain | Density(t/m3) | Volume(m3) | Zone | Domain | Density(t/m3) | Volume(m3) |
| HM | hm_01 | 2.81 | 89,990 | HS | hs_01 | 2.71 | 177,430 |
| HM | hm_02 | 2.81 | 155,880 | HS | hs_02 | 2.73 | 355,300 |
| HM | hm_02a | 2.75 | 65,855 | HS | hs_03 | 2.74 | 346,940 |
| HM | hm_03 | 2.71 | 87,627 | HS | hs_04 | 2.82 | 255,650 |
| HM | hm_04 | 2.7 | 34,890 | HS | hs_05 | 2.75 | 192,540 |
| HM | hm_05 | 2.69 | 99,314 | HS | hs_06 | 2.78 | 283,590 |
| HM | hm_06 | 2.72 | 5,757 | HS | hs_07 | 2.75 | 81,830 |
| HM | hm_07 | 2.71 | 221,290 | HS | hs_08 | 2.78 | 8,320 |
| HM | hm_08 | 2.75 | 234,820 | HS | hs_09 | 2.77 | 58,850 |
| HM | hm_09 | 2.75 | 25,069 | HS | hs_lg | 2.72 | 12,307,000 |
| HM | hm_10 | 2.75 | 12,295 | SR | sr_01 | 3.03 | 122,780 |
| HM | hm_11 | 2.76 | 79,207 | SR | sr_02 | 3.01 | 80,310 |
| HM | hm_lg | 2.72 | 7,652,900 | | | | |
14.10 Block Models
Auryn prepared two Mineral Resource block models using Leapfrog Edge software: one for the HM+HS and one for the SR. All were arrays of blocks measuring 5 m x 5 m x 5 m and further subdivided where needed to 0.5 m x 0.5 m x 0.5 m in order to better model boundaries within the model space. All variables were estimated for the parent blocks first and then block values were assigned only to the sub-blocks that were within modelled wireframes. Models were rotated relative to the survey grid so as to be aligned with the general strike of the mineralization – 325° clockwise for the HM+HS model, and 305° clockwise for the SR model. All coordinates are in UTM NAD83 Zone 9N. A plan view of both models is shown in Figure 14.4. Block model parameters are listed in Table 14-8 and Table 14-9. Key block model variables are described in Table 14-10.
Effective Date: May 29, 2020 Project No. TRQ-06 | |
|
Page 14-14
Homestake Ridge Project
NI43-101F1 Technical Report
The sub-celled block size inside veins is very small (0.5 m) relative to the drill spacing. RPA understands that this size was used by Auryn to preserve the shape of the narrow veins in the sub-blocked model. RPA is of the opinion that the block model schemas are appropriate to the style of mineralization and the morphology of the mineralized zones.
Block Model Geometry: HM and HS
| Parameter | Value/Description |
| Dip | 0.0 degrees (rotate around the X axis down from the horizontal plane) |
| Azimuth | 325.0 degrees (then rotate clockwise around the Z axis when looking down) |
| Parent block size | 5m x 5m x 5m |
| Size in parent blocks | 100 m x 383 m x 180 m = 6,894,000 m3 |
| Minimum parent centroid | 463600.6139 6178103.4818 252.5 |
| Maximum parent centroid | 462910.5632 6179951.9826 1147.5 |
| Minimum parent corner | 463600 6178100 250 |
| Maximum parent corner | 462911.1771 6179955.4644 1150 |
| Sub-blocks along X axis | 10 |
| Sub-blocks along Y axis | 10 |
| Sub-blocks along Z axis | variable, minimum size 0.5 |
Effective Date: May 29, 2020 Project No. TRQ-06 | |
|
Page 14-15
Homestake Ridge Project
NI43-101F1 Technical Report
Block Model Geometry: SR
| Parameter | Value/Description |
| Dip | 0.0 degrees (rotate around the X axis down from the horizontal plane) |
| Azimuth | 305.0 degrees (then rotate clockwise around the Z axis when looking down) |
| Parent block size | 5m x 5m x 5m |
| Size in parent blocks | 64 x 112 x 88 = 630,784 m3 |
| Minimum parent centroid | 463519.3861 6177383.4818 782.5 |
| Maximum parent centroid | 463245.4333 6177959.8496 1217.5 |
| Minimum parent corner | 463520 6177380 780 |
| Maximum parent corner | 463244.8193 6177963.3315 1220 |
| Sub-blocks along X axis | 10 |
| Sub-blocks along Y axis | 10 |
| Sub-blocks along Z axis | variable, minimum size 0.5 |
Key Block Model Variables
| Variable | Description |
| Au_ppm | Au ID3 estimate (Au OK estimate for low grade/waste zones) |
| Ag_ppm | Ag ID3 estimate (Ag OK estimate for low grade/waste zones) |
| Cu_pct | Cu ID3estimate (Cu OK estimate for low grade/waste zones) |
| Pb_pct | Pb ID3estimate (Pb OK estimate for low grade/waste zones) |
| As_ppm | As ID3estimate (As OK estimate for low grade/waste zones) |
| Sb_ppm | Sb ID3estimate (Au OK estimate for low grade/waste zones) |
| Au_ppm | Au ID3estimate (Au OK estimate for low grade/waste zones) |
| AuEq_ppm | Calculated AuEq |
| NSR | Calculated NSR |
| rescat | Resource category (Ind, Inf, None) |
| density | Bulk density |
| Zone | Homestake Ridge Zone (HM, HS, SR) |
| Domain | Modelled mineralized domain (hm_01…hm_11, hs_01…hs_09, sr01 – sr_02, hm_lg, hs_lg) |
| MinDist | Distance to nearest composite (isotropic) |
| Samples | Number of composites used for block estimation |
| AvDist | Average distance to composites used for block estimation (isotropic) |
| EstPass | Estimation pass # |
| | |
Effective Date: May 29, 2020 Project No. TRQ-06 | |
|
Page 14-16
Homestake Ridge Project
NI43-101F1 Technical Report
Figure 14.4: Plan View of Block Models
Effective Date: May 29, 2020 Project No. TRQ-06 | |
|
Page 14-17
Homestake Ridge Project
NI43-101F1 Technical Report
14.11 Cut-off Grade
The same cut-off grade was used for the purpose of this Mineral Resource estimation as in RPA (2017), as described on pages 14-29 and 14-30 of the NI43-101 Technical Report.
The cut-off grade was applied using AuEq values calculated from the interpolated grade of each block and assumed metal prices, mill recoveries, and smelter terms:
Metal prices:
Mill recoveries:
C$:US$ Exchange Rate:1.2:1
The AuEq calculation included provisions for treatment charges, refining costs, and transportation. Metallurgical recoveries were based on test work completed by Homestake. It was assumed that the mill process would comprise conventional grinding, gravity separation, and flotation. Two mill circuits were contemplated, one producing a copper concentrate and the other a bulk concentrate. The copper circuit would treat only copper-rich material, which was defined in the model as anything with a grade of 0.1 percent Cu or higher. Separate estimates of the AuEq for each of the copper and bulk concentrates were derived. Multipliers were derived for estimation of the NSR for each unit (i.e. g/t or percent) of metal in the resource blocks which were then converted to AuEq. For the copper-rich blocks these multipliers were as follows:
■
Silver – US$0.62 per g/t Ag
■
Gold – US$42.79 per g/t Au
■
Copper – US$42.82 per percent Cu
Effective Date: May 29, 2020 Project No. TRQ-06 | |
|
Page 14-18
Homestake Ridge Project
NI43-101F1 Technical Report
For the copper-poor portion, the multipliers were:
■
Silver – US$0.56 per g/t Ag
■
Gold – US$39.26 per g/t Au
The AuEq value was assigned to the blocks by dividing the NSR total by the gold factor. A cut-off of 2 g/t AuEq was used to select blocks to be included in the Mineral Resources. The cost cutoff was derived from RPA’s experience with similar projects.
RPA reviewed these assumptions in the context of the updated Mineral Resource and confirms that overall they continue to be reasonable. Further stope optimization will determine how much of the Mineral Resource would be discarded due to low grades or insufficient mining widths.
14.12 Classification
CIM (2014) definitions were used for Mineral Resource classification. As per CIM (2014) definitions, a Mineral Resource is defined as “a concentration or occurrence of solid material of economic interest in or on the Earth’s crust in such form, grade or quality and quantity that there are reasonable prospects for eventual economic extraction”. Mineral Resources are classified into Measured, Indicated, and Inferred categories. A Mineral Reserve is defined as the “economically mineable part of a Measured and/or Indicated Mineral Resource” demonstrated by studies at Pre-Feasibility or Feasibility level as appropriate. Mineral Reserves are classified into Proven and Probable categories.
Per Auryn (2019), blocks within 75 m of a composite were provisionally assigned to the Inferred category. This distance was derived from the variogram analysis for gold in the zones. Blocks in the HM within 20 m of the nearest composite, and estimated by composites from at least two drill holes, were provisionally upgraded to the Indicated category. Auryn then performed a manual reclassification of the blocks, adhering to the following general guidelines recommended by RPA for manual smoothing of classification produced by algorithmic methods:
■
The Indicated to Inferred classification boundary should consider the grade trends.
■
Areas of higher grade Indicated blocks should be reviewed with respect to the adjacent drill holes to ensure that high grade blocks are associated with at least two, preferably three, high grade drill holes.
■
Peripheral low grade intercepts should be excluded from a class, and possibly the domain before grade estimation.
Effective Date: May 29, 2020 Project No. TRQ-06 | |
|
Page 14-19
Homestake Ridge Project
NI43-101F1 Technical Report
■
Classification area geometry should be smoothed and reflect supporting two dimensional arrays of holes.
■
One dimensional rows of holes do not support Indicated material.
■
Isolated islands of other classes can be variably retained or smoothed depending on changes in grade and the desire to drill infill holes in those areas.
■
In areas where there is ambiguity with respect to which class should be assigned, decisions should be made including thickness and grade continuities in that volume.
■
Isolated one hole intercepts should not be classified as Indicated.
■
Material “trading” between classes as a result of these practices may result in neutral tonnage changes.
■
Avoid placing classification boundaries on drill hole intercepts.
RPA reviewed the classification criteria and results and is of the opinion that, overall, they are appropriate and reasonable.
14.13 Block Model Validation
Auryn validated the block models using the following methods:
■
Visual comparisons of drill holes and estimated block grades (e.g. Figure 14.5).
■
Statistical comparison of mean composite grades and block model grades (Table 14-11)
■
Examining swath plots of the block grades estimated by ID3 and block grades estimated using the NN method (e.g) Figure 14.6.
The block grades were observed to honour the local composite grades reasonably well. Remote sections of the domains, informed by composites from only one hole or sometimes even just one composite, tended to be poorly estimated. Often large numbers of these outermost blocks ended up with the same grade, which could tend to bias the global average grade. Additional definition drilling would be required to improve the block grade estimates for these areas. These peripheral blocks included in the Mineral Resources were classified as Inferred.
RPA’s comparison of block versus composite statistics showed some marked differences in the block means relative to the sample means. Review of the samples in longitudinal section found that the statistical discrepancies were primarily an artifact of declustering of composite grades during the estimation process.
Effective Date: May 29, 2020 Project No. TRQ-06 | |
|
Page 14-20
Homestake Ridge Project
NI43-101F1 Technical Report
RPA performed visual validation of composite versus block grades in longitudinal sections for all domains in the HM and HS and generated its own swath plots. RPA found that block grade distribution is in general accord with composite grades.
Statistical Comparison of Block Model Grades
| | Composites(Capped, Not Weighted) | Blocks | Percent Difference |
| Domain | Gold (g/t Au) | Silver (g/t Ag) | Copper (% Cu) | Gold (g/t Au) | Silver (g/t Ag) | Copper (% Cu) | Gold | Silver | Copper |
| hm_01 | 4.81 | 4.3 | 0.053 | 4.86 | 9.6 | 0.078 | 1% | 125% | 47% |
| hm_02 | 10.09 | 17.7 | 0.274 | 8.1 | 16.1 | 0.324 | -20% | -9% | 18% |
| hm_02a | 5.13 | 8.8 | 0.151 | 5.56 | 5.8 | 0.134 | 8% | -34% | -11% |
| hm_03 | 6.52 | 20.8 | 0.216 | 5.81 | 20 | 0.192 | -11% | -4% | -11% |
| hm_04 | 3.36 | 7.7 | 0.091 | 2.95 | 7.7 | 0.082 | -12% | -1% | -10% |
| hm_05 | 3.17 | 15.5 | 0.204 | 3.07 | 17.6 | 0.287 | -3% | 14% | 41% |
| hm_06 | 3.37 | 5.5 | 0.006 | 3.45 | 5.5 | 0.006 | 2% | 0% | 9% |
| hm_07 | 5.8 | 82 | 0.353 | 5.42 | 34.9 | 0.558 | -6% | -57% | 58% |
| hm_08 | 7.34 | 105.7 | 0.133 | 6.7 | 64.8 | 0.186 | -9% | -39% | 40% |
| hm_09 | 1.75 | 386.7 | 0.027 | 1.58 | 328.5 | 0.022 | -10% | -15% | -20% |
| hm_10 | 0.74 | 430.6 | 0.019 | 0.86 | 517.6 | 0.023 | 16% | 20% | 18% |
| hm_11 | 4.83 | 5.6 | 0.096 | 5.1 | 4.7 | 0.154 | 6% | -17% | 61% |
| hs_01 | 1.22 | 95.4 | 0.025 | 0.98 | 96.3 | 0.022 | -19% | 1% | -11% |
| hs_02 | 3.76 | 72.1 | 0.036 | 3.63 | 61.0 | 0.039 | -3% | -15% | 10% |
| hs_03 | 3.87 | 85.3 | 0.022 | 3.05 | 101.3 | 0.025 | -21% | 19% | 17% |
| hs_04 | 4.08 | 251.5 | 0.039 | 3.22 | 197.1 | 0.031 | -21% | -22% | -21% |
| hs_05 | 3.16 | 56.1 | 0.021 | 3.20 | 51.9 | 0.023 | 1% | -7% | 13% |
| hs_06 | 2.62 | 197.0 | 0.027 | 2.41 | 182.0 | 0.024 | -8% | -8% | -11% |
| hs_07 | 1.24 | 174.3 | 0.022 | 1.00 | 193.5 | 0.020 | -19% | 11% | -12% |
| hs_08 | 4.11 | 156.6 | 0.030 | 4.34 | 148.5 | 0.030 | 6% | -5% | 0% |
| hs_09 | 0.14 | 246.2 | 0.011 | 0.14 | 251.6 | 0.011 | -2% | 2% | 3% |
| sr_01 | 3.78 | 3.5 | 0.022 | 5.59 | 3.6 | 0.025 | 48% | 3% | 11% |
| sr_02 | 10.33 | 8.9 | 0.035 | 7.99 | 9.9 | 0.037 | -23% | 11% | 7% |
Source: Auryn, 2019
Effective Date: May 29, 2020 Project No. TRQ-06 | |
|
Page 14-21
Homestake Ridge Project
NI43-101F1 Technical Report
Source: Auryn, 2019
Figure 14.5: Visual Validation Example
Effective Date: May 29, 2020 Project No. TRQ-06 | |
|
Page 14-22
Homestake Ridge Project
NI43-101F1 Technical Report
Source: Auryn, 2019
Figure 14.6: Swath Plot Example (HM Y and Z, Width 30 m)
Effective Date: May 29, 2020 Project No. TRQ-06 | |
|
Page 14-23
Homestake Ridge Project
NI43-101F1 Technical Report
14.14 Mineral Resource Reporting
Auryn reports Mineral Resources from two separate block models in Leapfrog. Table 14-12 summarizes the December 31, 2019 Mineral Resource estimate for the Project by zone. Both Indicated and Inferred Mineral Resources are reported within modelled vein solids, however, without dilution built into the model.
Mineral Resources – December 31, 2019
Auryn Resources Inc. – Homestake Ridge Project
Classification And Zone | Tonnes (Mt) | Average Grade | Contained Metal |
| Gold(g/t Au) | Silver (g/t Ag) | Copper (% Cu) | Lead(% Pb) | Gold(oz Au) | Silver (Moz Ag) | Copper (Mlb Cu) | Lead (Mlb Pb) |
| Indicated | | | | | | | | | |
| HM | 0.736 | 7.02 | 74.8 | 0.18 | 0.077 | 165,993 | 1.8 | 2.87 | 1.25 |
| Total Indicated | 0.736 | 7.02 | 74.8 | 0.18 | 0.077 | 165,993 | 1.8 | 2.87 | 1.25 |
| | | | | | | | | | |
| Inferred | | | | | | | | | |
| HM | 1.747 | 6.33 | 35.9 | 0.35 | 0.107 | 355,553 | 2.0 | 13.32 | 4.14 |
| HS | 3.354 | 3.13 | 146.0 | 0.03 | 0.178 | 337,013 | 15.7 | 2.19 | 13.20 |
| SR | 0.445 | 8.68 | 4.9 | 0.04 | 0.001 | 124,153 | 0.1 | 0.36 | 0.00 |
| Total Inferred | 5.545 | 4.58 | 100.0 | 0.13 | 0.142 | 816,719 | 17.8 | 15.87 | 17.34 |
Source, Auryn 2019
Notes:
1.
Canadian Institute of Mining, Metallurgy and Petroleum (CIM) Definition Standards for Mineral Resources and Mineral Reserves dated May 10, 2014 (CIM (2014) definitions), as incorporated by reference in NI43-101, were followed for Mineral Resource estimation.
2.
Mineral Resources are estimated at a cut-off grade of 2.0 g/t AuEq.
3.
AuEq values were calculated using a long-term gold price of US$1,300 per ounce, silver price at US$20 per ounce, and copper price at US$2.5 per pound and a US$/C$ exchange rate of 1.2. The AuEq calculation included provisions for metallurgical recoveries, treatment charges, refining costs, and transportation.
4.
Bulk density ranges from 2.69 t/m3 to 3.03 t/m3 depending on the domain.
5.
Differences may occur in totals due to rounding.
6.
The Qualified Person responsible for this Mineral Resource Estimate is Philip A. Geusebroek of Roscoe Postle Associates Inc. (RPA), now part of SLR Consulting Ltd (SLR).
7.
The reader is cautioned that Mineral Resources that are not Mineral Reserves do not have demonstrated economic viability.
Effective Date: May 29, 2020 Project No. TRQ-06 | |
|
Page 14-24
Homestake Ridge Project
NI43-101F1 Technical Report
8.
HM=Homestake Main Zone, HS= Homestake Silver Zone, and SR= South Reef Zone.
Mineral Resource sensitivity to cut-off grade is shown in Table 14-13. Deleterious elements also estimated in the Mineral Resource model are listed by Mineral Resource category, at the 2.0 g/t AuEq Mineral Resource base case cut-off, in Table 14-14.
Mineral Resources – Sensitivity by Cut-Off Grade
Auryn Resources Inc. – Homestake Ridge Project
| Cut-off(g/t AuEg) | Tonnes (Mt) | Average Grade | Metal Content |
| Gold (g/t Au) | Silver (g/t Ag) | Copper (g/t Cu) | Lead(% Pb) | Gold (goz Au) | Silver (Moz Ag) | Copper (Mlb Cu) | Lead (Mlb Pb) |
| Total Indicated |
| 5.0 | 0.372 | 10.99 | 131.3 | 0.20 | 0.120 | 131,463 | 1.6 | 1.7 | 0.99 |
| 4.0 | 0.465 | 9.57 | 111.2 | 0.20 | 0.105 | 142,911 | 1.7 | 2.0 | 1.07 |
| 3.0 | 0.592 | 8.18 | 90.5 | 0.19 | 0.090 | 155,730 | 1.7 | 2.5 | 1.18 |
| 2.0* | 0.736 | 7.02 | 74.8 | 0.18 | 0.077 | 165,993 | 1.8 | 2.9 | 1.25 |
| 1.0 | 0.862 | 6.19 | 65.2 | 0.17 | 0.069 | 171,441 | 1.8 | 3.1 | 1.32 |
| Total Inferred |
| 5.0 | 2.158 | 8.25 | 145.7 | 0.21 | 0.216 | 572,444 | 10.1 | 9.8 | 10.26 |
| 4.0 | 2.972 | 6.78 | 133.4 | 0.18 | 0.189 | 648,212 | 12.8 | 11.9 | 12.36 |
| 3.0 | 4.136 | 5.52 | 118.6 | 0.15 | 0.163 | 734,275 | 15.8 | 14.0 | 14.84 |
| 2.0 | 5.545 | 4.58 | 100.0 | 0.13 | 0.142 | 816,719 | 17.8 | 15.9 | 17.34 |
| 1.0 | 6.448 | 4.09 | 90.9 | 0.12 | 0.127 | 847,996 | 18.9 | 17.0 | 18.07 |
Source, Auryn 2019
Notes:
1.
CIM (2014) definitions were followed for Mineral Resource estimation.
2.
Mineral Resources are estimated at a cut-off grade of 2.0 g/t AuEq.
3.
AuEq values were calculated using a long-term gold price of US$1,300 per ounce, silver price at US$20 per ounce, and copper price at US$2.5 per pound and a US$/C$ exchange rate of 1.2.
4.
Bulk density ranges from 2.69 t/m3 to 3.03 t/m3 depending on the domain.
5.
Differences may occur in totals due to rounding.
6.
The Qualified Person responsible for this Mineral Resource Estimate is Philip A. Geusebroek of RPA.
Effective Date: May 29, 2020 Project No. TRQ-06 | |
|
Page 14-25
Homestake Ridge Project
NI43-101F1 Technical Report
Deleterious Element Content of Mineral Resources
| Classification by Zone | | Average Grade | Metal Content |
Tonnage (Mt) | Arsenic (ppm As) | Antimony (ppm Sb) | Arsenic (t As) | Antimony (t Sb) |
| Indicated | | | | | |
| HM | 0.736 | 241 | 91 | 177 | 67 |
| Total Indicated | 0.736 | 241 | 91 | 177 | 67 |
| | | | | | |
| Inferred | | | | | |
| HM | 1.747 | 137 | 93 | 239 | 163 |
| HS | 3.354 | 141 | 128 | 473 | 428 |
| SR | 0.445 | 58 | 5 | 26 | 2 |
| Total Inferred | 5.545 | 133 | 107 | 738 | 593 |
Note:
1.
Numbers may not add due to rounding.
14.15 Comparison to Previous Estimates
The previous Mineral Resources estimate for the Project, effective as of September 1, 2017, is described in detail in the NI43-101 report prepared by RPA and dated October 23, 2017 (RPA, 2017). A comparison of the 2017 and 2019 estimates is presented in Table 14-15.
Effective Date: May 29, 2020 Project No. TRQ-06 | |
|
Page 14-26
Homestake Ridge Project
NI43-101F1 Technical Report
Comparison of 2017 and 2019 Mineral Resource Estimates
| Classification and Zone | Tonnes (Mt) | Average Grade | Contained Metal |
| Gold (g/t Au) | Silver (g/t Ag) | Copper (g/t Cu) | Gold(goz Au) | Silver (Moz Ag) | Copper (Mlb Cu) |
| 2017 |
| Indicated | | | | | | | |
| HM | 0.624 | 6.25 | 47.9 | 0.18 | 125,000 | 1.00 | 2.40 |
| Total Indicated | 0.624 | 6.25 | 47.9 | 0.18 | 125,000 | 1.00 | 2.40 |
| | | | | | | | |
| Inferred | | | | | | | |
| HM | 2.098 | 5.53 | 28.0 | 0.30 | 373,000 | 1.90 | 14.00 |
| HS | 4.810 | 2.71 | 124.4 | 0.02 | 419,000 | 19.20 | 2.60 |
| SR | 0.337 | 12.88 | 3.6 | 0.04 | 140,000 | 0.04 | 0.30 |
| Total Inferred | 7.245 | 4.00 | 90.9 | 0.10 | 932,000 | 21.14 | 16.90 |
| 2019 |
| Indicated | | | | | | | |
| HM | 0.736 | 7.02 | 74.8 | 0.18 | 165,993 | 1.77 | 2.87 |
| Total Indicated | 0.736 | 7.02 | 74.8 | 0.18 | 165,993 | 1.77 | 2.87 |
| | | | | | | | |
| Inferred | | | | | | | |
| HM | 1.747 | 6.33 | 35.9 | 0.35 | 355,553 | 2.02 | 13.32 |
| HS | 3.354 | 3.13 | 146.0 | 0.03 | 337,013 | 15.74 | 2.19 |
| SR | 0.445 | 8.68 | 4.9 | 0.04 | 124,153 | 0.07 | 0.36 |
| Total Inferred | 5.545 | 4.58 | 100.0 | 0.13 | 816,719 | 17.83 | 15.87 |
| Percentage Difference Between the 2017 and 2019 Estimates |
| Indicated | | | | | | | |
| HM | 17.9% | 12.3% | 56.2% | -1.7% | 32.8% | 77.0% | 19.5% |
| Total Indicated | 17.9% | 12.3% | 56.2% | -1.7% | 32.8% | 77.0% | 19.5% |
| | | | | | | | |
| Inferred | | | | | | | |
| HM | -16.7% | 14.5% | 28.2% | 15.3% | -4.7% | 6.1% | -4.9% |
| HS | -30.3% | 15.3% | 17.4% | 48.4% | -19.6% | -18.0% | -15.6% |
| SR | 31.9% | -32.6% | 36.4% | -8.5% | -11.3% | 80.0% | 19.6% |
| Total Inferred | -23.5% | 14.5% | 10.1% | 27.2% | -12.4% | -15.7% | -6.1% |
Effective Date: May 29, 2020 Project No. TRQ-06 | |
|
Page 14-27
Homestake Ridge Project
NI43-101F1 Technical Report
A significant increase in the Indicated Mineral Resources, along with a decrease in Inferred Mineral Resources can be noted. Overall metal contents have decreased in the Inferred category, despite increases in average metal grades. Metal content in the Indicated category has increased in conjunction with gold and silver grades.
The 2019 Mineral Resource estimate was influenced by a number of factors, which had fairly wide ranging impacts. Some influencing factors resulted in increased grades at the expense of tonnage, while others had the opposite effect. RPA is of the opinion that the principal factors driving the observed changes to the Mineral Resource estimates are as follows:
■
A change in the mineralized zone modelling approach.
■
Utilization of a variable search method for grade estimation.
■
Additional drilling in the SR.
The drillholes added at the SR since the last estimate resulted in an increase in tonnage and reduction of gold grade in the SR, which produced a net decrease in overall gold content at SR.
The changes to the mineralized zone modelling approach resulted in less fragmented wireframe models. This increase in model continuity, combined with variable search utilized for grade estimation, contributed to a net increase in the Indicated Mineral Resources at HM, and subsequent decrease in Inferred Mineral Resources.
Similarly, changes to the modelling of mineralization in the HS resulted in removing some of the isolated wireframe fragments of a limited number of high grade intercepts, by integrating them into more continuous mineralized zones. The overall effect of these changes were a net reduction in tonnage and an increase in average metal grades, with a moderate net negative impact to metal content at HS.
14.16 Comments on Section 14
Based on the audit review, RPA is of the opinion that the Mineral Resource estimation methodology and procedures used by Auryn are reasonable and acceptable and that the Mineral Resource estimate complies with the CIM (2014) definitions.
RPA is not aware of any environmental, permitting, legal, title, taxation, socio-economic, marketing, political, or other relevant factors that could materially affect the Mineral Resource estimate.
Effective Date: May 29, 2020 Project No. TRQ-06 | |
|
Page 14-28
15. MINERAL RESERVE ESTIMATES
There are no mineral reserves at Homestake Ridge.
Effective Date: May 29, 2020 Project No. TRQ-06 | |
|
Page 15-1
16. MINING METHODS
16.1 Overview
The PEA mine plan and production schedule were generated with Deswik Stope Optimizer (DSO) software on the basis of an updated geological model provided by Auryn. The updated geological model included new resource wireframes and an updated block model. Payable metals in the model included gold, silver, copper and lead, but did not include zinc.
The updated block model was queried by the Deswik Stope Optimizer (DSO) to produce stope wireframes and a life of mine production schedule for each of the three principal deposits. The DSO program generated all the necessary lateral and vertical development in support of mining.
16.2 Geotechnical Considerations
There have been no geotechnical studies at Homestake Ridge. A preliminary opinion on ground conditions to be expected in the underground mine was based solely on core photographs and rock quality (RQD) measurements in the following exploration drillholes:
■
HR06-30 (Homestake Main)
■
HR09-150 (Homestake Silver)
■
HR10-198 (Homestake Silver)
■
HR10-199 (Homestake Silver)
No rock mass ratings (RMR) are available, however, based on the excellent rock quality observed in the core photographs, it is anticipated that ground conditions will be “good” to “very good” and will support large open spans in the order of 20 m. This needs to be confirmed with a program of geotechnical data collection and analyses.
16.3 Cut-Off Grade
A mining cut-off grade of 3.5 gpt per AuEq oz was used to develop the stope wireframes for mining based on the calculations in Table 16-1 below.
Effective Date: May 29, 2020 Project No. TRQ-06 | |
|
Page 16-1
Cutoff Grade Calculation
| | Rate | Notes |
| Gold Price | US$1,350.00 per oz Au US$43.40 per gram | |
| Foreign Exchange | C$1.00=US$0.70 | |
| Au Recovery Factor | 0.85% | |
| Gross value | C$52.70 | Per gram gold |
| | | |
| All-in operating costs | C$127.70 | Per tonne milled |
| Capitalized Development | C$27.68 | Per tonne milled |
| Contingency | C$31.07 | 20% |
| Onsite Costs | C$186.46 | Per tonne milled |
| Cutoff Grade | 3.53 gpt AuEq | |
16.4 Mining Method
The principal mining method utilized in the DSO runs was longhole stoping (LHOS) based on a 20 m sublevel interval. Each sublevel consists of an ore drive off a spiral ramp connecting to the level access as depicted on Figure 16.1. A minimum mining width of 2.5 m was selected to allow for mechanized mining.
Effective Date: May 29, 2020 Project No. TRQ-06 | |
|
Page 16-2
Source: MineFill Services, Inc.
Figure 16.1: Longhole Open Stoping at Homestake Ridge
16.5 Production Schedule
The main deliverable from the Deswik stope optimizer was a life of mine production schedule based on a combined 900 tpd mill feed rate. This yields a mine life of just under 13 years.
The total mill feed includes roughly 2.87 M stope tonnes, and an additional 0.55 M of mineralized development tonnes for a total of 3.42 Mt. Just under 50 percent of the mineralized tonnes come from the Homestake Main deposit. The Silver deposit contributes another 41 percent, and the South Reef contributes the final 11 percent.
Effective Date: May 29, 2020 Project No. TRQ-06 | |
|
Page 16-3
Life of Mine Production Schedule
| Year | Total (Tonnes) | HM Zone (Tonnes) | HS Zone (Tonnes) | SR Zone (Tonnes) |
| 1 | 61,930 | 61,930 | - | - |
| 2 | 239,574 | 239,574 | - | - |
| 3 | 299,993 | 299,993 | - | - |
| 4 | 299,954 | 299,954 | - | - |
| 5 | 299,925 | 299,925 | - | - |
| 6 | 299,997 | 299,997 | - | - |
| 7 | 299,984 | 144,746 | 155,238 | - |
| 8 | 299,962 | | 299,962 | - |
| 9 | 299,846 | | 299,846 | - |
| 10 | 299,963 | | 299,963 | - |
| 11 | 299,980 | | 248,900 | 51,080 |
| 12 | 300,000 | | 89,712 | 210,289 |
| 13 | 123,666 | | 11,003 | 112,663 |
| LOM | 3,424,755 | 1,646,120 | 1,404,624 | 374,032 |
As required by NI43-101, the author cautions the reader that the PEA is preliminary in nature, that it includes Inferred mineral resources that are considered too speculative geologically to have the economic considerations applied to them that would enable them to be categorized as mineral reserves, and there is no certainty that the preliminary economic assessment will be realized.
Effective Date: May 29, 2020 Project No. TRQ-06 | |
|
Page 16-4
Figure 16.2: Life of Mine Production Schedule
16.6 Dilution
An ELOS (equivalent linear overbreak) of 0.25 m was added at the hangingwall and footwall to account for dilution. The resulting dilution is shown on Table 16-3 below.
Stope Tonnage Dilution
| Zone | Total | HM | HS | SR |
| Stope Tonnes | 2,874,164 | 1,392,472 | 1,174,634 | 307,058 |
| Dilution Tonnes | 393,413 | 171,707 | 129,271 | 92,435 |
| Dilution % | 17.14 | 16.11 | 13.76 | 30.81 |
Effective Date: May 29, 2020 Project No. TRQ-06 | |
|
Page 16-5
16.7 Mine Development
The mine development will be accomplished by mechanized trackless equipment. The PEA mine plan includes a combined 10 km of ramps in the three deposits, 12 km of level access, and another 22 km of ore drives primarily in mineralized material. A summary of the life of mine production development is included in Table 16-4.
Life of Mine Development Lengths
| Year | Total | HM Zone | HS Zone | SR Zone |
| Refuge Bays (m) | 331 | 143 | 162 | 26 |
| Re-muck Bays (m) | 2,398 | 1,034 | 1,034 | 330 |
| Electric-Sub (m) | 369 | 162 | 177 | 30 |
| Sumps (m) | 753 | 353 | 306 | 94 |
| Ramp (m) | 10,106 | 4,461 | 3,640 | 2,006 |
| Level Access (m) | 11,942 | 6,095 | 4,308 | 1,539 |
| Ore Drives (m) | 22,493 | 10,545 | 9,379 | 2,569 |
| Vertical Raise (m) | 1,433 | 634 | 527 | 272 |
| Lateral Development (m) | 26,521 | 12,672 | 9,747 | 4,102 |
| Vertical Development (m) | 1,433 | 634 | 527 | 272 |
Table 16-5 presents a summary of the lateral development openings.
Lateral Development Summary
| Drift Type | Dimensions |
| Refuge Bays | 4.5m H x 4.5m W |
| Re-muck Bays | 4.5m H x 3.7m W x 22m L |
| Electric-Substation | 4.5m H x 4.5m W x 14.5m L |
| Sumps | 4.0m H x 5.0m W x 12.0m L |
| Ramps | 4.5m H x 4.5m W |
| Level Access | 4.5m H x 4.5m W |
| Ore Drives | 3.5m H x 3.5m W |
| Cross Cuts | 3.5m H x 3.5m W |
Effective Date: May 29, 2020 Project No. TRQ-06 | |
|
Page 16-6
16.7.1 Equipment Utilization
The ramps, level access and ancillary openings can be accomplished with mechanized 2-boom jumbos such as the Sandvik DD321, 6.7 tonne LHD’s such as the Sandvik LH307, and mechanized rock bolters such as the Sandvik DS311.
Smaller headings such as the main drives and stope development will be accomplished with smaller 1-boom jumbos such as a Sandvik DD211, 4.5 tonne LHD’s such as the Sandvik LH204, and scissor decks or smaller rock bolters such as a Sandvik DS211.
Ore haulage is expected to comprise small articulated 15-tonne trucks such as a Sandvik TH315.
The expected equipment utilization is summarized on Table 16-6 below.
Major Equipment Utilization (hours x 1000) by Project Year
16.8 Mine Backfill
The primary mining method of longhole retreat stoping will employ the use of uncemented rockfill to backfill the mine voids as the stope advances. Since the mine will advance by overhand methods, the backfill will used as the working floor for mining the stope on the sublevel above.
The following schedule outlines the backfill demand over the life of mine (Table 16-7). The mine is expected to consume roughly 1.2 million m3 of rockfill over the life of the mine, or roughly 275,000 tpa.
Backfill Demand by Project Year (m3)
Effective Date: May 29, 2020 Project No. TRQ-06 | |
|
Page 16-7
16.9 Mine Services
16.9.1 Ventilation
The PEA mine plan includes 1,433 m of vertical raises for ventilation. While no ventilation infrastructure is included in the PEA, the intent is to develop the ramps as fresh-air intakes, and the vertical raises for exhaust. The fan sizing and airflows will be determined in the next phase of study.
16.9.2 Compressed Air
Each of the three mining zones will be supplied with compressed air from a compressor station located near the mine portal. The demand for compressed air will be determined in the next phase of study.
16.9.3 Water
Non-potable water will be provided for industrial uses, and for the underground, such as drilling.
16.9.4 Mine Dewatering
No ground water hydrology studies have been completed to date hence the mine dewatering requirements have not been defined. However, based on the exceptional rock quality and intact nature of the rock mass, groundwater accumulation in the mine is not expected to be an issue. A Feasibility mine plan would include hydrogeological studies and measurements, estimates of groundwater infiltration into the mine, and suitable mine dewatering infrastructure.
16.9.5 Electrical Power
The demand for electrical power has not been estimated at this stage of study, however it is anticipated that each zone will require a substation providing 4160 V and 480 V power to the underground.
16.9.6 Emergency Egress and Refuge
The PEA mine plan includes vertical raises that will serve as a secondary emergency egress in the event of a loss of electrical power or a fire. The mine plan also includes infrastructure for emergency refuge.
Effective Date: May 29, 2020 Project No. TRQ-06 | |
|
Page 16-8
17. RECOVERY METHODS
Processing of Homestake Ridge mineralization will be complicated by the difference in metal contents across the 3 principal deposits. The Homestake Main mineralization is high in copper, low in lead, and moderate in zinc. The Homestake Silver and South Reef mineralization has low copper grades. Homestake Silver has relatively low gold grades but high lead, zinc, and silver grades. South Reef is essentially just gold with a minor amount of copper.
Roughly 81 percent of the gross metal value at Homestake Ridge is gold, another 14 percent is silver, and just over 4 percent is the base metals content. Realization of the value of the Homestake Ridge deposits is obviously dependant on recovery of precious metals rather than base metals. The insitu distribution of metals is shown on Table 17-1 below.
Metals Distribution at Homestake Ridge
| Zone | Au | Ag | Cu | Pb |
| HM | 57.6% | 27.6% | 88.5% | 35.0% |
| HS | 26.4% | 72.0% | 9.1% | 65.0% |
| SR | 16.0% | 0.4% | 2.4% | 0.1% |
17.1 Flowsheet Development
Different processing streams are required to liberate the metals from these deposits. Rather than blending into one process stream, the optimal process strategy appears to be campaign mining and processing: Homestake Main would be exploited first to produce a single copper concentrate; then mining and processing at Homestake Silver to produce a single lead/zinc concentrate. The changeover from the Main to Silver deposits will not require any equipment changes in the grinding circuit, but it may require a change to the grind size, and a change to the chemistry in the flotation circuit.
The process flowsheet consists of:
■
Crushing and grinding to produce a primary grind P80 of 150 to 200 microns
■
Gravity recovery of gold
■
Flotation to produce an initial base metal concentrate
■
Secondary flotation to produce a pyrite concentrate
Effective Date: May 29, 2020 Project No. TRQ-06 | |
|
Page 17-1
■
Regrinding of the pyrite concentrate to a grind P80 of 20 to 25 microns
■
Cyanide leaching of the pyrite concentrate.
Source: Shouldice 2016
Figure 17.1: Proposed Flowsheets for Homestake Main (Copper Circuit) and Homestake Silver (Lead/Zinc Circuit)
Note: The South Reef mineralization would be processed with the Homestake Main material.
Effective Date: May 29, 2020 Project No. TRQ-06 | |
|
Page 17-2
The final metallurgical recoveries to concentrate produced by this flowsheet are shown in Table 17-2 below.
Metallurgical Recoveries
| Metal | Cu Con | Pb Con | Doré | Total |
| Gold | 55% | 65% | 29.2% in Cu con 24.0% in Pb con | 85.5% |
| Silver | 45% | 50% | 22.8% in Cu con 27.3% in Pb con | 74.6% |
| Copper | 75% | | | 74.6% |
| Lead | | 70% | | 45.3% |
The final concentrates are expected to contain the following metal values (Table 17-3):
Concentrate Grades
| Zone | Cu Con | Pb Con | Doré |
| Gold | 555 gpt | 524 gpt | 6.5% |
| Silver | 3,384 gpt | 17,310 gpt | 93.5% |
| Copper | 28% | -- | |
| Lead | -- | 30% | |
Over the life-of-mine the expected concentrate production is shown in Table 17-4.
Concentrate Production – Life of Mine
| | dmt |
| Copper Concentrate | 10,876 dmt |
| Lead Concentrate | 6,006 dmt |
| Doré | 2,583,500 oz |
Effective Date: May 29, 2020 Project No. TRQ-06 | |
|
Page 17-3
17.2 Deleterious Elements
Assays of the final concentrates produced in the laboratory were performed to identify any deleterious elements that may result in penalties by a smelter. The results are shown in Table 17-5 for the copper concentrate, and the lead/zinc concentrate.
Deleterious Elements in the Concentrates
| Product | Cd ppm | Co ppm | Hg ppm | Ni ppm | As % | Sb ppm |
| Copper concentrate | 80 | <30 | 40 | <30 | 0.24 | 5780 |
| Lead/zinc concentrate | 340 | 30 | 180 | 50 | 0.16 | 5780 |
The results show elevated levels of arsenic, antimony and mercury which may trigger smelter penalties. While some smelters may reject concentrates with these levels, it is unlikely to apply to these concentrates due to the exceptionally high precious metal content.
Effective Date: May 29, 2020 Project No. TRQ-06 | |
|
Page 17-4
18. PROJECT INFRASTRUCTURE
There is no existing infrastructure at the Homestake Ridge Project site. The site is remote from any local grid power supply, water supply and direct highway access. The following sections outline the infrastructure development needed for project startup. The final infrastructure plan is shown in Figure 18.1 below.
Source: Auryn
Figure 18.1: Site Development Plan
18.1 Site Access
Development of the Homestake Ridge Project will require the completion of an access road from Alice Arm to the project area. The first 27 km of this road was completed in the early 1900’s, however the last 6.5 km remained as a primitive road. The first 30 km of this road was upgraded in 2004/2005, and again in 2014, by Kitsault Hydroelectric Corporation to provide access to the Kitsault Storage dam hydro scheme.
Effective Date: May 29, 2020 Project No. TRQ-06 | |
|
Page 18-1
The Alice Arm road would be built to Provincial standards to allow the passage of highway legal loads. This final link would create year-round access to regional and provincial highways.
A design for the Alice Arm-Homestake Ridge road link was completed in 2009 in support of plans for development of hydroelectric power on Kitsault Lake. The proposed road configuration includes a one-lane 5 m wide gravel running surface, with pullouts, for a 40 km/hr design speed. The road would likely be operated as radio-controlled limited access haul road similar to a logging road. The road would be designed for 50-tonne GVW loads with a load limit of 80-tonnes.
The proposed route, as shown in Figure 18.2 will require the construction of 6 clear span steel bridges at the Kitsault River, Homestake Creek, and 4 other sites. The remaining non fish-bearing crossings will be done with culverts.
The final road designs include access to the proposed plant site area, and a person-camp.
Source: Auryn
Effective Date: May 29, 2020 Project No. TRQ-06 | |
|
Page 18-2
18.2 Barge Landing
A barge landing will be constructed in Alice Arm at the southern end of the Alice Arm access road to accommodate delivery of fuel, reagents, mine consumables, and construction materials. The barges will be used to ferry materials from the Port of Stewart, some 225 km by sea.
18.3 Power
As has been noted the Homestake Ridge Project site is remote from any existing grid power. The project is expected to require an installed capacity of about 8 MW of power, 24 hours a day, equating to 70 GW-hr of energy consumed annually. At the current BC Hydro bulk industrial rate of C$0.06 per kW-hr that equates to C$4.2 million annually.
Several options are available for supplying power to the project:
■
Construction of a transmission line to connect to an existing grid
■
Construction of a mini-hydro scheme at the project site
■
Installation of diesel generators
■
Installation of gas-powered generators.
Knight Piesold completed a review of the above options in 2011 and the following sections outline their findings.
18.3.1 Transmission Line Alternative
Two connections are possible for connecting to the existing BC Hydro electric grid.
The first is construction of a 32 km transmission line down the Kitsault River valley to connect to the grid in Kitsault. The line would parallel the Alice Arm access road to the head of Alice Arm Inlet. From the line would cross the Kitsault River and travel southeast to the town of Kitsault. This connection is energized at 138 kV. This circuit may have to be upgraded to supply the 8MW demand needed at Homestake Ridge. The estimated cost of this alternative was C$33 million in 2011.
The second option is construction of a 45 km transmission line running east from the north end of Kitsault Lake towards the Niska Mainline road. The line would parallel Niska Mainline road to Niska Creek, then Nass River and finally connecting with the BC Hydro 138 kV transmission line at Highway 37. The estimated cost of this alterative was C$41 million in 2011.
Effective Date: May 29, 2020 Project No. TRQ-06 | |
|
Page 18-3
18.3.2 Hydropower Alternatives
Several run-of-river and stored capacity hydro-electric resources are available in the vicinity of the project. The most attractive run-of-river sites are Homestake Creek, the Upper Kitsault River and the West Kitsault River. Knight Piesold completed a high-level assessment of the Homestake Creek option. Their scheme involved capturing the diversion water from the tailings impoundment and delivering via a 1700 m long penstock to a downstream powerhouse. The cost of this scheme was estimated at C$31 million.
The Homestake project area has historically been the source of five hydroelectric schemes, producing 49 MW of power, including Anyox dam and Kitsault Lake. The last of the projects was abandoned in 1935, however plans are underway to restore some of these historic powerplants. The scheme includes:
■
The 7 MW Kitsault storage dam project which was licensed in 2003
■
The West Kitsault River project which was licensed in 2003
■
The 14 MW Homestake Creek project which was licensed in 2003
■
And the 5 MW Trout Creek project which was licensed in 2005.
Land tenures have been granted for the powerhouses and switchyards, and licenses have been obtained for diversion works and penstock alignments.
It is not known if or when these schemes will be made into reality however the demand created by the construction of a mine could influence the timeline.
18.3.3 Diesel Power Alternative
Based on current fuel prices, diesel electric power is expected to cost in the order of C$0.35 per kW-hr or C$25 million annually. This does not include the capital cost of 8 MW of installed power, or maintenance of the generators, which is expected to cost an additional C$3 million. Based on these costs it can be seen that the construction of a transmission line would be more cost effective even in the short term.
18.4 Water Supply
The Homestake project area has more than adequate local water resources.
Effective Date: May 29, 2020 Project No. TRQ-06 | |
|
Page 18-4
18.5 Waste Rock Storage
The mine will generate roughly 1.60 million tonnes of non-mineralized waste rock over the life of the mine. Based on the preliminary ARD testing the waste rock is expected to be a combination of non-acid generating and potentially acid-generating.
Pre-production development of the underground mine will require the excavation of about 800 metres of access ramps from 3 portals. This will generate roughly 60,000 tonnes of pre-production development waste rock.
Some of the non-acid generating waste is anticipated to be used for construction fill at the mine portal benches, the tailings dam, the plant site platform, and mine roads. Additional waste rock will be generated by mining (internal waste). It is expected that most, if not all, of the remaining waste rock will be used to backfill the longhole stopes to support the mining.
18.6 Tailings Storage Facility
In 2011 Knight Piesold undertook a high-level assessment of potential sites for the storage of tailings at the Homestake Ridge Project. Their assessment was based on the assumption that all of the tailings would need to be disposed on surface and no tailings would be returned underground as backfill.
The design basis for the Knight Piesold assessment was a mineable resource of 4.9 million tonnes at a mill throughput of 1,500 tpd for a 9 year mine life. It is further assumed that some 60,000 tonnes of waste rock will be produced and could be available for construction of facilities.
Knight Piesold noted that there had been no geochemical characterization testwork on either the waste rock or tailings hence it was not known if these materials would be acid generating or not. Any non-acid generating (NAG) waste rock could be used as construction materials, but potentially acid generating (PAG) rock would have to be contained or disposed of sub-aqueously in the tailings storage facility (TSF).
The Knight Piesold assessment narrowed the choices down to 2 sites for conventional slurried tailings disposal, and 2 sites for disposal of tailings filter cake (dry stacking). The steep topography at the project site limits the potential search area to sites south of the proposed mine portals, and at the valley bottom. The four candidate sites (sites A through D) are shown on Figure 18.3 below.
Effective Date: May 29, 2020 Project No. TRQ-06 | |
|
Page 18-5
Source: Knight Piesold 2011
Figure 18.3: Potential Tailings Storage Options
The following text is excerpted from the Knight Piesold letter report dated June 2011.
18.6.1 Slurried Tailings Options – Sites A and B
Slurry tailings would be discharged from the mill circuit at an estimated 30 to 35 percent solids by mass of slurry and would flow by gravity pipeline to the TSF. The slurry would be discharged through multiple offtakes (spigots) from header pipes situated on the embankment crest and around the periphery of the TSF to create low angle beaches that slope away from the confining embankment to a supernatant pond. The estimated lengths of tailings distribution pipelines for Site A and Site B are 1,400 m and 1,800 m, respectively.
Effective Date: May 29, 2020 Project No. TRQ-06 | |
|
Page 18-6
Supernatant pond water would be reclaimed for use as process water in the mill. The reclaim system would consist of either a fixed or floating pump station at the TSF, a reclaim pipeline, and a holding tank or pond at the mill site. The estimated lengths of reclaim pipelines for Site A and Site B are 300 m and 900 m, respectively.
Conventional slurry tailings are conservatively assumed to settle to a dry density of 1.3 t/m3 for storage capacity determination. Based on the 4.9 Mt resource, this equates to a required tailings storage volume of 3.8 Mm3. The tailings would be retained behind an earthfill embankment located across the valley bottom at the downstream end of the facility. It is anticipated that construction of a low permeability zoned embankment may be impractical and a geomembrane liner system would be installed on the upstream embankment face. The embankment would be constructed with 2H:1V upstream and downstream slopes, a 15 m ultimate crest width, and 5 m of freeboard to account for precipitation runoff, wave run-up, and minimum operating freeboard requirements. Embankment heights for Site A and Site B are approximately 50 m and 70 m, and embankment volumes are estimated to be 0.6 Mm3 and 1.6 Mm3, respectively.
In the case of Sites A and B, large upstream catchment areas (21.7 km2 and 24.4 km2, respectively), as shown on Figure 18.3 and the high estimated annual precipitation in the project area result in large projected volumes of water that would require diversion around the TSF to prevent large discharges of untreated TSF effluent to the downstream environment. Diversion of these flows would be achieved by constructing a flood attenuation dam on Homestake Creek upstream of the TSF and constructing a diversion channel around the perimeter of the facility that discharges back to the natural stream below the TSF. The flood attenuation dam would serve to reduce peak stream flows thereby reducing the diversion channel capacity requirements. The diversion channel would need to be well maintained throughout the year to ensure that the accumulation of snow or debris would not impact or prevent stream diversion leading to increased inflow to the TSF.
A water treatment plant would be required to ensure that water quality standards are met for water releases from the TSF.
Closure of the slurry tailings facility would likely involve decommissioning of the diversions, constructing a waste rock cap on the tailings surface, establishing a closure lake, and constructing a permanent spillway.
18.6.2 Filtered Tailings Options – Site C and Site D
Dewatering of the tailings slurry may be used to remove process solutions and develop a partially saturated filter cake at the mill that is estimated to be 85 percent solids by mass. With an estimated compacted in-situ dry density of 1.6 t/m3, the filtered tailings would require a site with capacity for roughly 3.0 Mm3. Two alternatives for the dry stack technology have been assessed:
Effective Date: May 29, 2020 Project No. TRQ-06 | |
|
Page 18-7
■
Site C: Side-hill dry stack site located adjacent to Plant Site 2 with an elevation range of 700 m to 800 m, on an average natural slope of roughly 10 to 20 percent. This site has capacity for the full tailings volume, but is situated on moderately steep terrain for which the stability has not been assessed.
■
Site D: Dry stack site located on a flat to mildly sloping topographic bench on the west side of the Homestake Creek valley in an elevation range of 970 m to 1010 m, roughly 3 km from Plant Site 2 by conceptual road alignments. Site D occupies an area presently covered with small lakes and bogs.
Foundation preparation would involve dewatering of lakes, installation of foundation drains, and removal of unsuitable foundation soils prior to construction of the dry stack facility.
The two locations that have been identified for dry stack disposal are shown on Figure 18.3,The dry stack tailings options are considered as mine development concepts using Plant Site 2 as the preferred location for the mill.
The filtered tailings would be transported by truck, rather than conveyor systems, from the mill to the deposition site. Truck transport is considered to be simpler and more flexible and economically viable for the Homestake Ridge Project and has been assumed as the base case for the cost estimates. Tailings solids would be spread by dozer and compacted with a vibratory roller at the dry stack.
3H:1V slopes buttressed against the hillside are assumed for the dry stack. With the addition of cement and additional stability buttressing with waste rock, steeper slopes may be developed. The dry stack will have small confining embankments on the downhill side of the facility, and diversion ditches on the upstream side to divert the uphill catchment area. The slopes of the dry stack will be capped with waste rock as the facility expands as part of a progressive reclamation strategy. Seepage controls would be required for the dry stack option and may be integrated with a stormwater runoff events pond.
The key benefit of implementing Site C or Site D for the Homestake Ridge Project is in minimizing the surface water management design requirements and associated costs. Filtered tailings may be a good option for the Homestake Ridge Project because of the recent water management issues associated with slurry tailings disposal.
Effective Date: May 29, 2020 Project No. TRQ-06 | |
|
Page 18-8
18.6.3 Site Selection
Following a site inspection by Knight Piesold in October of 2011, Site A was selected as the preferred option on the basis of the site topography, avalanche risks, availability of borrow materials, and the earthwork volumes for construction. The proposed site development plan is shown on Figure 18.3 above.
18.7 Process Plant
Several locations have been identified for locating the process plant at the Homestake Ridge site. The alternatives were reviewed by Knight Piesold in 2012 on the basis of site topography, haul distance from the mine portals, distance to the tailings storage facility, and site elevations. This engineering is ongoing.
18.8 Ancillary Facilities
18.8.1 Person-Camp
Due to the remote location of the project area, the project would likely operate on a DIDO roster with accommodation in a person-camp. The camp would be sized to accommodate crews on two or three shifts without a need for hot-bedding (sharing beds). The camp would include a mess hall, a fitness area, a first aid room, and a lounge with access to WiFi and satellite TV. Each room would have its own access to an ensuite bathroom. The camp would include a VIP area for visiting management and guests.
18.8.2 Core Shack
The core shack would consist of a heated pre-fabricated portable trailer with adjacent core storage in pre-fabricated racks under a tin roof cover.
18.8.3 Assay Laboratory
The assay laboratory would consist of two pre-fabricated trailers or sheds connected with a covered walkway. The first trailer would be dedicated to sample preparation and would consist of sample crushing, screening and sample splitting, with a pulverizer. The second trailer would house the fire assay laboratory, wet chemistry, analytical equipment, scales and balances and a small office. The buildings would be supplied with air conditioning with filtration/dust collection, fume scrubbing, and propane.
Effective Date: May 29, 2020 Project No. TRQ-06 | |
|
Page 18-9
18.8.4 Maintenance Shop and Warehouse
The maintenance shops and warehouse would consist of rigid frame fabric buildings on a concrete pad. The buildings would be furnished with propane heat, ventilation, and air filtration/dust collection.
18.8.5 Mine Administration/Technical Offices
The office building(s) would consist of pre-fabricated ATCO style 20x40 or 20x60 foot office trailers parked on a compacted gravel pad. The trailers would house the mine administrative and management staff, technical services such as geology and engineering, and purchasing.
18.8.6 Underground Dry
The underground dry would consist of a heated pre-fabricated ATCO style trailer on a compacted gravel pad. An adjacent or connected trailer would house the shower and restroom facilities.
18.9 Storage
18.9.1 Diesel Fuel
Diesel fuel would be stored in a bunded containment strategically located near the mine portal for refueling equipment and generators.
18.9.2 Potable Water
Potable water is expected to be sourced from a clean water source on the project site and pumped to potable water tanks near the camp.
18.9.3 Fire Water
A fire water tank must be located at a strategic location to provide fire suppression at the mill, at the person camp, and to the mine portals. This system will provide 60 minutes of fire water by gravity at a flow rate of 1,500 gpm or as otherwise required by Provincial fire safety guidance or insurance requirements.
18.9.4 Explosives
An explosives magazine will be located near the mine portals in accordance with Provincial mine regulations. This magazine will be supplied by the explosive vendor.
18.9.5 Reagents
Mill reagents will be stored in secure storage either at the metallurgical plant, or in the warehouse, depending on provincial regulations and mine requirements.
Effective Date: May 29, 2020 Project No. TRQ-06 | |
|
Page 18-10
19. MARKET STUDIES AND CONTRACTS
The Homestake Ridge Project will produce a clean copper concentrate with elevated gold values, a lead/zinc concentrate with silver values, and doré bar. The intention is to sell the concentrates to a metals or concentrate buyer, while the doré will be sold directly to a precious metal refiner.
At the time of writing this report, Auryn had not entered into any material contracts for the sale of concentrates or doré.
19.1 Commodity Pricing
Metal prices used in the financial models in this document are based on a 3-year lookback at commodity prices as summarized in Table 19-1 and Figure 19.1 and Figure 19.2 below. The 1-yr, 2-yr and 3-yr prices reflect the actual spot prices looking back those years. The 3-yr average is the 3-yr moving average effective March 26, 2020.
Historical Metal Prices effective March 26, 2020 – US Dollars
| | Spot | 1-yr | 2-yr | 3-yr | 3-Yr Avg |
| Gold - oz | $1,473.25 | $1,305.60 | $1,313.85 | $ 1,229.60 | $1,333.25 |
| Silver - oz | $ 11.97 | $ 15.38 | $ 16.32 | $ 17.40 | $ 12.04 |
| Copper - lb | $ 2.43 | $ 3.23 | $ 3.41 | $ 2.93 | $ 3.11 |
| Lead - lb | $ 0.81 | $ 1.00 | $ 1.17 | $ 1.18 | $ 1.08 |
Effective Date: May 29, 2020 Project No. TRQ-06 | |
|
Page 19-1
Source: www.denvergold.org
Figure 19.1: 3-Year Historical Price Trends for Gold (top) and Silver (bottom)
Effective Date: May 29, 2020 Project No. TRQ-06 | |
|
Page 19-2
Source: www.markets.businessinsider.com/commodities
Figure 19.2: 3-Year Historical Price Trends for Copper (top) and Lead (bottom)
Effective Date: May 29, 2020 Project No. TRQ-06 | |
|
Page 19-3
In accordance with BCSC and SEC guidelines, the authors have used the 3-yr moving average price as guidance for the metal pricing in this study (see Table 19-1). Accordingly, the following metal prices (US Dollars) have been adopted:
The slightly elevated price for gold is justified on the basis of the current spot price and the continued trend of increasing gold prices from October 2018 (excepting the recent collapse in metal prices due to the COVID-19 virus).
19.2 Material Contracts
The Company has not entered into any material contracts for construction or operations including supplies, services or capital equipment
Effective Date: May 29, 2020 Project No. TRQ-06 | |
|
Page 19-4
20. ENVIRONMENTAL STUDIES, PERMITTING, ANDSOCIAL OR COMMUNITY IMPACT
20.1 Environmental Studies Overview
The Homestake Ridge property is located on the south-west edge of the Cambria Ice Field. The southern portion of the claim group is located at the headwaters of an eastern unnamed tributary to the Kshwan River that discharges into the Hastings Arm of Observatory Inlet. The central claim group, which contains the main mineralized zone is located at the headwaters of Homestake Creek. This environmental study summary focusses on the Homestake Ridge Project, consisting of the three primary deposits: Homestake Main, Homestake Silver and South Reef Zones, together with the proposed waste management facilities (tailings dam, tailings facility, runoff diversion dam), plant site and access road from Alice Arm.
Environmental programs conducted to date, and summarized herein, include:
■
Wildlife Surveys for Kitsault/Homestake/Trout Creek Hydroelectric Projects. Prepared for Kitsault Hydro Electric Corporation, Richmond, BC. Prepared by Ken Wright & Sean Ebnet. N.D.
■
Assessment Report 1994 Baseline Environmental Studies on the Kitsault Claim Group. Report by Mike Sieb. February 25, 1995.
■
1994 Environmental Studies at Kitsault Lake. Prepared for Lac Minerals, Vancouver, BC. Prepared by Rescan Environmental Services Ltd., Vancouver, BC. February 1995.
■
Homestake Creek Hydroelectric Project Fisheries Investigations; Habitat Assessment; IFR Recommendation. Prepared for Department of Fisheries and Oceans, Prince Rupert, BC. Prepared by EES Consulting, Inc. December 2004.
■
Homestake Ridge Project – Gap Analysis and Biophysical Review. Prepared for Allnorth Consultants Ltd., Prince George, BC. Prepared by Triton Environmental Consultants Ltd., Terrace, BC. November 10, 2011.
■
Homestake Ridge Project Proposed Road Stream Assessment. Prepared for Allnorth Consultants Ltd., Prince George, BC. Prepared by Triton Environmental Consultants Ltd., Terrace, BC. January 20, 2012.
Effective Date: May 29, 2020 Project No. TRQ-06 | |
|
Page 20-1
■
Homestake Ridge Project Surface Water Quality Initial Site Visit Report. Prepared for Allnorth Consultants Ltd., Prince George, BC. Prepared by Triton Environmental Consultants Ltd., Terrace, BC. February 10, 2012.
■
Homestake Ridge Mineral Exploration Project Management Plan for: Grizzly Bear, Mountain Goat, Moose, Coastal Northern Goshawk, and Marbled Murrelet. Prepared for Auryn Resources Inc. Prepared by One-Eighty Consulting Group. July 10, 2018.
Publicly accessible data has also been used from the following sources:
■
Publicly available data generated by DataBC. Accessed via iMapBC.
■
Water Survey of Canada Data for Station 08DB011, “Kitsault River Above Klayduc Creek”, 1981 – 1996.
A list of other referenced documentation is provided in Section 27.
20.2 Pre-Existing Conditions
The Homestake Ridge Project area is a greenfield site with no previous development or pre-existing environmental issues.
20.3 Waste Rock Characterization
Six waste rock field barrel kinetic tests were undertaken in 2012 by pHase Geochemistry of Vancouver to provide an assessment of the waste rock pore water quality under site conditions. Splits of the barrels were sent to SGS in Burnaby, BC for further analysis.
The waste rock samples were collected from drill cores stored at the company core storage yard in Prince Rupert, BC. Roughly 100 to 120 m of composited quartered core from the Homestake Main deposit was selected for analysis.
Six major rock types were sampled:
■
PC – polymictic conglomerate
■
MSB - monomictic sedimentary breccia
■
LF – fragmented latite flow
■
XF – massive latite flow
Effective Date: May 29, 2020 Project No. TRQ-06 | |
|
Page 20-2
The sample mineralogy was determined by XRD analysis. The principle minerals include quartz and muscovites with lesser amounts of plagioclase, clinochlore, calcite and in some samples K-feldspar.
The carbonate mineralogy consists of minor calcite (0.3 to 16 percent) and ankerite/dolomite as well as traces of siderite.
The sulphide mineralization consists of pyrite which was present in all of the samples (except the conglomerates) in varying proportions from trace to 10 percent in the latite flows. The pyrite occurs as disseminated fine eu-anhedral grains and patchy aggregated grains. The samples contain trace amounts of chalcopyrite, sphalerite and pyrrhotite.
The Acid-Base Accounting (ABA) results show that 3 of the 6 barrels (PC, DF, MSB) were non-acid generating (NAG), two were determined to be PAG (XF and GW), and one was labelled uncertain (LF). The two PAG samples contained 7.2 and 8.6 percent pyrite respectively, with 5.1 and 10.9 percent calcite respectively. The uncertain sample contained 3.2 percent pyrite with 0.3 percent calcite.
20.4 Tailings Geochemistry
A preliminary geochemical assessment of tailings was carried out by SGS in 2011. Two locked-cycle flotation tailings samples were provided: LCT-2 from the Homestake Ridge Project; and LCT-4 from the Silver Cap deposit. The test program included ICP-OES/MS strong acid digestion elemental analyses, shake flask extractions, humidity cell testing, and bioassay testing with fish species.
The acid digestion elemental analyses indicated that both samples were predominantly comprised of silica and with significant levels of Al, K and Fe as would be expected for feldspar minerals.
The LCT-2 sample was found to be net neutralizing due to the presence of fast reacting carbonate minerals. Humidity cell testing on LCT-2 likewise confirmed the leachates to be near neutral to slightly alkaline. The bioassay tests with decant solutions from LCT-2 were reported to be non-lethal.
The LCT-4 sample, on the other hand, was found to be acid generating and produced a low final pH value of 2.49.
Effective Date: May 29, 2020 Project No. TRQ-06 | |
|
Page 20-3
20.5 Metals Leaching
ICP scans on solids from the kinetic test samples showed elevated levels of arsenic in 3 samples (MSB, LF and XF), and trace amounts of selenium.
20.6 Environmental Considerations/Monitoring Programs
20.6.1 Waste Rock Monitoring
The project is not expected to generate any significant volumes of waste rock that will be stored on surface. During mine operations, metal leaching/acid-rock drainage (ML/ARD) characterization of the waste rock will be conducted at regular intervals to appropriately classify the waste rock as PAG or non-PAG. All of the non-PAG waste will be incorporated into construction of the facilities such as the tailings dam, roads, portal benches and plant site grading. The remaining waste rock will be temporarily stored on surface, and subsequently used underground for backfilling of stopes.
20.6.2 Tailings Surface Water Management
The TSF will store tailings generated from the milling process, water stored in the voids of the tailings, additional water collected from runoff upstream of the TSF in the TSF catchment, and precipitation (e.g., rain and snow) that falls directly on the TSF. Water collected in the TSF may be re-used in the milling process to reduce the volume of water required to be input into the process. However, the volume of water stored in the TSF is expected to be in excess of the process requirements and will likely require treatment in a water treatment plant prior to discharge. Water treatment systems will be designed to manage the site-specific geochemical signature of the waste rock and tailings and will meet effluent discharge requirements detailed in subsequently received mine operating permits.
Design of the TSF water management and water treatment process will proceed following advanced geotechnical investigations and refinement of the mine plan and waste management strategy.
20.6.3 Groundwater Monitoring
Groundwater monitoring for water levels and water quality will be conducted at stations both upstream and downstream of project infrastructure. Baseline data collection will be conducted prior to construction to acquire background information, for which to compare water levels and water quality data collected during mine operations and post-closure. Specific stations and monitoring frequencies will be determined during Environmental Assessment and Mines Act Permit approval processes.
Effective Date: May 29, 2020 Project No. TRQ-06 | |
|
Page 20-4
20.6.4 Surface Water Monitoring
Hydrological and water quality monitoring will be conducted at creeks around the project site. Water monitoring stations will be established on upper and lower Homestake Creek and potentially on adjacent creeks, to provide un-impacted reference stations. Monitoring on Kitsault River may also be conducted to evaluate downstream conditions. Baseline hydrological and water quality data will be collected prior to construction to characterize the existing conditions. During construction and operations, regular hydrological and water quality monitoring will be conducted to monitor for potential impacts on the receiving environment. Monitoring may be continued following the cessation of mining activities, should mine infrastructure (e.g., TSF) remain on-site. Specific stations and monitoring frequencies will be determined during Environmental Assessment and Mines Act Permit approval processes.
20.6.5 Surface Runoff Water Management
The project site is located in an area of relatively high precipitation and high snowfall with steep terrain. The intent of the site water management plan will be to divert upland runoff around the proposed facilities whenever possible to keep the clean water clean, and to collect and treat water impacted by mining activities. Diversions will be used to prevent clean upstream runoff water from entering mine facilities such as the TSF, the plant site, and the mine portals. To divert the large catchment area upstream of the TSF, a flood attenuation dam on upper Homestake Creek would be constructed, that will serve to reduce peak stream flows and thereby reduce the diversion channel capacity requirements. A diversion channel would then carry the clean water around the perimeter of the TSF and discharge back to the natural stream below the mine infrastructure.
Runoff from disturbed ground such as the mine portal benches, the plant site, roads and parking areas will be directed to sediment collection basins to remove any suspended solids before discharge.
Mine impacted water (i.e., from the underground mine), and surplus water accumulated in the TSF, will be treated in the water treatment plant prior to discharge.
Effective Date: May 29, 2020 Project No. TRQ-06 | |
|
Page 20-5
20.7 Closure Plan
Mine closure requirements in British Columbia are regulated by the Mines Act and the accompanying Health, Safety and Reclamation Code for Mines in British Columbia (MEMPR, 2017b). During an application for an authorization under the Mines Act, proponents are required to submit a conceptual reclamation plan for the closure of all aspects of the mining operation, including:
■
Plans for long term post-closure maintenance of facilities
■
Proposed use and capability objectives for the land and watercourses
■
A closure plan for the TSF.
As Mines Act and Environmental Management Act permit applications are often submitted jointly, using the same information package, the MOE and MEMPR have issued a guidance document that further details requirements for reclamation planning and effective mine closure (MEMPR & MOE, 2016) which includes:
■
End land use and capability objectives
■
Trace element uptake in soils and vegetation
■
Disposal of toxic chemical
■
Contaminated site requirements
■
Groundwater well decommissioning
■
Detailed five-year mine reclamation plan
■
Conceptual final reclamation plan
■
Reclamation cost estimate.
The reclamation cost estimate includes the total expected costs of outstanding reclamation obligations over the planned life of the mine, including the costs of long-term monitoring and maintenance. Financial security is required to be provided for the outstanding costs associated with the mine reclamation, and can be provided by certified cheque, irrevocable standby letters of credit, guaranteed investment certificates with up to three-year terms backed by a safekeeping agreement (for security less than C$25,000), surety bonds, or by money placed in the reclamation fund.
Under the current exploration permit MX-1-603, security held by MEMPR totals C$68,000.
Closure costs for the proposed mine project have been estimated at C$5 million.
Effective Date: May 29, 2020 Project No. TRQ-06 | |
|
Page 20-6
20.8 Permitting
Current exploration activities are permitted under Mines Act permit MX-1-603, through to March 31, 2023. The Mines Act permit approves the construction of a camp, geophysical survey with exposed electrodes, surface drilling (500 drill holes), helipads and exploration trails.
The construction of the Homestake Ridge Project will require additional permits, following the receipt of an Environmental Assessment Certificate under the Environmental Assessment Act required for mining projects with an ore extraction rate ≥75,000 tonnes/year (OIC 607/2019). The project will not require a federal review under the Impact Assessment Act as it does not exceed a material production capacity of 5,000 tpd (SOR/2019-285) (proposed production is 900 tpd).
The project is located within the boundaries of several land use plans, which generally limit land use for commercial timber purposes, but do not restrict mining activities. These land use plans, as well as the relevant federal, provincial permits and authorizations, and details of the required access road permits are detailed in the following sub-sections.
20.8.1 Land Use Plans
The project is located within the North Coast Land and Resource Management Plan (North Coast LRMP), a land and resource management plan established in 2005 (BC MSRM, 2005), which was subsequently incorporated into law through the Great Bear Rainforest (Forest Management) Act in 2016 (BC Reg 324/2016). Specifically, the main project activities are located in the Kitsault Special Forest Management Area, with the southern most part of the mineral claim boundary extending into the Kswan Biodiversity, Mining and Tourism Area (Figure 20.1).
Effective Date: May 29, 2020 Project No. TRQ-06 | |
|
Page 20-7
Homestake Ridge Project
NI43-101F1 Technical Report
Figure 20.1: Great Bear Rainforest Land Use Zones
Effective Date: May 29, 2020 Project No. TRQ-06:: | |
|
Page 20-8
Homestake Ridge Project
NI43-101F1 Technical Report
These areas are designated under the Great Bear Rainforest Act through the Great Bear Rainforest (Special Forest Management Area) Regulation (BC Reg 325/2016, OC 971/2016). Special Forest Management Areas prohibit commercial timber harvesting in the area (FLNRORD, 2016), but does allow hydroelectric power generation, mining and tourism development “as long as it maintains ecological integrity” (Province of British Columbia, 2019). Biodiversity, Mining and Tourism areas further prohibit use by both commercial forestry and hydroelectric generation operations (Province of British Columbia, 2019).
The Nass Valley, and the north-eastern portion of the Homestake Ridge mineral claim block, is subject to the Nass South Sustainable Resource Management Plan (Nass South SRMP; FLNRORD, 2012). The Nass South SRMP is an outcome of both the Gitanyow Recognition and Reconciliation Agreement and a partnership with the Nisga’a Lisims government. The Nass South SRMP incorporates into law the Gitanyow Lax'Yip Land Use Plan (Gitanyow Nation and the Province of British Columbia, 2012).
The mineral claim block overlaps with one old growth management area in the north east corner of the claim area as well as some high and moderate Goshawk fledging nesting post habitat, and portions of the ecosystem network (Nass South SRMP Figure 20.2). Ecosystem networks focus mainly on the retention of important communities (including listed plant communities), ecosystem structure and successional stages, and maintenance of appropriate landscape patterns. Resource management can occur in established ecosystem networks, provided biodiversity goals and objectives are not compromised (Gitanyow Nation and the Province of British Columbia, 2012). While the Nass South SRMP is focused on timber development and does not currently regulate or define requirements related to mineral exploration and development, it is useful to note that the proposed project area is defined as a low biodiversity landscape unit, is not identified for any visual quality objectives, and is not near any protected areas.
Effective Date: May 29, 2020 Project No. TRQ-06:: | |
|
Page 20-9
Homestake Ridge Project
NI43-101F1 Technical Report
Figure 20.2: Nass South Sustainable Resource Management Plan Areas
Effective Date: May 29, 2020 Project No. TRQ-06:: | |
|
Page 20-10
Homestake Ridge Project
NI43-101F1 Technical Report
20.8.2 Federal Permits, Approvals, Licences and Authorizations
As detailed above, the project does not require a federal review under the Impact Assessment Act; however, several federal authorizations, permits and licences will be required. A list of potentially applicable federal authorizations and permits and the corresponding responsible agency, federal statute and project activity is provided in Table 20-1.
Federal Permits and Approvals Potentially Applicable to the Project
| Permit/Approval | Federal Statute | Responsible Agency | Project Activity |
| Authorization under Paragraphs 34.4(2)(b) and 35(2)(b) | Fisheries Act | Fisheries and Oceans Canada (DFO) | Conducting work or activities that result in the death of fish or that result in the harmful alteration, disruption or destruction of fish habitat. |
| Migratory Birds Convention Act Authorization | Migratory Birds Convention Act and Migratory Bird Sanctuary Regulations | Environment and Climate Change Canada (ECCC) | Deposit of substances harmful to migratory birds or vegetation clearing during the migratory bird nesting season as outlined by ECCC for the Project area, Zone A2, early April to mid-August (ECCC, 2018). |
| Species at Risk Act Permit | Species at Risk Act | ECCC, DFO, Parks Canada | Authorizes activities that will affect a listed wildlife species, any part of its critical habitat, or the residences of its individuals. |
| Explosive Licences and Permits | Explosives Act, and Regulations | Natural Resources Canada | Explosive Licence required for factories and magazines. Explosive Permit required for vehicles used for the transportation of explosives. |
| Transportation of Dangerous Goods Permits | Transportation of Dangerous Goods Act | Transport Canada | Related to the classification, documentation, marking, means of containment, required training, emergency response, accidental release, protective measures and permits required for the transportation of dangerous goods by road, rail or air. |
| Storage Tank System Registration | Canadian Environmental Protection Act Storage Tank Systems for Petroleum Products and Allied Petroleum Products Regulations | ECCC | For the storage of fuels aboveground and underground used for storage of petroleum and allied petroleum products with a capacity greater than 2,500 L. |
| Ammonium nitrate storage Approval | Railway Safety Act and the Ammonium Nitrate Storage Facilities Regulations | Canadian Transport Commission | For an ammonium nitrate storage facility with a capacity > 200 tons. |
| Spectrum radio licence | Radiocommunication Act | Innovation, Science and Economic Development Canada | For the issuance of a radio licence with respect to spectrum licences in respect of the utilization of specified radio frequencies within a defined geographic area. |
Effective Date: May 29, 2020 Project No. TRQ-06:: | |
|
Page 20-11
Homestake Ridge Project
NI43-101F1 Technical Report
20.8.3 Provincial Permits, Approvals and Licences
The project is located on Crown land, through a combination of mineral claims and five Crown Grants. The three primary provincial authorizations required to build, operate and reclaim the project are:
1.
An environmental assessment (EA) certificate, issued under the Environmental Assessment Act by the Environmental Assessment Office (EAO)
2.
Permits issued under the Mines Act by the MEMPR
3.
Waste discharge permits issued under the Environmental Management Act by the Ministry of Environment and Climate Change Strategy (MOE).
A mineral lease will also be required to convert mineral claims (allowing for exploration and development of mineral resources with production limits) to a mining lease (to engage in mine production and/or mine reclamation subsequent to production) (MEMPR, 2017a). To apply for a mining lease, a mineral claims holder applies to have the mineral claims replaced with a mining lease under Section 42 of the Mineral Tenure Act (MEMPR, 2017a).
There are also several minor permits and authorizations required to construct and operate a mine in British Columbia. A list of potentially applicable provincial approvals and permits and the corresponding responsible agency, provincial statute and project activity is provided in Table 20-2.
Effective Date: May 29, 2020 Project No. TRQ-06:: | |
|
Page 20-12
Homestake Ridge Project
NI43-101F1 Technical Report
Provincial Permits and Approvals Potentially Applicable to the Project
| Permit/Approval | Federal Statute | Responsible Agency | Project Activity |
| Environmental Assessment Certificate | Environmental Assessment Act 2018 | EAO | Conducting activities listed in the Physical Activities Regulations |
| Mines Act permit | Mines Act | MEMPR | Approval of the mine plan and the reclamation and closure plan (RCP) |
| Waste Discharge Permit and Waste Storage Approval | Environmental Management Act | MOE | Permitting system to enable authorized discharge of effluent to water, storage/treatment of wastes, disposal of solid waste to land, and discharge of emissions to the atmosphere. |
| Heritage Conservation Act s. 14 Heritage Inspection Permit or Heritage Investigation Permit; s. 12 [Site] Alteration Permit | Heritage Conservation Act | Ministry of Forests, Lands, Natural Resource Operations and Rural Development (FLNRORD): Archaeology Branch | Heritage inspection, investigation, or site alteration of lands potentially affected by the project. |
Heritage Conservation Act Concurrence letters | Heritage Conservation Act | FLNRORD: Archaeology Branch | Assessment under the Heritage Conservation Act must be completed prior to the commencement of ground disturbing activities. |
Wildlife Act Permit | Wildlife Act | MOE: Environmental Stewardship Division | Wildlife salvages and surveys of wildlife and their habitat. Bird nest removal or relocation. |
| Construction Permit for a Potable Water Well | Drinking Water Protection Act | BC Ministry of Health, Northern Health Authority | Groundwater well for domestic water use. |
| Water System Construction Permit | Drinking Water Protection Act | BC Ministry of Health, Northern Health Authority | Construction of a potable water system. |
| Drinking Water System Operations Permit | Drinking Water Protection Act | BC Ministry of Health, Northern Health Authority | Operation of a potable water system. |
| Short Term Use of Water Permit | Water Sustainability Act | MOE: Water Stewardship Branch | Short-term use of water from fresh water streams and lakes for construction purposes. |
Water Sustainability Act Approval | Water Sustainability Act and BC Dam Safety Regulation | FLNRORD | For changes in and about a stream including diversions, storage and use of water, including management of nuisance water from mining operations. |
| Water Licence | Water Sustainability Act | FLNRORD | For construction and operation of Project activities requiring diversion of surface waters or groundwater sources for potable or process water. |
| Licences to Cut and Special Use Permit | Forest Act, Part 3, Section 8.2 Licence to Cut Regulation Provincial Forest Use Regulation | FLNRORD: Forest Tenures Branch | Licence to Cut Permit to harvest in a specific area over a relatively short time period. Special Use Permit to gain nonexclusive authority to use Crown Land within Provincial Forest, if in accordance with Provincial Forest Use Regulation (annual rent and taxes apply) for the construction or maintenance of a road, bridge, or drainage structure, weather station, weight scales, or quarries used for road construction or maintenance. |
| Industrial Access Permit | Transportation Act | Ministry of Transportation and Infrastructure | Required for any new roads that join onto public roads controlled by the Ministry of Transportation. |
| Permit for regulated activities | Public Health Act | Ministry of Health | Regulated activities may, if prescribed standards are not met, endanger health or cause injury or illness, or are not regulated under an enactment (or if regulated do not sufficiently prevent, mitigate or respond to the risk to health or risk of injury or illness). Such activities could be providing potable water, processing waste water, or managing septic systems. |
| Hazardous Waste Generator Registration | Environmental Management Act Hazardous Waste Regulation | MOE | A registration process for the owner of a waste (e.g., property owner) identified as being hazardous to detail the steps taken to store hazardous waste at the generation location. |
| Sewage Registration | Environmental Management Act Municipal Sewage Regulation | MOE | Registration identifying specific information regarding the sewage discharge activities. |
| Food Service Permits | Health Act | Provincial Health Services Authority | To operate a kitchen in a mining camp. |
Effective Date: May 29, 2020 Project No. TRQ-06:: | |
|
Page 20-13
Homestake Ridge Project
NI43-101F1 Technical Report
20.8.4 Access Road Permitting
The vicinity of the project is accessible by the Kitsault River Road, a 35 km road that leaves Alice Arm and heads north. The Kitsault River Road is a combination of public road (first ~28 km), maintained by the Ministry of Transportation and Infrastructure (MoTI), and ~7 km of resource road, that provides access to the past producing Dolly Varden silver mine. The current trail ends approximately six kilometres short of the project area.
Permitting for the access road would be combination of a MoTI permit on the public road, and a special use permit for the remaining 13 km issued by FLNRORD. A road use agreement may also be required if there is an existing permittee for the section of road that travels through the Dolly Varden claims. Construction of access routes within the Homestake mineral claims would be covered under Mines Act permit and authorizations.
20.9 Considerations of Social and Community Impacts
The project is 35 km by road from the towns of Kitsault and Alice Arm. Alice Arm is home to a few summer residents, but no year round residents. While the Kitsault townsite and the surrounding 80 ha was purchased in 2005 by a private land-owner and has been maintained at a cost of approximately $1M per year, the town is closed to the public, and only caretakers and summer maintenance crews currently reside there (EAO, 2013).
The nearest populated towns are the Nisga’a communities along the Nass River valley: Gitlaxt’aamiks (New Aiyansh) (1,800 residents); Gitwinksihlkw (250 residents); Laxgalts’ap (520 residents); and Gingolx (500 residents). The communities of Prince Rupert (340 km by road south-west), Terrace (185 km south) and Stewart (240 km by road, north-west) would have a reasonable likelihood of providing labour, goods, and services to the Project.
The project overlaps with one licenced guide outfitter territory, four traplines, two commercial recreation licences of occupation and one tenure licence for water power investigation. The mineral claims represent only 0.3 percent (7441 ha) of the total outfitting guiding area (2,670,179 ha), and less than 8 percent of any of the four traplines.
Effective Date: May 29, 2020 Project No. TRQ-06:: | |
|
Page 20-14
Homestake Ridge Project
NI43-101F1 Technical Report
There is one water rights licence issued to the Kitsault Hydro Electric Corporation on Homestake Creek, just above the confluence with the Kitsault River. Kitsault Hydro Electric Corporation had proposed a run of the river project on Homestake Creek, together with two other run of the river projects on the West Kitsault River and Trout Creek and re-instatement of the Kitsault dam at the outlet of the Kitsault Lake in 2003 (CEAA, 2012). Water licences were issued for the Kitsault Storage Dam, West Kitsault River, and Homestake Creek projects in 2003, and in 2005 for the Trout Creek project (Anyox Hydro, 2013). While Kitsault Hydro Electric Corporation conducted substantial upgrades to the all-weather access road in 2004/2005 and again in 2014, no activities have occurred since (Dolly Varden Silver Corp, 2014), and the rights are owned by the same private land owner that owns the Kitsault townsite.
Four different Indigenous groups assert interests overlapping the Homestake Ridge Project mineral claims: Nisga’a Nation, Gitanyow Hereditary Chiefs Office, Tsetsaut Skii Km Lax Ha Nation and the Metlakatla Band Council. While the main project infrastructure is in the treaty lands of the Nisga’a Nation, the northern mineral claims are adjacent to the Gitanyow House Gwass Hlaam and Biitoosxw group, and the southern-most portion of the primary mineral claim block (1015450) is within the Metlakatla Band Council Traditional Territory.
Following early ethnohistoric research in order to identify Indigenous groups with potential interests in the project area, Auryn has identified that the two primary potentially affected Indigenous groups are the Nisga’a Nation and the Gitanyow First Nation.
The Nisga’a Nation is a self-governing treaty nation with rights under the Nisga’a Final Agreement, signed in 1998. The population of the Nisga’a Nation is approximately 6,700 people – 1,900 Nisga’a citizens live in four villages on Nisga’a Lands and another 4,800 Nisga’a citizens live elsewhere, including Prince Rupert, Terrace and Vancouver. The proportion of young people living on Nisga’a Lands is significantly higher than the provincial average.
The Nisga’a are governed by the Nisga’a Lisims Government, with an executive (President, Executive Chairperson, Secretary-Treasurer and CEO) and government departments, serving as the representative body for administration and consultation purposes. The Nisga’a Employment, Skills, and Training organization (NEST), is the primary organization coordinating employment and training opportunities for Nisga’a citizens.
Among others, the Nisga’a Final Agreement defines both treaty rights for natural resource extraction, such as fishing and harvesting aquatic plants, migratory birds, and wildlife, and ownership of lands. Land ownership includes both Category A Lands, which afford direct land ownership, and Category B fee simple lands. The Homestake Ridge mineral claim block falls within an area covered by both the Nass Wildlife Area and the Nass Area as defined in the Nisga’a Final Agreement, which provide treaty rights to the Nisga’a Nation for fishing and harvesting aquatic plants, migratory birds, and wildlife. There is one parcel of Category B Lands on the southeast side of Kitsault Lake.
Effective Date: May 29, 2020 Project No. TRQ-06:: | |
|
Page 20-15
Homestake Ridge Project
NI43-101F1 Technical Report
While centrally located in the Nisga’a Lands, the project is also adjacent to two Gitanyow Hereditary House groups (wilps): Gwass Hlaam & Biitoosxw, and Luuxhon, that have House territories north of Kitsault Lake where they assert Aboriginal rights including title. Luuxhon territory boundaries do not appear to directly overlap with any of the company’s mineral claims. The Gwaas Hlaam & Biitoosxw house boundary does slightly overlap with the northern portion of the mineral claims.
The Gitanyow are part of the Gitxsan, a division of the Tsimshian. Their hereditary system concentrated most control of and rights to land and resources in Houses (wilp). The current principal village/community of the Gitanyow is in the Skeena watershed on the Kitwanga River, on Highway 37, approximately 140 km northeast of Terrace, but most of their asserted territory is in the Nass watershed, and includes the White River region. There are around 1,800 members. Almost half of the registered population live on the main reserve.
The Gitanyow mainly observe a hereditary governance system, and they have eight houses (wilp), each represented by a hereditary chief. The wilp is the primary unit of Gitanyow governance, decision-making, and jurisdiction over land and resources, and is headed by a hereditary chief. Wilp territories are generally defined by a specific watershed or group of watersheds. There is an elected chief and council mainly responsible for the administration of and day-to-day affairs of the main Gitanyow reserve community. The Gitanyow Hereditary Chiefs’ Office is the governing body with respect to Gitanyow traditional territory and the assertion of Gitanyow rights.
The company engaged early and repeatedly with the Nisga’a Nation and the Gitanyow First Nation commencing in January and April 2017, respectively, in order to provide corporate and project information, share plans, updates, and provide each of these groups with opportunities for feedback and involvement in the project. Draft mineral exploration permit applications and supporting materials were provided to the Nisga’a Nation and Gitanyow First Nation in advance of submission to government.
Auryn’s local engagement philosophy supports the delivery of shared prosperity to Indigenous communities including:
■
provision of jobs and training programs
■
contracting opportunities
Effective Date: May 29, 2020 Project No. TRQ-06:: | |
|
Page 20-16
Homestake Ridge Project
NI43-101F1 Technical Report
■
capacity funding for First Nations engagement
■
sponsorship of community events.
Approximately 40 percent of Auryn’s Homestake Ridge Project team since 2017 have been local Indigenous members and two of the primary contractors were local Indigenous owned companies.
Auryn and the Nisga’a Lisims Government entered into a Confidentiality Agreement in January 2020.
20.10 Comments on Section 20
The authors are not aware of any environmental, social or permitting issues not disclosed herein that could have an impact on project development.
Further advancement of the Homestake Ridge Project will require additional environmental baseline and geochemical testing. In particular additional studies are needed to:
■
characterize the geochemical stability of the waste rock and tailings
■
assess surface water geochemistry
■
assess groundwater geochemistry.
Effective Date: May 29, 2020 Project No. TRQ-06:: | |
|
Page 20-17
21. CAPITAL AND OPERATING COSTS
21.1 Capital Cost Estimates
21.1.1 Basis of Estimate
Capital costs for the Homestake Ridge Project include engineering, procurement, construction and commissioning of a 900 tonne per day underground mine, metallurgical plant, and ancillary facilities such as the access road, site roads, powerline, tailings facility and a person camp.
The capital costs herein have been developed at a level consistent with a scoping level assessment of the economic viability of the project. The estimate has largely been developed from benchmarking of costs from recent projects of a similar scope and similar size. Data from the benchmarking was derived both from MineFill files, and from recently published PEA’s. Costs are benchmarked to Q4 in 2019 and are considered accurate to ± 25 percent. All costs have been converted to US dollars at an exchange rate of C$1.00 to US$0.70 unless indicated otherwise.
21.1.2 Direct Costs
The pre-production capital cost has been estimated at US$88.4 million (C$126.3 million) including all direct and indirect costs. The PEA is based on contractor owned and operated equipment and manpower. A contingency of 15 percent has been applied to all direct facility costs. Details of the pre-production capital are shown on Table 21-1 below.
Effective Date: May 29, 2020 Project No. TRQ-06:: | |
|
Page 21-1
Capital Cost Summary
| Expenditure | Initial (US$M) |
| Direct Costs | |
| Mining Equipment | $3.01 |
| Surface mobile equipment | $3.50 |
| Tailings | $8.40 |
| Site Development – Roads, Airport | $6.30 |
| Camp Facilities | $3.15 |
| Site Infrastructure | $3.50 |
| Power Supply | $8.40 |
| Process Plant | $26.18 |
| Access Upgrades – barge landing and roads | $2.10 |
| Total Direct Costs | $64.54 |
| Indirect Costs | |
| EPCM costs – 15% of directs | $8.70 |
| Owner Costs – 10% of directs | $5.80 |
| Environmental Permits/Baseline Data | $0.64 |
| Contingency – 15% | $8.70 |
| Total Indirect Costs | $23.84 |
| Total Initial Capital | $88.39 |
21.1.2.1 Mine Fleet Capital Costs
The mining fleet costs (US$6.5 million) were largely derived from estimated costs for a contractor owned and operated underground fleet. These costs would include drill jumbos, load-haul-dump units, underground trucks, and supporting vehicles such as ANFO loaders, bolters, and light vehicles. The surface fleet would consist of a small fleet of articulated trucks for ore haulage to the metallurgical plant, graders and light vehicles.
21.1.2.2 Tailings Facility
The tailings facility costs (US$8.4 million) were estimated by Knight Piesold in 2012 based on preliminary designs, volumes, quantity take-offs and contractor costs. These costs have not been escalated herein.
21.1.2.3 Site Development
The site development costs of US$6.3 million were estimated by MineFill and include site roads, grading, airstrip, water diversions and water management.
Effective Date: May 29, 2020 Project No. TRQ-06:: | |
|
Page 21-2
21.1.2.4 Camp
The camp costs were estimated on the basis of a 150 person camp at C$30,000 per room.
21.1.2.5 Site Infrastructure
Site infrastructure costs were largely estimated by Knight Piesold based on detailed estimates and recent construction costs. These costs include power distribution, water supply, sewage, and mine services such as ventilation and compressed air.
21.1.2.6 Power Supply
Power supply costs were estimated by Knight Piesold in 2012 as outlined in Section 18.
21.1.2.7 Process Plant
The process plant capital estimate is based on recently published studies for projects of a similar scope and similar size.
21.1.2.8 Site Access
Capital estimates for upgrading the site access, including a barge landing in Alice Arm, were derived by AllNorth Consultants, Knight Piesold, and Golder in several independent studies.
21.1.3 Indirect Costs
21.1.3.1 EPCM
Engineering, procurement, and construction management costs are estimated at 15 percent of the direct facility costs.
21.1.3.2 Owners Costs
Owner costs include owner project management, travel, capital raising and corporate overheads. These costs are estimated at 10 percent of the direct facility costs.
21.1.3.3 Environmental/Permits
The initial and ongoing environmental monitoring and baseline data requirements are shown in Table 21-2 below.
Effective Date: May 29, 2020 Project No. TRQ-06:: | |
|
Page 21-3
Environmental Monitoring Costs (C$)
| Task | Annual Budget | Annual Requirement |
| Design of environmental program | $20,000 | Year 1 only |
| Surface and ground water quality and hydrology | $150,000 | Year 1 and subsequent years |
| Installation of groundwater monitoring wells | $500,000 | Year 1 only |
| Geochemical test work (field bins, saturated column testing, unsaturated column testing, static testing) | | |
- Set up and year 1 of testing | $80,000 | Year 1 |
- Subsequent years of analysis | $40,000 | Subsequent years |
| Wildlife | $30,000 | Year 1 and subsequent years |
| Climate monitoring | $50,000 | Year 1 only & 20% in subsequent years to maintain weather station and analyze data |
| Fisheries | $50,000 | Year 1 and subsequent years |
| Heritage/Archaeology | $30,000 | Year 1 only |
| 1st Year Environmental Budget (includes set up and installation of monitoring sites) | $910,000 | |
| Annual Environmental Budget for subsequent years | $310,000 | |
21.1.3.4 Contingency
A contingency of 15 percent has been applied to all direct costs for plant equipment and facilities.
21.1.4 Sustaining Capital
Sustaining costs have been estimated at US$85.8 million after a US$3.5 million credit for the end-of-mine salvage value as summarized in Table 21-3 below.
Effective Date: May 29, 2020 Project No. TRQ-06:: | |
|
Page 21-4
Sustaining Capital Costs – Life of Mine
| Expenditure | Sustaining (US$M) |
| Mining Equipment | $2.11 |
| Surface mobile equipment | $2.49 |
| Capitalized Underground Development | $66.35 |
| Reclamation - tailings | $3.50 |
| Closure | $3.50 |
| Water Treatment | $1.40 |
| End of Life Salvage | ($3.50) |
| Contingency | $9.95 |
| Total Sustaining Capital | $85.80 |
21.1.4.1 Mining Equipment
The sustaining capital estimate includes US$4.6 million for equipment rebuilds and equipment replacement.
21.1.4.2 Capitalized Underground Development
The majority of the sustaining capital is allocated to capital development in support of the underground mining operations. This includes level development, access drives and ore drives not included in the stope mining costs. These costs are estimated at C$3250/m for a 20 m2 drive which equates to roughly C$60/tonne.
Vertical development has been costed at C$6,000 per vertical metre for a 3.1 m diameter raise bore or roughly C$300 per tonne.
21.1.4.3 Reclamation
The PEA sustaining capital includes C$5 million for ongoing reclamation of the TSF.
21.1.4.4 Water Treatment
The PEA mine development plan includes C$2 million for construction of a water treatment plant for treating mine water and tailings contact water.
Effective Date: May 29, 2020 Project No. TRQ-06:: | |
|
Page 21-5
21.2 Operating Cost Estimates
Operating costs were developed from unit rate costs and benchmark costs for projects of a similar size and scope. The all-in operating costs have been estimated at US$89.40 per tonne milled and the breakdown is included in Table 21-4 below.
Operating Cost Summary (US$)
| Area | Unit Mining Cost | Life-of-Mine |
| Mining ($/t mined) | $63.50 | $182.87 million |
| Processing ($/t milled) | $21.00 | $71.92 million |
| General and Administration ($/t) | $14.00 | $47.95 million |
| Environmental/Water Treatment | $0.82 | $2.82 million |
| Community/Social | $0.17 | $0.59 million |
| Total Operating Costs ($/t milled) | US$89.39 | US$306.15 million |
21.2.1 Mining Operating Costs
The mining operating costs were developed from benchmark costs for mining in similar deposits. The costs vary in accordance with the average and typical mining widths, the mining volumes, and the deposit geometry. The following unit mining costs have been adopted for this study (Table 21-5).
Unit Mining Costs (US$)
| Zone | Unit Mining Cost ($/tonne) |
| HM | $82.50 |
| HS | $105.00 |
| SR | $75.00 |
21.2.2 Process Operating Costs
Process operating costs have been benchmarked at C$30 per tonne milled based on operating costs at similar operations.
21.2.3 General and Administrative Operating Costs
An allowance of C$20 per tonne has been allocated for general and administrative costs.
Effective Date: May 29, 2020 Project No. TRQ-06:: | |
|
Page 21-6
21.2.4 Environmental Costs
Ongoing environmental monitoring costs are summarized in Table 21-2. Water treatment costs are detailed in Section 21.1.8.
21.2.5 Community and Social
Community engagement costs have been estimated at C$65,000 per year which includes C$50,000 for a community liaison officer, and C$15,000 for sponsorship of community programs.
Effective Date: May 29, 2020 Project No. TRQ-06:: | |
|
Page 21-7
22. ECONOMIC ANALYSIS
22.1 Introduction
The financial evaluation utilizes a discounted cashflow model to determine the after-tax NPV, payback period (time in years to recapture the initial capital investment), and the Internal Rate of Return (IRR) for the project. Annual cashflow projections were estimated over the life of the mine based on the estimates of capital expenditures and production cost and sales revenue. The sales revenue is based on the production of concentrates and gold/silver bullion. The estimates of capital expenditures and site production costs have been developed specifically for this project and have been presented in earlier sections of this report.
The cashflow model is based on base case metal prices and exchange rates that are flat throughout the mine life. The model does not account for any escalation, inflation, or reductions in operating costs, metal prices, or smelter costs over the life of the mine.
The model is based on standard discounted cashflow modelling techniques using a base case discount rate of 5 percent.
22.2 Mine Production Schedule
The life of mine production schedule is shown in Table 22-1 below.
Production by Year (kt)
As required by NI43-101, the author cautions the reader that the PEA is preliminary in nature, that it includes Inferred mineral resources that are considered too speculative geologically to have the economic considerations applied to them that would enable them to be categorized as mineral reserves, and there is no certainty that the preliminary economic assessment will be realized.
Effective Date: May 29, 2020 Project No. TRQ-06:: | |
|
Page 22-1
22.3 Metal Production
The life of mine metal production is shown in Table 22-2 below.
Life of Mine Metal Production
22.4 Concentrate Freight and Insurance
Freight and insurance costs were derived from recent contracts and are shown in Table 22-3 below.
Concentrate Freight and Insurance (US$)
| Concentrate | Freight and Insurance |
| Copper | $169 per dmt Cu concentrate |
| Lead | $133 per dmt of Pb concentrate |
| Doré | 3% of metal value |
22.5 Smelting and Refining Terms
Treatment and refining costs (TC/RC) were validated by MineFill. The TC/RC’s are summarized in Table 22-4 below.
Effective Date: May 29, 2020 Project No. TRQ-06:: | |
|
Page 22-2
Treatment and Refining Costs (US$)
| Concentrate | Treatment | Refining |
| Copper | $90 per dmt Cu concentrate | $0.09 per lb of Cu $5.53 per oz of payable Au $0.40 per oz of payable Ag |
| Lead | $140 per dmt of Pb concentrate | $0.09 per lb of Cu $15.00 per oz of payable Au $0.40 per oz of payable Ag |
| Doré | | $1.50 per oz of payable Au $0.25 per oz of payable Ag |
22.6 Concentrate Marketing Terms
The two primary concentrates will be sold to a metals concentrate buyer who will sell the concentrates to a suitable smelter. It is anticipated the concentrates will be very marketable due to the high precious metals content. The doré will be sold directly to a metals refiner. The concentrate marketing terms are summarized in Table 22-5 below.
Concentrate Marketing Terms
| Concentrate | Payable Metal |
| Copper | Au – 98% payable Ag – 70% payable Cu – 96% payable |
| Lead | Au – 95% payable Ag – 95% payable Cu – 96% payable Pb – 95% payable |
| Doré | Au – 99.95% payable Ag – 99.50% payable |
22.7 Capital Costs
The financial model assumes a 100 percent equity financing of the initial capital with no debt. The initial capital has been estimated at US$88.4 million.
Effective Date: May 29, 2020 Project No. TRQ-06:: | |
|
Page 22-3
22.7.1 Sustaining Capital
An allowance for mine sustaining capital expenditures during production has been included in the financial model. The majority of sustaining capital is allocated to capitalized mine development as shown in Table 22-5 above. A schedule of the sustaining capital expenditures is shown on Table 22-6 below.
Sustaining Capital Expenditures over the Life of Mine(US$ Millions)
22.7.2 Working Capital
The financial model does not include any delays in revenue recognition from the year of production to the year of sales.
22.7.3 Salvage Value
A salvage value of C$5 million was incorporated into the model based on residual value of roughly 5 percent of the capital equipment
22.8 Net of Smelter Revenues
The net smelter revenues were determined by applying the estimated metal prices against the metal production in concentrates, then deducting the freight and insurance costs, the smelting and refining terms, and payable metal factors to determine net value of metal sales.
The base case metal prices are shown in Table 22-7 below.
Base Case Metal Prices (US$)
| Metal | Metal Price |
| Gold | $1,350/oz |
| Silver | $12.00/oz |
| Copper | $3.00/lb |
| Lead | $1.00/lb |
Effective Date: May 29, 2020 Project No. TRQ-06:: | |
|
Page 22-4
The life of mine metal revenues are shown in Table 22-8 below.
Life of Mine Metal Revenues – (US$)
| Metal | Revenue (millions) |
| Gold | $671.79 |
| Silver | $76.85 |
| Copper | $21.13 |
| Lead | $3.77 |
22.9 Royalties
The project is subject to two net of smelter (NSR) royalty agreements. The Coombes 2 percent NSR royalty includes a royalty buyout option of C$1.0 million if exercised in advance of production. The financial model assumes that Auryn exercises the royalty buyout and C$1.0 million has been added to the initial startup capital for the project.
The Crown grants are subject to a 2 percent NSR royalty and these payments are included in the cashflow model. Over the life of mine these royalty payments amount to US$4.37 million.
The cashflow model also includes credit for C$500,000 in advance royalty payments.
22.10 Operating Costs
Life of mine operating costs have been calculated on the basis of the detailed annual production of mineralized material, internal mine waste, and development waste. Process costs and general/administrative (G&A) costs were added along with site costs and other overheads such as environmental monitoring. The operating cost summary was included in Table 21-4 above.
22.11 Other Cash Costs
Other cash costs applied to the financial model include:
■
Reclamation sustaining costs of C$5 million
■
Closure costs of C$5 million
■
Construction of a water treatment plant for C$2 million
Effective Date: May 29, 2020 Project No. TRQ-06:: | |
|
Page 22-5
22.12 Taxes
The tax portion of the cashflow model was prepared internally and took into account the Canadian and BC tax rates and regimes in effect at the date of the report. Net income for tax purposes was determined as metal revenues net of royalties, operating costs, reclamation and closure costs, depreciation of tax pools and imposition of BC Minerals Tax. In computing taxable income, further deductions for available non-capital loss carry forwards were taken.
The following assumptions were incorporated in the tax model:
■
Income tax rates: Canadian federal rate of 15 percent; British Columbia provincial rate of 12 percent
■
British Columbia Minerals Tax rate: Net current proceeds tax rate of 2 percent; Net Revenue Tax rate of 13 percent
■
Tax depreciation done on a declining balance method: Capital assets at a CCA Rate of 25 percent; Cumulative Exploration Expenses at 100 percent; Cumulative Development Expenditure pools at 30 percent
The total income taxes payable for the life of mine are calculated as US$64.8 million in addition to BC Mineral Taxes of US$41.5 million.
22.13 Financial Indicators
The economic analysis was carried out using standard discounted cashflow modelling techniques. The production and capital estimates were estimated on an annual basis for the life of mine.
Applicable royalties were applied along with current Federal and Provincial taxes and incorporated into the cashflow model. The economic analysis was carried out on a 100 percent project basis. Given the location and relatively uncomplicated nature of the project, the Base Case uses a 5 percent discount factor in arriving at the project NPV. Standard payback calculation methodology was also utilized.
The project generates a Before-Tax cashflow of US$277 million (US$184 million After-Tax) over 13 years or roughly US$21 million in free cashflow per year. The project financial indicators are shown in Table 22-9 below.
Effective Date: May 29, 2020 Project No. TRQ-06:: | |
|
Page 22-6
Financial Indicators
| | Pre-Tax | After Tax |
NPV @ 0% (US$ millions) | 277.82 | 183.99 |
NPV @ 5% (US$ millions) | 170.18 | 108.09 |
NPV @ 7% (US$ millions) | 140.04 | 86.73 |
IRR % | 30.1% | 23.6% |
| Payback (mo) | 34 | 36 |
As required by NI43-101, the author cautions the reader that the PEA is preliminary in nature, that it includes Inferred mineral resources that are considered too speculative geologically to have the economic considerations applied to them that would enable them to be categorized as mineral reserves, and there is no certainty that the preliminary economic assessment will be realized.
22.14 Sensitivity Analysis
Table 22-10, Table 22-11 and Table 22-12 illustrate the Base Case project economics and the sensitivity of the project to changes in the base case metal prices, operating costs and capital costs. As is typical with precious metal projects, the Homestake Ridge Project is most sensitive to metal prices, followed by initial capital costs, and then operating costs. The NPV in these tables is in millions.
Metal Price Sensitivity – After-Tax
| | Gold Price (US$) | Silver Price (US$) | NPV @ 0% (US$ M) | NPV @ 0% (US$ M) | IRR | Payback (Mo) |
| 40% | 1890 | 16.80 | $372.92 | $238.61 | 39.38% | 31 |
| 30% | 1755 | 15.60 | $325.69 | $206.00 | 35.78% | 32 |
| 20% | 1620 | 14.40 | $278.45 | $173.39 | 32.00% | 33 |
| 10% | 1485 | 13.20 | $231.22 | $140.78 | 27.99% | 34 |
| Base Case | 1350 | 12.00 | $183.99 | $108.09 | 23.63% | 36 |
| -10% | 1215 | 10.80 | $136.76 | $75.29 | 18.82% | 40 |
| -20% | 1080 | 9.60 | $89.52 | $41.94 | 13.23% | 46 |
| -30% | 945 | 8.40 | $38.87 | $6.38 | 6.38% | 75 |
Effective Date: May 29, 2020 Project No. TRQ-06:: | |
|
Page 22-7
Operating Cost Sensitivity – After-Tax
| | NPV @ 0% (US$ M) | NPV @ 5% (US$ M) | IRR | Payback (Mo) |
| 20% | $145.10 | $81.72 | 20.06% | 39 |
| 10% | $164.55 | $94.92 | 21.90% | 38 |
| Base Case | $183.99 | $108.09 | 23.63% | 36 |
| -10% | $203.43 | $121.25 | 25.28% | 35 |
| -20% | $222.88 | $134.41 | 26.88% | 35 |
Capital Cost Sensitivity – After-Tax
| | NPV @ 0% (US$ M) | NPV @ 5% (US$ M) | IRR | Payback (Mo) |
| 20% | $149.01 | $78.75 | 17.08% | 43 |
| 10% | $166.50 | $93.42 | 20.11% | 40 |
| Base Case | $183.99 | $108.09 | 23.63% | 36 |
| -10% | $201.48 | $122.76 | 27.70% | 34 |
| -20% | $218.97 | $137.42 | 32.48% | 33 |
22.15 Financial Model
A summary of the base case financial model is attached in Table 22-13.
Effective Date: May 29, 2020 Project No. TRQ-06:: | |
|
Page 22-8
Homestake Ridge Project
NI43-101F1 Technical Report
Base Case Financial Model (US$ Millions)
| | -1 | 1 | 2 | 3 | 4 | 5 | 6 | 7 | 8 | 9 | 10 | 11 | 12 | 13 |
| Metal Sales | - | 8.67 | 45.80 | 115.62 | 93.00 | 65.33 | 52.76 | 53.28 | 50.41 | 42.41 | 60.20 | 65.92 | 76.35 | 33.14 |
| Less: NSR Royalty | - | (0.02) | (0.08) | (0.16) | (0.18) | (0.30) | (0.19) | (0.31) | (0.71) | (0.59) | (0.85) | (0.71) | (0.25) | (0.03) |
| Add back: Advance Paid Royalty (C$500 k or US$350 k) | - | 0.02 | 0.08 | 0.10 | 0.16 | - | - | - | - | - | - | - | - | - |
| Less: Operating Costs | - | (4.17) | (19.59) | (25.10) | (25.98) | (25.27) | (25.88) | (26.77) | (26.90) | (28.75) | (29.86) | (30.19) | (26.31) | (11.40) |
| Less: Capital Expenditures | (89.09) | (9.65) | (8.57) | (6.41) | (8.32) | (7.03) | (8.86) | (6.91) | (4.64) | (6.58) | (7.91) | (8.95) | (1.17) | (0.80) |
| Net Cashflow - Pre-tax | (89.09) | (5.15) | 17.65 | 84.05 | 58.68 | 32.73 | 17.83 | 19.29 | 18.17 | 6.49 | 21.58 | 26.07 | 48.63 | 20.90 |
| Income taxes-FED & BC | - | - | - | (7.05) | (14.57) | (7.50) | (3.78) | (3.87) | (3.48) | (1.32) | (5.16) | (6.38) | (10.09) | (2.85) |
| BC Mineral Tax | - | (0.09) | (0.52) | (1.81) | (1.34) | (1.52) | (2.34) | (2.55) | (2.45) | (0.92) | (2.92) | (3.48) | (6.35) | (2.72) |
| Net Cashflow – After-tax | (89.09) | (5.24) | 17.12 | 75.19 | 42.78 | 23.71 | 11.70 | 12.87 | 12.23 | 4.25 | 13.51 | 16.21 | 32.19 | 15.33 |
| Cumulative Net Cashflow | (89.09) | (94.33) | (77.20) | (2.02) | 40.76 | 64.47 | 76.18 | 89.05 | 101.28 | 105.53 | 119.03 | 135.24 | 167.43 | 182.76 |
Note: The cashflow model takes into account additional tax depreciation that could be claimed in years 14-16, after the mine closes, to generate losses in those years as tax losses can be carried back three years. Carrying back such losses, which total C$6.5 million, would result in a refund of C$1.8 million of taxes previously paid.
Effective Date: May 29, 2020 Project No. TRQ-06 | |
|
Page 22-9
Homestake Ridge Project
NI43-101F1 Technical Report
23. ADJACENT PROPERTIES
There a number of past producing mines in the vicinity of the Homestake Ridge Project but none are currently in operation. The following sections provide a description of the adjacent mineral claims and past producing mines. The locations are shown on Figure 23-1 below.
Source: Auryn
Figure 23.1: Mineral Properties in the Vicinity of Homestake Ridge
Effective Date: May 29, 2020 Project No. TRQ-06:: | |
|
Page 23-1
Homestake Ridge Project
NI43-101F1 Technical Report
23.1 Kinskuch (Extracted from the Hecla website)
On May 24, 2016, Hecla purchased 100 percent of the Kinskuch property which consists of 156 mining claims totaling 59,400 ha. The Kinskuch property is favorably located within the Iskut-Stewart-Kitsault Belt north of the tidewater communities of Alice Arm and Kitsault, British Columbia with access to the western part of the property on a historic roadbed.
The property hosts potential for the discovery of epithermal silver-gold, gold-rich porphyry, and volcanogenic massive sulfide (VMS) deposits that ultimately could lead to an economic mine.
Prospecting in the vicinity of the Kinskuch claim group began as early as 1889. Exploration interest in this area in the early 1900s was fueled by copper-lead-zinc-silver producers situated around the town of Alice Arm such the Hidden Creek and Bonanza Mines (Granby Consolidated Mining, Smelting and Power), which began production in 1914. The Dolly Varden Mine located west of the northwestern flank of the Kinskuch claim block produced silver into the late 1920’s and the 1950’s. Production from the Kinskuch claim block is limited to three small mines including the Esperanza Mine (4,661 tonnes), located 1.2 km north of Alice Arm, the La Rose Mine (72 tonnes) located 10 kilometres north-northwest of Alice Arm and the Illy Mine, where 33 tonnes of ore were packed 15 km southwest to Alice Arm by horse.
Between 1918 and 2016, a total of 37 exploration/mining companies have conducted line cutting, prospecting, geological mapping, soil, rock, stream sediment sampling surveys, geophysical surveys, trenching and diamond drilling within the extents of the Kinskuch Claims looking for precious metal enriched volcanogenic massive sulfides (VMS) and porphyry copper ± molybdenum-gold-silver ore deposits. The most recent work on the Kinskuch property was completed by Bravo Gold which controlled the property between 2011 and 2015.
Bravo Gold conducted a four diamond drill hole program totaling 855.8 metres in 2011 on the Illiance Target. In addition, they collected 245 rock samples and 388 soil samples on various target areas at Kinskuch. In 2013, they also conducted sampling, mapping and prospecting at the Illiance Target, with reconnaissance mapping and rock sampling programs on the Illiance and Gold Stream target areas.
The Kinskuch property is located at the southern end of the area defined as the Stewart Complex within the same stratigraphy which hosts the Eskay Creek, Silbac-Premier, and SNIP deposits. The Hazelton Group overlies the Stuhini Group and include hornblende plus plagioclase phyric dacitic ignimbrites and associated volcanic sedimentary rocks. The Lower-Middle Jurassic Eskay Creek stratigraphy overlies these rocks and is composed of marine felsic volcanic rocks and associated epiclastic sedimentary rocks. Intrusive rocks are of Cretaceous to Eocene in age and are associated with the Coast Plutonic Complex.
Effective Date: May 29, 2020 Project No. TRQ-06:: | |
|
Page 23-2
Homestake Ridge Project
NI43-101F1 Technical Report
The Homestake and Illiance River mineralized trends located on the Kinskuch property are Volcanogenic Massive Sulfide (VMS) prospective trends hosted in the same stratigraphy as that which hosts the Eskay Creek deposit to the north.
There are no NI43-101 compliant resources reported on the Kinskuch property.
23.2 Dolly Varden
Dolly Varden Silver Corporation owns 100 percent of the Dolly Varden Mines historic silver property. The Dolly Varden Mines properties comprise 8,800 ha (88 km2) located in the Stewart Complex, which is host to both base and precious metal deposits, including the prolific Eskay Creek Mine. Over 220 M oz Ag and over 7 M oz Au has been produced by the Hazelton Group Arc Assemblage. High sulphidation VMS occurs in the youngest Hazelton group rocks. The property hosts four historically active mines, with unexplored sectors.
The property hosts two past producing deposits with production of 20 million ounces of Silver. The Dolly Varden Mine produced 1.5 million ounces at an average grade of 35.7 ounces per ton in the early 1920’s, and the Torbrit mine which produced 18.5 million ounces of silver at an average recovered grade of 13.58 ounces per ton from 1949 to 1959.
The geology underlying the Dolly Varden property consists of volcano-sedimentary rocks belonging mostly to the lower and middle Jurassic Hazelton Group. These include intermediate volcanic and volcaniclastic rocks of the Betty Creek Formation and bimodal volcanic and sedimentary rocks of the Salmon River Formation.
The principal silver-base metal deposits of the Kitsault River valley have been interpreted as vein mineralization by early workers. The main deposits are thought to be volcanic exhalative in origin. Deposits of this type are formed as sub-aqueous hot-spring type deposits on the seafloor, as products of hydrothermal solutions that have vented from sub-seafloor fracture and fault systems. Furthermore, the silver deposits of the upper Kitsault valley are mapped with important geological similarities to the Eskay Creek deposit, providing an analog for exploration on the Property.
The most prominent mineralized zone on the Property is an aerially extensive horizon of chemical sediment (“exhalative”) mineralization, known as the Dolly Varden-Torbrit Horizon (the “DVTH”) that extends from the Dolly Varden mine, on the west, passing though the North Star underground workings and continuing into the Torbrit mine, on the east. The DVTH exhalative body forms an almost continuous sheet, ranging in true thickness from 3 to 38 m, which extends from the Dolly Varden West zone to Moose-Lamb. Syn-depositional as well as post-dispositional faults have created a number of basins that divide the DVTH into offset blocks.
Effective Date: May 29, 2020 Project No. TRQ-06:: | |
|
Page 23-3
Homestake Ridge Project
NI43-101F1 Technical Report
Separate from the DVTH body, the Red Point zone (on the western fringe of the upper Kitsault Valley) and the Wolf (on the eastern side of the valley) each have geological similarities to the targeted hydrothermal vein and sub-aqueous hot spring geology but are interpreted to share a position higher in the volcanic stratigraphy than the DVT horizon.
A recent NI43-101 Technical Report lists 3.42 million tonnes of Indicated Resources at 299.8 gpt Ag, (32.9 million oz) and an additional 1.285 million tonnes of Inferred Resources at 277 gpt Ag (11.45 million oz).
23.3 Kitsault
The Kitsault Project is located 140 km north of Prince Rupert, British Columbia and south of the head of Alice Arm, an inlet of the Pacific Ocean, in the Skeena Mining Division. The Kitsault Project was a producer of molybdenum between 1967 and 1972 and again between 1981 and 1982. The Kitsault Project is fully permitted for construction.
The Kitsault property is the host of the rehabilitated Kitsault open pit mine. The property is 100 percent owned by Avanti Kitsault Mine Ltd., a wholly owned subsidiary of Alloycorp. A 1 percent NSR is held by Aluminerie Lauralco Inc. which may be purchased for US$10 million within 90 days of the presentation of a Bankable Feasibility Study.
The property contains three known molybdenum deposits, Kitsault, Belly Moly and Roundy Creek, and consists of 8,286 ha of mineral leases and mining claims. Mineral Resources were estimated at Kitsault in 2009 by Avanti, and audited by SRK, using historic assay data derived from drilling conducted from 1967 to 1982 and drilling from 2008. Earlier in 2008, SRK conducted a Preliminary Economic Assessment which was revised in 2009 and was publicly disclosed. In 2010 Avanti released the results of a Feasibility Study on the project prepared by AMEC. This was revised in February 2013. As part of the Feasibility update undertaken in late 2012, a new mine plan was used to re-estimate mine capital and operating costs. The result of this work yielded a new NI43-101 compliant resource statement as follows: 129.0 Mt grading 0.092 percent Mo classified as Proven and 99.2 Mt grading 0.070 percent Mo classified as Probable Mineral Reserves. The Reserves are stated at a 0.026 percent Mo cut-off grade.
Alloycorp initiated the environmental assessment process for Kitsault in April 2010. In March 2013, the EAO referred the project to provincial Ministers for a decision on whether to issue an Environmental Assessment ("EA") certificate. An EA Certificate was issued by the provincial government in March 2013, following the conclusion that the Avanti Kitsault Project is not expected to result in any significant adverse effects based on the mitigation measures and conditions of the EA Certificate. Final EA approval was received by the Government of Canada in June 2014.
Effective Date: May 29, 2020 Project No. TRQ-06:: | |
|
Page 23-4
24. OTHER RELEVANT DATA AND INFORMATION
The authors are not aware of any additional data or information available for disclosure.
Effective Date: May 29, 2020 Project No. TRQ-06:: | |
|
Page 24-1
25. INTERPRETATION AND CONCLUSIONS
This Technical Report includes an updated Mineral Resource estimate (MRE) that is based on additional drilling conducted by Auryn, re-logging of historic cores, and a re-interpretation of the geological model and resource wireframes. This resulted in an 18 percent increase in Indicated Resources and a 23.5 percent reduction in Inferred Resources when compared to the 2017 MRE. The combined impact of the re-interpreted resource wireframes is an overall reduction in tonnes, an increase in metal grades for gold, silver and copper, and an overall reduction in contained metal.
A Preliminary Economic Assessment of the most recent MRE was carried out by applying an economic cut-off grade and operating costs to blocks inside the resource wireframes and allowing stope optimization software to determine which blocks would produce a positive Net Smelter Return. The resulting PEA mine plan converted 55 percent of the overall tonnes in the 2019 MRE into potentially economically mineable blocks. The conversion included 66 percent of the tonnes in Homestake Main, 42 percent of the tonnes in Homestake Silver, and 84 percent of the tonnes in South Reef. In terms of recovered gold, the PEA mine plan captures 56 percent of the gold at Homestake Main, 41 percent at Homestake Silver, and 65 percent at South Reef, for an overall gold recovery of 52 percent of the resource.
The results of the PEA suggest that a 900 tonne per day underground mining and milling operation could yield positive financial returns over a 13 year mine life. Metallurgical testing to date shows high recoveries for gold and silver in a conventional flowsheet consisting of crushing, grinding, selective flotation to produce base metal concentrates, and a final regrind and flotation of pyrite tailings to produce a pyrite concentrate. Intense leaching of the pyrite concentrate results in additional recovery of precious metals to doré. The resulting base metal concentrates are expected to be highly saleable, despite penalty values of deleterious elements, due to the high precious metal grades.
The initial project capital of US$88.4 million is comparable to several development stage projects of a similar size with a similar flowsheet. Further, operating costs of $89.40 per tonne milled benchmark favorably with similar projects such as the Eastmain Eau Claire project, and the Pure Gold Madsen mine now under construction.
The authors suggest next stage for the Homestake Ridge Project should be a combination of de-risking, and maximizing opportunities, through the completion of Feasibility level studies as outlined in the following sections.
Effective Date: May 29, 2020 Project No. TRQ-06:: | |
|
Page 25-1
25.1 Mineral Resource Conclusions
Based on a review of the Mineral Resource model and documentation provided, RPA offers the following conclusions:
■
The grade estimate is reasonable, and the model is suitable to report Mineral Resources. The block model is of sufficient quality to be used as an engineering basis for a PEA.
■
The Mineral Resource model has been improved as compared to the previous estimates. Vein solids appear to be better correlated, the grade estimation methodology in Leapfrog is generally suitable, and variography is reasonable.
■
Capping levels are generally reasonable. RPA notes that Auryn applies capping after compositing. RPA prefers to cap assays before compositing, however, in the case of the Project, compositing and capping during grade estimation runs produced similar results to capping assays.
■
The sub-block size is small at 0.5 m. RPA understands that this block size is used to honour volumes in narrow domains, however, engineering may have challenges when running the model through the stope optimizer.
■
The drill and sample database appears to be well organized and administrated.
■
Much of the volume of the vein sets does not meet the two metre nominal horizontal width cut-off. Auryn states that the mineralized volume still generally meets a grade by true width (GT) value of 4.0 (2.00 g/t AuEq * 2.0 m horizontal thickness).
■
Assay certificate verification results were excellent, with no errors identified.
■
Drill collars are placed on (LiDAR-based) topography, except for several holes located away from the modelled zones.
■
Quality assurance/quality control (QA/QC) procedures and results for the Project are sufficient to support Mineral Resource estimation.
■
Density measurement methodology and coverage are appropriate for the deposit.
■
The deposit is adequately drilled to support interpretation of the vein solids in each zone.
■
Correlation in some parts of the deposit appears ambiguous. Choosing the alternate interpretation in these areas, however, would not likely result in marked differences in volume.
Effective Date: May 29, 2020 Project No. TRQ-06:: | |
|
Page 25-2
25.2 Risk
At this early stage of development, the project does carry risks in terms of the resource classification, capital and operating costs, mining conditions, permitting and stakeholder approvals.
The following risks should be addressed with further studies:
■
Almost 88 percent of the current Mineral Resources are classed as Inferred. Advancing the project to a Feasibility level of evaluation will require upgrading a large portion of the Inferred resources to Indicated or Measured.
■
There are no geotechnical studies or geotechnical data to support the proposed mining method, stope spans and volumes, the mine production rate, the stability of mine openings or mining costs allocated to ground support. Several notable mine failures have been attributed to over optimistic projections of ground conditions in support of mining.
■
There have been no groundwater or surface hydrological studies to determine groundwater inflows during mining, and the mine dewatering requirements.
■
A significant portion of the capital and operating costs are based on benchmarking costs at similar operations. These costs need to be re-evaluated from first principles based on an actual plan of operations and for the specific conditions at the project site.
■
The economic viability of the project will be sensitive to fluctuating foreign exchange rates (US$ converted to C$) since all of the onsite cash costs will be denominated in Canadian dollars yet all of the revenues will be denominated in US dollars.
■
The economic viability of the project will likewise be sensitive to changes to the local and Federal tax regime including the prevailing tax rates, future royalties on production, credits for tax losses, and changes in depreciation and capital gains.
■
The PEA assumes a year-round operation however operating in winter conditions may prove to be challenging and may negatively impact the operating costs.
■
The PEA financials assume the concentrates can be sold without incurring any penalties for mercury, arsenic or antimony.
Effective Date: May 29, 2020 Project No. TRQ-06:: | |
|
Page 25-3
25.3 Opportunities
The PEA mine plan does afford some opportunities for optimization including:
■
The mining cut-off grades and mining costs should be evaluated in more detail in order to optimize the recovery of economic mineralization. This is especially true for Homestake Silver zone which has the lowest conversion of resources into the PEA mine plan.
■
The PEA does not attempt to optimize the mill feed according the feed grade or mineralization. In this preliminary evaluation the deposits are mined in sequence whereas it may be more profitable to mine the deposits concurrently to maximize the feed grade.
■
The Golden Triangle region where Homestake Ridge is located is an area of intense mineral exploration and development, and there may be synergies with other local development stage projects in order to share some of the infrastructure capital costs. In particular, the construction of a transmission line to the local BC Hydro grid is worth exploring, as are several run-of-river power schemes that could lower the operating costs. The nearby Kitsault Lake hydro-power scheme is another opportunity if investors are willing to resume operations and sell the power to Homestake Ridge.
■
The operating costs in the PEA are based on a Contractor owned and operated equipment fleet. An alternative option would be to lease the underground mobile equipment (to keep the startup capital low) and operate the mine with owner operated fleet.
Effective Date: May 29, 2020 Project No. TRQ-06:: | |
|
Page 25-4
26. RECOMMENDATIONS
In the opinion of MineFill this Technical Report recommends that the Homestake Ridge Project be advanced to a Feasibility level of evaluation. The following sections include recommendations for work that needs to be completed, and a budget.
26.1 Future Studies
26.1.1 Geology and Mineral Resources
RPA’s recommendations are as follows:
■
RPA recommends investigating HYR as a precaution for smearing high grade assays. To date, drill coverage is insufficient to indicate that the highest grades in the deposit are being smeared unfairly. RPA recommends that Auryn consider using HYR as more drilling is completed.
■
Grade trends show as “stripes”, or narrow bands, sub-parallel to hanging wall and footwall. This behaviour is in line with Auryn’s use of variable orientation grade estimation methods in the interpretation of the mineralization. Using full-width composites would eliminate the phenomenon, however, contained grades and metal would not likely change appreciably, overall.
■
In Leapfrog, a minimum thickness of 0.2 m was applied to HM, and pinchouts were included in the estimation process for HS. RPA’s high-level check estimates that approximately 25 percent of the drill hole intercepts ≥ 2.0 g/t AuEq are less than two metres thick, and 10 percent are less than 1.5 m thick. RPA recommends that Leapfrog’s pinchout feature not be used in future updates.
■
RPA recommends building a set of minimum width vein solids in future models to facilitate classification and mine planning. Swath plots and comparative statistics show that block grade distribution is reasonably controlled relative to sample grades.
■
The *_lg low grade series of solids were constructed to allow for some grade in dilution where appropriate, and so their morphology is different but less important to the model. There are minor inconsequential “blobs” of dilution away from the zones that could be removed.
Effective Date: May 29, 2020 Project No. TRQ-06:: | |
|
Page 26-1
26.1.2 Resource Drilling
A significant program of resource drilling is needed to upgrade the current Inferred Resources to a Measured or Indicated Classification. Under the CSA rules, Feasibility level studies cannot include Inferred Resources. The focus of the additional drilling would likely include infill drilling and definition drilling at all three of the Homestake Ridge deposits.
26.1.3 Geotechnical Studies
A number of geotechnical studies are required to advance the project.
The most critical study, at this stage, is a comprehensive geotechnical assessment of ground conditions at the each of the 3 deposits. This study is critical because it will be needed to validate the mining methods assumed herein, and the geometry and size of open spans for mine development and stoping, and the requirements (and costs) for ground control. The scope of this evaluation must include geotechnical drilling, fracture mapping, rock strength and rock quality assessments, and a preliminary assessment of groundwater pressures and flows.
Additional geotechnical studies will also be needed to support the surface development which includes the roads, the fresh water diversion dam, the tailings dam and tailings impoundment, the waste rock dumps, and the plant site. A preliminary assessment suggests that ground conditions will be favorable but additional mapping, test pits and drilling will be required.
The geotechnical studies will also need to evaluate the sources and quantities of borrow materials available for construction.
26.1.4 Environmental Testing
Preliminary environmental testwork has been carried out to determine the acid generating potential of the waste rock and tailings, but additional work is required to expand the scope to include all of the major rock types from each of the three deposits. Once the acid potential can be mapped to each of the major rock types it will be possible to generate volumetric estimates of PAG versus NAG rock produced at each deposit.
26.1.5 Environmental Monitoring
Baseline environmental monitoring will be needed for any permit submittals to advance the project. The key variables include: surface water quality and geochemistry, groundwater quality and geochemistry, air quality, and climate monitoring (wind speed and direction, temperatures and humidity).
Effective Date: May 29, 2020 Project No. TRQ-06:: | |
|
Page 26-2
26.1.6 Surface Hydrology and Water Balance
Surface runoff from melting glaciers and rainfall will need to be assessed in a site wide water balance as the project likely sits in a net positive water environment (in other words the project will produce more water than it can consume). Hydrological studies will be needed to quantify the volumes of surface runoff, and volumes of mine water produced as this will impact the scope and size of a water treatment plant needed to treat water discharges.
26.1.7 Metallurgical Testing
The second most critical area for future studies is advancement of the metallurgical testwork, and further optimization of the flowsheet. This testing will be needed to optimize the metals recovery to concentrates, and to maximize the concentrate grades. An overview of the ongoing metallurgical testing is as follows:
■
Continue parameter testing to optimize the lead and copper flotation process. Tests should investigate different regrind sizes, coarser primary grinds, removal of cyanide, different collectors to name a few.
■
Locked cycle tests should be conducted to obtain dynamic metallurgical performance estimates.
■
Generate more concentrate for cyanide leach studies and fully optimize the leach process. Parameters to consider are, concentrate regrind size, cyanide dosage, addition of lead nitrate to name a few.
■
Sub samples of varying feed grades and geological domains should be tested using the optimized flowsheet to understand variability in the deposit.
■
The same subsamples should be subjected to comminution studies to determine energy requirements for grinding the rock. There was a significant grind time difference between the Main and Silver zone.
■
The settling properties of the flotation and leach tailings should be measured.
■
Whole ore leaching should be revisited as an alternative to the hybrid flowsheet for comparison purposes.
26.1.8 Power Source
One of the largest components of the operating costs will be electric power. Even at the BC Hydro industrial power rate, power costs will comprise about 10 percent of the operating cost. It would seem prudent to update the 2012 Knight Piesold studies on electric power and, in particular, the potential for installation of a small run-of-river mini hydro.
Effective Date: May 29, 2020 Project No. TRQ-06:: | |
|
Page 26-3
26.2 Proposed Budget
The proposed budget for the work programs listed about is US$35 million as broken down in Table 26-1 below.
Future Work Tasks and Budget (US$)
| Task | Scope | Budget |
| Resource Infill Drilling | 120 – 140 km of drilling | $30,000,000 |
| | ■ Sampling | |
| | ■ Assays | |
| Metallurgical Drilling/Samples | Large diameter core | $500,000 |
| Geotechnical Studies | Geotechnical drilling | $250,000 |
| | Geotechnical analysis | $150,000 |
| Environmental Testing | Tailings | $150,000 |
| | Waste Rock | |
| Groundwater Studies | Monitoring Wells | $150,000 |
| | Aquifer/Packer Tests | |
| Surface Water Hydrology | Stream Gauges | $250,000 |
| | Site Water Balance | |
| Metallurgical Testing | Additional Testing | $500,000 |
| Power Sources | Update 2012 Study | $50,000 |
| Pre-Feasibility Study | Consultants Report | $3,000,000 |
| Total Budget | | $35.0 Million |
Effective Date: May 29, 2020 Project No. TRQ-06:: | |
|
Page 26-4
27. REFERENCES
Alldrick, D.A., 1993: Geology and metallogeny of the Stewart Mining Camp, northwestern British Columbia; British Columbia Ministry of Energy Mines and Petroleum Resources Bulletin 85, 105p.
Alldrick, D.J., Gabites, J.E. and Godwin, C.I. (1987): Lead Isotope Data from the Stewart Mining Camp; in Geological Fieldwork 1986, B.C. Ministry of Energy, Mines and Petroleum Resources, Paper 1987-1, pages 93-102
Anyox Hydro Electric Corporation. 2013. Kitsault Timeline. Available at: https://www.anyox.com/anyox-now/kitsault-timeline/. Accessed on: February 28, 2020.
Auryn Resources Inc., 2019: Homestake Ridge Internal Mineral Resource Estimate December 2019. Internal report prepared by Y. Likhtarov.
BC Conservation Data Centre. 2020. BC Species and Ecosystems Explorer. B.C. Ministry of Environment. Victoria, B.C. Available at: http://a100.gov.bc.ca/pub/eswp/. Accessed on: February 18, 2020.
BC Archaeology Branch. 2020. Results of Archaeology Data Request. Ministry of Forests, Lands, Natural Resource Operations and Rural Development. February 6, 2020.
Bryson, A. 2007. Assessment Report on the Homestake Ridge Project, Skeena Mining Division. Report prepared for Bravo Ventures Group Inc. October 29, 2007. Mineral Resource Branch Assessment Report No. 29355.
Bryson, A., 2007: Assessment Report on the Homestake Ridge Project, Skeena Mining Division. Report prepared for Bravo Ventures Group Inc., dated 29 October, 2007. Mineral Resource Branch Assessment Report No. 29355.
Canadian Environmental Assessment Agency (CEAA). 2012. Archived - Kitsault Hydro Electric Project - Kitsault Hydro Electric Corporation. Available at: https://aeic-iaac.gc.ca/052/details-eng.cfm?pid=3547#decision. Accessed on: February 28, 2020.
Canadian Environmental Assessment Agency (CEAA). 2013. Kitsault Mine Project Comprehensive Study Report. August 2013. Available at: https://www.ceaa-acee.gc.ca/050/documents/p57958/93659E.pdf. Accessed on: January 31, 2020.
Effective Date: May 29, 2020 Project No. TRQ-06:: | |
|
Page 27-1
Colpron, M. and Nelson, J., 2011: A Digital Atlas of Terranes for the Northern Cordillera. A Collaborative Effort of the BC Geological Survey and the Yukon Geological Survey. Accessed online from Yukon Geological Survey (www.geology.gov.yk.ca).
COSEWIC. 2012a. COSEWIC assessment and status report on the Grizzly Bear Ursus arctos in Canada. Committee on the Status of Endangered Wildlife in Canada. Ottawa. xiv+ 84 pp. Available: http://www.registrelepsararegistry.gc.ca/document/default_e.cfm?documentID=2459. Accessed on: February 5, 2020.
COSEWIC. 2012b. COSEWIC assessment and status report on the Marbled Murrelet Brachyramphus marmoratus in Canada. Committee on the Status of Endangered Wildlife in Canada. Ottawa. xii + 82 pp. Available: http://www.registrelepsararegistry.gc.ca/document/default_e.cfm?documentID=2463. Accessed on: February 5, 2020.
COSEWIC. 2013. COSEWIC assessment and status report on the Northern Goshawk Accipiter gentilis laingi in Canada. Committee on the Status of Endangered Wildlife in Canada. Ottawa. x + 56 pp. Available: http://www.sararegistry.gc.ca/document/default_e.cfm?documentID=751. Accessed on: February 5, 2020.
Demarchi, D.A. 2011. An Introduction to the Ecoregions of British Columbia. 3rd Ed. Ecosystem Information Section, Ministry of Environment. Victoria, British Columbia. March 2011.
Dolly Varden Silver Corp. 2014. Dolly Varden Silver: Kitsault Hydro Electric Begins Upgrading Mine Access Road for Recommissioning of 8MW Kitsault Storage Dam Hydro Facility. Available at: https://www.dollyvardensilver.com/news/2014/dolly-varden-silver-kitsault-hydro-electric-begins-upgrading-mine-access-road-for-recommissioning-of-8mw-kitsault-storage-dam-h/. Accessed on: February 28, 2020.
EES Consulting, Inc. 2004. Homestake Creek Hydroelectric Project Fisheries Investigation; Habitat Assessment; IFR recommendation. Prepared for Department of Fisheries and Oceans, Prince Rupert, BC. December 2004.
Environment and Climate Change Canada (ECCC). 2012. Management Plan for the Northern Mountain Population of Woodland Caribou (Rangifer tarandus caribou) in Canada. Species at Risk Act Management Plan Series. Environment Canada, Ottawa. vii + 79 pp.
Effective Date: May 29, 2020 Project No. TRQ-06:: | |
|
Page 27-2
Environment and Climate Change Canada (ECCC). 2018. General Nesting Periods of Migratory Birds. Available at: https://www.canada.ca/en/environment-climate-change/services/avoiding-harm-migratory-birds/general-nesting-periods/nesting-periods.html#ZoneA. Accessed on: February 21, 2020.
Environment Yukon. 2016. Science-based guidelines for management of Northern Mountain caribou in Yukon. Yukon Fish and Wildlife Branch Report MR-16-01. Whitehorse, Yukon, Canada.
Environmental Assessment Office (EAO). 2013. Kitsault Mine Project Assessment Report with respect to the Application by Avanti Kitsault Mine Ltd. for an Environmental Assessment Certificate pursuant to the Environmental Assessment Act, S.B.C. 2002, c.43. March 1, 2013.
Evans, G., and Lehtinen, J., 2001: 2001 Geological and Geochemical Report on the Homestake Ridge Property, Skeena Mining Division, British Columbia Lat. 54° 45” Long. 129° 35”, NTS 103P/12E and 13E. Internal company report. Teck Cominco Ltd.
Evans, G., and Macdonald, R., 2003: Technical Report on the Homestake Ridge Project, Skeena Mining Division, British Columbia, dated July 4, 2003
Folk, P., and Makepeace, D., 2007: Report on the Homestake Ridge Project Skeena Mining Division British Columbia. Report prepared for Bravo Ventures Group Inc., dated 11 April, 2007.
Gitanyow Nation and the Province of British Columbia. 2012. Gitanyow Lax'Yip Land Use Plan. Contained within the Gitanyow Huwilp Recognition & Reconciliation Agreement. Available: http://www.gitanyowchiefs.com/gwelxyeenst. Accessed on: February 4, 2020.
Godwin, C.I., Pickering, A.D.R., and Gabites, J.E., 1991. Interpretation of galena lead isotopes from the Stewart-Iskut area; in Geological Fieldwork 1990, British Columbia Geological Survey Paper 1991-1, pp. 235-243.
Government of Canada. 2019. Canadian Climate Normals 1981 – 2020 Station Data, Nass Camp, British Columbia. Available at: https://climate.weather.gc.ca/climate_normals/results_1981_2010_e.html?stnID=482&autofwd=1. Accessed on: February 4, 2020.
Greig, C.J., Anderson, R.G., Daubeny, P.H., Bull, K.F. and Hinderman, T.K., 1994: Geology of the Cambria Icefield: regional setting for Red Mountain gold deposit, northwestern British Columbia; Geological Survey of Canada, Current Research Paper 1994-A, pp 45-56.
Effective Date: May 29, 2020 Project No. TRQ-06:: | |
|
Page 27-3
Grove, E.W., 1986: Geology and Mineral Deposits of the Unuk River-Salmon River Anyox Area. British Columbia Ministry of Energy, Mines and Petroleum Resources Bulletin 63, 434 pp.
Hemmera Envirochem Inc. 2016. Wildlife Management Plan, Search Project Phase II, Geoscience BC. Prepared for Geoscience BC. May 2016. Available: www.geosciencebc.com/i/RFP/RFP%20Minerals_2016.05.17/160506_Search%20PhII_wildlife%20management%20plan.pdf. Accessed on: February 5, 2020.
iMapBC. 2020. British Columbia Government, Data BC, Geographic Services, iMapBC 2.0. Available at: https://maps.gov.bc.ca/ess/hm/imap4m/. Accessed on: February, 2020.
Kasper, B., and Metcalfe, P., 2004: Summary Report for the Homestake Ridge Project, British Columbia. Report prepared for Bravo Ventures Group Inc., dated 10 December, 2004.
Knight, C., and Macdonald, R., 2010: 2009 Aerotem Airborne Survey Assessment Report on the Homestake Ridge Project. Unpublished Report prepared for Bravo Gold Corp.
Knight Piésold Consulting (KP). 2011. Homestake Ridge Project – Integration of a Hydroelectric Facility within the Mine Development Concept #1. June 1, 2011.
Macdonald, R.W.J., and Rennie, D.W., 2013: Technical Report on the Homestake Ridge Project, an updated Mineral Resource, Kitsault, British Columbia. A report prepared for Homestake Resource Corporation, June 7, 2013.
Macdonald, R.W.J., and Rennie, D.W., 2016: Technical Report on the Homestake Ridge Project, an updated Mineral Resource, Kitsault, British Columbia. A report readdressed to Auryn Resources Inc., November 15, 2016.
McClaren, E.L., Mahon, T., Doyle, F.I. and W.L. Harower. 2015. Science-Based Guidelines for Managing Northern Goshawk Breding Areas in Coastal British Columbia. Journal of Ecosystems and Management 15(2):1–91. Published by the Journal of Ecosystems and Management. Available: http://jem-online.org/index.php/jem/article/viewFile/576/506. Accessed on: February 5, 2020.
Ministry of Energy, Mines and Petroleum Resources (MEMPR). 2017a. Mineral Titles Information Update No. 40 – Mining and Placer Leases Explained. Victoria, BC. Revised March 28, 2017. Available at: https://www2.gov.bc.ca/assets/gov/farming-natural-resources-and-industry/mineral-exploration-mining/documents/mineral-titles/notices-mineral-placer-titles/information-updates/infoupdate40.pdf Accessed on: March 6, 2020.
Effective Date: May 29, 2020 Project No. TRQ-06:: | |
|
Page 27-4
Ministry of Energy and Mines (MEMPR). 2017b. Health, Safety and Reclamation Code for Mines in British Columbia. Victoria, BC. Revised June 2017. Available at: https://www2.gov.bc.ca/assets/gov/farming-natural-resources-and-industry/mineral-exploration-mining/documents/health-and-safety/code-review/health_safety_and_reclamation_code_2017_rev.pdf. Accessed on: March 2, 2020.
Ministry of Energy and Mines (MEMPR) and Ministry of Environment (MOE). 2016. Joint Application Information Requirements for Mines Act and Environmental Management Act Permits. Prepared By: British Columbia Ministry of Energy and Mines & British Columbia Ministry of Environment. February 2016. Available at: https://www2.gov.bc.ca/assets/gov/farming-natural-resources-and-industry/mineral-exploration-mining/documents/permitting/minesact-ema_application_information_requirements_feb2016.pdf. Accessed on: March 6, 2020.
Ministry of Environment (MOE). 2014. British Columbia Ungulate Species Regional Population Estimates and Status - Preseason 2014. Available: http://www.env.gov.bc.ca/fw/wildlife/managementissues/docs/2014_Provincial%20Ungulate%20Numbers%20Oct%2030_Final.pdf. Accessed on: February 5, 2020.
Ministry of Forests, Lands, Natural Resource Operations and Rural Development (FLNRORD). 2012. Nass South Sustainable Resource Management Plan. Available: https://www.for.gov.bc.ca/tasb/slrp/srmp/north/nass_south/docs/NassSouth_srmp_plan_approved_june2012.pdf. Accessed on: February 4, 2020.
Ministry of Forests, Lands, Natural Resource Operations and Rural Development (FLNRORD). 2014. A Compendium of Wildlife Guidelines for Industrial Development Projects in the North Area, British Columbia: Interim Guidance. Available: http://a100.gov.bc.ca/pub/eirs/lookupDocument.do?fromStatic=true&repository=BDP&documentId=12121. Accessed on: February 5, 2020.
Ministry of Forests, Lands, Natural Resource Operations and Rural Development (FLNRORD). 2016. New regulations enact historic Great Bear Rainforest legislation. Available at: https://news.gov.bc.ca/13388. Accessed on: February 4, 2020.
Ministry of Forests. 1993. A Field Guide to Site Identification and Interpretation for the Prince Rupert Forest Region: Part 1. Land Management Handbook Number 26. June 1993. Available at: https://www.for.gov.bc.ca/hfd/pubs/Docs/Lmh/Lmh26/Lmh26part1.pdf. Accessed on: February 4, 2020/
Effective Date: May 29, 2020 Project No. TRQ-06:: | |
|
Page 27-5
Mountain Goat Management Team. 2010. Management Plan for the Mountain Goat (Oreamnos americanus) in British Columbia. British Columbia Management Plan Series, Management Plan. Mountain Goat Management Team, BC Ministry of Environment. Available at: http://www.env.gov.bc.ca/wld/documents/recovery/management_plans/MtGoat_MP_Final_28May2010.pdf. Accessed on: February 5, 2020.
One-eighty Consulting Group (one-eighty). 2018. Homestake Ridge Mineral Exploration Project Management and Monitoring Plan for: Grizzly Bear, Mountain Goat, Moose, Coastal Northern Goshawk, and Marbled Murrelet. Developed on behalf of Auryn Resources Inc. June 27, 2018.
Parken, C.K. 1997. Nass River Steelhead Life History Characteristics Pertaining to the Nass Habitat Capability Model. Prepared for British Columbia Ministry of Environment, Lands and Parks, Fisheries Branch, Skeena Region. Prepared by Cascadia Natural Resource Consulting. July 1997. Available at: http://www.env.gov.bc.ca/skeena/fish/sk_series_reports/sk110.pdf. Accessed on: January 31, 2020.
pHase Geochemistry Inc. 2012. Geochemical Characterization of Split Samples from the Waste Rock Field Barrel Program, Homestake Ridge Project (FINAL). October 4, 2012.
Price, K. and Mclennan, D. 2001. Hydroriparian Ecosystems of the North Coast: Background report for the North Coast Land and Resource Management Plan. June 11, 2001
Province of British Columbia. 2019. Great Bear Rainforest, Stewardship, 3. Forest & Marine Plans, Land-use Zones. Available at: https://greatbearrainforest.gov.bc.ca/tile/land-use-zones/. Accessed on: February 4, 2020.
Rennie, D., Scott, K., McDonough, B., 2010: Technical Report on the Homestake Ridge Project, Stewart, British Columbia, Canada. Dated June 28, 2010.
Rennie, D., 2011: Technical Report on the Homestake Ridge Project, Kitsault, British Columbia, Canada, NI43-101 Report prepared for Bravo Gold Corp., dated May 20, 2011, 145 pp.
Rescan Environmental Services Ltd. (Rescan). 1995. 1994 Environmental Studies at Kitsault Lake. Prepared for Lac Minerals Ltd. February, 1995.
Roscoe Postle Associates Inc., 2017, Technical Report on The Homestake Ridge Project, Skeena Mining Division, Northwestern British Columbia Prepared For Auryn Resources Inc.
Effective Date: May 29, 2020 Project No. TRQ-06:: | |
|
Page 27-6
SGS Minerals Services (SGS). 2011. An Investigation into Environmental Characterisation of Homestake Ridge Tailings. Prepared for Bravo Venture Group Inc. Project 12198-001 – Final Report. March 8, 2011
Shouldice, T.W., and Coombs, H., 2016: Process Development Studies, Homestake Ridge Gold-Silver Deposit. A report prepared by Base Metallurgical Laboratories for Auryn Resources Inc., 19p.
Swanton, D., Baker, D., and Hughes, C., Homestake Ridge Project 2014: Diamond drilling, geological and geochemical report. A report prepared on behalf of Agnico Eagle Mines Limited by Equity Exploration Consultants Ltd., 58p.
Swanton, D., Baker, D., Hughes, C., Marsden, H., and Lajoie, J., 2013: Homestake Ridge Project 2013 diamond drilling, geological and geophysical report. A report prepared on behalf of Agnico Eagle Mines Limited by Equity Consultants Ltd.
Triton Environmental Consultants Ltd. (Triton). 2012a. Homestake Ridge Project Surface Water Quality Initial Site Visit Report. Prepared for Allnorth Consultants Ltd. February 10, 2012.
Triton Environmental Consultants Ltd. (Triton). 2012b. Homestake Ridge Project Proposed Road Stream Assessment Report. Prepared for Allnorth Consultants Ltd. January 20, 2012.
Walcott, P.E., 2017: A Logistical Report on Induced Polarization Surveying, Homestake Ridge Project, Skeena Mining Division, British Columbia, 55°45’N. 129°35’W. A report prepared for Homestake Resources Corp. by Peter E. Walcott and Associates Limited, 7p.
Effective Date: May 29, 2020 Project No. TRQ-06:: | |
|
Page 27-7
28. QUALIFIED PERSONS CERTIFICATES
Qualified Persons certificates for the following individuals are included:
■
Dr. David Stone, P.Eng., MineFill Services, Inc.
■
Mr. Philip Geusebroek, P.Geo., Roscoe Postle Associates Inc.
■
Mr. Paul Chamois, P.Geo., Roscoe Postle Associates Inc.
■
Mrs. Mary Mioska, P.Eng., OneEighty Consulting
Effective Date: May 29, 2020 Project No. TRQ-06:: | |
|
Page 28-1