 Q3 2012 Earnings Conference Call October 24, 2012 Exhibit 99.2 |
 Safe Harbor Statement Safe Harbor Statement This slide presentation should be reviewed in conjunction with SunCoke’s Third Quarter 2012 earnings release and conference call held on October 24, 2012 at 10:00 a.m. ET. Some of the information included in this presentation contains “forward-looking statements” (as defined in Section 27A of the Securities Act of 1933, as amended and Section 21E of the Securities Exchange Act of 1934, as amended). Such forward-looking statements are based on management’s beliefs and assumptions and on information currently available. Forward-looking statements include the information concerning SunCoke’s possible or assumed future results of operations, the planned Master Limited Partnership, business strategies, financing plans, competitive position, potential growth opportunities, potential operating performance improvements, the effects of competition and the effects of future legislation or regulations. Forward-looking statements include all statements that are not historical facts and may be identified by the use of forward-looking terminology such as the words “believe,” “expect,” “plan,” “intend,” “anticipate,” “estimate,” “predict,” “potential,” “continue,” “may,” “will,” “should” or the negative of these terms or similar expressions. Forward-looking statements involve risks, uncertainties and assumptions. Actual results may differ materially from those expressed in these forward-looking statements. You should not put undue reliance on any forward-looking statements. In accordance with the safe harbor provisions of the Private Securities Litigation Reform Act of 1995, SunCoke has included in its filings with the Securities and Exchange Commission cautionary language identifying important factors (but not necessarily all the important factors) that could cause actual results to differ materially from those expressed in any forward-looking statement made by SunCoke. For more information concerning these factors, see SunCoke's Securities and Exchange Commission filings. All forward-looking statements included in this presentation are expressly qualified in their entirety by such cautionary statements. SunCoke does not have any intention or obligation to update publicly any forward-looking statement (or its associated cautionary language) whether as a result of new information or future events or after the date of this presentation, except as required by applicable law. This presentation includes certain non-GAAP financial measures intended to supplement, not substitute for, comparable GAAP measures. Reconciliations of non-GAAP financial measures to GAAP financial measures are provided in the Appendix at the end of the presentation. Investors are urged to consider carefully the comparable GAAP measures and the reconciliations to those measures provided in the Appendix, or on our website at www.suncoke.com. SunCoke Energy Q3 2012 Earnings Conference Call 1 |
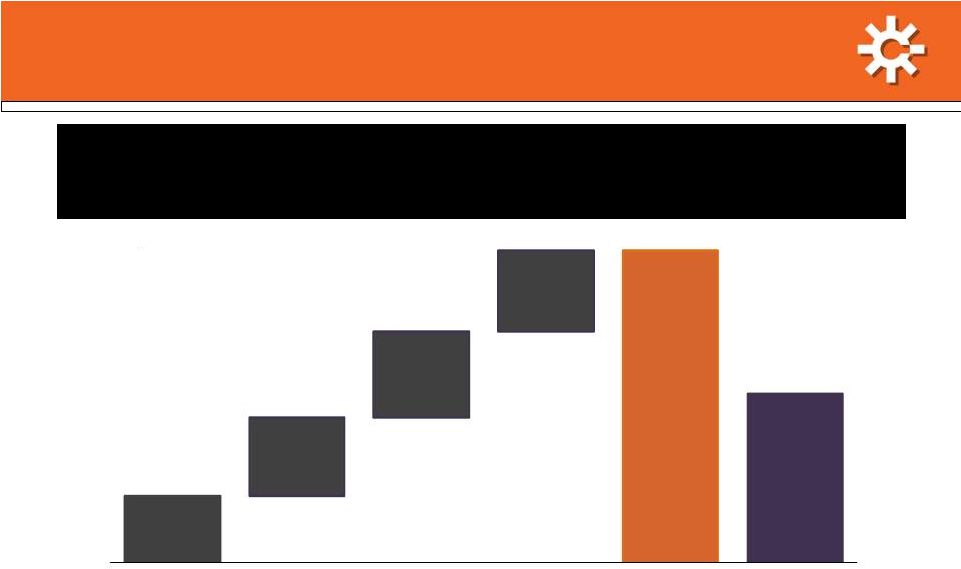
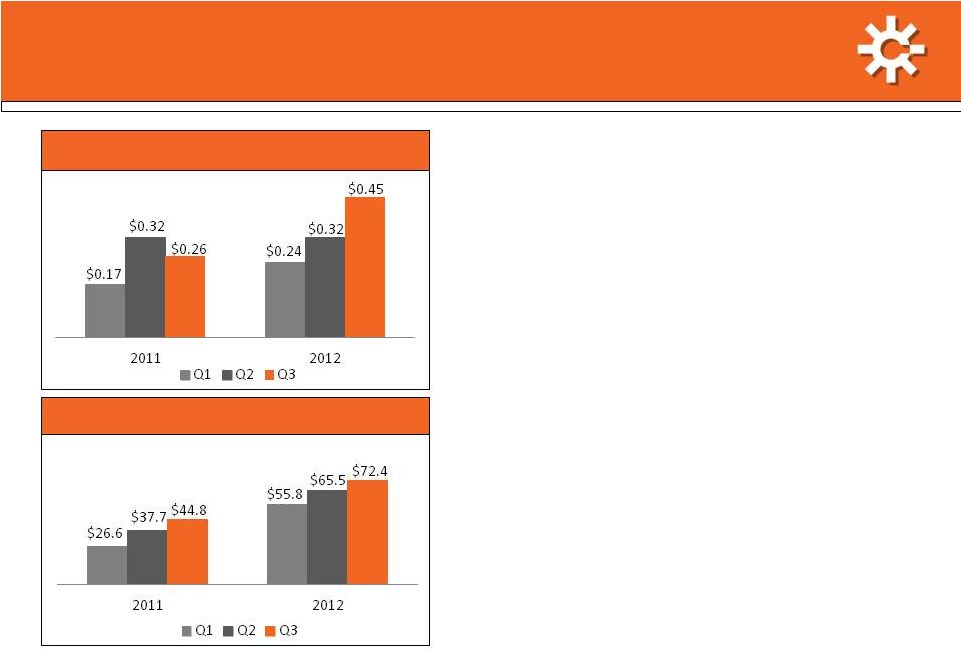 Q3 2012 Earnings Overview SunCoke Energy Q3 2012 Earnings Conference Call 2 Q3 2012 EPS up 73% to $0.45 per share • Middletown continues to perform at high level • All U.S. coke facilities built on solid prior year performance Coal delivered slightly favorable results • Benefited from higher YoY price/volume and contingent consideration adjustment • Production costs and reject rates increased Strong liquidity position • Cash balance of nearly $160 million and virtually undrawn revolver of $150 million • FY 2012 free cash flow expected to be in excess of $100 million costs, with $60+ million expected in Q4 2012 Refining range of expected 2012 Adjusted EBITDA to $255 million to $270 million • Implies expected Q4 2012 Adjusted EBITDA of $61 million to $76 million Earnings Per Share (diluted) Adjusted EBITDA (1) (in millions) (1) For a definition and reconciliation of Adjusted EBITDA, please see appendix. (2) For a definition and reconciliation of free cash flow, please see appendix (1) (2) |
 Revenue up 19% Adjusted EBITDA (3) increased 62% Earnings Per Share of $0.45 Q3 2012 Financial Results Q3 2012 Financial Results Middletown added nearly $77 million on volume of 156 thousand tons Middletown contributed almost $17 million Domestic Coke Adjusted EBITDA (3) per ton up $11 per ton to $61 Coal benefited from higher mid-vol. price/volumes and $3.2 million contingent consideration adjustment Corporate costs lower due to 2011 headquarter relocation Reflects strong U.S. cokemaking business performance and lower corporate costs SunCoke Energy Q3 2012 Earnings Conference Call 3 (1) Coke Adjusted EBITDA includes Jewell Coke, Other Domestic Coke and International segments. (2) Coal Adjusted EBITDA includes Coal Mining segment. In Q1 ’12, internal coal transfer price mechanism changed to reflect Jewell Coke contract price; prior year periods adjusted to reflect this change. (3) For a definition and reconciliation of Adjusted EBITDA and Adjusted EBITDA per ton, please see appendix. ($ in millions) Q3'12 Q3'11 Change Domestic Coke Sales Volumes 1,116 968 148 Coal Sales Volumes 392 371 21 Revenue $480.5 $403.5 $77.0 Operating Income $52.7 $30.0 $22.7 Net Income Attributable to Shareholders $31.6 $18.2 $13.4 Earnings Per Share $0.45 $0.26 $0.19 Coke Adjusted EBITDA (1) $69.4 $49.9 $19.5 Coal Adjusted EBITDA (2) $10.7 $9.2 $1.5 Corporate/Other ($7.7) ($14.3) $6.6 Adjusted EBITDA (3) $72.4 $44.8 $27.6 |
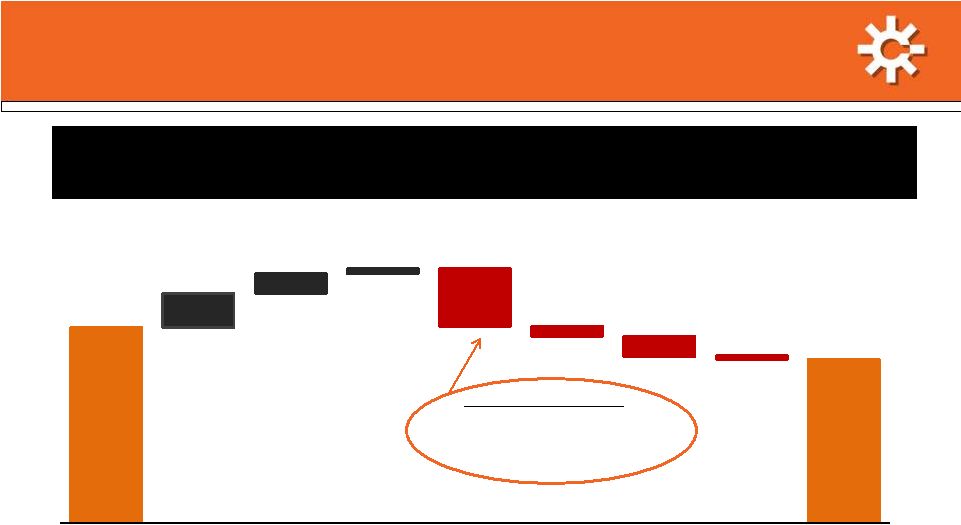
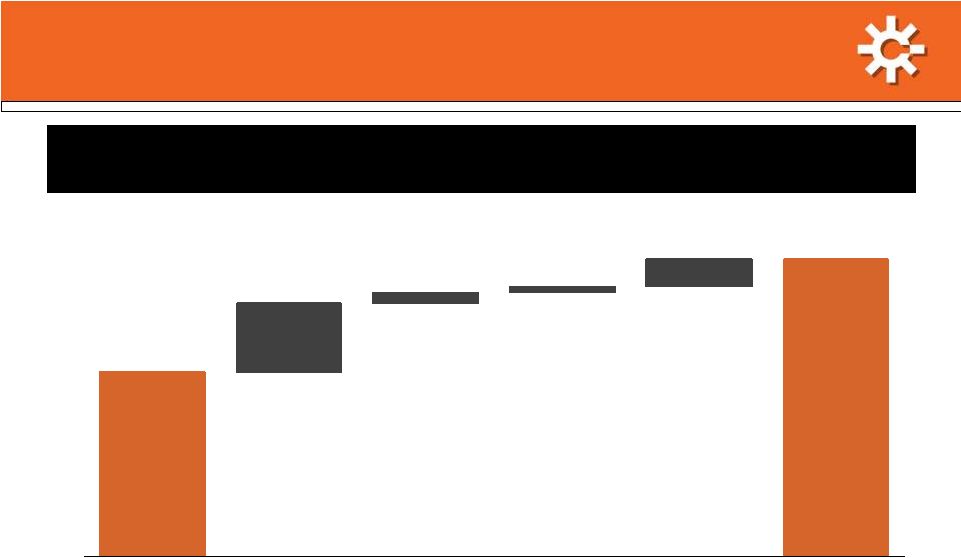 $44.8 $72.4 $16.9 $2.6 $1.5 $6.6 Q3 2011 Adjusted EBITDA (1) Middletown Coke Business (excluding Middletown) Coal Mining Corporate Q3 2012 Adjusted EBITDA (1) Adjusted EBITDA Adjusted EBITDA (1) (1) Bridge–Q3 2011 to Q3 2012 Bridge–Q3 2011 to Q3 2012 SunCoke Energy Q3 2012 Earnings Conference Call 4 Middletown was the primary driver of the quarter’s performance (1) ($ in millions) For a definition and reconciliation of Adjusted EBITDA, please see the appendix. |
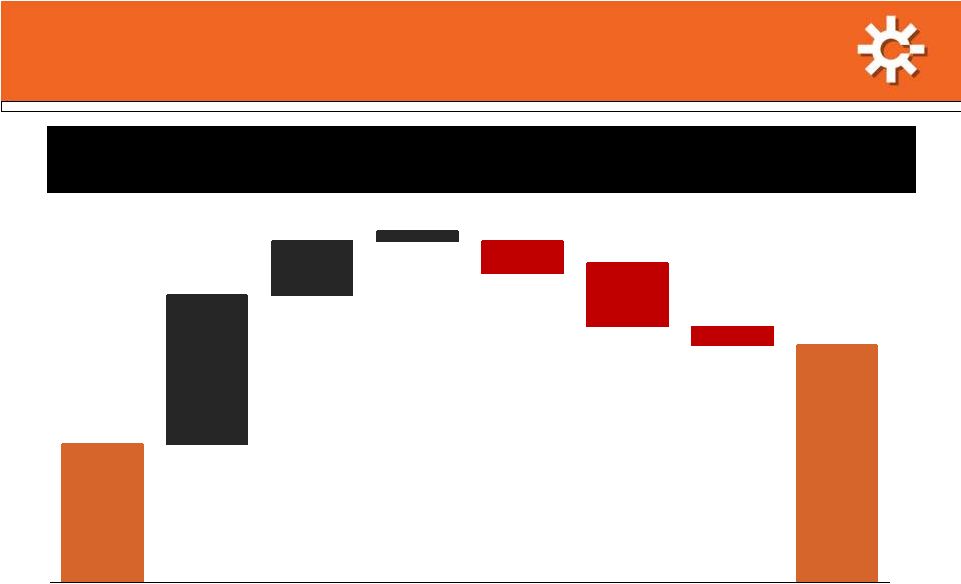 EPS Bridge – EPS Bridge – Q3 2011 to Q3 2012 Q3 2011 to Q3 2012 SunCoke Energy Q3 2012 Earnings Conference Call 5 EPS benefited from strong coke business results and lower corporate costs offset by financing costs for standalone capital structure $0.26 $0.45 $0.28 $0.10 $0.02 ($0.06) ($0.12) ($0.03 ) Q3 2011 EPS (Diluted) Adjusted EBITDA(1) Coke Business Adjusted EBITDA(1) Corporate Adjusted EBITDA(1) Coal Mining Depreciation, Depletion & Amortization Financing Costs Taxes Q3 2012 EPS (Diluted) (1) For a definition and reconciliation of Adjusted EBITDA, please see the appendix. |
 Q3 2012 Sources & Uses of Cash Q3 2012 Sources & Uses of Cash SunCoke Energy Q3 2012 Earnings Conference Call 6 Ended quarter with solid cash position, virtually undrawn revolver and improving credit metrics ($ in millions) Primary Changes vs. Q2 2012: Accounts receivables: ($37.6m)* Accounts payable: ($28.6m) Interest: ($8.3m) Inventory: +$17.3m * Due to timing of payment on $23.7 million receivable on Monday, October 1, 2012 instead of Sunday, September 30. $190.0 $32.9 $18.9 $5.3 $157.8 ($57.0) ($9.0) ($19.9) ($3.4) Q2 2012 Cash Balance Q3 2012 Net Income Depreciation, Depletion & Amortization Deferred Taxes & Taxes Payable Changes in Working Capital (excl. Taxes Payable) Other Capital Expenditures Cash Used In Financing Activities Q3 2012 Cash Balance |
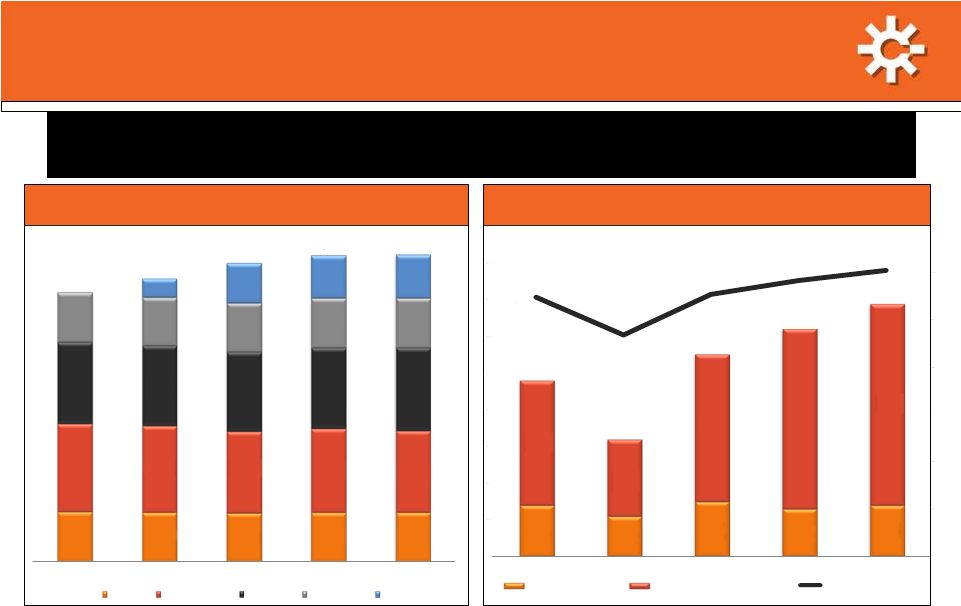 Domestic Coke Business Summary Domestic Coke Business Summary (Jewell Coke & Other Domestic Coke) (Jewell Coke & Other Domestic Coke) SunCoke Energy Q3 2012 Earnings Conference Call 7 ($ in millions, except per ton amounts) Sustained strong coke operations drove Adjusted EBITDA (1) per ton above $60 per ton 179 176 174 176 177 314 309 291 299 291 293 289 286 291 297 178 172 175 177 178 68 142 153 154 964 1,014 1,068 1,097 1,095 Q3 '11 Q4 '11 Q1 '12 Q2 '12 Q3 '12 Jewell Indiana Harbor Haverhill Granite City Middletown Domestic Coke Production (Tons in thousands) $14 $11 $15 $13 $14 $34 $21 $40 $49 $55 $48 $32 $55 $62 $69 $ 50 $ 34 $ 51 $ 57 $ 61 /ton (2) /ton /ton (3) /ton /ton Domestic Coke Adjusted EBITDA (1) Per Ton Q3 '11 Q4 '11 Q1 '12 Q2 '12 Q3 '12 Jewell Coke Segment Other Domestic Coke Segment Adjusted EBITDA/ton (1) For a definition of Adjusted EBITDA and Adjusted EBITDA/Ton and reconciliations, see appendix. (2) Includes Indiana Harbor contract billing adjustment of $6.0 million, net of NCI, and inventory adjustment of $6.2 million, net of NCI, of which $3.1 million is attributable to Q3 2011. (3) Includes a $2.4 million, net of NCI, charge related to coke inventory reduction and a $1.3 million, net of NCI, lower cost or market adjustment on pad coal inventory and lower coal-to-coke yields related to the startup at Middletown. |
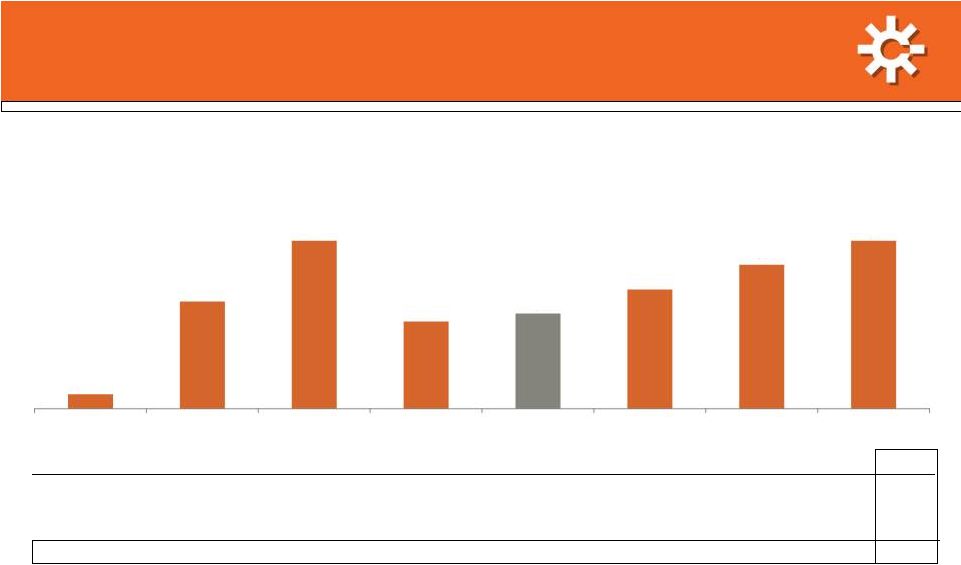 SunCoke Energy Q3 2012 Earnings Conference Call 8 Pretax Return on Invested Capital (ROIC) Pretax Return on Invested Capital (ROIC) 1) For a definition of Pretax ROIC and reconciliations, please see the appendix. Pretax ROIC is calculated as Adjusted Pretax Operating Income divided by average invested capital (stockholders’ equity plus total debt net of cash and cash equivalents); for a reconciliation of Adjusted Pretax Operating Income to Adjusted EBITDA, please see appendix 2) This table excludes Middletown assets up to and including Q4 2011. At the end of Q4 2011, identifiable assets included in Other Domestic Coke attributable to Middletown were $402.8m (prior to Q4 2011, Middletown was included in the Corporate and Other segment); see historical segment detail in public filings for additional detail. 3) Includes Indiana Harbor contract billing adjustment of $6.0 million, net of NCI, and inventory adjustment of $6.2 million, net of NCI, of which $3.1 million is attributable to Q3 2011. 4) Includes a $2.4 million, net of NCI, charge related to a coke inventory reduction and a $1.3 million, net of NCI, lower cost or market adjustment on pad coal inventory and $4.0 million of non-recurring costs and lower coal-to-coke yields related to the startup at Middletown. Pretax ROIC, ex-Middletown prior 2012 (1)(2) Q1 2011 Q2 2011 Q3 2011 Q4 2011 2011 Q1 2012 Q2 2012 Q3 2012 Total Domestic Coke (Includes Jewell Coke and Other Domestic Coke) 2% 15% 23% 12% 13% 17% 20% 24% International Coke 10% 7% 20% 120% 36% 0% 7% 11% Coal Mining 46% 28% 21% (5%) 23% 11% 17% 22% Total SunCoke (Including Corp./Other) 4% 11% 16% 8% 10% 13% 17% 20% 2% 15% 23% 12% 17% 20% 24% 13% Q1 2011 Q2 2011 Q3 2011 Q4 2011 2011 Q1 2012 Q2 2012 Q3 2012 Pretax ROIC (1) for Domestic Coke excluding Middletown prior to 2012 (2) |
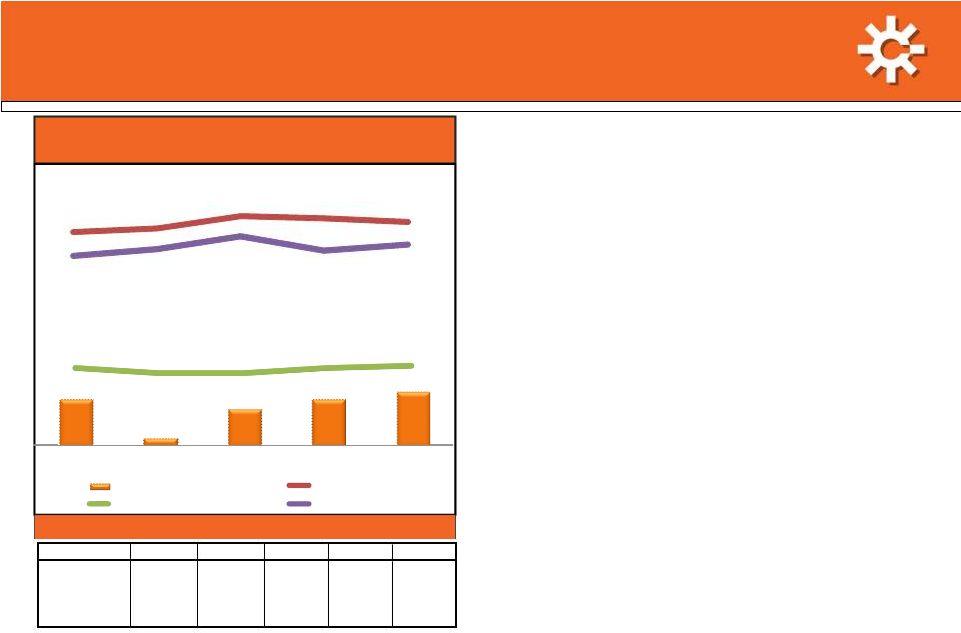 Coal Mining Financial Summary Coal Mining Financial Summary SunCoke Energy Q3 2012 Earnings Conference Call 9 Q3 2012 segment Adjusted EBITDA (1) up $1.5 million to $10.7 million Higher mid-vol. price and volumes benefited results YoY Contingent consideration fair value adjustment contributed $1.3 million to increase Cash production costs up Experienced yield and productivity challenges in quarter Increased mix of mid-vol. coal production also pulled average costs up Represented $3.2 million of segment’s Q3 2012 Adj. EBITDA – Jewell underground cash cost per ton: $149 in Q3 2012; $143 in Q2 2012; $138 in Q3 2011 • • • • • Coal Mining Adjusted EBITDA (1) and Avg. Sales Price/Ton (2) Coal Sales, Production and Purchases $9 $2 $7 $9 $11 $155 $159 $171 $169 $165 $25 $20 $20 $25 $27 $132 $138 $151 $137 $143 Q3 '11 Q4 '11(3) Q1 '12 Q2 '12 Q3 '12 Coal Adjusted EBITDA Average Sales Price Coal Adj EBITDA / ton Coal Cash Cost / ton Q3 '11 Q4 '11 Q1 '12 Q2 '12 Q3 '12 Coal Sales 371 363 373 365 392 Coal Producton 340 349 375 401 349 Purchased Coal 22 20 19 4 10 Reject Rate (%) 64 65 68 66 67 ($ in millions, except per ton amounts) (1) For a definition and a reconciliation of Adjusted EBITDA, please see the appendix. (2) Average Sales Price is the weighted average sales price for all coal sales volumes, including sales to affiliates and sales to Jewell Coke. (3) Q4 2011 Adjusted EBITDA inclusive of Black Lung Liability charge of $3.4 million and OPEB expense allocation of $1.8 million. |
 SunCoke Energy Q3 2012 Earnings Conference Call 10 Coal Mining Action Plan Coal Mining Action Plan Taking more aggressive action in Q4 2012 to reduce costs and improve productivity to position coal business for 2013 • Rationalizing underground mining plan – Idling 2 company operated mines (6 4) and 3 contract mines (8 5) Maintain idled operations on “stand-by” for when markets improve – Concentrating people and equipment in remaining mines, while leveraging lower variable costs (such as royalties, transportation, etc.) • Implementing improved underground mining practices – Relocating two operating sections in largest company mine closer to portal – Implement deep cut plans as MSHA approval received • Installing new cyclone & ultra fine circuit in prep plant; expect to complete by year end – Anticipate this will improve yields by at least 2% and achieve payback in 18 months • Targeting at least 10% reduction in overall Jewell underground cash costs in 2013 |
 Coal Mining Business Outlook Coal Mining Business Outlook SunCoke Energy Q3 2012 Earnings Conference Call 11 • 2013 mining plan based on expected flat sales volumes vs. 2012 (approximately 1.5 million tons) – Revelation venture and purchased coal expected to represent about ~30% of volumes in 2013, compared with estimated 15% in 2012 – Mix change will drive lower average cost per ton • 2013 pricing/contracting in process – Anticipate significant reduction from YTD 2012 average realized price of $168 per ton – Will update outlook once pricing finalized in Q4 2012 – Expect Coal Mining will contribute minimally to 2013 results • Despite anticipated underground cash cost reductions and mix improvement, significant margin compression likely in 2013 |
 Full Year Adjusted EBITDA Full Year Adjusted EBITDA (1) (1) Outlook Outlook SunCoke Energy Q3 2012 Earnings Conference Call 12 FY 2012 Adjusted EBITDA (1) expected to increase by more than $110 million vs. FY 2011 driven by strength of coke business ($ in millions) (1) $55.8 $255 - $270 $141 $65.5 $72.4 $61 - $76 Q1 2012 Adjusted EBITDA Q2 2012 Adjusted EBITDA Q3 2012 Adjusted EBITDA Estimated Q4 2012 Adjusted EBITDA Estimated FY 2012 Adjusted EBITDA FY 2011 Adjusted EBITDA For a definition and reconciliation of Adjusted EBITDA, please see the appendix. |
 Updated 2012 Guidance Updated 2012 Guidance Metric Expected 2012 Outlook Adjusted EBITDA (1) $255 million – $270 million EPS* (at 22% tax rate) $1.30 – $1.40 Capital Expenditures & Investments Approximately $75 million Free Cash Flow (2) $100 million + Cash Tax Rate 10% – 15% Effective Tax Rate 20% – 24% Corporate Costs $29 million – $32 million Coke Production In excess of 4.3 million tons Coal Production Approximately 1.4 million tons SunCoke Energy Q3 2012 Earnings Conference Call 13 (1) For a definition and reconciliation of Adjusted EBITDA, please see the appendix. (2) For a definition of Free Cash Flow and reconciliation, please see the appendix. *Diluted |
 Questions |
 Media releases and SEC filings are available on www.suncoke.com Investor Relations: 630-824-1907 |
 Appendix |
 Definitions • Adjusted EBITDA represents earnings before interest, taxes, depreciation, depletion and amortization (“EBITDA”) adjusted for sales discounts and the deduction of income attributable to noncontrolling interests in our Indiana Harbor cokemaking operations. EBITDA reflects sales discounts included as a reduction in sales and other operating revenue. The sales discounts represent the sharing with customers of a portion of nonconventional fuel tax credits, which reduce our income tax expense. However, we believe our Adjusted EBITDA would be inappropriately penalized if these discounts were treated as a reduction of EBITDA since they represent sharing of a tax benefit that is not included in EBITDA. Accordingly, in computing Adjusted EBITDA, we have added back these sales discounts. Our Adjusted EBITDA also reflects the deduction of income attributable to noncontrolling interests in our Indiana Harbor cokemaking operations. EBITDA and Adjusted EBITDA do not represent and should not be considered alternatives to net income or operating income under GAAP and may not be comparable to other similarly titled measures in other businesses. Adjusted EBITDA does not represent and should not be considered as an alternative to net income as determined by GAAP, and calculations thereof may not be comparable to those reported by other companies. We believe Adjusted EBITDA is an important measure of operating performance and provides useful information to investors because it highlights trends in our business that may not otherwise be apparent when relying solely on GAAP measures and because it eliminates items that have less bearing on our operating performance. Adjusted EBITDA is a measure of operating performance that is not defined by GAAP and should not be considered a substitute for net (loss) income as determined in accordance with GAAP. • Adjusted EBITDA/Ton represents Adjusted EBITDA divided by tons sold. • Free Cash Flow equals cash from operations less cash used in investing activities less cash distributions to non-controlling interests. Management believes Free Cash Flow information enhances an investor’s understanding of a business’ ability to generate cash. Free Cash Flow does not represent and should not be considered an alternative to net income or cash flows from operating activities as determined under GAAP and may not be comparable to other similarly titled measures of other businesses. • Pretax Return on Invested Capital (ROIC) is defined as Adjusted EBITDA less depreciation expense plus net income attributable to non-controlling interests divided by average invested capital (stockholders’ equity plus total debt net of cash and cash equivalents). We use Pretax ROIC as one measure of how effectively we deploy capital and make multi-year investment decisions. It is also used as a long-term performance measure under certain of our incentive compensation plans. Pretax ROIC is not a measure of financial performance under generally accepted accounting principles, and may not be comparable to other similarly titled measures used by other companies. Pretax ROIC should not be considered in isolation or as an alternative to net earnings as an indicator of performance. We define segment level Pretax ROIC as Adjusted EBITDA less depreciation expense plus net income attributable to non-controlling interests divided by average allocated invested capital. Average allocated invested capital for each respective segment is calculated pro-rata based on the segment level identifiable assets for the period as disclosed in our public filings. SunCoke Energy Q3 2012 Earnings Conference Call 17 |
 Reconciliations SunCoke Energy Q3 2012 Earnings Conference Call 18 $ in millions Q3 2012 Q2 2012 Q1 2012 FY 2011 Q4 2011 Q3 2011 Q2 2011 Q1 2011 Adjusted Operating Income 54.8 46.6 37.1 80.4 14.9 33.5 24.6 7.4 Net Income (Loss) attributable to Noncontrolling Interest 1.3 1.3 (0.3) (1.7) (0.5) 3.4 1.6 (6.2) Subtract: Depreciation Expense (18.9) (20.2) (18.4) (58.4) (16.0) (14.7) (14.7) (13.0) Adjusted EBITDA 72.4 65.5 55.8 140.5 31.4 44.8 37.7 26.6 Subtract: Depreciation, depletion and amortization (18.9) (20.2) (18.4) (58.4) (16.0) (14.7) (14.7) (13.0) Subtract: Financing expense, net (12.2) (11.8) (12.0) (1.4) (7.1) (3.3) 4.5 4.5 Subtract: Income Tax (7.6) (7.0) (5.3) (7.2) 2.9 (5.1) (1.9) (3.1) Subtract: Sales Discount (2.1) (3.8) (3.2) (12.9) (3.2) (3.5) (3.1) (3.1) Add: Net Income attributable to NCI 1.3 1.3 (0.3) (1.7) (0.5) 3.4 1.6 (6.2) Net Income 32.9 24.0 16.6 58.9 7.5 21.6 24.1 5.7 Reconciliations from Adjusted Operating Income and Adjusted EBITDA to Net Income |
 Reconciliations SunCoke Energy Q3 2012 Earnings Conference Call 19 $ in millions, except per ton data Jewell Coke Other Domestic Coke International Coke Jewell Coal Corporate Combined Domestic Coke Q3 2012 Adjusted EBITDA 13.6 54.9 0.9 10.7 (7.7) 72.4 68.5 Subtract: Depreciation, depletion and amortization (1.4) (12.7) - (4.2) (0.6) (18.9) (14.1) to noncontrolling interests 1.3 1.3 1.3 Adjusted Pre-Tax Operating Income 12.2 43.5 0.9 6.5 (8.3) 54.8 55.7 Adjusted EBITDA 13.6 54.9 0.9 10.7 (7.7) 72.4 68.5 Sales Volume (thousands of tons) 183 933 310 392 1,116 Adjusted EBITDA per Ton 74.3 58.8 2.9 27.3 61.4 Average Allocated Invested Capital (1) 51.2 889.0 32.6 117.2 NMF 1,090.1 940.3 Annualized Quarterly Pretax ROIC 95% 20% 11% 22% NMF 20% 24% Q2 2012 Adjusted EBITDA 12.5 48.6 0.7 9.3 (5.6) 65.5 61.1 Subtract: Depreciation, depletion and amortization (1.3) (13.7) (0.1) (4.3) (0.8) (20.2) (15.0) to noncontrolling interests 1.3 1.3 1.3 Adjusted Pre-Tax Operating Income 11.2 36.2 0.6 5.0 (6.4) 46.6 47.4 Adjusted EBITDA 12.5 48.6 0.7 9.3 (5.6) 65.5 61.1 Sales Volume (thousands of tons) 170 892 358 373 1,062 Adjusted EBITDA per Ton 73.5 54.5 2.0 24.9 57.5 Average Allocated Invested Capital (1) 50.9 892.7 36.6 117.7 NMF 1,097.9 943.6 Annualized Quarterly Pretax ROIC 88% 16% 7% 17% NMF 17% 20% Q1 2012 Adjusted EBITDA 15.0 40.1 0.1 7.4 (6.8) 55.8 55.1 Subtract: Depreciation, depletion and amortization (1.3) (12.6) (0.1) (4.1) (0.3) (18.4) (13.9) to noncontrolling interests (0.3) (0.3) (0.3) Adjusted Pre-Tax Operating Income 13.7 27.2 - 3.3 (7.1) 37.1 40.9 Adjusted EBITDA 15.0 40.1 0.1 7.4 (6.8) 55.8 55.1 Sales Volume (thousands of tons) 186 892 358 373 1,078 Adjusted EBITDA per Ton 80.6 45.0 0.3 19.8 51.1 Average Allocated Invested Capital (1) 53.3 928.2 41.0 119.6 NMF 1,142.1 981.5 Annualized Quarterly Pretax ROIC 103% 12% 0% 11% NMF 13% 17% Reconciliations from Adjusted EBITDA to Adjusted Pre-Tax Operating Income |
 Reconciliations SunCoke Energy Q3 2012 Earnings Conference Call 20 $ in millions, except per ton data Jewell Coke Other Domestic Coke International Coke Jewell Coal Corporate Combined Domestic Coke FY 2011 Adjusted EBITDA 46.1 89.4 13.7 35.5 (44.2) 140.5 135.5 Subtract: Depreciation, depletion and amortization (4.9) (38.7) (0.2) (12.9) (1.7) (58.4) (43.6) to noncontrolling interests (1.7) (1.7) (1.7) Adjusted Pre-Tax Operating Income 41.2 49.0 13.5 22.6 (45.9) 80.4 90.2 Adjusted EBITDA 46.1 89.4 13.7 35.5 (44.2) 140.5 135.5 Sales Volume (thousands of tons) 702 3,068 1,442 1,454 3,770 Adjusted EBITDA per Ton 65.7 29.1 9.5 24.4 35.9 Average Allocated Invested Capital 52.8 627.8 37.4 99.8 NMF 817.8 680.6 Pretax ROIC 78% 8% 36% 23% NMF 10% 13% Q4 2011 Adjusted EBITDA 10.6 21.3 10.2 2.5 (13.2) 31.4 31.9 Subtract: Depreciation, depletion and amortization (1.2) (10.6) (0.1) (3.7) (0.4) (16.0) (11.8) to noncontrolling interests (0.5) (0.5) (0.5) Adjusted Pre-Tax Operating Income 9.4 10.2 10.1 (1.2) (13.6) 14.9 19.6 Adjusted EBITDA 10.6 21.3 10.2 2.5 (13.2) 31.4 31.9 Sales Volume (thousands of tons) 166 837 295 363 1,003 Adjusted EBITDA per Ton 63.9 25.4 34.6 6.9 31.8 Average Allocated Invested Capital 46.7 594.0 33.7 105.6 NMF 779.9 640.6 Annualized Quarterly Pretax ROIC 81% 7% 120% -5% NMF 8% 12% Q3 2011 Adjusted EBITDA 13.9 34.3 1.7 9.2 (14.3) 44.8 48.2 Subtract: Depreciation, depletion and amortization (1.2) (9.9) - (3.3) (0.3) (14.7) (11.1) to noncontrolling interests 3.4 3.4 3.4 Adjusted Pre-Tax Operating Income 12.7 27.8 1.7 5.9 (14.6) 33.5 40.5 Adjusted EBITDA 13.9 34.3 1.7 9.2 (14.3) 44.8 48.2 Sales Volume (thousands of tons) 191 777 373 371 968 Adjusted EBITDA per Ton 72.8 44.1 4.6 24.8 49.8 Average Allocated Invested Capital 53.5 636.2 34.8 115.1 NMF 839.6 689.7 Annualized Quarterly Pretax ROIC 95% 17% 20% 21% NMF 16% 23% Reconciliations from Adjusted EBITDA to Adjusted Pre-Tax Operating Income |
 Reconciliations Reconciliations SunCoke Energy Q3 2012 Earnings Conference Call 21 $ in millions, except per ton data Jewell Coke Other Domestic Coke International Coke Jewell Coal Corporate Combined Domestic Coke Q2 2011 Adjusted EBITDA 10.6 25.3 0.8 11.5 (10.5) 37.7 35.9 Subtract: Depreciation, depletion and amortization (1.4) (9.6) (0.1) (3.2) (0.4) (14.7) (11.0) to noncontrolling interests 1.6 1.6 1.6 Adjusted Pre-Tax Operating Income 9.2 17.3 0.7 8.3 (10.9) 24.6 26.5 Adjusted EBITDA 10.6 25.3 0.8 11.5 (10.5) 37.7 35.9 Sales Volume (thousands of tons) 170 757 412 334 927 Adjusted EBITDA per Ton 62.4 33.4 1.9 34.4 38.7 Average Allocated Invested Capital 57.9 648.2 39.7 117.7 NMF 863.4 706.1 Annualized Quarterly Pretax ROIC 64% 11% 7% 28% NMF 11% 15% Q1 2011 Adjusted EBITDA 11.0 8.5 1.0 12.3 (6.2) 26.6 19.5 Subtract: Depreciation, depletion and amortization (1.1) (8.6) - (2.7) (0.6) (13.0) (9.7) to noncontrolling interests (6.2) (6.2) (6.2) Adjusted Pre-Tax Operating Income 9.9 (6.3) 1.0 9.6 (6.8) 7.4 3.6 Adjusted EBITDA 11.0 8.5 1.0 12.3 (6.2) 26.6 19.5 Sales Volume (thousands of tons) 175 697 362 386 872 Adjusted EBITDA per Ton 62.9 12.2 2.8 31.9 22.4 Average Allocated Invested Capital 56.0 645.6 41.4 83.8 NMF 826.9 701.7 Annualized Quarterly Pretax ROIC 71% -4% 10% 46% NMF 4% 2% Reconciliations from Adjusted EBITDA to Adjusted Pre-Tax Operating Income |
 SunCoke Energy Q3 2012 Earnings Conference Call 22 Pretax Return on Invested Capital Reconciliation (1) (2) Q1 2012 Average Invested Capital includes Middletown in both the beginning and ending of quarter average (Q1 2012 and Q4 2011) See Adjusted EBITDA and Pretax ROIC Reconciliation for respective periods, 2010 uses Adjusted Pro Forma Operating Income Consolidated Sun Coke Energy Q3 2012 Q2 2012 Q1 2012 2011 Q4 2011 Q3 2011 Q2 2011 Q1 2011 2010 Adjusted Pre-Tax Operating Income (1) 54.8 46.6 37.1 80.4 14.9 33.5 24.6 7.4 151.5 Invested Capital ($ in millions) Q3 2012 Q2 2012 Q1 2012 (2) 2011 Q4 2011 Q3 2011 Q2 2011 Q1 2011 2010 Debt $724.1 $724.9 $725.7 $726.4 $726.4 $697.8 $794.7 $715.7 $655.3 Equity 543.6 535.4 513.3 559.9 559.9 604.5 457.3 433.4 429.3 Cash (157.8) (190.0) (113.6) (127.5) (127.5) (110.9) (30.5) (11.0) (40.1) Middletown (402.8) (402.8) (387.6) (346.1) (286.7) (242.2) Invested Capital $1,109.9 $1,070.3 $1,125.4 $756.0 $756.0 $803.8 $875.4 $851.5 $802.4 Average Invested Capital* $1,090.1 $1,097.9 $1,142.1 $817.8 $779.9 $839.6 $863.4 $826.9 $844.0 Q3 2012 Q2 2012 Q1 2012 2011 Q4 2011 Q3 2011 Q2 2011 Q1 2011 2010 Quarterly ROIC 20% 17% 13% 8% 16% 11% 4% Last Twelve Months' ROIC 10% 18% *5 quarter average for 2011, two quarter average for each quarter, year-end average for 2010 |
 SunCoke Energy Q3 2012 Earnings Conference Call 23 Pretax Return on Invested Capital Reconciliation Period ended Jewell Coke Other Domestic Coke International Coke Coal Mining Corporate and Other Total Identifiable Assets for Allocating Invested Capital Q3 2012 86.0 1,447.7 52.8 190.1 183.8 1,960.4 Q2 2012 81.4 1,458.4 53.9 193.0 183.5 1,970.2 Q1 2012 83.9 1,440.2 64.6 189.1 141.1 1,918.9 Q4 2011, inc Middletown 81.6 1,440.8 62.7 182.1 174.6 1,941.8 Q4 2011 81.6 1,038.0 62.7 182.1 174.6 1,539.0 Q3 2011 77.7 990.6 52.7 178.3 192.3 1,879.2 Q2 2011 85.1 954.4 53.6 173.5 67.2 1,972.6 Q1 2011 82.6 922.6 61.2 167.3 48.9 1,860.1 2010 80.9 962.6 59.7 76.7 7.3 1,718.5 Percentage of Invested Capital Q3 2012 4.8% 81.5% 3.0% 10.7% NMF 100.0% Q2 2012 4.6% 81.6% 3.0% 10.8% NMF 100.0% Q1 2012 4.7% 81.0% 3.6% 10.6% NMF 100.0% Q4 2011, inc Middletown 4.6% 81.5% 3.5% 10.3% NMF 100.0% Q4 2011 6.0% 76.1% 4.6% 13.3% NMF 100.0% Q3 2011 6.0% 76.2% 4.1% 13.7% NMF 100.0% Q2 2011 6.7% 75.4% 4.2% 13.7% NMF 100.0% Q1 2011 6.7% 74.8% 5.0% 13.6% NMF 100.0% 2010 6.9% 81.6% 5.1% 6.5% NMF 100.0% Allocated Invested Capital Q3 2012 53.7 904.4 33.0 118.8 - 1,109.9 Q2 2012 48.8 873.6 32.3 115.6 - 1,070.3 Q1 2012 53.1 911.7 40.9 119.7 - 1,125.4 Q4 2011, inc Middletown 53.5 944.8 41.1 119.4 - 1,158.8 Q4 2011 45.2 575.1 34.7 100.9 - 756.0 Q3 2011 48.1 612.9 32.6 110.3 - 803.8 Q2 2011 58.8 659.6 37.0 119.9 - 875.4 Q1 2011 57.0 636.7 42.3 115.5 - 851.5 2010 55.0 654.6 40.6 52.1 - 802.4 Note: This table excludes Middletown assets up to and including Q4 2011. At the end of Q4 2011, identifiable assets included in Other Domestic Coke attributable to Middletown were $402.8m (prior to Q4 2011, Middletown was included in the Corporate and Other segment); see historical segment detail in public filings for additional detail. |
  (in millions) 2012E Low 2012E High Net Income $94 $104 Depreciation, Depletion and Amortization 80 78 Total financing costs, net 48 47 Income tax expense 25 34 EBITDA $247 $263 Sales discounts 11 12 Noncontrolling interests (3) (5) Adjusted EBITDA $255 $270 Estimated 2012 EBITDA Reconciliation 2012E Net Income to Adjusted EBITDA Reconciliation SunCoke Energy Q3 2012 Earnings Conference Call 24 |
 Free Cash Flow Reconciliation Free Cash Flow Reconciliation SunCoke Energy Q3 2012 Earnings Conference Call 25 (in millions) Estimated 2012 For nine months ended 9/30/2012 (Actual) Cash from operations In excess of $ 179 $ 78 Less cash used for investing activities Approx. (75) (41) Less payments to minority interest Approx. (4) (0) Free Cash Flow In excess of $ 100 $ 36 2012E Estimated Free Cash Flow Reconciliation |