 Q4 2012 Earnings Conference Call February 5, 2013 Exhibit 99.2 |
 Forward-Looking Statements SXC and SXCP Q4 2012 Earnings Conference Call 1 FORWARD-LOOKING STATEMENTS This slide presentation should be reviewed in conjunction with the Fourth Quarter 2012 earnings releases of SunCoke Energy, Inc. (SunCoke) and SunCoke Energy Partners, L.P. (Partnership) and the conference call held on February 5 at 10:00 a.m. ET. Some of the information included in this presentation constitutes “forward-looking statements” as defined in Section 27A of the Securities Act of 1933, as amended and Section 21E of the Securities Exchange Act of 1934, as amended. All statements in this presentation that express opinions, expectations, beliefs, plans, objectives, assumptions or projections with respect to anticipated future performance of SunCoke or the Partnership, in contrast with statements of historical facts, are forward-looking statements. Such forward-looking statements are based on management’s beliefs and assumptions and on information currently available. Forward-looking statements include information concerning possible or assumed future results of operations, business strategies, financing plans, competitive position, potential growth opportunities, potential operating performance improvements, the effects of competition and the effects of future legislation or regulations. Forward-looking statements include all statements that are not historical facts and may be identified by the use of forward-looking terminology such as the words “believe,” “expect,” “plan,” “intend,” “anticipate,” “estimate,” “predict,” “potential,” “continue,” “may,” “will,” “should” or the negative of these terms or similar expressions. Although management believes that its plans, intentions and expectations reflected in or suggested by the forward-looking statements made in this presentation are reasonable, no assurance can be given that these plans, intentions or expectations will be achieved when anticipated or at all. Moreover, such statements are subject to a number of assumptions, risks and uncertainties. Many of these risks are beyond the control of SunCoke and the Partnership, and may cause actual results to differ materially from those implied or expressed by the forward-looking statements. Each of SunCoke and the Partnership has included in its filings with the Securities and Exchange Commission (including, in the case of the Partnership, its Form S-1) cautionary language identifying important factors (but not necessarily all the important factors) that could cause actual results to differ materially from those expressed in any forward-looking statement. For more information concerning these factors, see the Securities and Exchange Commission filings of SunCoke and the Partnership. All forward-looking statements included in this presentation are expressly qualified in their entirety by such cautionary statements. Although forward-looking statements are based on current beliefs and expectations, caution should be taken not to place undue reliance on any such forward-looking statements because such statements speak only as of the date hereof. SunCoke and the Partnership do not have any intention or obligation to update publicly any forward-looking statement (or its associated cautionary language) whether as a result of new information or future events or after the date of this presentation, except as required by applicable law. This presentation includes certain non-GAAP financial measures intended to supplement, not substitute for, comparable GAAP measures. Reconciliations of non-GAAP financial measures to GAAP financial measures are provided in the Appendix at the end of the presentation. Investors are urged to consider carefully the comparable GAAP measures and the reconciliations to those measures provided in the Appendix. |
 SUNCOKE ENERGY, INC. RESULTS 2 SXC and SXCP Q4 2012 Earnings Conference Call |
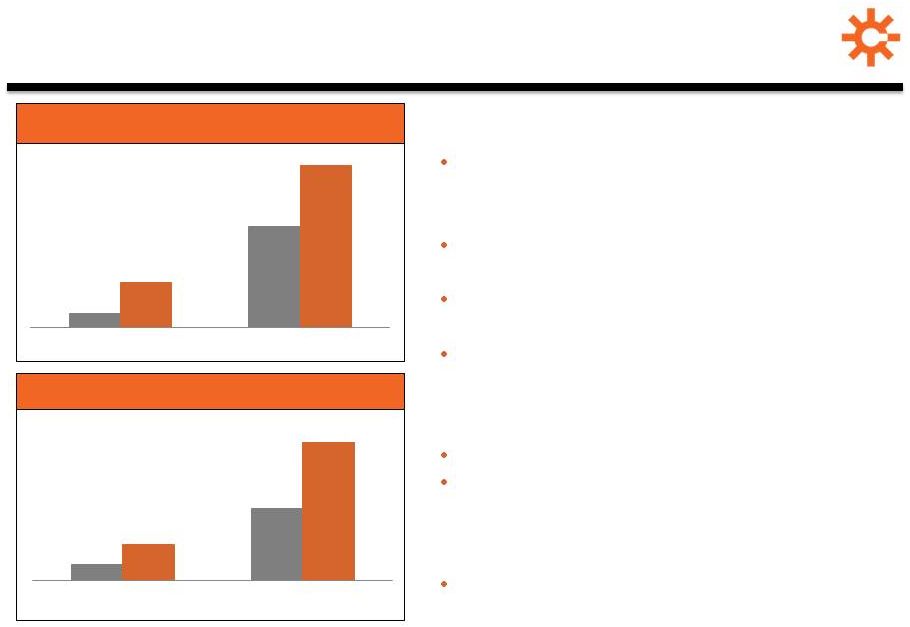 3 Q4 & FY 2012 Earnings Overview Near-flawless Middletown startup and better results at Indiana Harbor drove performance for both periods Sustained solid performance across cokemaking fleet Achieved domestic coke Adjusted EBITDA (1) per ton of $58 for Q4 ’12 and $57 for FY ‘12 Delivered slightly improved Q4 ‘12 coal results; FY ‘12 reflects continued challenges Generated $120 million of free cash flow (2) YE 2012 cash balance of nearly $240 million and virtually undrawn revolver Adjusted EBITDA (1) , EPS, free cash flow (2) , and coke and coal production met or exceeded 2012 guidance (1) For a definition and reconciliation of Adjusted EBITDA, please see appendix. (2) For a definition and reconciliation of free cash flow, please see appendix SXC and SXCP Q4 2012 Earnings Conference Call $0.12 $0.87 $0.39 $1.40 Q4 2011 Q4 2012 FY 2011 FY 2012 Earnings Per Share (diluted) $30.9 $138.8 $69.7 $265.7 Q4 2011 Q4 2012 FY 2011 FY 2012 Adjusted EBITDA (1) (in millions) Q4 and FY 2012 EPS up significantly Strengthened liquidity position Delivered on our 2012 guidance |
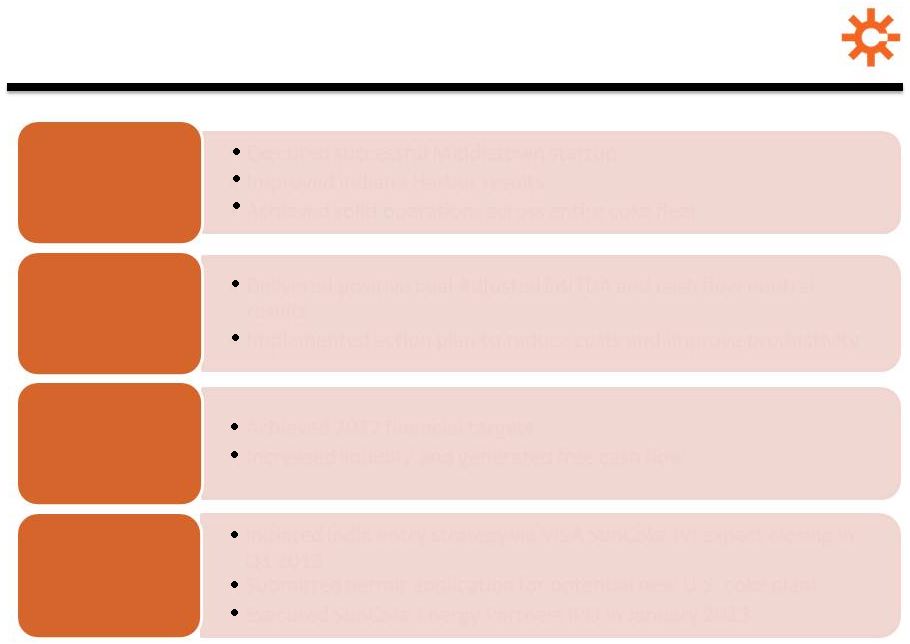 2012 Accomplishments 4 SXC and SXCP Q4 2012 Earnings Conference Call Proved our Proved our cokemaking cokemaking expertise expertise Took action to Took action to optimize coal optimize coal business business Built financial Built financial strength and strength and flexibility flexibility Positioned Positioned for for future growth future growth Executed successful Middletown startup Improved Indiana Harbor results Achieved solid operations across entire coke fleet Delivered positive coal Adjusted EBITDA and cash flow neutral results Implemented action plan to reduce costs and improve productivity Achieved 2012 financial targets Increased liquidity and generated free cash flow Initiated India entry strategy via VISA SunCoke JV; expect closing in Q1 2013 Submitted permit application for potential new U.S. coke plant Executed SunCoke Energy Partners IPO in January 2013 |
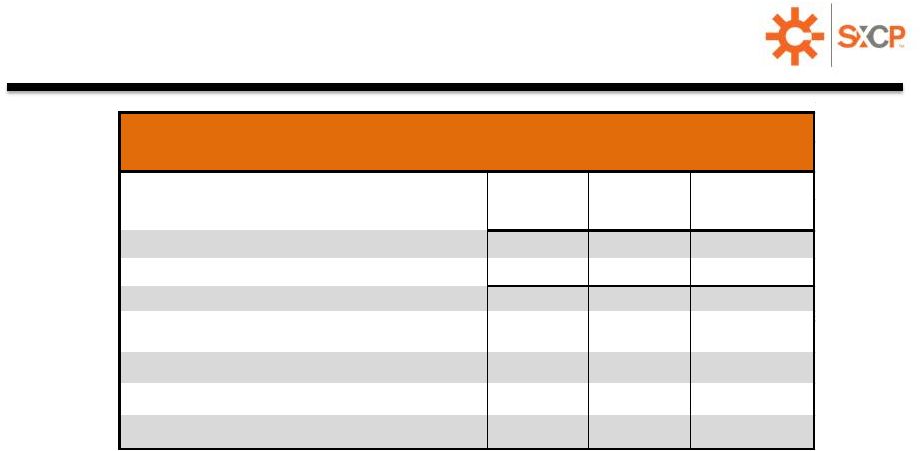
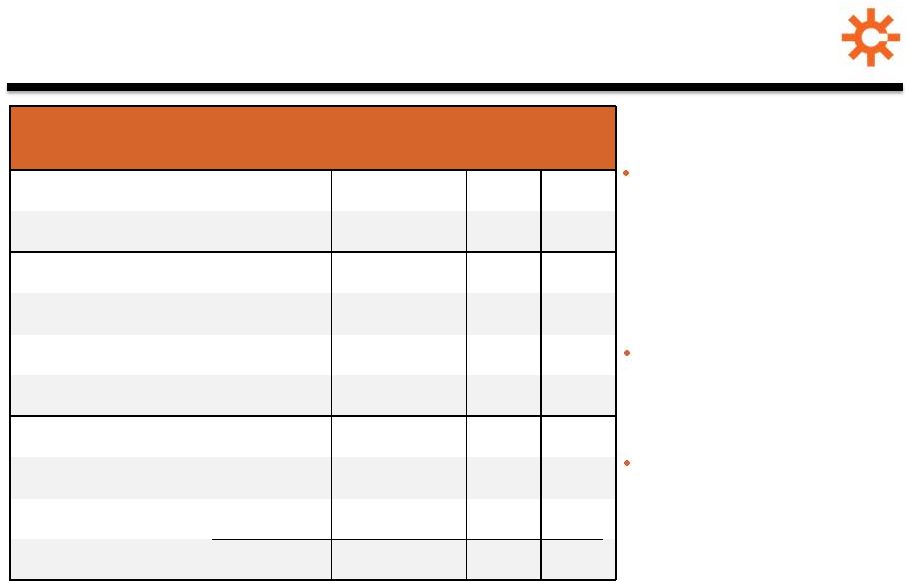 Q4 & FY 2012 Financial Results 5 (1) Coke Adjusted EBITDA includes Jewell Coke, Other Domestic Coke and International segments. (2) Coal Adjusted EBITDA includes Coal Mining segment. In Q1 ’12, internal coal transfer price mechanism changed to reflect Jewell Coke contract price; prior year periods adjusted to reflect this change. (3) For a definition and reconciliation of Adjusted EBITDA and Adjusted EBITDA per ton, please see appendix. SXC and SXCP Q4 2012 Earnings Conference Call Revenue up 16% and 25% for Q4‘12 and FY‘12, respectively Middletown added $43.1 million and $260.3 million to Qtr and FY, respectively Adjusted EBITDA (1) up 126% and 91% for Q4‘12 and FY‘12, respectively Middletown contributed $17.9 million and $60.2 million to the increase, respectively Favorable prior year comparison at Indiana Harbor helped results in both periods Delivered EPS of $0.39 for Q4‘12 and $1.40 for FY‘12 ($ in millions) Q4'12 Q4'11 FY 2012 FY 2011 Q4 2012 vs. Q4 2011 FY 2012 vs. FY 2011 Domestic Coke Sales Volumes 1,077 1,003 4,345 3,770 75 575 Coal Sales Volumes 371 363 1,500 1,454 8 46 Revenue $491.4 $424.1 $1,914.1 $1,538.9 $67.3 $375.2 Operating Income $44.3 $11.7 $173.7 $67.5 $32.6 $106.2 Net Income Attributable to Shareholders $27.6 $8.0 $98.8 $60.6 $19.6 $38.2 Earnings Per Share $0.39 $0.12 $1.40 $0.87 $0.27 $0.53 Coke Adjusted EBITDA (1) $72.7 $41.6 $261.3 $147.6 $31.0 $113.8 Coal Adjusted EBITDA (2) $6.0 $2.5 $33.4 $35.5 $3.5 ($2.1) Corporate/Other ($8.9) ($13.2) ($29.0) ($44.2) $4.2 $15.2 Adjusted EBITDA (3) $69.7 $30.9 $265.7 $138.8 $38.8 $126.9 |
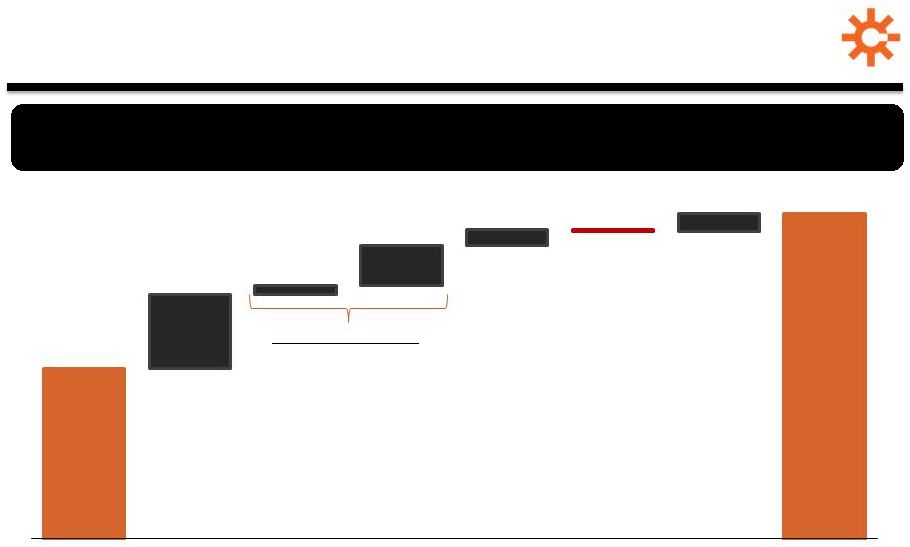
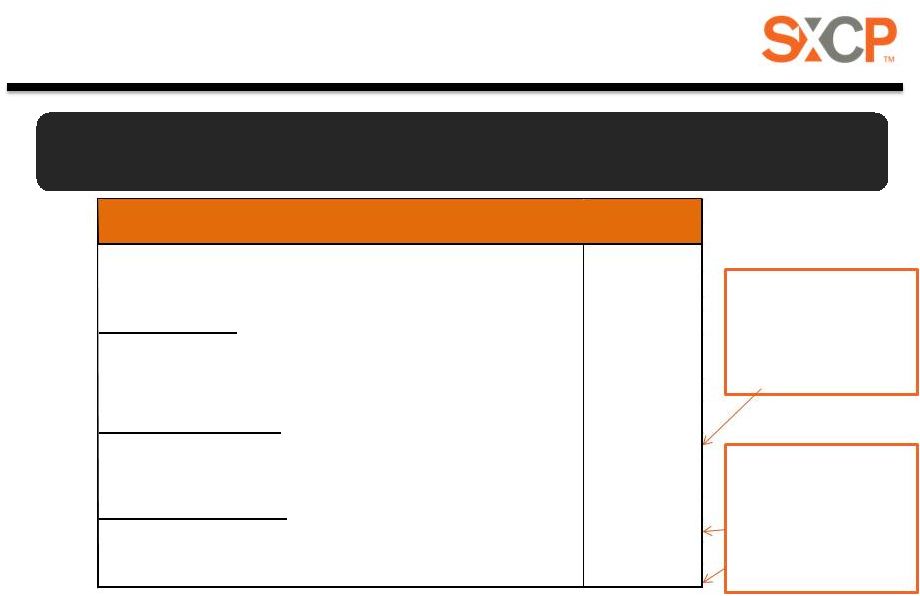
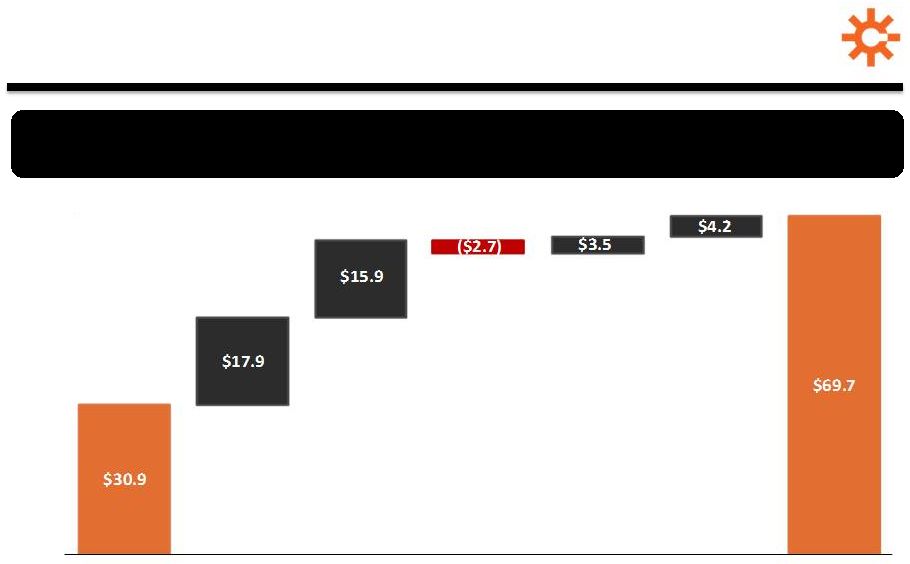 Adjusted EBITDA (1) Bridge – Q4 ‘11 to Q4 ‘12 6 Fourth quarter’s performance benefited from Middletown and better Indiana Harbor results ($ in millions) SXC and SXCP Q4 2012 Earnings Conference Call • Favorable net impact from finalization of 2011 billing review and prior year adjustments • Neutral operating performance • Higher costs related to planned HRSG outages at Granite City and Haverhill • Lower Black Lung charge ($2.6 million) • Lower Black Lung charge and Middletown startup costs • Lower relocation and consulting plus higher segment allocations Q4 2011 Adjusted EBITDA (1) Middletown Indiana Harbor (2) Coke Business (excludes Middletown and Indiana Harbor) Coal Mining Corporate Q4 2012 Adjusted EBITDA (1) (1) For a definition and reconciliation of Adjusted EBITDA, please see the appendix. (2) Includes a contract billing adjustment of $7.0 million and an inventory adjustment of $7.3 million in Q4 2011 and a $4.2 million favorable adjustment due to finalization of 2011 billing review in Q4 2012. |
 SXC and SXCP Q4 2012 Earnings Conference Call 7 Adjusted EBITDA (1) Bridge – FY ‘11 to FY ‘12 Middletown, Indiana Harbor, solid cokemaking operations and lower corporate costs drove the year’s performance ($ in millions) • Primarily driven by strong results at Granite City • Lower relocation, no Middletown G&A costs and lower allocations $138.8 $265.7 $60.2 $7.4 $32.7 $13.5 $15.2 ($2.1) FY 2011 Adjusted EBITDA (1) Middletown Indiana Harbor (excl. non- recurring items)(2) Indiana Harbor (non-recurring items) (2) Coke Business (excl. Middletown & Indiana Harbor) Coal Business Corporate Costs FY 2012 Adjusted EBITDA (1) Improvement of $40.1 million • Favorable comparisons due to 2011 operating challenges and billing and inventory adjustments • Improved yields and operating expense recovery in 2012 • Higher cash production costs on coal production mix (1) For a definition and reconciliation of Adjusted EBITDA, please see the appendix. (2) Non-recurring items at Indiana Harbor include: $18.5 million of coke cover costs in Q1 2011; a contract billing adjustment of $7.0 million and an inventory adjustment of $7.3 million in Q4 2011; $2.8 million coke inventory reduction and $1.5 million lower cost or market pad coal adjustment in Q1 2012; and a $4.2 million favorable adjustment due to finalization of 2011 billing review in Q4 2012. |
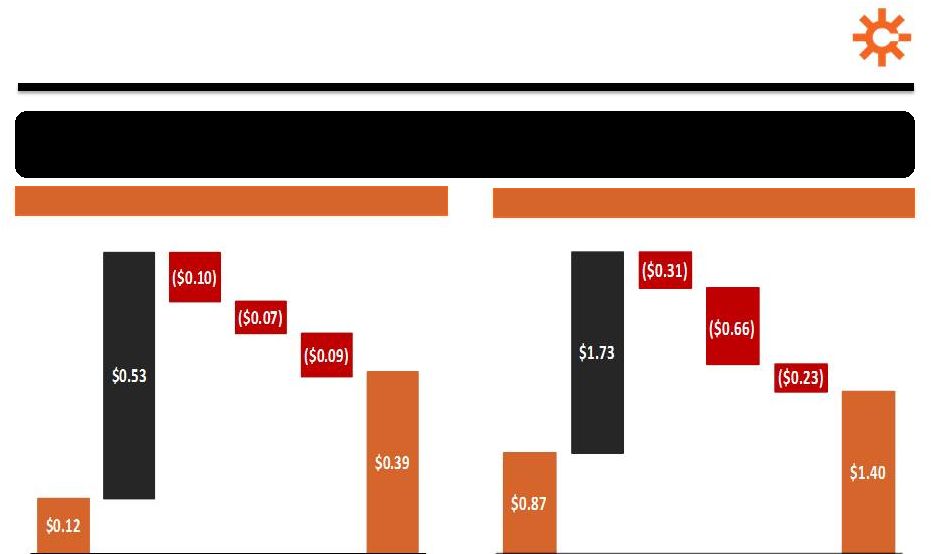 Diluted EPS Bridge 8 EPS benefited from strong coke business results and lower corporate costs offset by standalone capital structure Q4 2011 to Q4 2012 FY 2011 to FY 2012 (1) For a definition and reconciliation of Adjusted EBITDA, please see the appendix. SXC and SXCP Q4 2012 Earnings Conference Call Q4 2011 EPS (Diluted) Adjusted EBITDA(1)and noncontroling interest income Depreciation, Depletion & Amortization Financing Costs Taxes Q4 2012 EPS (Diluted) 2011 EPS (Diluted) Adjusted EBITDA(1) and noncontrolling interest income Depreciation, Depletion & Amortization Financing Costs Taxes 2012 EPS (Diluted) |
 Domestic Coke Business Summary (Jewell Coke & Other Domestic Coke) 9 Domestic Coke Production Domestic Coke Adjusted EBITDA (1) Per Ton (Tons in thousands) ($ in millions, except per ton amounts) Achieved Adjusted EBITDA per ton of $58 in Q4 ‘12 and $57 for FY ‘12, solidly within our targeted $55 to $60 per ton range SXC and SXCP Q4 2012 Earnings Conference Call (1) For a definition of Adjusted EBITDA and Adjusted EBITDA/Ton and reconciliations, see appendix. (2) Includes Indiana Harbor billing adjustment of $7.0 million and inventory adjustment of $7.3 million. (3) Includes a $2.8 million charge related to coke inventory reduction and a $1.5 million lower cost or market adjustment on pad coal inventory at Indiana Harbor and $4.0 million of non-recurring startup costs at Middletown. (4) Includes $4.2 million favorable adjustment at Indiana Harbor due to finalization of 2011 billing review. Q4 '11 Q1 '12 Q2 '12 Q3 '12 Q4 '12 Jewell Indiana Harbor Haverhill Granite City Middletown Q4 '11 Q1 '12 Q2 '12 Q3 '12 Q4 '12 Jewell Coke Segment Other Domestic Coke Segment Adjusted EBITDA/ton |
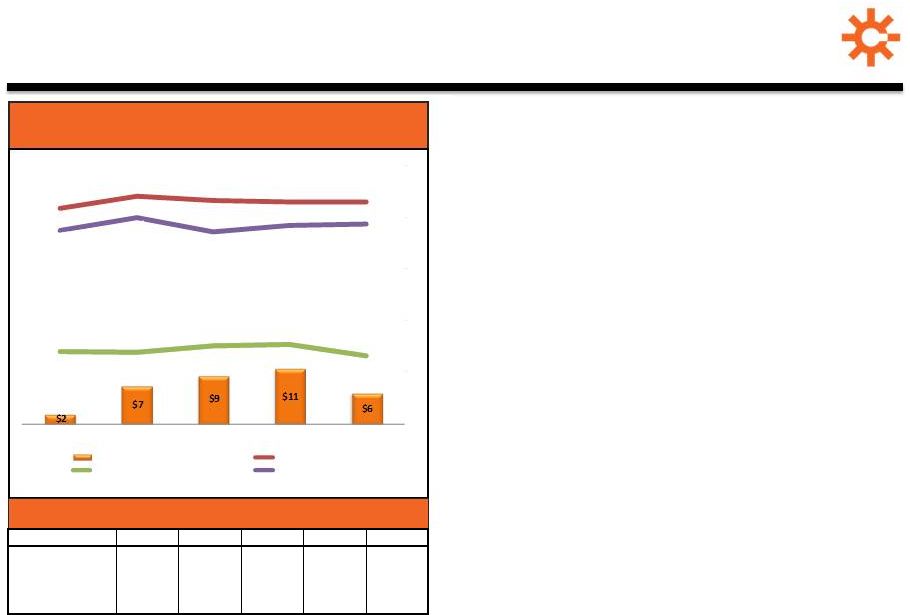 Coal Mining Financial Summary Q4 2012 Adjusted EBITDA up $3.5 million vs. Q4 2011 • Benefited from higher average prices • Lower Black Lung liability Q4 2012 vs. Q4 2011 Cash production cost per ton • Decrease in mix of lower cost hi-vol coal production resulted in increased cash production costs vs.. 4Q 2011 • Jewell underground costs flat to Q3 2012 and down from Q4 2011 on higher volumes – $149 (4) in Q4 2012; $149 in Q3 2012; $151 (3) in Q4 2011 • Coal action plan targeting decrease at both Jewell underground (~$5/ton) and overall operations (~$15/ton) in 2013 vs. Q4 2012 Approximately cash flow neutral with FY 2012 Adjusted EBITDA of $33.4 million and cap ex of $34.3 million 10 Coal Mining Adjusted EBITDA (1) and Avg. Sales Price/Ton (2) ($ in millions, except per ton amounts) Coal Sales, Production and Purchases SXC and SXCP Q4 2012 Earnings Conference Call $159 $171 $167 $165 $166 $20 $20 $25 $27 $16 $138 $151 $137 $143 $144 -$50 $0 $50 $100 $150 $200 Q4 '11 Q1 '12 Q2 '12 Q3 '12 Q4 '12 Coal Adjusted EBITDA Average Sales Price Coal Adj EBITDA / ton Coal Cash Cost / ton (3) (4) (1) For a definition and a reconciliation of Adjusted EBITDA, please see the appendix. (2) Average Sales Price is weighted avg. price for all sales, including to affiliates and to Jewell Coke. (3) Excludes Black Lung liability charge of $3.4 million and OPEB expense allocation of $1.8 million. (4) Excludes Black Lung liability charge of $0.8 million and accrued potential fines and penalties of $1.5 million. Q4 '11 Q1 '12 Q2 '12 Q3 '12 Q4 '12 Coal Sales 363 373 365 392 371 Coal Producton 349 375 401 349 351 Purchased Coal 20 19 4 10 9 Reject Rate (%) 65 68 66 67 66 |
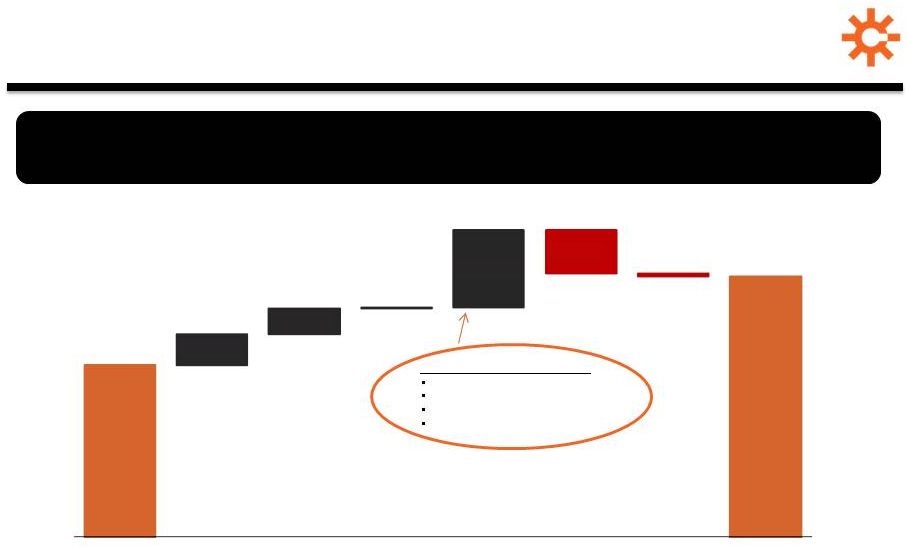 Liquidity Position 11 Ended 2012 with strong cash balance and virtually undrawn revolver, providing foundation for future growth ($ in millions) Accts Receivable: $21.1m* Inventories: $29.1m Accts Payable: $11.9m Accrued liabilities: $3.5m * Reflects timing of payment of a $23.7 million receivable due Sunday, September 30, 2012 but paid on Monday, October 1, 2012 SXC and SXCP Q4 2012 Earnings Conference Call $157.8 $29.0 $23.3 $1.3 $71.2 $239.2 ($40.0) ($3.4) Q3 2012 Cash Balance Q4 2012 Net Income Depreciation, Depletion & Amortization Deferred Taxes & Taxes Payable Changes in Working Capital (excl. Taxes Payable) Capital Expenditures Cash Used In Financing Activities Q4 2012 Cash Balance Primary Changes vs.. Q3 2012 |
 SUNCOKE ENERGY PARTNERS, LP RESULTS 12 SXC and SXCP Q4 2012 Earnings Conference Call |
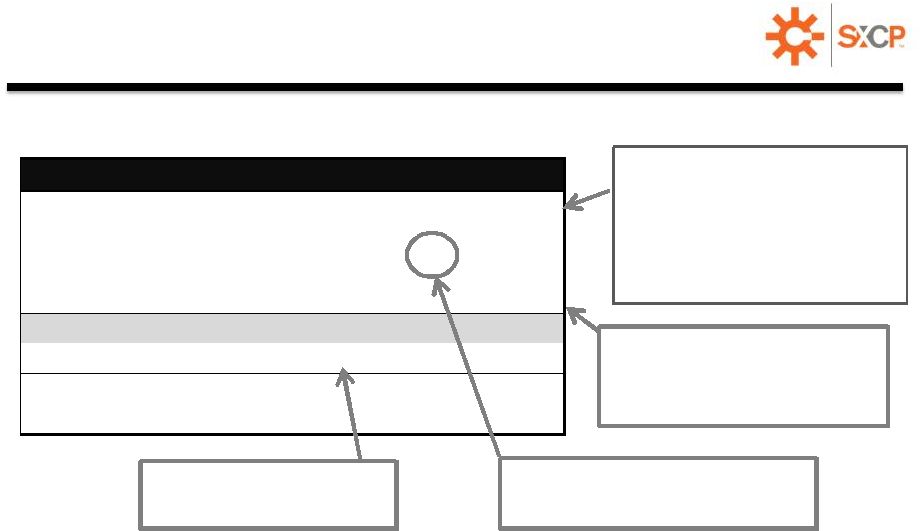
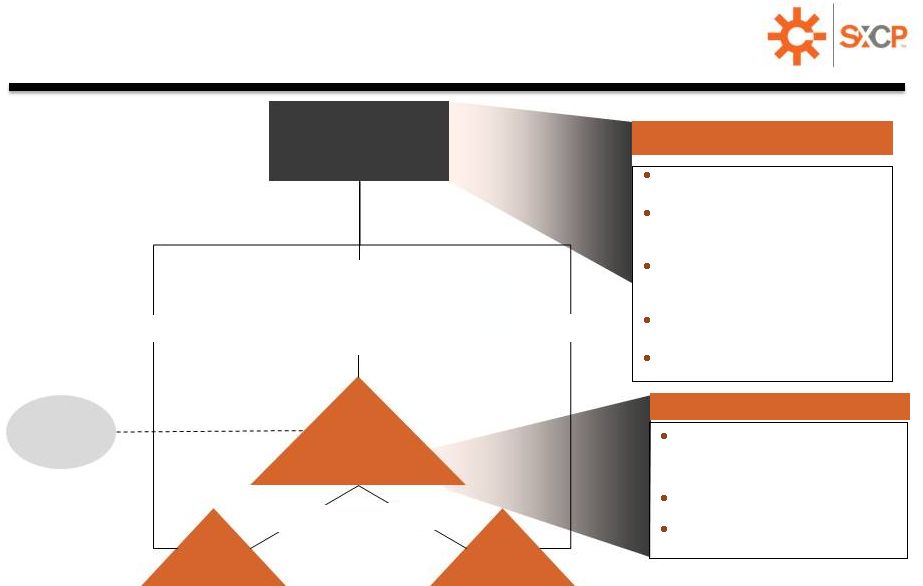 Post-IPO Organizational Structure SXC and SXCP Q4 2012 Earnings Conference Call 13 SunCoke Energy, Inc. (NYSE: SXC) Public Unitholders Common Units Haverhill Middletown 35.0% 42.1% partnership interest (1) 65.0% 65.0% 35.0% What Remains at the Parent? What is in SXCP? SunCoke Energy Partners, L.P. (NYSE: SXCP) 2.0% general partner interest / incentive distribution rights + 55.9% partnership interest (1) (1) Excludes underwriters’ over-allotment as option will not be exercised. (2) Based on SXC and SXCP’s ownership interest in Haverhill and Middletown, respectively. (3) 2013E Adjusted EBITDA equals SXCP’s 65% interest in Haverhill and Middletown’s Adjusted EBITDA (i.e., 65% of 2013E net income attributable to the controlling and noncontrolling interests plus depreciation expense, interest expense, incremental public partnership expenses, and incremental corporate expenses allocated to the MLP) less incremental corporate expenses allocated to the MLP. 3 U.S. coking facilities with ~2.6 million tons of annual capacity 35% interest in Haverhill and Middletown with ~0.6 million tons (2) of annual capacity Operation of 1 Brazil coking facility with ~1.7 million tons of annual capacity and international holdings ~114 million tons of high-quality metallurgical coal reserves General partner with 2% GP interest and owner of a 56% interest in the SXCP 65% interest in Haverhill and Middletown with ~1.1 million tons (2) of annual capacity $88.3 million in 2013E EBITDA (3) $61.4 million in 2013E Distributable Cash Flow |
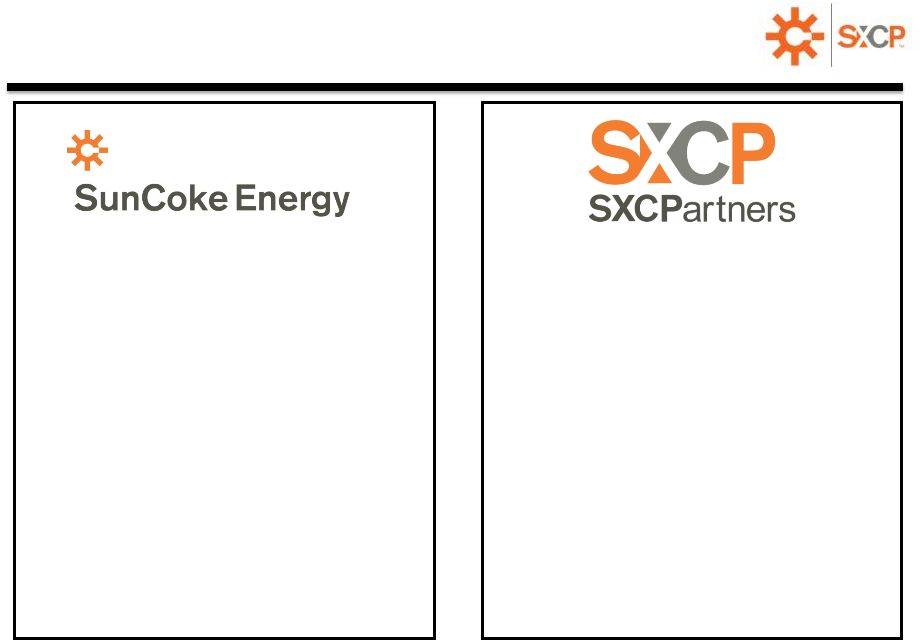 Strategic Roles of SXC and SXCP 14 • Grow U.S. & Canada cokemaking business • Steel facing MLP with advantaged cost of capital SXC and SXCP Q4 2012 Earnings Conference Call • Develop new coke projects • Grow international business • Optimize coal • GP & limited partner investor in SXCP |
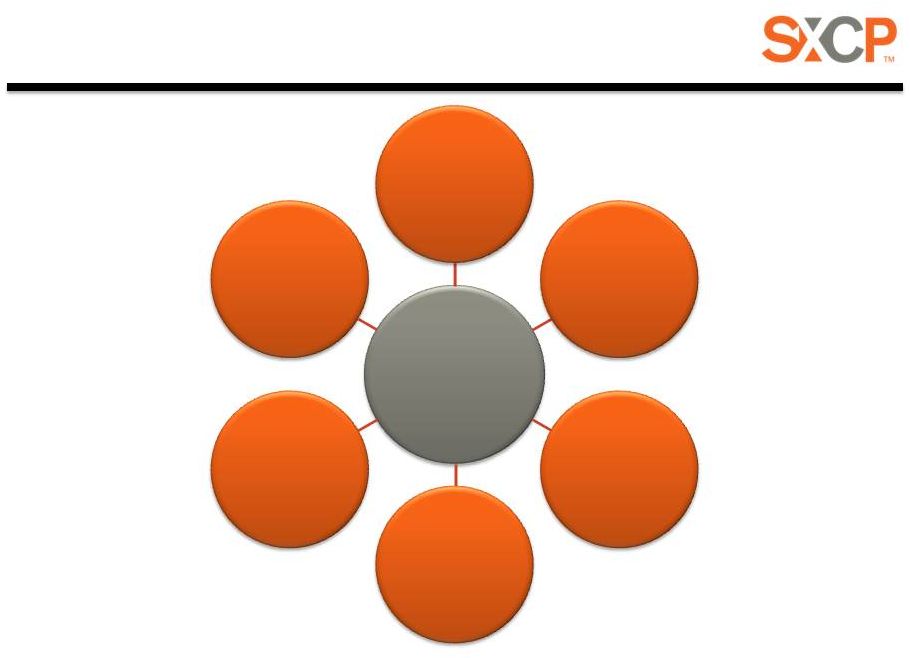 SXCP Strengths SXC and SXCP Q4 2012 Earnings Conference Call 15 Modern, High Quality Asset Base Stable Cash Flow from Long-Term Take-or-Pay Contracts and Cost Pass-Thru Provisions Strong Sponsor and Experienced Management Team Contractual Support from Sponsor (Omnibus Agreement) Growth Opportunities Financial Flexibility to Facilitate Growth SXCP SXCP Strengths Strengths |
 ProForma Liquidity & Debt Metrics SXC and SXCP Q4 2012 Earnings Conference Call 16 (in millions) SunCoke SXCP Consolidated Cash Position at 12/31/12 239 $ - $ 239 $ Cash Retained From SXCP Offerings (1) 73 79 152 Total ProForma Cash Position 312 $ 79 $ 391 $ Revolver Capacity 150 100 250 Total Liquidity 462 $ 179 $ 641 $ Total Debt (2) 495 $ 150 $ 645 $ Total Debt (2) /2013E Adjusted EBITDA (3) 2.8x 1.7x nm Net Debt (2) 183 $ 150 $ 333 $ Net Debt (2) /2013E Adjusted EBITDA (3) 1.0x 1.7x nm (1) SunCoke cash retained includes $33M of capital expenditures reimbursement from SXCP and $40M of accounts receivable retained from Haverhill and Middletown entities prior to contribution to SXCP; SXCP cash retained includes $67M and $12M for pre-funding of environmental remediation and sales discounts obligations and assumes $40M of cash retained is used to fund replenishment of working capital. (2) SunCoke total debt equal to $720 million balance outstanding at 12/31/12 less $225 million term loan repayment completed in conjunction with SXCP IPO. SXCP total debt equal to $150 million from senior notes offering completed in conjunction with IPO. Net Debt is equal to Total Debt less Total ProForma cash (excluding cash retained for prefunding of obligations at SXCP). (3) SunCoke 2013E Adjusted EBITDA based on mid-point of 2013E guidance range of $165 to $190 million ($177.5 million for Adjusted EBITDA attributable to SXC). SXCP 2013E Adjusted EBITDA based on $88.3 million forecast. nm – Not meaningful For a definition and a reconciliation of Adjusted EBITDA, please see the appendix. |
 SXCP Q4 2012 Financial Results 17 Q4 2012 Adjusted EBITDA and Distribution Coverage in-line with 2013E forecast SXC and SXCP Q4 2012 Earnings Conference Call • Q4‘12 annualized performance $87.2m exceeds 2013E forecast of $85.8m ($88.3m less $2.5m in public partnership expenses) in SXCP prospectus • Q4‘12 ongoing cap ex higher than expected run rate due to timing ($5.4m vs. $3.5m run rate) • Normalizing for 2013E, run rate ongoing cap ex: • Proforma DCF = $16.1m • Proforma Distribution Coverage: 1.22x ($ in millions except where noted) Q4 2012 Coke Production (in '000s of tons) 443 Coke Sales Volumes (in '000s of tons) 440 Financial Results: Revenues 186.2 $ Operating Income 24.8 Net Income 15.3 Profitability Measures: ProForma* Adjusted EBITDA attributable to SXCP (1) 21.8 $ ProForma* Adjusted EBITDA per ton attributable to SXCP (1) 76.31 $ Distributable Cash Flow ProForma* Distributable Cash Flow (1) 14.9 $ Minimum Quarterly Cash Distribution 13.2 $ ProForma* Distribution Coverage Ratio 1.13x (1) For a definition of SXCP’s Adjusted EBITDA and SXCP’s Adjusted EBITDA/Ton and Distributable Cash Flow and related reconciliations, see appendix. * ProForma for SXCP IPO including changes to capital structure , corporate overhead allocations and public partnership expenses. |
 Pro Forma Common Unit Coverage 18 SXC and SXCP Q4 2012 Earnings Conference Call 12 Months Ending ($ and units in millions, except per unit data) December 31, 2013 Adjusted EBITDA attributable to SXCP (1) $88.3 Less: Cash interest ($150 million senior notes @ 7.375% plus $0.5 million revolver commitment fee) 11.6 Accrual for replacement capital expenditures 3.7 Ongoing capital expenditures (65% share of Haverhill and Middletown attributable to SXCP) 9.1 Public partnership expense 2.5 Estimated Distributable Cash Flow $61.4 Excess distributable cash flow available for distribution 8.5 Total estimated annual distributions $52.9 Minimum annual distribution per unit $1.65 Units Percentage Total Annual distributions to Public common units 13.5 42.1% $22.3 Parent's common units 2.2 6.9% 3.6 Subordinated units 15.7 49.0% 25.9 General partner units 0.6 2.0% 1.1 Total 32.1 100.0% $52.9 Total unit coverage ratio (2) 1.16x Common unit coverage ratio (3) 2.32x (1) Adjusted EBITDA equals SXCP’s 65% interest in Haverhill and Middletown’s Adjusted EBITDA (i.e., 65% net income attributable to the controlling and noncontrolling interests plus depreciation expense, interest expense, incremental public partnership expenses, and incremental corporate expenses allocated to the MLP) less the $2.4 million of incremental corporate expenses allocated to the MLP. (2) Total unit coverage ratio calculated as cash available for distribution of $61.4 million divided by total distributions at the minimum distribution rate of $52.9 million. (3) Common unit coverage ratio calculated as cash available for distribution of $61.4 million divided by the sum of the total distributions at the minimum distribution rate to public common units of $22.3 million, Parent’s common units of $3.6 million, and 50% of general partner units, or $0.5 million. |
 2013 GUIDANCE 19 SXC and SXCP Q4 2012 Earnings Conference Call |
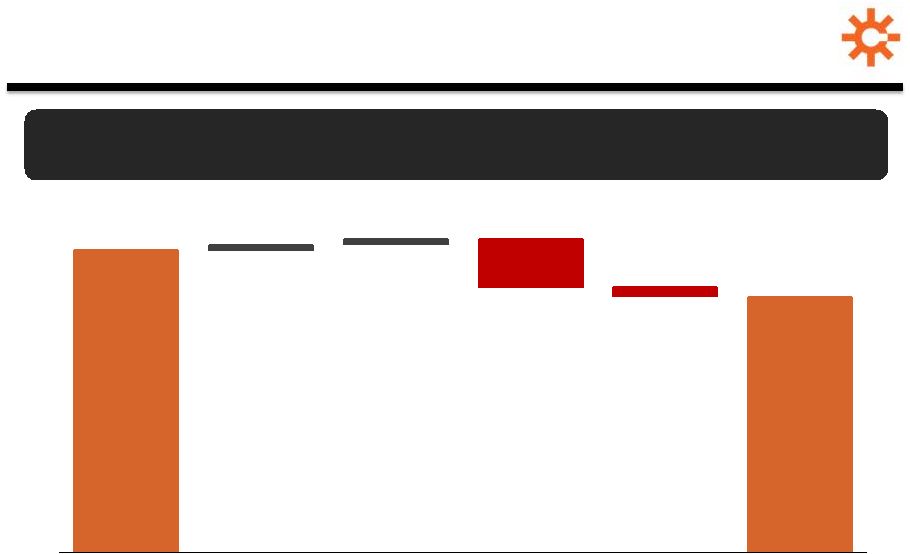 $266 $205-$230 $0-$10 $0 - $10 ($35-$50) ($5-$10) FY 2012 Adjusted EBITDA (1) Domestic Coke Business (Jewell & Other Domestic Coke) International Coke Coal Mining Corporate Costs 2013E Adjusted EBITDA (1) SXC: 2013 Adjusted EBITDA (1) Outlook 20 Estimated 2013 results to be impacted by weak coal business, partly offset by continued solid coke operations and VISA SunCoke JV ($ in millions) (1) For a definition and reconciliation of Adjusted EBITDA, please see the appendix. SXC and SXCP Q4 2012 Earnings Conference Call |
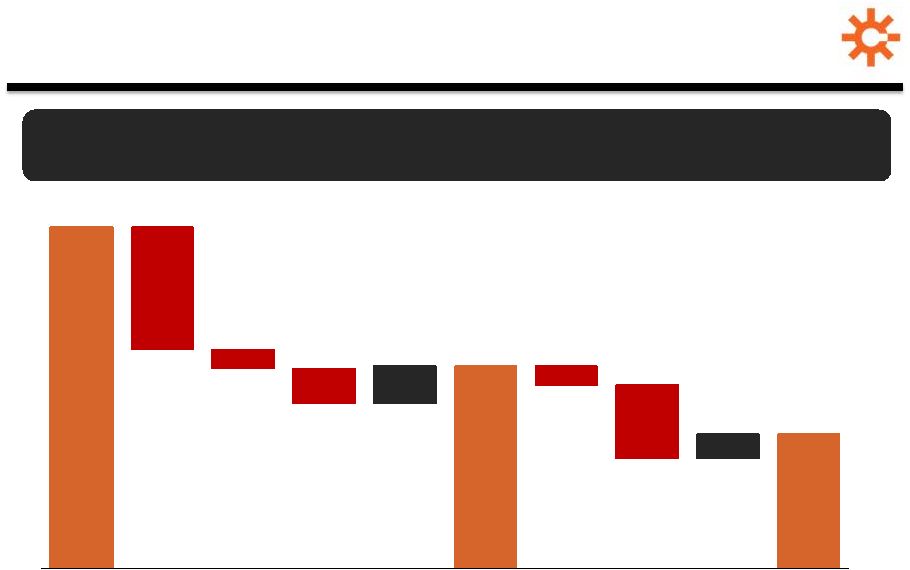 21 EPS outlook reflects lower 2013E Adjusted EBITDA (1), accelerated depreciation due to refurbishments and public ownership of SXCP $1.40 $0.60- $0.85 $0.30- $0.55 $0.09- $0.20 ~$0.10 ($0.45- $0.80) ~($0.07) ~($0.14) ~($0.08) ~($0.30) FY 2012 EPS (Diluted) 2013E EBITDA 2013E Depreciation, Depletion & Amortization 2013E Indiana Harbor Accelerated Depreciation 2013E Income Taxes 2013E EPS (Consolidated) 2013E Incremental Interest Expense 2013E EPS Impact of SXCP Public Unitholders (before tax) 2013E Income Tax Impact of SXCP Public Unitholders 2013E EPS Attributable to SXC (Diluted) (1) For a definition and reconciliation of Adjusted EBITDA, please see the appendix. SXC and SXCP Q4 2012 Earnings Conference Call SXC: 2013 Diluted Earnings Per Share Outlook |
 SXC: 2013 Guidance Summary Metric Original 2013 Guidance Revised Guidance: 2013 Post SXCP IPO Adjusted EBITDA (1) Consolidated Attributable to SXC Shareholders $205 – $230 million N/A $205 – $230 million $165 – $190 million EPS Attributable to SXC Shareholders (diluted) $0.60 - $0.85 $0.30 – $0.55 Cash Flow from Operations ~$140 million ~$140 million (3) Capital Expenditures and Investments (2) ~ $200 million ~ $200 million Effective Tax Rate 17% - 22% 7% – 14% Cash Tax Rate 17% - 22% 12% – 20% Domestic Coke Production 4.3+ million tons 4.3+ million tons Coal Production ~ 1.4 million tons ~ 1.4 million tons 22 (1) For a reconciliation of 2013E Adjusted EBITDA, please see reconciliation on slide 31. (2) See appendix for details (3) Includes ~$39 million of sales discounts payable to customers of which ~$12million is pre-funded at SXCP with IPO proceeds SXC and SXCP Q4 2012 Earnings Conference Call |
 2013 Priorities 23 SXC and SXCP Q4 2012 Earnings Conference Call Operational Excellence Operational Excellence Grow The Coke Grow The Coke Business Business Strategically Optimize Strategically Optimize Assets Assets • Sustain momentum at coke facilities • Execute Indiana Harbor Plan • Execute refurbishment • Resolve NOV • Renew coke contract with return on refurbishment capital • Implement environmental project at Haverhill and Granite City • Execute coal mining action plan to decrease cash cost • Maintain top quartile safety performance • Domestic • Obtain permit for next potential U.S. facility • Identify and pursue strategic acquisition opportunities in the U.S. and Canada • Evaluate adjacent business lines to extend growth opportunities • International • Close VISA SunCoke joint venture transaction • Identify potential follow-on opportunities in India • SXCP • Achieve smooth launch, governance and operation of SXCP • Coal • Reposition mining operations for near-term weakness and long-term strategic flexibility • Efficient Capital Allocation • Put SXC & SXCP balance sheets to work |
 QUESTIONS 24 SXC and SXCP Q4 2012 Earnings Conference Call |
 www.suncoke.com Investor Relations: 630-824-1907 |
 APPENDIX 26 SXC and SXCP Q4 2012 Earnings Conference Call |
 • Adjusted EBITDA represents earnings before interest, taxes, depreciation, depletion and amortization (“EBITDA”) adjusted for sales discounts and the interest, taxes, depreciation, depletion and amortization attributable to equity earnings in our unconsolidated affiliates. EBITDA reflects sales discounts included as a reduction in sales and other operating revenue. The sales discounts represent the sharing with customers of a portion of nonconventional fuel tax credits, which reduce our income tax expense. However, we believe our Adjusted EBITDA would be inappropriately penalized if these discounts were treated as a reduction of EBITDA since they represent sharing of a tax benefit that is not included in EBITDA. Accordingly, in computing Adjusted EBITDA, we have added back these sales discounts. Our Adjusted EBITDA also includes EBITDA attributable to our unconsolidated affiliates. EBITDA and Adjusted EBITDA do not represent and should not be considered alternatives to net income or operating income under GAAP and may not be comparable to other similarly titled measures in other businesses. Adjusted EBITDA does not represent and should not be considered as an alternative to net income as determined by GAAP, and calculations thereof may not be comparable to those reported by other companies. We believe Adjusted EBITDA is an important measure of operating performance and provides useful information to investors because it highlights trends in our business that may not otherwise be apparent when relying solely on GAAP measures and because it eliminates items that have less bearing on our operating performance. Adjusted EBITDA is a measure of operating performance that is not defined by GAAP and should not be considered a substitute for net (loss) income as determined in accordance with GAAP. • Adjusted EBITDA attributable to SXC/SXCP equals Adjusted EBITDA less Adjusted EBITDA attributable to noncontrolling interests. • Adjusted EBITDA/Ton represents Adjusted EBITDA divided by tons sold. When applicable to Adjusted EBITDA attributable to SXC or SXCP, tons sold are prorated according to the respective ownership interest of SXC or SXCP as applicable. • Free Cash Flow equals cash from operations less cash used in investing activities less cash distributions to non-controlling interests. Management believes Free Cash Flow information enhances an investor’s understanding of a business’ ability to generate cash. Free Cash Flow does not represent and should not be considered an alternative to net income or cash flows from operating activities as determined under GAAP and may not be comparable to other similarly titled measures of other businesses. Definitions SXC and SXCP Q4 2012 Earnings Conference Call 27 |
 • Distributable Cash Flow equals Adjusted EBITDA less net cash paid for interest expense, on-going capital expenditures, accruals for replacement capital expenditures, and cash distributions to noncontrolling interests. Distributable Cash Flow is a non-GAAP supplemental financial measure that management and external users of the Partnership's financial statements, such as industry analysts, investors, lenders, and rating agencies, use to assess: • the Partnership's operating performance as compared to other publicly traded partnerships, without regard to historical cost basis; • the ability of the Partnership's assets to generate sufficient cash flow to make distributions to the Partnership's unitholders; • the Partnership's ability to incur and service debt and fund capital expenditures; and • the viability of acquisitions and other capital expenditure projects and the returns on investment of various investment opportunities. The Partnership believes that Distributable Cash Flow provides useful information to investors in assessing the Partnership's financial condition and results of operations. Distributable Cash Flow should not be considered an alternative to net income, operating income, cash flows from operating activities, or any other measure of financial performance or liquidity presented in accordance with generally accepted accounting principles (GAAP). Distributable Cash Flow has important limitations as an analytical tool because it excludes some, but not all, items that affect net income and net cash provided by operating activities and used in investing activities. Additionally, because Distributable Cash Flow may be defined differently by other companies in the industry, the Partnership's definition of Distributable Cash Flow may not be comparable to similarly titled measures of other companies, thereby diminishing their utility. Definitions SXC and SXCP Q4 2012 Earnings Conference Call 28 |
 Reconciliations 29 SXC and SXCP Q4 2012 Earnings Conference Call $ in millions FY 2012 Q4 2012 Q3 2012 Q2 2012 Q1 2012 FY 2011 Q4 2011 Q3 2011 Q2 2011 Q1 2011 Net Income 102.5 29.0 32.9 24.0 16.6 58.9 7.5 21.6 24.1 5.7 Subtract: Depreciation, depletion and amortization (80.8) (23.3) (18.9) (20.2) (18.4) (58.4) (16.0) (14.7) (14.7) (13.0) Subtract: Financing expense, net (47.8) (11.8) (12.2) (11.8) (12.0) (1.4) (7.1) (3.3) 4.5 4.5 Subtract: Income Tax (23.4) (3.5) (7.6) (7.0) (5.3) (7.2) 2.9 (5.1) (1.9) (3.1) EBITDA 254.5 67.6 71.6 63.0 52.3 125.9 27.7 44.7 36.2 17.3 Add: Sales Discount 11.2 2.1 2.1 3.8 3.2 12.9 3.2 3.5 3.1 3.1 Add: Adjustment to unconsolidated affiliate earnings - - - - - - - - - - Adjusted EBITDA 265.7 69.7 73.7 66.8 55.5 138.8 30.9 48.2 39.3 20.4 Adjusted EBITDA attributable to non controlling interests (3.0) (1.5) (1.1) (0.9) 0.5 4.0 0.8 (2.7) (0.9) 6.8 Adjusted EBITDA attributable to SXC 262.7 68.2 72.6 65.9 56.0 142.8 31.7 45.5 38.4 27.2 Reconciliations from Net Income to Adjusted EBITDA |
   $ in millions, except per ton data Jewell Coke Other Domestic Coke International Coke Jewell Coal Corporate Combined Domestic Coke FY 2012 Adjusted EBITDA 50.5 198.9 11.9 33.4 (29.0) 265.7 249.4 Sales Volume (thousands of tons) 710 3,635 1,209 1,500 4,345 Adjusted EBITDA per Ton 71.1 54.7 9.8 22.3 57.4 Q4 2012 Adjusted EBITDA 9.4 53.0 10.2 6.0 (8.9) 69.7 62.4 Sales Volume (thousands of tons) 170 907 239 370 1,077 Adjusted EBITDA per Ton 55.3 58.4 42.7 16.2 57.9 Q3 2012 Adjusted EBITDA 13.6 56.2 0.9 10.7 (7.7) 73.7 69.8 Sales Volume (thousands of tons) 183 933 310 392 1,116 Adjusted EBITDA per Ton 74.3 60.2 2.9 27.3 62.5 Q2 2012 Adjusted EBITDA 12.5 49.9 0.7 9.3 (5.6) 66.8 62.4 Sales Volume (thousands of tons) 170 904 302 365 1,074 Adjusted EBITDA per Ton 73.5 55.2 2.3 25.5 58.1 Q1 2012 Adjusted EBITDA 15.0 39.8 0.1 7.4 (6.8) 55.5 54.8 Sales Volume (thousands of tons) 186 892 358 373 1,078 Adjusted EBITDA per Ton 80.6 44.6 0.3 19.8 50.8 Reconciliation of Segment Adjusted EBITDA and Adjusted EBITDA per Ton Reconciliations 30 SXC and SXCP Q4 2012 Earnings Conference Call |
   Reconciliations 31 SXC and SXCP Q4 2012 Earnings Conference Call $ in millions, except per ton data Jewell Coke Other Domestic Coke International Coke Jewell Coal Corporate Combined Domestic Coke FY 2011 Adjusted EBITDA 46.1 87.7 13.7 35.5 (44.2) 138.8 133.8 Sales Volume (thousands of tons) 702 3,068 1,442 1,454 3,770 Adjusted EBITDA per Ton 65.7 28.6 9.5 24.4 35.5 Q4 2011 Adjusted EBITDA 10.6 20.8 10.2 2.5 (13.2) 30.9 31.4 Sales Volume (thousands of tons) 166 837 295 363 1,003 Adjusted EBITDA per Ton 63.9 24.9 34.6 6.9 31.3 Q3 2011 Adjusted EBITDA 13.9 37.7 1.7 9.2 (14.3) 48.2 51.6 Sales Volume (thousands of tons) 191 777 373 371 968 Adjusted EBITDA per Ton 72.8 48.5 4.6 24.8 53.3 Q2 2011 Adjusted EBITDA 10.6 26.9 0.8 11.5 (10.5) 39.3 37.5 Sales Volume (thousands of tons) 170 757 412 334 927 Adjusted EBITDA per Ton 62.4 35.5 1.9 34.4 40.5 Q1 2011 Adjusted EBITDA 11.0 2.3 1.0 12.3 (6.2) 20.4 13.3 Sales Volume (thousands of tons) 175 697 362 386 872 Adjusted EBITDA per Ton 62.9 3.3 2.8 31.9 15.3 Reconciliation of Segment Adjusted EBITDA and Adjusted EBITDA per Ton |
 2012 Guidance and Results Metric Initial 2012 Guidance (as of February 2, 2012) 2012 Actual Adjusted EBITDA (1) $250 – $280 million $265.7 million EPS (assuming a 22% tax rate) $1.30 – $1.65 $1.40 Capital Expenditures & Investments ~ $150 million $84.1 million Free Cash Flow (2) $50+ million $120 million Cash Tax Rate 10% – 15% 5.0% Effective Tax Rate 20% – 24% 18.6% Corporate Costs $30 - $35 million $29 million Coke Production 4.0 - 4.2 million tons 4.34 million tons Coal Production ~ 1.8 million tons 1.48 million tons 32 (1) For a definition and reconciliation of Adjusted EBITDA, please see the appendix. (2) For a definition of Free Cash Flow and reconciliation, please see the appendix. |
 2012 Free Cash Flow Reconciliation 33 (in millions) FY 2012 Cash from operations $206.1 Less cash used for investing activities (84.1) Less payments to non controlling interest (2.3) Free Cash Flow $119.7 2012 Free Cash Flow Reconciliation SXC and SXCP Q4 2012 Earnings Conference Call |
   (in millions) 2013E Low 2013E High Net Income $43 $60 Depreciation, Depletion and Amortization 97 95 Total financing costs, net 55 55 Income tax expense 3 10 EBITDA $198 $220 Sales discounts 7 7 Adjustment to unconsolidated affiliate earnings – 3 Adjusted EBITDA $205 $230 EBITDA attributable to noncontrolling interests (40) (40) Adjusted EBITDA attributable to SXC $165 $190 2013E Net Income to Adjusted EBITDA Reconciliation Expected 2013E EBITDA Reconciliation 34 SXC and SXCP Q4 2012 Earnings Conference Call (1) Represents SXC share of India JV interest, taxes and depreciation expense (2) Represents Adjusted EBITDA attributable to SXCP public unitholders and to DTE’s interest in Indiana Harbor (1) (2) |
   2013E Capital Expenditures and Investments SXC and SXCP Q4 2012 Earnings Conference Call 35 ($ in millions) SXC SXCP Consolidated On-Going Approx. $49 $9 $58 Environmental Remediation Approx. - $15 $15 Expansion Approx. 60 - 60 Total CapEx Approx. $109 $24 $133 Investments Approx. $67 - $67 Total CapEx & Investments Approx. $176 $24 $200 For Year Ended December 31, 2013 • Expansion includes approx. $60m for Indiana Harbor Refurbishment • SXCP expenditures prefunded from IPO proceeds • To fund investment in India JV (Visa SunCoke) • SXC includes approximately $25m coke and $24m coal • SXCP includes 65% of $14m expected at Haverhill and Middletown |
  SXCP – Adjusted EBITDA and Distributable Cash Flow Reconciliations, ProForma for SXCP IPO SXC and SXCP Q4 2012 Earnings Conference Call 36 ($ in Millions) 2012 Net Income 15.3 $ Add: Income Taxes 7.0 Add: Interest Expense (1) 2.5 Add: Depreciation, depletion and amortization 8.8 Add: Sales discounts - Add: ProForma adjustment for allocated corporate and public partnership expenses (2) 0.6 Adjusted EBITDA 34.2 $ Subtract: ProForma cash interest (3) (2.9) Subtract: On-going capital expenditures (5.4) Subtract: ProForma accrual for replacement capital expenditures (4) (0.9) Subtract: ProForma cash distribution to Sponsor (5) (10.1) ProForma Distributable Cash Flow 14.9 $ Minimum Quarterly Cash Distribution 13.2 ProForma Distribution Coverage Ratio 1.13x Adjusted EBITDA 34.2 $ Subtract: ProForma Adjusted EBITDA attributable to Sponsor (6) (12.4) ProForma Adjusted EBITDA attributable to SXCP 21.8 $ For the three months ended December 31, (1) Reflects Predecessor entity accounting and includes $225 million of Term B debt assumed from parent at ~4.0 percent interest (2) Reflects $1.8 million reduction in SG&A due to discontinuation of Predecessor carve-out accounting allocations, less $0.6 million quarterly proration of expected allocated corporate expenses from parent (~$2.4 million annually), less $0.6 million quarterly proration of expected public partnership expenses (~$2.5 million annually) (3) ProForma cash interest for $150 million senior notes at 7.375% and revolver commitment fee in conjunction with SXCP IPO. (4) Reflects accrual to fund SXCP share of estimated cost to replace or rebuild its facilities at the end of their working lives. (5) Represents distributions from Haverhill and Middletown to SXC for its 35% direct interest in those entities. The distribution is determined prior to certain costs incurred by SXCP and not by Haverhill and Middletown, including cash interest expense, accrual for replacement capital and SG&A incurred by or allocated directly to the Partnership. (6) Represents Adjusted EBITDA attributable to SXC’s 35% interest in Haverhill and Middletown and is calculated before the quarterly portion of incremental allocated corporate expenses ($2.4 million per year) and incremental public partnership expenses ($2.5 million per year) SXCP expects to incur in 2013. |