Exhibit 99.1

Barclays High
Yield Bond &
Syndicated Loan
Conference
May 21, 2013

Ryan Osterholm
Treasurer and VP, Finance
& Investor Relations
Forward-Looking Statements TM
Some of the information included in this presentation constitutes “forward-looking statements” as defined in Section 27A of the Securities Act
of 1933, as amended and Section 21E of the Securities Exchange Act of 1934, as amended. All statements in this presentation that express
opinions, expectations, beliefs, plans, objectives, assumptions or projections with respect to anticipated future performance of SunCoke Energy,
Inc. (“SunCoke”) or SunCoke Energy Partners, L.P. (“Partnership”), in contrast with statements of historical facts, are forward-looking
statements. Such forward-looking statements are based on management’s beliefs and assumptions and on information currently available.
Forward-looking statements include information concerning possible or assumed future results of operations, business strategies, financing
plans, competitive position, potential growth opportunities, potential operating performance improvements, the effects of competition and the
effects of future legislation or regulations. Forward-looking statements include all statements that are not historical facts and may be identified
by the use of forward-looking terminology such as the words “believe,” “expect,” “plan,” “intend,” “anticipate,” “estimate,” “predict,”
“potential,” “continue,” “may,” “will,” “should” or the negative of these terms or similar expressions.
Although management believes that its plans, intentions and expectations reflected in or suggested by the forward-looking statements made in
this presentation are reasonable, no assurance can be given that these plans, intentions or expectations will be achieved when anticipated or at
all. Moreover, such statements are subject to a number of assumptions, risks and uncertainties. Many of these risks are beyond the control of
SunCoke and the Partnership, and may cause actual results to differ materially from those implied or expressed by the forward-looking
statements. Each of SunCoke and the Partnership has included in its filings with the Securities and Exchange Commission (including, in the case
of the Partnership, its Form S-1) cautionary language identifying important factors (but not necessarily all the important factors) that could
cause actual results to differ materially from those expressed in any forward-looking statement. For more information concerning these factors,
see the Securities and Exchange Commission filings of SunCoke and the Partnership. All forward-looking statements included in this
presentation are expressly qualified in their entirety by such cautionary statements. Although forward-looking statements are based on current
beliefs and expectations, caution should be taken not to place undue reliance on any such forward-looking statements because such statements
speak only as of the date hereof. Neither SunCoke nor the Partnership has any intention or obligation to update publicly any forward-looking
statement (or its associated cautionary language) whether as a result of new information or future events or after the date of this presentation,
except as required by applicable law.
This presentation includes certain non-GAAP financial measures intended to supplement, not substitute for, comparable GAAP measures.
Reconciliations of non-GAAP financial measures to GAAP financial measures are provided in the Appendix at the end of the presentation.
Investors are urged to consider carefully the comparable GAAP measures and the reconciliations to those measures provided in the Appendix.
3 |
|

ABOUT SUNCOKE
4
About SunCoke TM
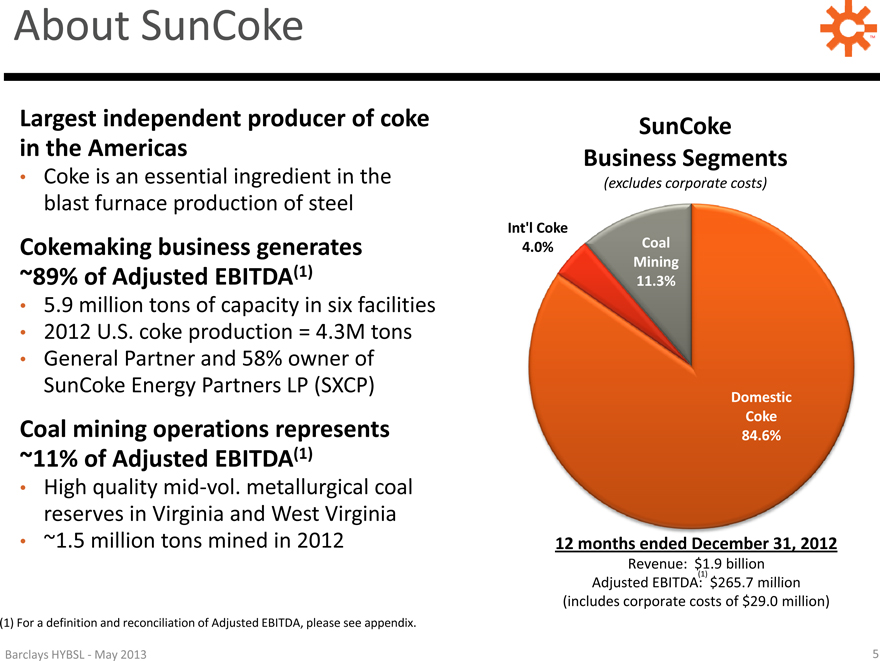
Largest independent producer of coke SunCoke
in the Americas Business Segments
Coke is an essential ingredient in the (excludes corporate costs)
blast furnace production of steel
Int’l Coke
Cokemaking business generates 4.0% Coal
Mining
~89% of Adjusted EBITDA(1) 11.3%
5.9 million tons of capacity in six facilities
2012 U.S. coke production = 4.3M tons
General Partner and 58% owner of
SunCoke Energy Partners LP (SXCP)
Domestic
Coke
Coal mining operations represents 84.6%
~11% of Adjusted EBITDA(1)
High quality mid-vol. metallurgical coal
reserves in Virginia and West Virginia
~1.5 million tons mined in 2012 12 months ended December 31, 2012
Revenue: $1.9 billion
Adjusted EBITDA:(1) $265.7 million
(includes corporate costs of $29.0 million)
(1) For a definition and reconciliation of Adjusted EBITDA, please see appendix.
Barclays HYBSL—May 2013 5
The Leading Independent Cokemaker TM
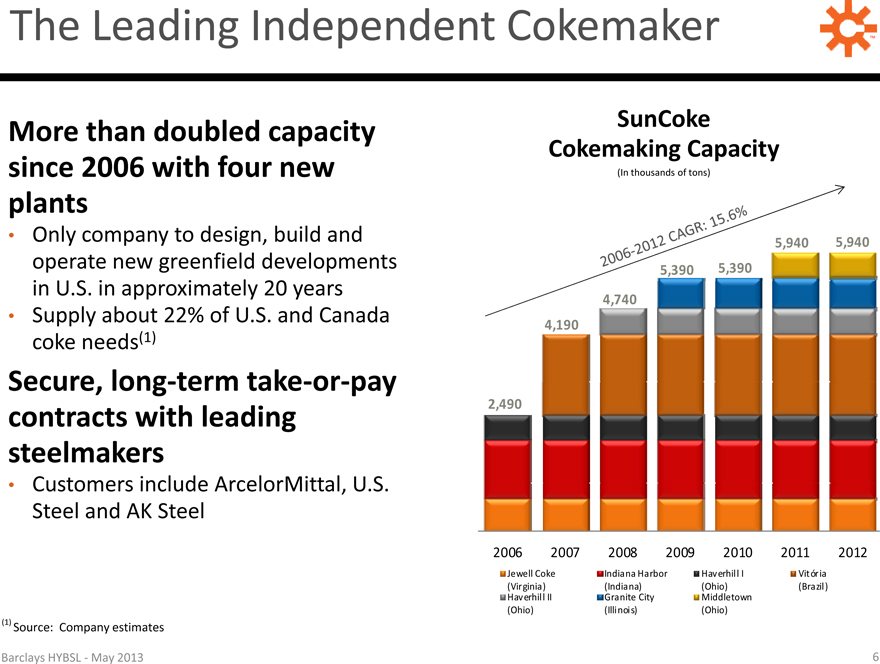
More than doubled capacity SunCoke
Cokemaking Capacity
since 2006 with four new (In thousands of tons)
plants
Only company to design, build and
operate new greenfield developments
in U.S. in approximately 20 years
Supply about 22% of U.S. and Canada
coke needs(1)
Secure, long-term take-or-pay
contracts with leading
steelmakers
Customers include ArcelorMittal, U.S.
Steel and AK Steel
(1) Source: Company estimates
Barclays HYBSL—May 2013 6

SunCoke Operations TM
Our cokemaking operations are strategically located in
proximity to our customers’ integrated steelmaking facilities
Indiana
Harbor Middletown*
Haverhill 1* Haverhill 2*
Vitoria, Brazil
Jewell Coke Coal Mining
114M tons
of reserves
Granite City
Odisha, India
*65% owned by SXCP
Barclays HYBSL—May 2013 7
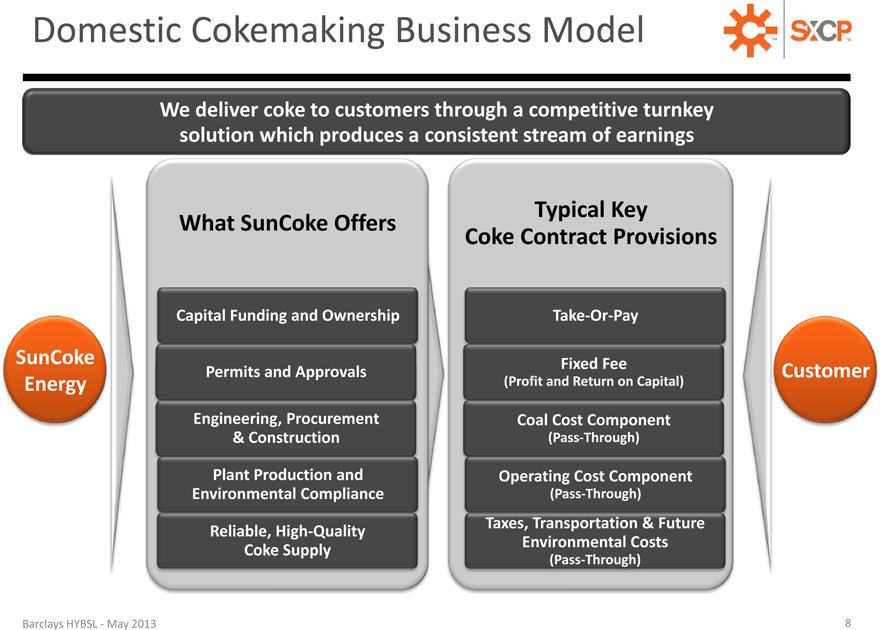
Domestic Cokemaking Business Model TM
We deliver coke to customers through a competitive turnkey
solution which produces a consistent stream of earnings
What SunCoke Offers Typical Key
Coke Contract Provisions
Capital Funding and Ownership Take-Or-Pay
SunCoke Fixed Fee
Permits and Approvals Customer
Energy (Profit and Return on Capital)
Engineering, Procurement Coal Cost Component
& Construction (Pass-Through)
Plant Production and Operating Cost Component
Environmental Compliance (Pass-Through)
Reliable, High-Quality Taxes, Transportation & Future
Coke Supply Environmental Costs
(Pass-Through)
Barclays HYBSL—May 2013 8
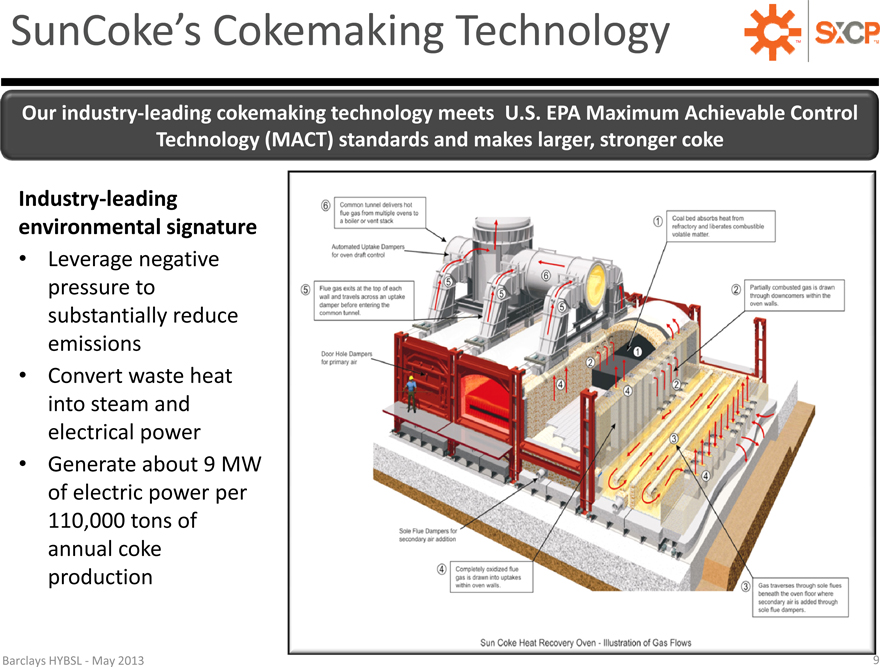
SunCoke’s Cokemaking Technology TM
Our industry-leading cokemaking technology meets U.S. EPA Maximum Achievable Control
Technology (MACT) standards and makes larger, stronger coke
Industry-leading
environmental signature
Leverage negative
pressure to
substantially reduce
emissions
Convert waste heat
into steam and
electrical power
Generate about 9 MW
of electric power per
110,000 tons of
annual coke
production
Barclays HYBSL—May 2013 9
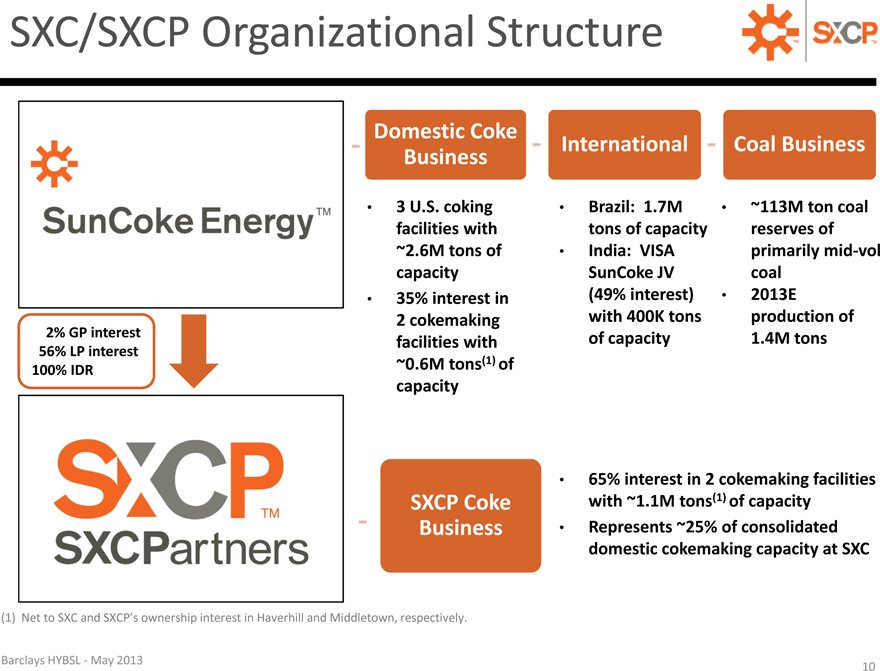
SXC/SXCP Organizational Structure TM
Domestic Coke International Coal Business
Business
3 U.S. coking Brazil: 1.7M ~113M ton coal
facilities with tons of capacity reserves of
~2.6M tons of India: VISA primarily mid-vol
capacity SunCoke JV coal
35% interest in (49% interest) 2013E
2 cokemaking with 400K tons production of
2% GP interest facilities with of capacity 1.4M tons
56% LP interest
100% IDR ~0.6M tons(1) of
capacity
65% interest in 2 cokemaking facilities
SXCP Coke with ~1.1M tons(1) of capacity
Business Represents ~25% of consolidated
domestic cokemaking capacity at SXC
(1) Net to SXC and SXCP’s ownership interest in Haverhill and Middletown, respectively.
Barclays HYBSL—May 2013 10
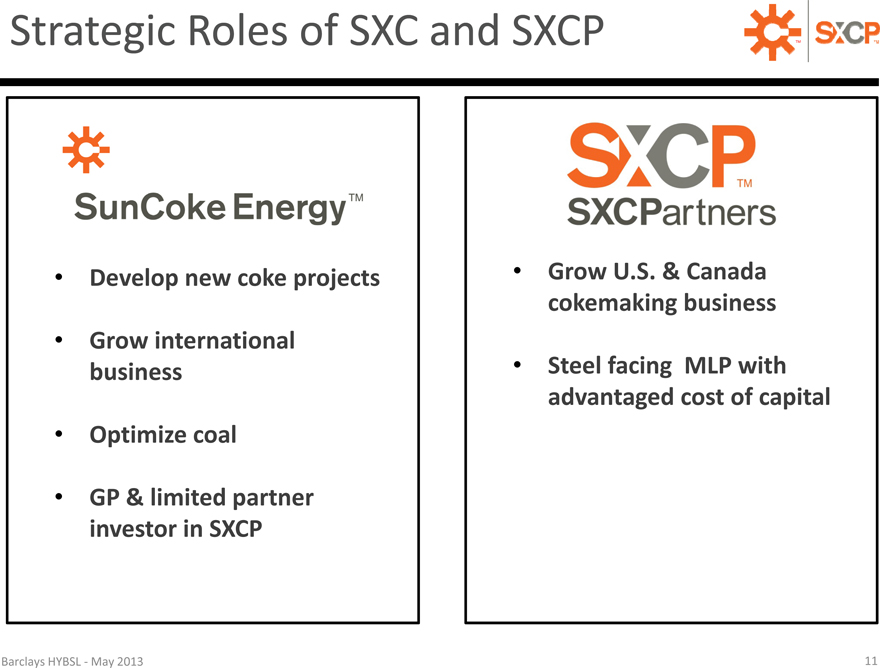
Strategic Roles of SXC and SXCP TM
Develop new coke projects Grow U.S. & Canada
cokemaking business
Grow international
business Steel facing MLP with
advantaged cost of capital
Optimize coal
GP & limited partner
investor in SXCP
Barclays HYBSL—May 2013 11

OUR MARKET OPPORTUNITY
12

U.S. and Canada Opportunity TM
SunCoke’s coke is competitive on price, quality and reliability,
providing us the opportunity to displace imported coke
Representative Delivered Coke Prices—$/ton U.S. and Canada Coke Imports
Source: World Price (DTC), Coke Market Report, CRU and company estimates Source: CRU and Resource Net
Barclays HYBSL—May 2013 13
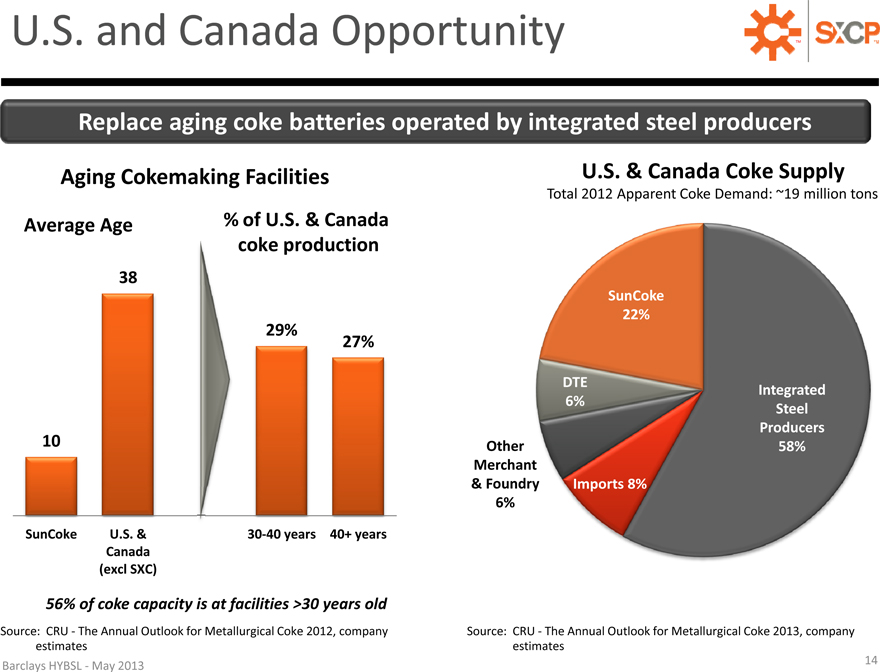
U.S. and Canada Opportunity TM
Replace aging coke batteries operated by integrated steel producers
Aging Cokemaking Facilities U.S. & Canada Coke Supply
Total 2012 Apparent Coke Demand: ~19 million tons
Average Age % of U.S. & Canada
coke production
38
SunCoke
22%
29%
27%
DTE Integrated
6% Steel
Producers
10 Other 58%
Merchant
& Foundry Imports 8%
6%
SunCoke U.S. & 30-40 years 40+ years
Canada
(excl SXC)
56% of coke capacity is at facilities >30 years old
Source: CRU—The Annual Outlook for Metallurgical Coke 2012, company Source: CRU—The Annual Outlook for Metallurgical Coke 2013, company
estimates estimates
Barclays HYBSL—May 2013 14
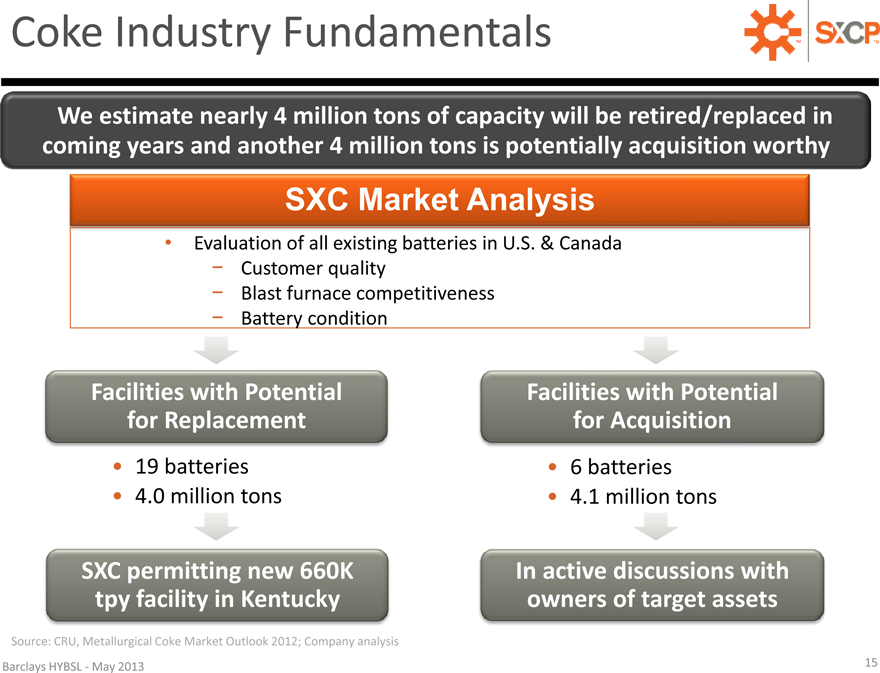
Coke Industry Fundamentals TM
We estimate nearly 4 million tons of capacity will be retired/replaced in
coming years and another 4 million tons is potentially acquisition worthy
SXC Market Analysis
Evaluation of all existing batteries in U.S. & Canada
— Customer quality
— Blast furnace competitiveness
— Battery condition
Facilities with Potential Facilities with Potential
for Replacement for Acquisition
19 batteries 6 batteries
4.0 million tons 4.1 million tons
SXC permitting new 660K In active discussions with
tpy facility in Kentucky owners of target assets
Source: CRU, Metallurgical Coke Market Outlook 2012; Company analysis
Barclays HYBSL—May 2013 15
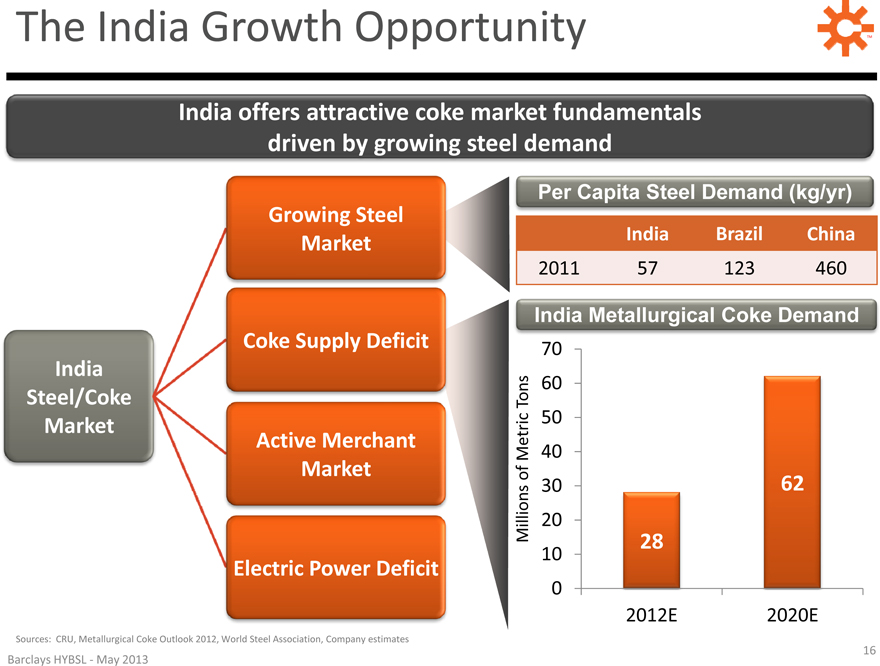
The India Growth Opportunity TM
India offers attractive coke market fundamentals
driven by growing steel demand
Per Capita Steel Demand (kg/yr)
Growing Steel
Market India Brazil China
2011 57 123 460
India Metallurgical Coke Demand
Coke Supply Deficit 70
India
60
Steel/Coke Tons
Market 50
Metric 40
of 30 62
Millions 20
10 28
Electric Power Deficit
0
2012E 2020E
Sources: CRU, Metallurgical Coke Outlook 2012, World Steel Association, Company estimates
16
Barclays HYBSL—May 2013
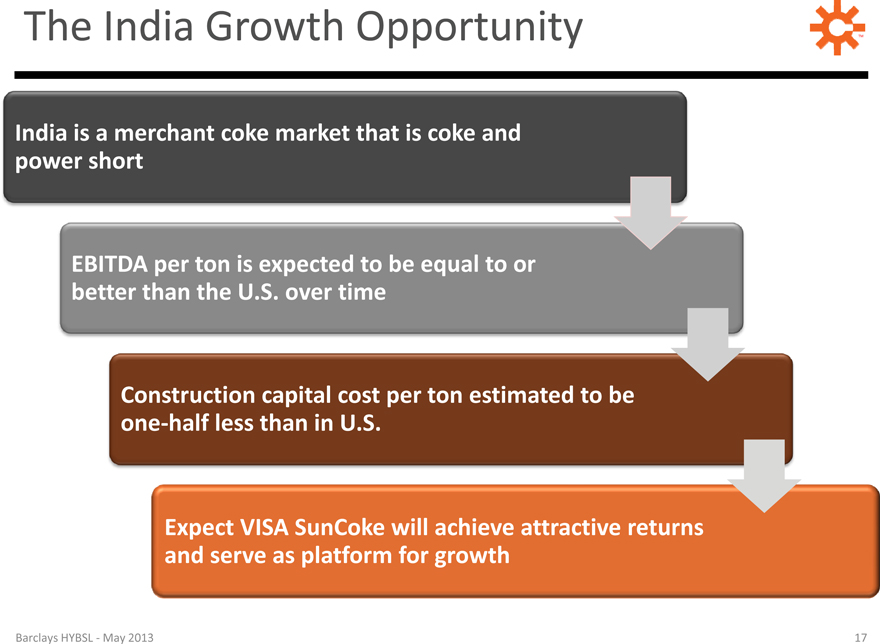
The India Growth Opportunity TM
India is a merchant coke market that is coke and
power short
EBITDA per ton is expected to be equal to or
better than the U.S. over time
Construction capital cost per ton estimated to be
one-half less than in U.S.
Expect VISA SunCoke will achieve attractive returns
and serve as platform for growth
Barclays HYBSL—May 2013 17
1Q 2013 FINANCIAL PERFORMANCE
18
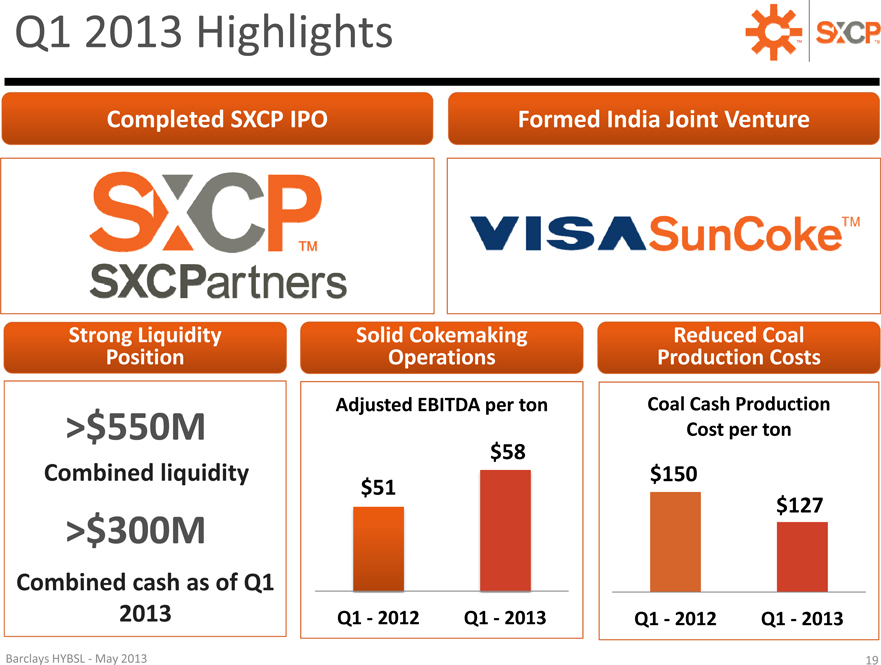
Q1 2013 Highlights TM
Completed SXCP IPO Formed India Joint Venture
Strong Liquidity Solid Cokemaking Reduced Coal
Position Operations Production Costs
Adjusted EBITDA per ton Coal Cash Production
>$550M Cost per ton
$ 58
Combined liquidity $150
$ 51
$127
>$300M
Combined cash as of Q1
2013 Q1—2012 Q1—2013 Q1—2012 Q1—2013
Barclays HYBSL—May 2013 19
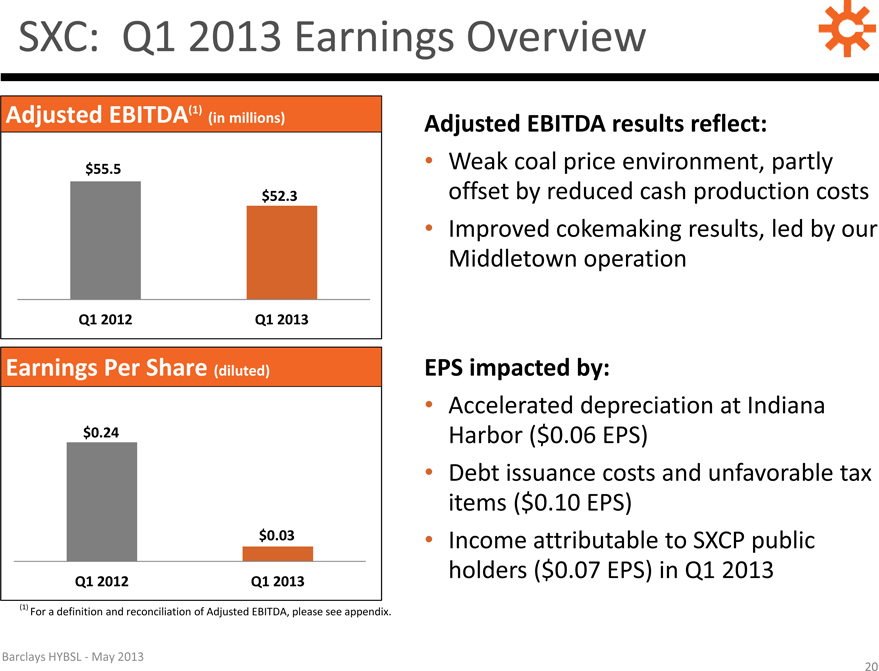
SXC: Q1 2013 Earnings Overview
Adjusted EBITDA(1)
(in millions) Adjusted EBITDA results reflect:
$55.5 Weak coal price environment, partly
$52.3 offset by reduced cash production costs
Improved cokemaking results, led by our
Middletown operation
Q1 2012 Q1 2013
Earnings Per Share (diluted) EPS impacted by:
Accelerated depreciation at Indiana
$0.24 Harbor ($0.06 EPS)
Debt issuance costs and unfavorable tax
items ($0.10 EPS)
$0.03 Income attributable to SXCP public
Q1 2012 Q1 2013 holders ($0.07 EPS) in Q1 2013
(1) For a definition and reconciliation of Adjusted EBITDA, please see appendix.
Barclays HYBSL—May 2013
20
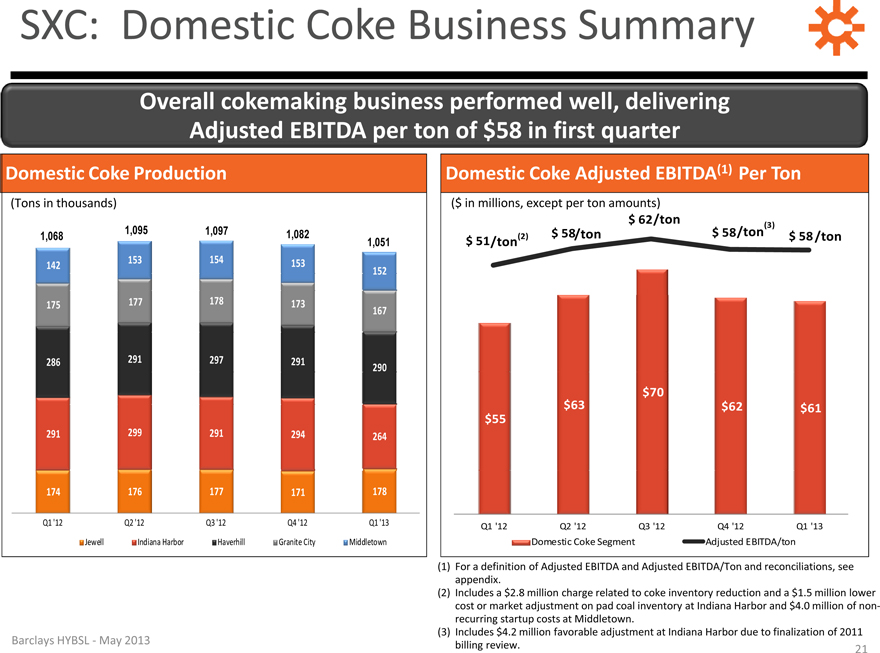
SXC: Domestic Coke Business Summary
Overall cokemaking business performed well, delivering
Adjusted EBITDA per ton of $58 in first quarter
Domestic Coke Production Domestic Coke Adjusted EBITDA(1) Per Ton
(Tons in thousands)
appendix.
(2) Includes a $2.8 million charge related to coke inventory reduction and a $1.5 million lower
cost or market adjustment on pad coal inventory at Indiana Harbor and $4.0 million of non-
recurring startup costs at Middletown.
(3) Includes $4.2 million favorable adjustment at Indiana Harbor due to finalization of 2011
Barclays HYBSL—May 2013
billing review. 21
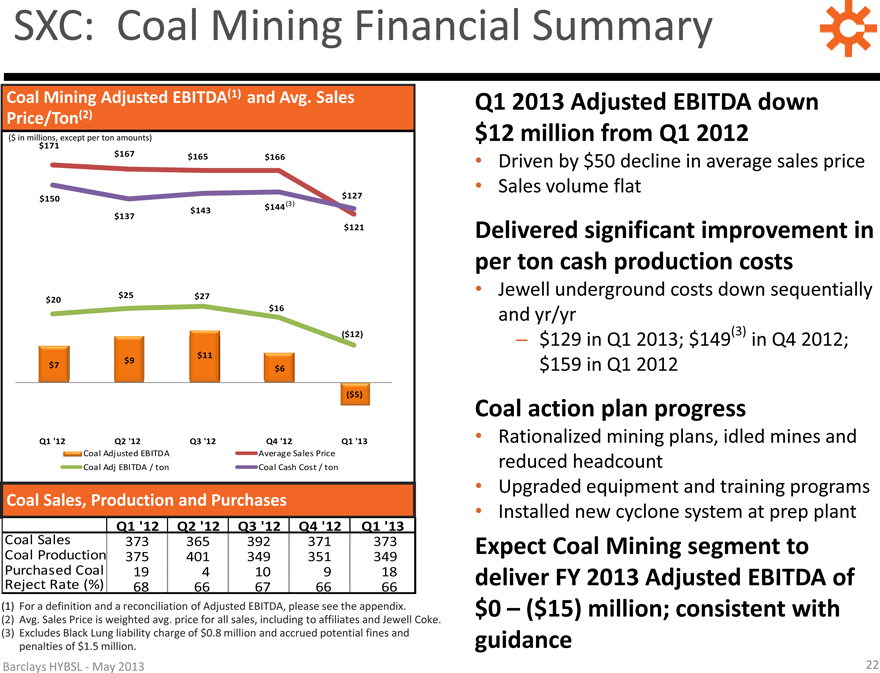
SXC: Coal Mining Financial Summary
Coal Mining Adjusted EBITDA(1) and Avg. Sales Q1 2013 Adjusted EBITDA down
Price/Ton(2)
($ in millions, except per ton amounts) $12 million from Q1 2012
Driven by $50 decline in average sales price
Sales volume flat
Delivered significant improvement in
per ton cash production costs
Jewell underground costs down sequentially
and yr/yr
– $129 in Q1 2013; $149(3) in Q4 2012;
$159 in Q1 2012
Coal action plan progress
Rationalized mining plans, idled mines and
reduced headcount
Upgraded equipment and training programs
Coal Sales, Production and Purchases Installed new cyclone system at prep plant
Q1 ‘12 Q2 ‘12 Q3 ‘12 Q4 ‘12 Q1 ‘13
Coal Sales 373 365 392 371 373 Expect Coal Mining segment to
Coal Production 375 401 349 351 349
Purchased Coal 19 4 10 9 18 deliver FY 2013 Adjusted EBITDA of
Reject Rate (%) 68 66 67 66 66
(1) For a definition and a reconciliation of Adjusted EBITDA, please see the appendix. $0 – ($15) million; consistent with
(2) Avg. Sales Price is weighted avg. price for all sales, including to affiliates and Jewell Coke.
(3) Excludes Black Lung liability charge of $0.8 million and accrued potential fines and guidance
penalties of $1.5 million.
Barclays HYBSL—May 2013 22
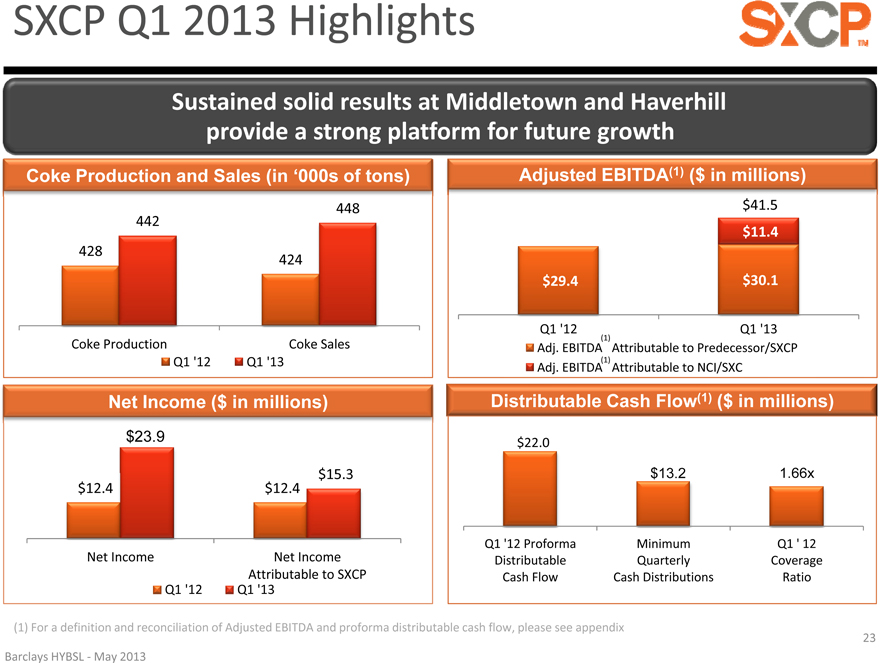
SXCP Q1 2013 Highlights
Sustained solid results at Middletown and Haverhill
provide a strong platform for future growth
Coke Production and Sales (in ‘000s of tons) Adjusted EBITDA(1) ($ in millions)
448 $ 41.5
442
$11.4
428 424
$29.4 $30.1
Q1 ‘12 Q1 ‘13
(1)
Coke Production Coke Sales Adj. EBITDA Attributable to NCI/SXC
Q1 ‘12 Q1 ‘13 (1)
Adj. EBITDA Attributable to Predecessor/SXCP
Net Income ($ in millions) Distributable Cash Flow(1) ($ in millions)
$23.9 $22.0
$15.3 $13.2 1.66x
$12.4 $12.4
Q1 ‘12 Proforma Minimum Q1 ‘ 12
Net Income Net Income Distributable Quarterly Coverage
Attributable to SXCP Cash Flow Cash Distributions Ratio
Q1 ‘12 Q1 ‘13
(1) For a definition and reconciliation of Adjusted EBITDA and proforma distributable cash flow, please see appendix
23
Barclays HYBSL—May 2013

FINANCIAL STRENGTH AND OUTLOOK
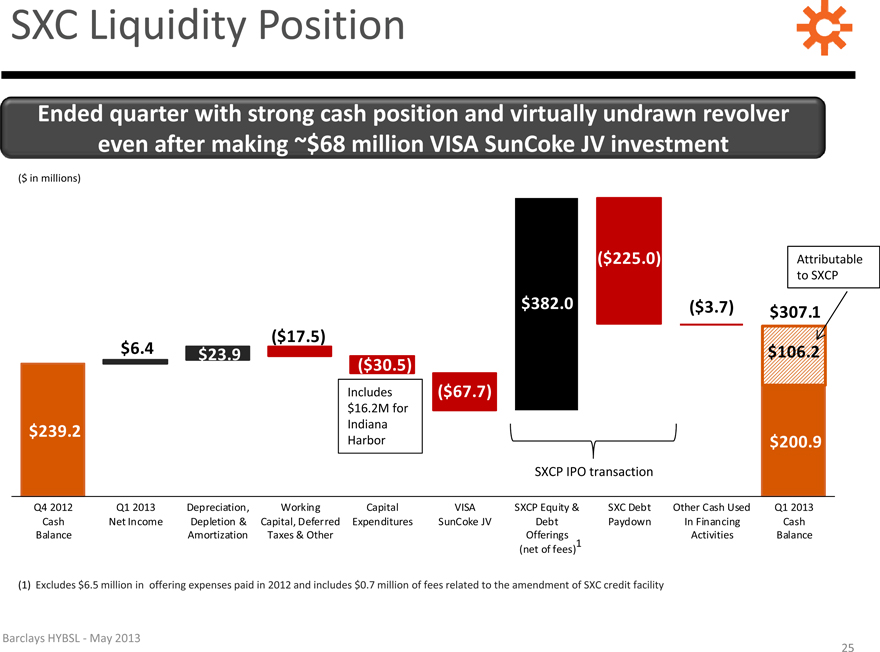
SXC Liquidity Position
Ended quarter with strong cash position and virtually undrawn revolver
even after making ~$68 million VISA SunCoke JV investment
($ in millions)
($225.0) Attributable
to SXCP
$382.0 ($3.7) $307.1
($17.5)
$6.4 $23.9 $106.2
($30.5)
Includes ($67.7)
$16.2M for
$239.2 Indiana
Harbor $200.9
SXCP IPO transaction
Q4 2012 Q1 2013 Depreciation, Working Capital VISA SXCP Equity & SXC Debt Other Cash Used Q1 2013
Cash Net Income Depletion & Capital, Deferred Expenditures SunCoke JV Debt Paydown In Financing Cash
Balance Amortization Taxes & Other Offerings Activities Balance
(net of fees) 1
(1) Excludes $6.5 million in offering expenses paid in 2012 and includes $0.7 million of fees related to the amendment of SXC credit facility
Barclays HYBSL—May 2013
25
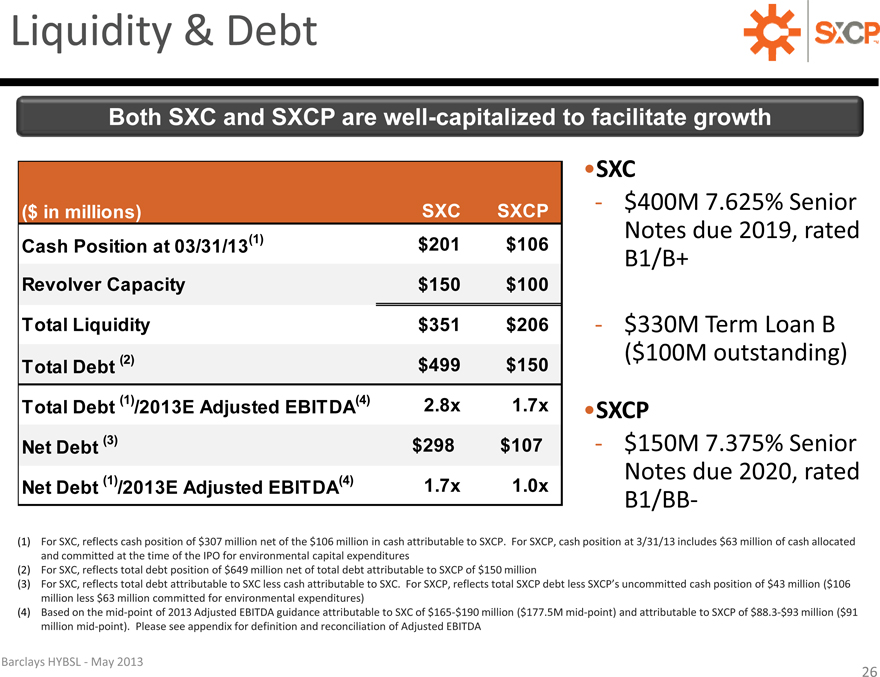
Liquidity & Debt
Both SXC and SXCP are well-capitalized to facilitate growth
SXC
($ in millions) SXC SXCP — $400M 7.625% Senior
Cash Position at 03/31/13(1) $201 $106 Notes due 2019, rated
B1/B+
Revolver Capacity $150 $100
Total Liquidity $351 $206 — $330M Term Loan B
Total Debt (2) $499 $150 ($100M outstanding)
Total Debt (1) /2013E Adjusted EBITDA(4) 2.8x 1.7x SXCP
Net Debt (3) $298 $107 — $150M 7.375% Senior
Net Debt (1) /2013E Adjusted EBITDA(4) 1.7x 1.0x Notes due 2020, rated
B1/BB-
(1) For SXC, reflects cash position of $307 million net of the $106 million in cash attributable to SXCP. For SXCP, cash position at 3/31/13 includes $63 million of cash allocated
and committed at the time of the IPO for environmental capital expenditures
(2) For SXC, reflects total debt position of $649 million net of total debt attributable to SXCP of $150 million
(3) For SXC, reflects total debt attributable to SXC less cash attributable to SXC. For SXCP, reflects total SXCP debt less SXCP’s uncommitted cash position of $43 million ($106
million less $63 million committed for environmental expenditures)
(4) Based on the mid-point of 2013 Adjusted EBITDA guidance attributable to SXC of $165-$190 million ($177.5M mid-point) and attributable to SXCP of $88.3-$93 million ($91
million mid-point). Please see appendix for definition and reconciliation of Adjusted EBITDA
Barclays HYBSL—May 2013
26
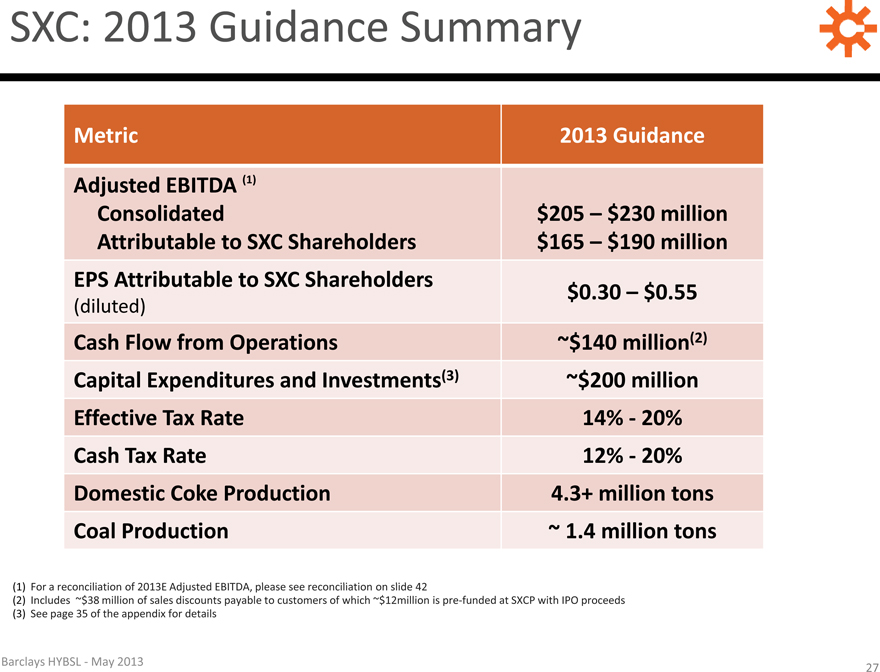
SXC: 2013 Guidance Summary
Metric 2013 Guidance
Adjusted EBITDA (1)
Consolidated $205 – $230 million
Attributable to SXC Shareholders $165 – $190 million
EPS Attributable to SXC Shareholders $0.30 – $0.55
(diluted)
Cash Flow from Operations ~$140 million(2)
Capital Expenditures and Investments(3) ~$200 million
Effective Tax Rate 14%—20%
Cash Tax Rate 12%—20%
Domestic Coke Production 4.3+ million tons
Coal Production ~ 1.4 million tons
(1) For a reconciliation of 2013E Adjusted EBITDA, please see reconciliation on slide 42
(2) Includes ~$38 million of sales discounts payable to customers of which ~$12million is pre-funded at SXCP with IPO proceeds
(3) See page 35 of the appendix for details
Barclays HYBSL—May 2013 27
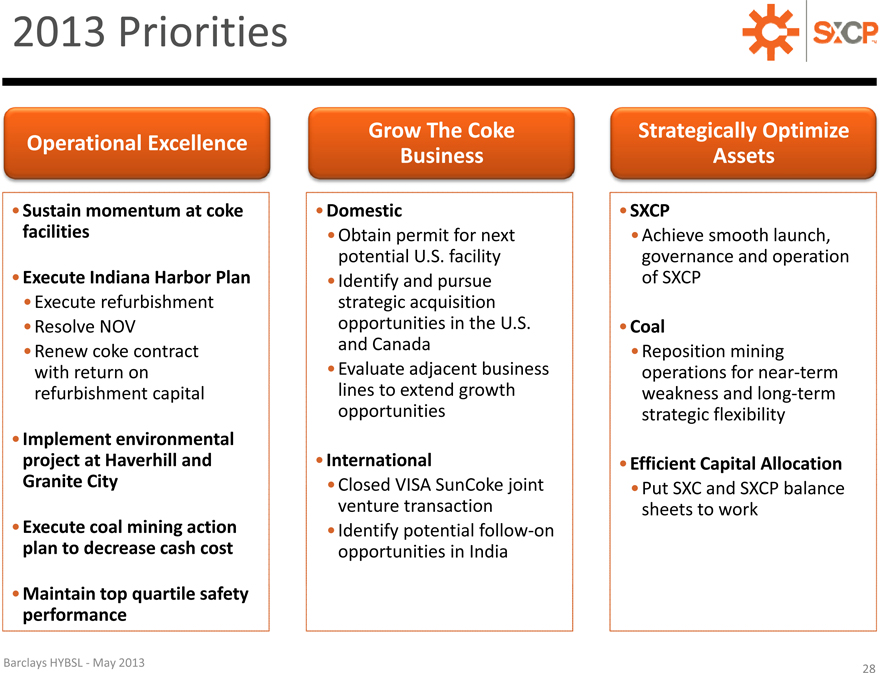
2013 Priorities
Operational Excellence Grow The Coke Strategically Optimize
Business Assets
Sustain momentum at coke Domestic SXCP
facilities Obtain permit for next Achieve smooth launch,
potential U.S. facility governance and operation
Execute Indiana Harbor Plan Identify and pursue of SXCP
Execute refurbishment strategic acquisition
Resolve NOV opportunities in the U.S. Coal
Renew coke contract and Canada Reposition mining
with return on Evaluate adjacent business operations for near-term
refurbishment capital lines to extend growth weakness and long-term
opportunities strategic flexibility
Implement environmental
project at Haverhill and International Efficient Capital Allocation
Granite City Closed VISA SunCoke joint Put SXC and SXCP balance
venture transaction sheets to work
Execute coal mining action Identify potential follow-on
plan to decrease cash cost opportunities in India
Maintain top quartile safety
performance
Barclays HYBSL—May 2013 28

QUESTIONS?

Investor Relations:
630-824-1987
www.suncoke.com
APPENDIX
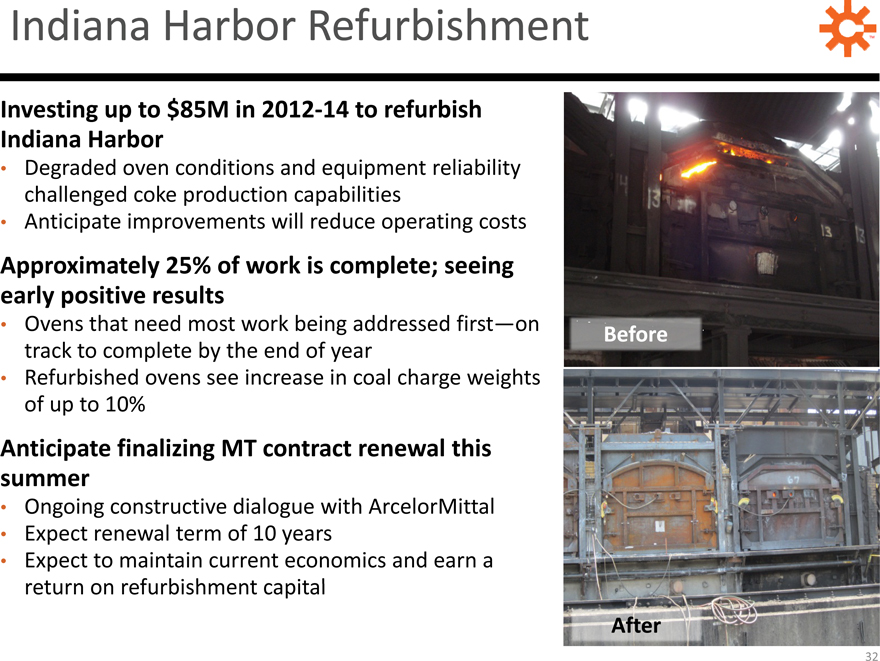
Indiana Harbor Refurbishment TM
Investing up to $85M in 2012-14 to refurbish
Indiana Harbor
Degraded oven conditions and equipment reliability
challenged coke production capabilities
Anticipate improvements will reduce operating costs
Approximately 25% of work is complete; seeing
early positive results
Ovens that need most work being addressed first—on Before
track to complete by the end of year
Refurbished ovens see increase in coal charge weights
of up to 10%
Anticipate finalizing MT contract renewal this
summer
Ongoing constructive dialogue with ArcelorMittal
Expect renewal term of 10 years
Expect to maintain current economics and earn a
return on refurbishment capital
After
32
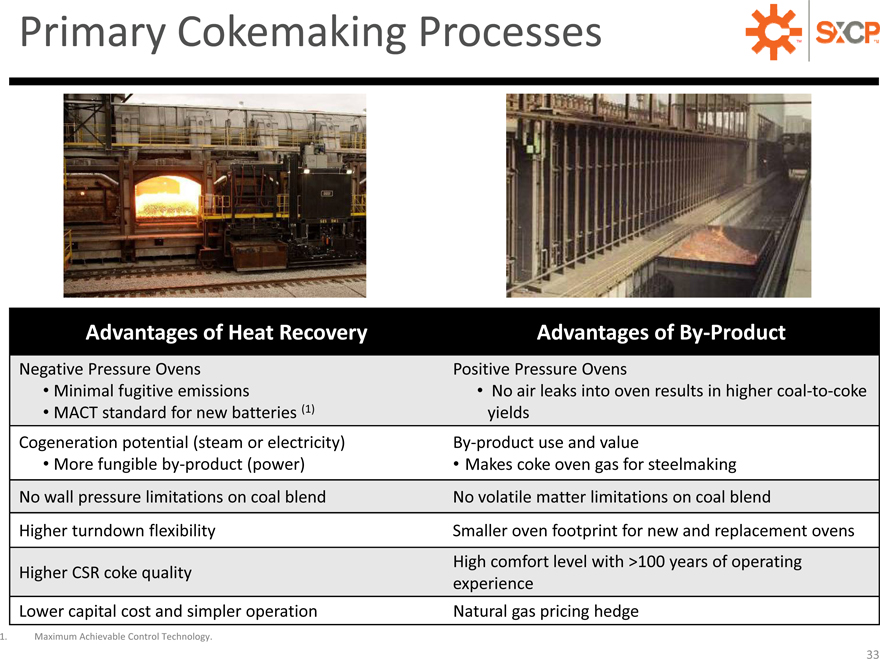
Primary Cokemaking Processes TM
Advantages of Heat Recovery Advantages of By-Product
Negative Pressure Ovens Positive Pressure Ovens
Minimal fugitive emissions No air leaks into oven results in higher coal-to-coke
MACT standard for new batteries (1) yields
Cogeneration potential (steam or electricity) By-product use and value
More fungible by-product (power) Makes coke oven gas for steelmaking
No wall pressure limitations on coal blend No volatile matter limitations on coal blend
Higher turndown flexibility Smaller oven footprint for new and replacement ovens
High comfort level with >100 years of operating
Higher CSR coke quality
experience
Lower capital cost and simpler operation Natural gas pricing hedge
1. Maximum Achievable Control Technology.
33
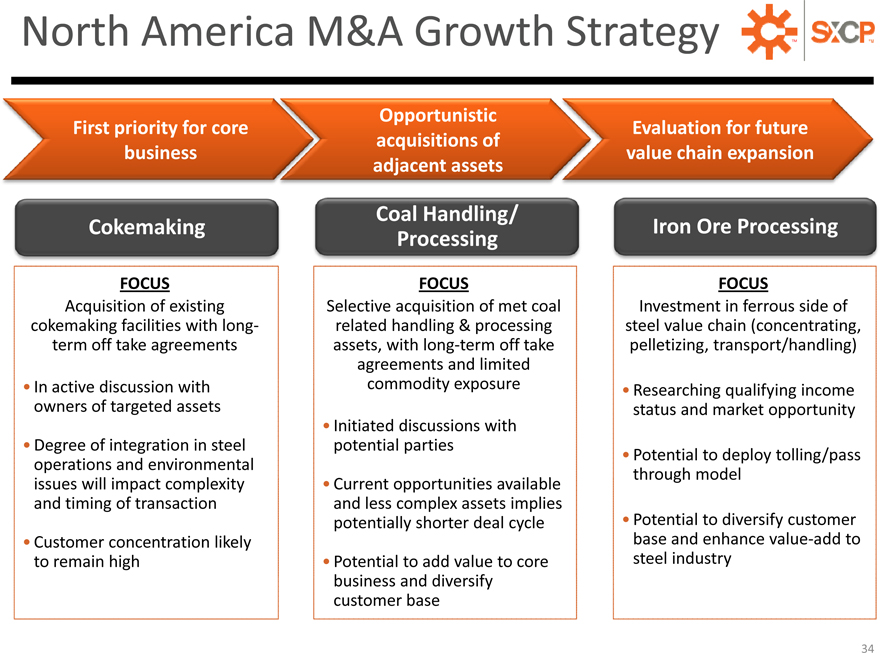
North America M&A Growth Strategy TM
Opportunistic
First priority for core Evaluation for future
acquisitions of
business value chain expansion
adjacent assets
Coal Handling/
Cokemaking Iron Ore Processing
Processing
FOCUS FOCUS FOCUS
Acquisition of existing Selective acquisition of met coal Investment in ferrous side of
cokemaking facilities with long- related handling & processing steel value chain (concentrating,
term off take agreements assets, with long-term off take pelletizing, transport/handling)
agreements and limited
In active discussion with commodity exposure Researching qualifying income
owners of targeted assets status and market opportunity
Initiated discussions with
Degree of integration in steel potential parties
operations and environmental Potential to deploy tolling/pass
issues will impact complexity Current opportunities available through model
and timing of transaction and less complex assets implies
potentially shorter deal cycle Potential to diversify customer
Customer concentration likely base and enhance value-add to
to remain high Potential to add value to core steel industry
business and diversify
customer base
34
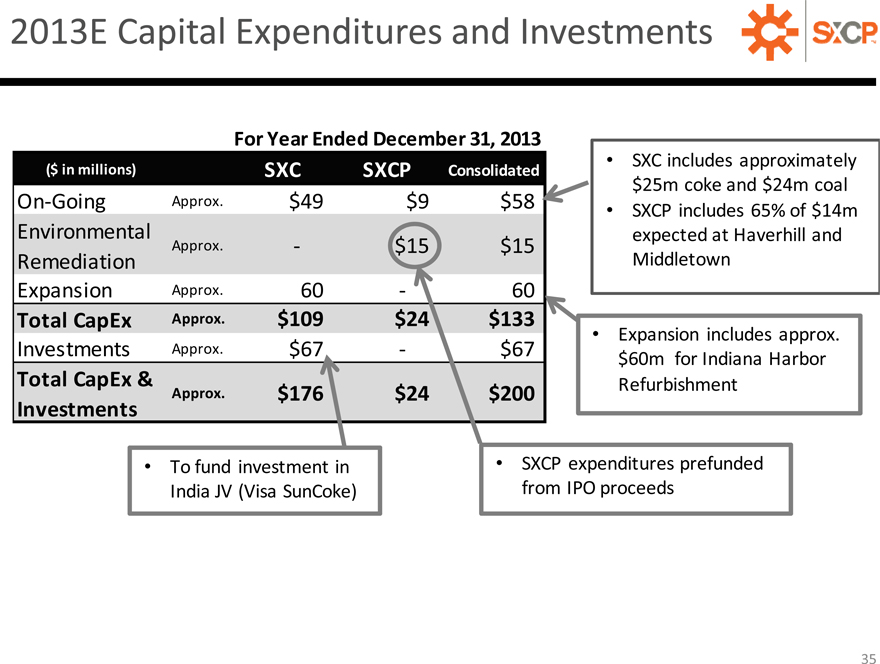
2013E Capital Expenditures and Investments
For Year Ended December 31, 2013
($ in millions) SXC SXCP Consolidated SXC includes approximately
$25m coke and $24m coal
On-Going Approx. $49 $9 $58 SXCP includes 65% of $14m
Environmental expected at Haverhill and
Approx. — $15 $15
Remediation Middletown
Expansion Approx. 60 — 60
Total CapEx Approx. $109 $24 $133 Expansion includes approx.
Investments Approx. $67 — $67 $60m for Indiana Harbor
Total CapEx & Refurbishment
Approx. $176 $24 $200
Investments
To fund investment in SXCP expenditures prefunded
India JV (Visa SunCoke) from IPO proceeds
35
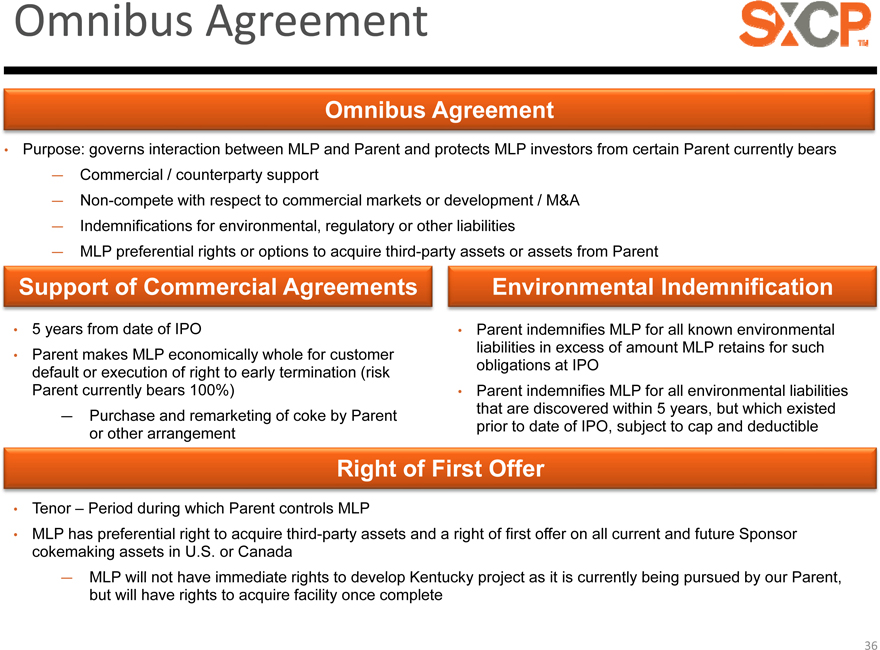
Omnibus Agreement
Omnibus Agreement
Purpose: governs interaction between MLP and Parent and protects MLP investors from certain Parent currently bears
— Commercial / counterparty support
— Non-compete with respect to commercial markets or development / M&A
— Indemnifications for environmental, regulatory or other liabilities
— MLP preferential rights or options to acquire third-party assets or assets from Parent
Support of Commercial Agreements Environmental Indemnification
5 years from date of IPO Parent indemnifies MLP for all known environmental
Parent makes MLP economically whole for customer liabilities in excess of amount MLP retains for such
default or execution of right to early termination (risk obligations at IPO
Parent currently bears 100%) Parent indemnifies MLP for all environmental liabilities
— Purchase and remarketing of coke by Parent that are discovered within 5 years, but which existed
or other arrangement prior to date of IPO, subject to cap and deductible
Right of First Offer
Tenor – Period during which Parent controls MLP
MLP has preferential right to acquire third-party assets and a right of first offer on all current and future Sponsor
cokemaking assets in U.S. or Canada
— MLP will not have immediate rights to develop Kentucky project as it is currently being pursued by our Parent,
but will have rights to acquire facility once complete
36
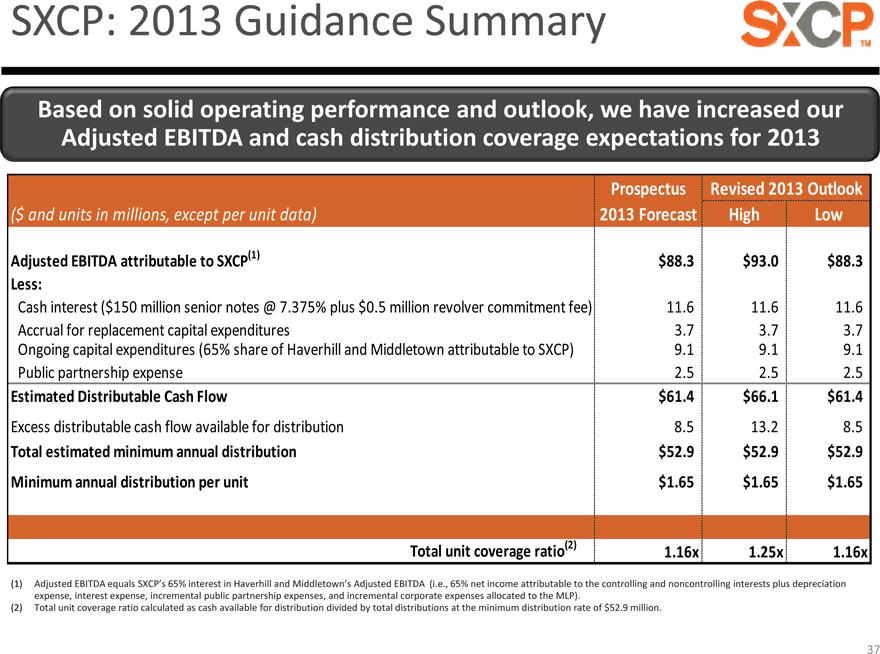
SXCP: 2013 Guidance Summary
Based on solid operating performance and outlook, we have increased our
Adjusted EBITDA and cash distribution coverage expectations for 2013
Prospectus Revised 2013 Outlook
($ and units in millions, except per unit data) 2013 Forecast High Low
Adjusted EBITDA attributable to SXCP(1) $88.3 $ 93.0 $ 88.3
Less:
Cash interest ($150 million senior notes @ 7.375% plus $0.5 million revolver commitment fee) 11.6 11.6 11.6
Accrual for replacement capital expenditures 3.7 3.7 3.7
Ongoing capital expenditures (65% share of Haverhill and Middletown attributable to SXCP) 9.1 9.1 9.1
Public partnership expense 2.5 2.5 2.5
Estimated Distributable Cash Flow $61.4 $ 66.1 $ 61.4
Excess distributable cash flow available for distribution 8.5 13.2 8.5
Total estimated minimum annual distribution $52.9 $ 52.9 $ 52.9
Minimum annual distribution per unit $1.65 $ 1.65 $ 1.65
Total unit coverage ratio(2) 1.16x 1.25x 1.16x
(1) Adjusted EBITDA equals SXCP’s 65% interest in Haverhill and Middletown’s Adjusted EBITDA (i.e., 65% net income attributable to the controlling and noncontrolling interests plus depreciation
expense, interest expense, incremental public partnership expenses, and incremental corporate expenses allocated to the MLP).
(2) Total unit coverage ratio calculated as cash available for distribution divided by total distributions at the minimum distribution rate of $52.9 million.
37
DEFINITIONS AND RECONCILIATIONS
Definitions
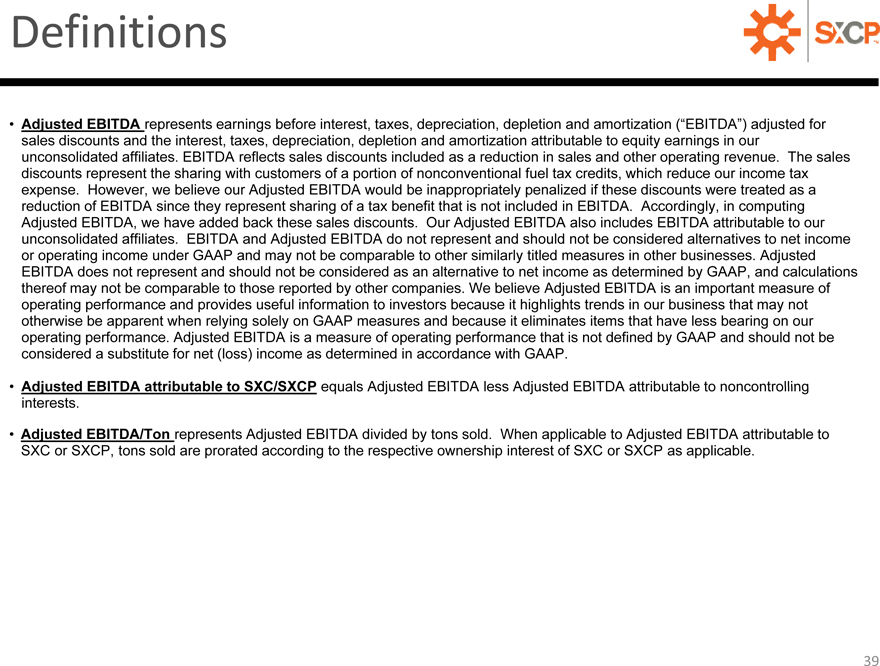
Adjusted EBITDA represents earnings before interest, taxes, depreciation, depletion and amortization (“EBITDA”) adjusted for
sales discounts and the interest, taxes, depreciation, depletion and amortization attributable to equity earnings in our
unconsolidated affiliates. EBITDA reflects sales discounts included as a reduction in sales and other operating revenue. The sales
discounts represent the sharing with customers of a portion of nonconventional fuel tax credits, which reduce our income tax
expense. However, we believe our Adjusted EBITDA would be inappropriately penalized if these discounts were treated as a
reduction of EBITDA since they represent sharing of a tax benefit that is not included in EBITDA. Accordingly, in computing
Adjusted EBITDA, we have added back these sales discounts. Our Adjusted EBITDA also includes EBITDA attributable to our
unconsolidated affiliates. EBITDA and Adjusted EBITDA do not represent and should not be considered alternatives to net income
or operating income under GAAP and may not be comparable to other similarly titled measures in other businesses. Adjusted
EBITDA does not represent and should not be considered as an alternative to net income as determined by GAAP, and calculations
thereof may not be comparable to those reported by other companies. We believe Adjusted EBITDA is an important measure of
operating performance and provides useful information to investors because it highlights trends in our business that may not
otherwise be apparent when relying solely on GAAP measures and because it eliminates items that have less bearing on our
operating performance. Adjusted EBITDA is a measure of operating performance that is not defined by GAAP and should not be
considered a substitute for net (loss) income as determined in accordance with GAAP.
Adjusted EBITDA attributable to SXC/SXCP equals Adjusted EBITDA less Adjusted EBITDA attributable to noncontrolling
interests.
Adjusted EBITDA/Ton represents Adjusted EBITDA divided by tons sold. When applicable to Adjusted EBITDA attributable to
SXC or SXCP, tons sold are prorated according to the respective ownership interest of SXC or SXCP as applicable.
39
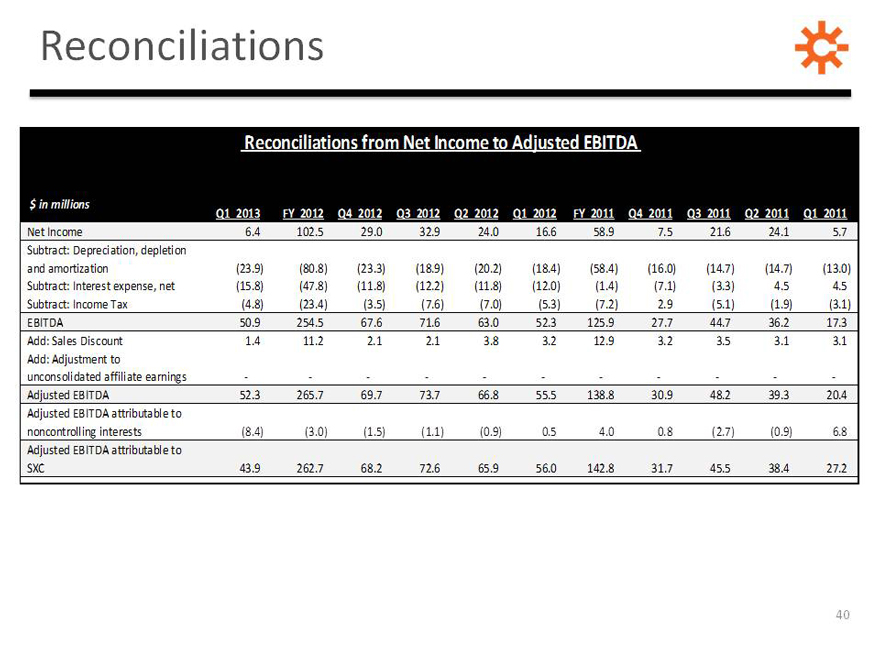
Reconciliations
Reconciliations from Net Income to Adjusted EBITDA
$ in millions
Q1 2013 FY 2012 Q4 2012 Q3 2012 Q2 2012 Q1 2012 FY 2011 Q4 2011 Q3 2011 Q2 2011 Q1 2011
Net Income 6.4 102.5 29.0 32.9 24.0 16.6 58.9 7.5 21.6 24.1 5.7
Subtract: Depreciation, depletion
and amortization (23.9) (80.8) (23.3) (18.9) (20.2) (18.4) (58.4) (16.0) (14.7) (14.7) (13.0)
Subtract: Interest expense, net (15.8) (47.8) (11.8) (12.2) (11.8) (12.0) (1.4) (7.1) (3.3) 4.5 4.5
Subtract: Income Tax (4.8) (23.4) (3.5) (7.6) (7.0) (5.3) (7.2) 2.9 (5.1) (1.9) (3.1)
EBITDA 50.9 254.5 67.6 71.6 63.0 52.3 125.9 27.7 44.7 36.2 17.3
Add: Sales Discount 1.4 11.2 2.1 2.1 3.8 3.2 12.9 3.2 3.5 3.1 3.1
Add: Adjustment to
unconsolidated affiliate earnings
Adjusted EBITDA 52.3 265.7 69.7 73.7 66.8 55.5 138.8 30.9 48.2 39.3 20.4
Adjusted EBITDA attributable to
noncontrolling interests (8.4) (3.0) (1.5) (1.1) (0.9) 0.5 4.0 0.8 (2.7) (0.9) 6.8
Adjusted EBITDA attributable to
SXC 43.9 262.7 68.2 72.6 65.9 56.0 142.8 31.7 45.5 38.4 27.2
40

Reconciliations
Reconciliations of Segment Adjusted EBITDA and Adjusted EBITDA Per Ton
Domestic International Jewell
$ in millions, except per ton data Coke Coke Coal Corporate Combined
Q1 2013
Adjusted EBITDA 61.1 1.6 (4.6) (5.8) 52.3
Sales Volume (thousands of tons) 1,058 216 373
Adjusted EBITDA per Ton 57.8 7.41 (12.3)
FY 2012
Adjusted EBITDA 249.4 11.9 33.4 (29.0) 265.7
Sales Volume (thousands of tons) 4,345 1,209 1,500
Adjusted EBITDA per Ton 57.4 9.8 22.3
Q4 2012
Adjusted EBITDA 62.4 10.2 6.0 (8.9) 69.7
Sales Volume (thousands of tons) 1,077 239 370
Adjusted EBITDA per Ton 57.9 42.7 16.2
Q3 2012
Adjusted EBITDA 69.8 0.9 10.7 (7.7) 73.7
Sales Volume (thousands of tons) 1,116 310 392
Adjusted EBITDA per Ton 62.5 2.9 27.3
Q2 2012
Adjusted EBITDA 62.4 0.7 9.3 (5.6) 66.8
Sales Volume (thousands of tons) 1,074 302 365
Adjusted EBITDA per Ton 58.1 2.3 25.5
Q1 2012
Adjusted EBITDA 54.8 0.1 7.4 (6.8) 55.5
Sales Volume (thousands of tons) 1,078 358 373
Adjusted EBITDA per Ton 50.8 0.3 19.8
41
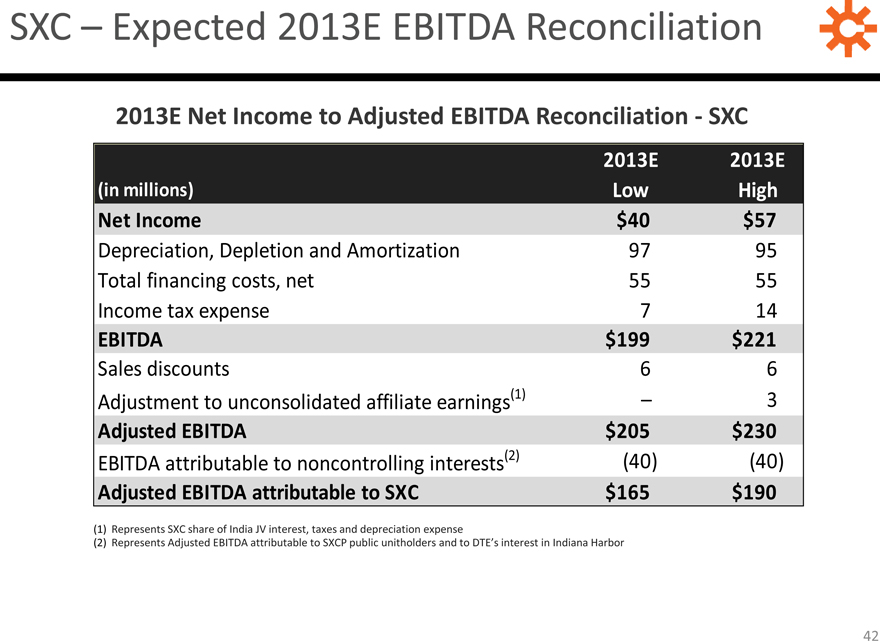
SXC – Expected 2013E EBITDA
Reconciliation
2013E Net Income to Adjusted EBITDA Reconciliation—SXC
2013E 2013E
(in millions) Low High
Net Income $40 $57
Depreciation, Depletion and Amortization 97 95
Total financing costs, net 55 55
Income tax expense 7 14
EBITDA $199 $221
Sales discounts 6 6
Adjustment to unconsolidated affiliate earnings(1) – 3
Adjusted EBITDA $205 $230
EBITDA attributable to noncontrolling interests(2) (40) (40)
Adjusted EBITDA attributable to SXC $165 $190
(1) Represents SXC share of India JV interest, taxes and depreciation expense
(2) Represents Adjusted EBITDA attributable to SXCP public unitholders and to DTE’s interest in Indiana Harbor
42
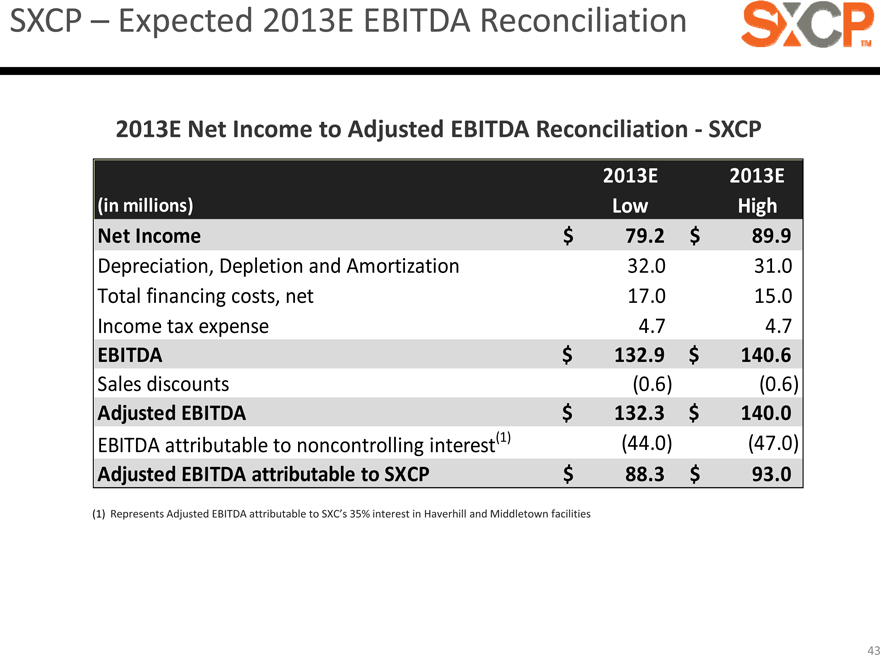
SXCP – Expected 2013E EBITDA Reconciliation
2013E Net Income to Adjusted EBITDA Reconciliation—SXCP
2013E 2013E
(in millions) Low High
Net Income $ 79.2 $ 89.9
Depreciation, Depletion and Amortization 32.0 31.0
Total financing costs, net 17.0 15.0
Income tax expense 4.7 4.7
EBITDA $ 132.9 $ 140.6
Sales discounts (0.6) (0.6)
Adjusted EBITDA $ 132.3 $ 140.0
EBITDA attributable to noncontrolling interest(1) (44.0) (47.0)
Adjusted EBITDA attributable to SXCP $ 88.3 $ 93.0
(1) Represents Adjusted EBITDA attributable to SXC’s 35% interest in Haverhill and Middletown facilities
43
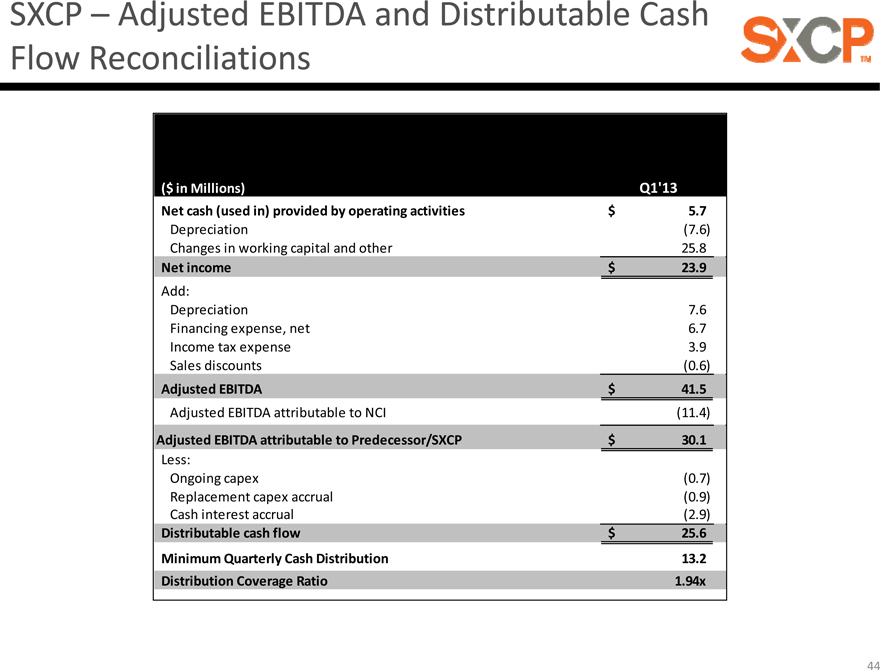
SXCP – Adjusted EBITDA and Distributable Cash
Flow Reconciliations
($ in Millions) Q1’13
Net cash (used in) provided by operating activities $ 5.7
Depreciation (7.6)
Changes in working capital and other 25.8
Net income $ 23.9
Add:
Depreciation 7.6
Financing expense, net 6.7
Income tax expense 3.9
Sales discounts (0.6)
Adjusted EBITDA $ 41.5
Adjusted EBITDA attributable to NCI (11.4)
Adjusted EBITDA attributable to Predecessor/SXCP $ 30.1
Less:
Ongoing capex (0.7)
Replacement capex accrual (0.9)
Cash interest accrual (2.9)
Distributable cash flow $ 25.6
Minimum Quarterly Cash Distribution 13.2
Distribution Coverage Ratio 1.94x
44