Exhibit 99.1
KeyBanc Basic
Materials &
Packaging
Conference
September 10, 2013
Forward-Looking Statements
Some of the information included in this presentation constitutes “forward-looking statements” as defined in Section 27A of the Securities Act of 1933, as amended and Section 21E of the Securities Exchange Act of 1934, as amended. All statements in this presentation that express opinions, expectations, beliefs, plans, objectives, assumptions or projections with respect to anticipated future performance of SunCoke Energy,
Inc. (“SunCoke”) or SunCoke Energy Partners, L.P. (“Partnership”), in contrast with statements of historical facts, are forward-looking statements. Such forward-looking statements are based on management’s beliefs and assumptions and on information currently available.
Forward-looking statements include information concerning possible or assumed future results of operations, business strategies, financing plans, competitive position, potential growth opportunities, potential operating performance improvements, the effects of competition and the effects of future legislation or regulations. Forward-looking statements include all statements that are not historical facts and may be identified by the use of forward-looking terminology such as the words “believe,” “expect,” “plan,” “intend,” “anticipate,” “estimate,” “predict,” “potential,” “continue,” “may,” “will,” “should” or the negative of these terms or similar expressions.
Although management believes that its plans, intentions and expectations reflected in or suggested by the forward-looking statements made in this presentation are reasonable, no assurance can be given that these plans, intentions or expectations will be achieved when anticipated or at all. Moreover, such statements are subject to a number of assumptions, risks and uncertainties. Many of these risks are beyond the control of SunCoke and the Partnership, and may cause actual results to differ materially from those implied or expressed by the forward-looking statements. Each of SunCoke and the Partnership has included in its filings with the Securities and Exchange Commission (including, in the case of the Partnership, its Form S-1) cautionary language identifying important factors (but not necessarily all the important factors) that could cause actual results to differ materially from those expressed in any forward-looking statement. For more information concerning these factors, see the Securities and Exchange Commission filings of SunCoke and the Partnership. All forward-looking statements included in this presentation are expressly qualified in their entirety by such cautionary statements. Although forward-looking statements are based on current beliefs and expectations, caution should be taken not to place undue reliance on any such forward-looking statements because such statements speak only as of the date hereof. Neither SunCoke nor the Partnership has any intention or obligation to update publicly any forward-looking statement (or its associated cautionary language) whether as a result of new information or future events or after the date of this presentation, except as required by applicable law.
This presentation includes certain non-GAAP financial measures intended to supplement, not substitute for, comparable GAAP measures. Reconciliations of non-GAAP financial measures to GAAP financial measures are provided in the Appendix at the end of the presentation. Investors are urged to consider carefully the comparable GAAP measures and the reconciliations to those measures provided in the Appendix.
KeyBanc Basic Materials & Packaging Conference 2
ABOUT SUNCOKE
SunCoke EnergyTM
KeyBanc Basic Materials & Packaging Conference 3
About SunCoke
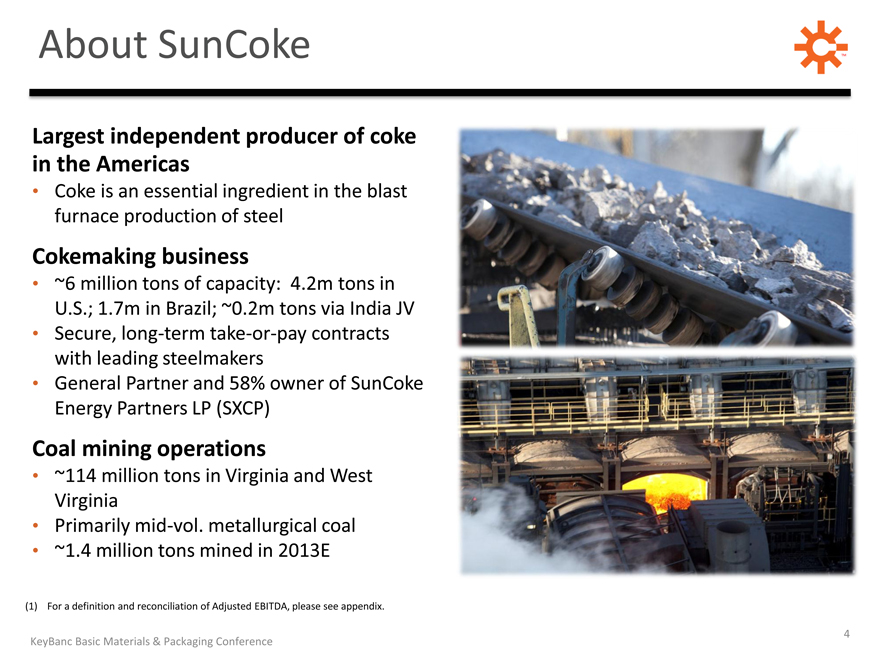
Largest independent producer of coke in the Americas
Coke is an essential ingredient in the blast furnace production of steel
Cokemaking business
~6 million tons of capacity: 4.2m tons in U.S.; 1.7m in Brazil; ~0.2m tons via India JV
Secure, long-term take-or-pay contracts with leading steelmakers
General Partner and 58% owner of SunCoke Energy Partners LP (SXCP)
Coal mining operations
~114 million tons in Virginia and West Virginia
Primarily mid-vol. metallurgical coal
~1.4 million tons mined in 2013E
(1) | | For a definition and reconciliation of Adjusted EBITDA, please see appendix. |
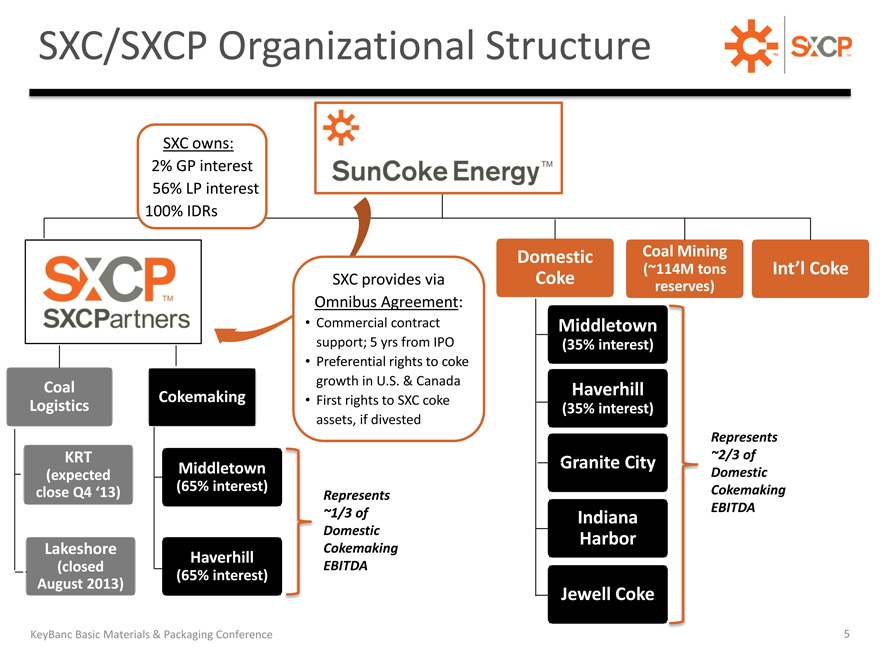
SXC/SXCP Organizational Structure
SXC owns:
2% GP interest 56% LP interest 100% IDRs
Coal Logistics
KRT
(expected close Q4 ‘13)
Lakeshore
(closed August 2013)
Cokemaking
Middletown
(65% interest)
Haverhill
(65% interest)
SXC provides via Omnibus Agreement:
Commercial contract support; 5 yrs from IPO
Preferential rights to coke growth in U.S. & Canada
First rights to SXC coke assets, if divested
Represents
~1/3 of
Domestic Cokemaking EBITDA
Domestic Coal Mining
(~114M tons Int’l Coke
Coke
reserves)
Middletown
(35% interest)
Haverhill
(35% interest)
Represents
Granite City ~2/3 of
Domestic
Cokemaking
EBITDA
Indiana
Harbor
Jewell Coke
KeyBanc Basic Materials & Packaging Conference 5
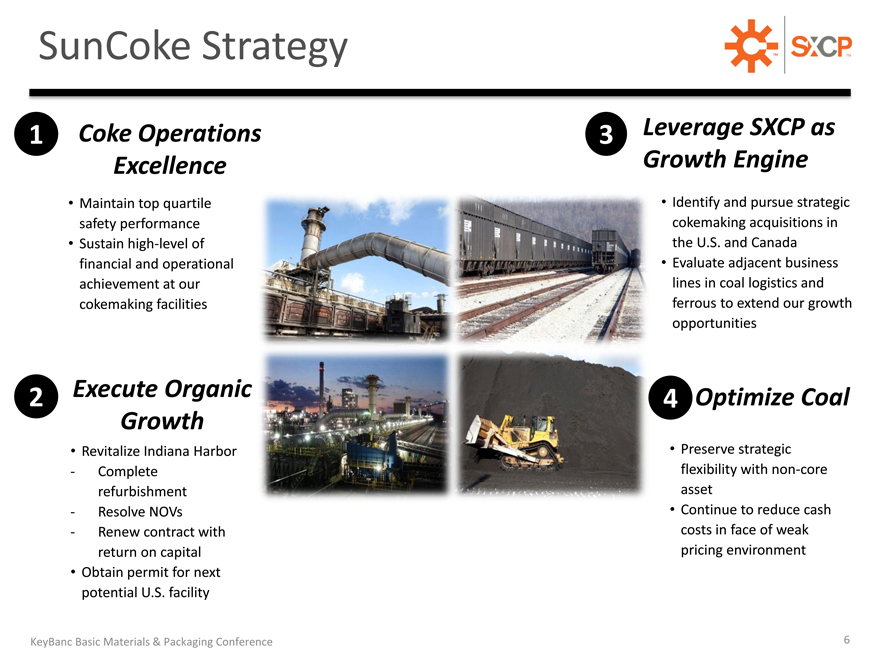
SunCoke Strategy
1 | | Coke Operations Excellence |
Maintain top quartile safety performance
Sustain high-level of financial and operational achievement at our cokemaking facilities
Revitalize Indiana Harbor
- Complete refurbishment
- Resolve NOVs
- Renew contract with return on capital
Obtain permit for next potential U.S. facility
3 | | Leverage SXCP as Growth Engine |
Identify and pursue strategic cokemaking acquisitions in the U.S. and Canada
Evaluate adjacent business lines in coal logistics and ferrous to extend our growth opportunities
Preserve strategic flexibility with non-core asset
Continue to reduce cash costs in face of weak pricing environment
KeyBanc Basic Materials & Packaging Conference 6

OUR MARKET OPPORTUNITY
SunCoke EnergyTM
KeyBanc Basic Materials & Packaging Conference 7
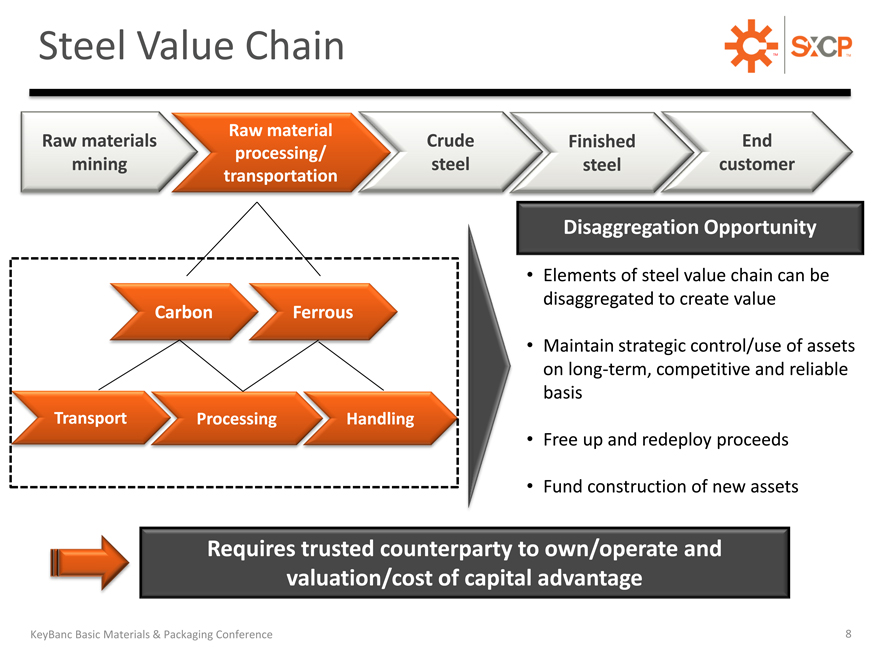
Steel Value Chain
Raw material
Raw materials Crude Finished End processing/ mining steel steel customer transportation
Carbon Ferrous
Transport Processing Handling
Disaggregation Opportunity
Elements of steel value chain can be disaggregated to create value
Maintain strategic control/use of assets on long-term, competitive and reliable basis
Free up and redeploy proceeds
Fund construction of new assets
Requires trusted counterparty to own/operate and valuation/cost of capital advantage
KeyBanc Basic Materials & Packaging Conference 8
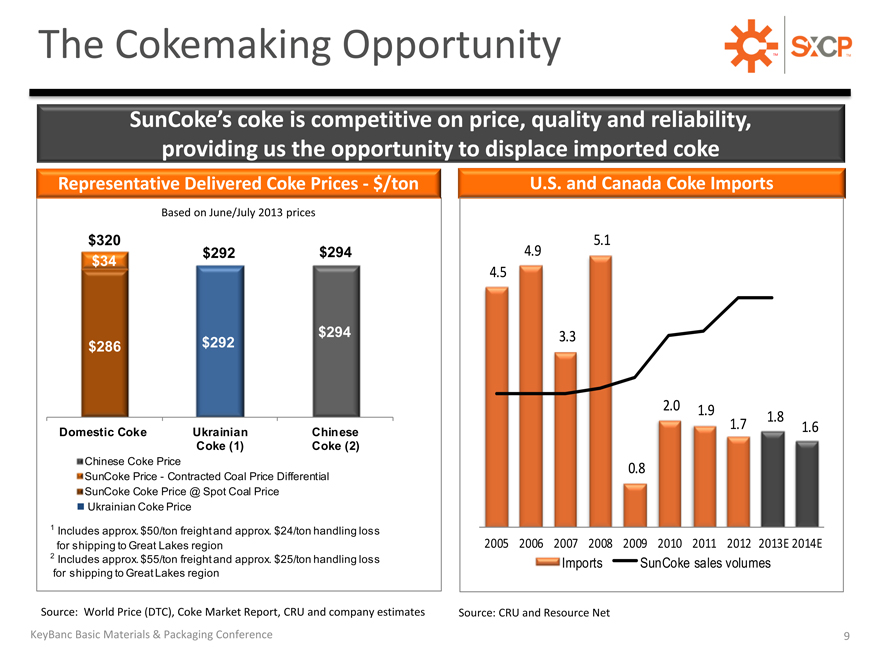
The Cokemaking Opportunity
SunCoke’s coke is competitive on price, quality and reliability, providing us the opportunity to displace imported coke
Representative Delivered Coke Prices—$/ton
Based on June/July 2013 prices
$320
$292 $294
$34
$294
$286 $292
U.S. and Canada Coke Imports
5.1
4.9
4.5
3.3
2.0 1.9
1.8
1.7 1.6
0.8
2005 2006 2007 2008 2009 2010 2011 2012 2013E 2014E
Imports SunCoke sales volumes
Source: World Price (DTC), Coke Market Report, CRU and company estimates Source: CRU and Resource Net
KeyBanc Basic Materials & Packaging Conference 9
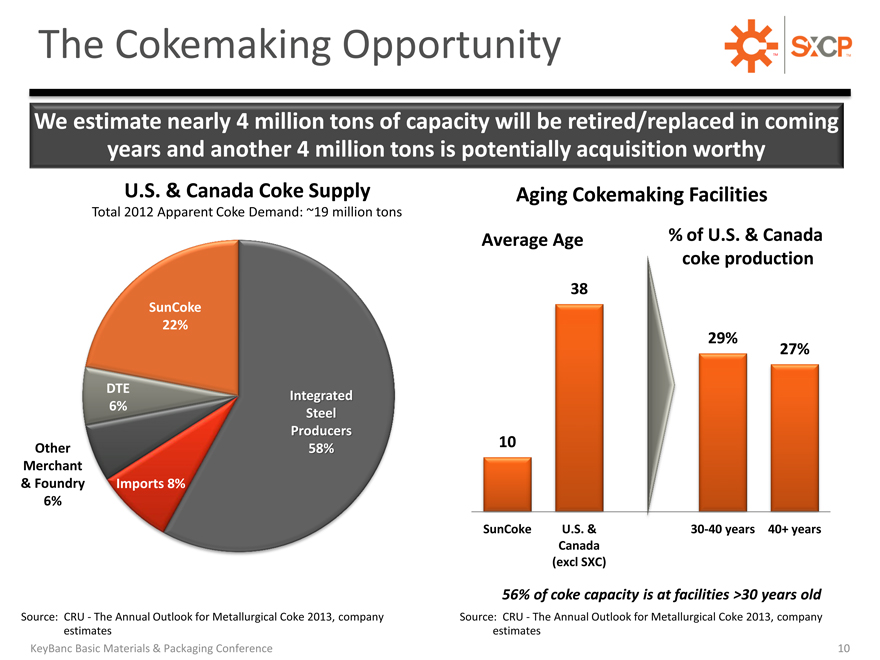
The Cokemaking Opportunity
We estimate nearly 4 million tons of capacity will be retired/replaced in coming years and another 4 million tons is potentially acquisition worthy
U.S. & Canada Coke Supply
Total 2012 Apparent Coke Demand: ~19 million tons
SunCoke
22%
DTE Integrated
6% Steel
Producers
58%
Imports 8%
Other Merchant
& Foundry 6%
Aging Cokemaking Facilities
Average Age
% of U.S. & Canada
coke production
38
29%
27%
10
SunCoke U.S. & 30-40 years 40+ years
Canada
(excl SXC)
56% of coke capacity is at facilities >30 years old
Source: CRU—The Annual Outlook for Metallurgical Coke 2013, company Source: CRU—The Annual Outlook for Metallurgical Coke 2013, company estimates estimates KeyBanc Basic Materials & Packaging Conference 10
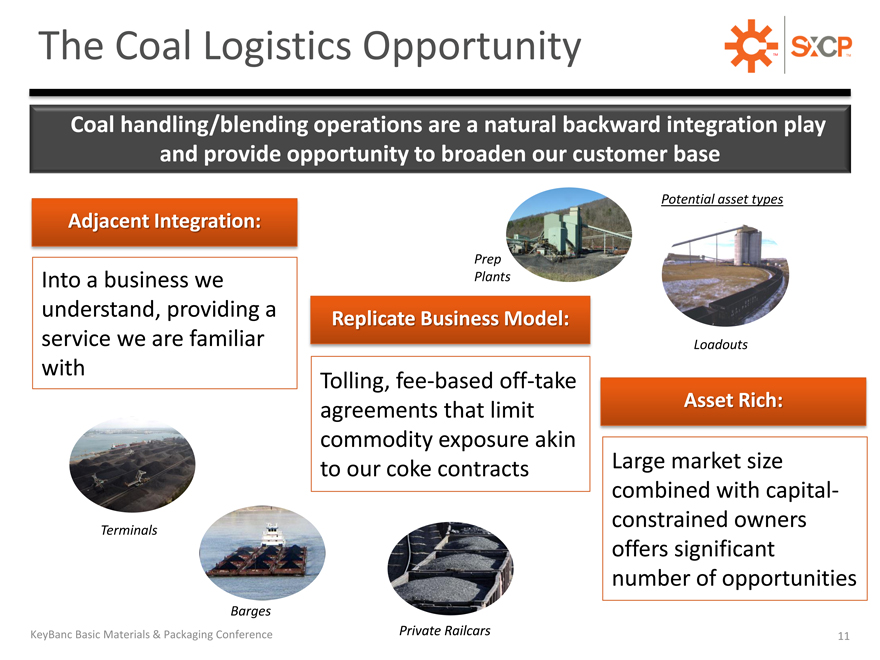
The Coal Logistics Opportunity
Coal handling/blending operations are a natural backward integration play and provide opportunity to broaden our customer base
Adjacent Integration:
Into a business we understand, providing a service we are familiar with
Replicate Business Model:
Tolling, fee-based off-take agreements that limit commodity exposure akin to our coke contracts
Asset Rich:
Large market size combined with capital-constrained owners offers significant number of opportunities
Prep Plants
Potential asset types
Loadouts
Terminals
Barges
Private Railcars
KeyBanc Basic Materials & Packaging Conference
11
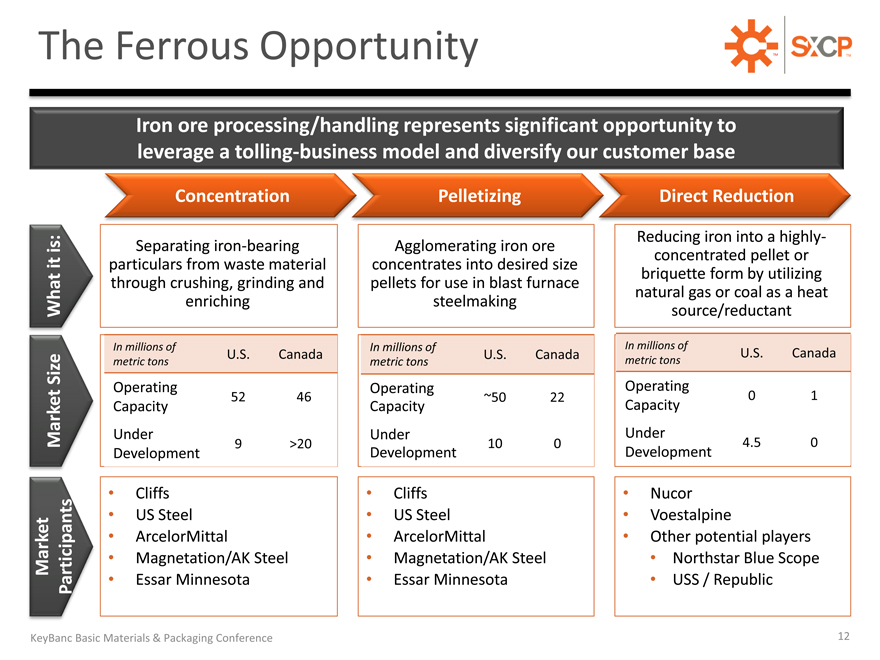
The Ferrous Opportunity
Iron ore processing/handling represents significant opportunity to leverage a tolling-business model and diversify our customer base
Concentration Pelletizing Direct Reduction
Market
Market Size What it is: Participants
Separating iron-bearing particulars from waste material through crushing, grinding and enriching
In millions of
U.S. Canada
metric tons
Operating
52 46
Capacity
Under
9 >20
Development
Cliffs
US Steel
ArcelorMittal
Magnetation/AK Steel
Essar Minnesota
Agglomerating iron ore concentrates into desired size pellets for use in blast furnace steelmaking
In millions of
U.S. Canada metric tons
Operating
~50 22
Capacity
Under
10 0
Development
Cliffs
US Steel
ArcelorMittal
Magnetation/AK Steel
Essar Minnesota
Reducing iron into a highly-concentrated pellet or briquette form by utilizing natural gas or coal as a heat source/reductant
In millions of
U.S. Canada
metric tons
Operating
0 1
Capacity
Under
4.5 0
Development
Nucor
Voestalpine
Other potential players
Northstar Blue Scope
USS / Republic
KeyBanc Basic Materials & Packaging Conference 12
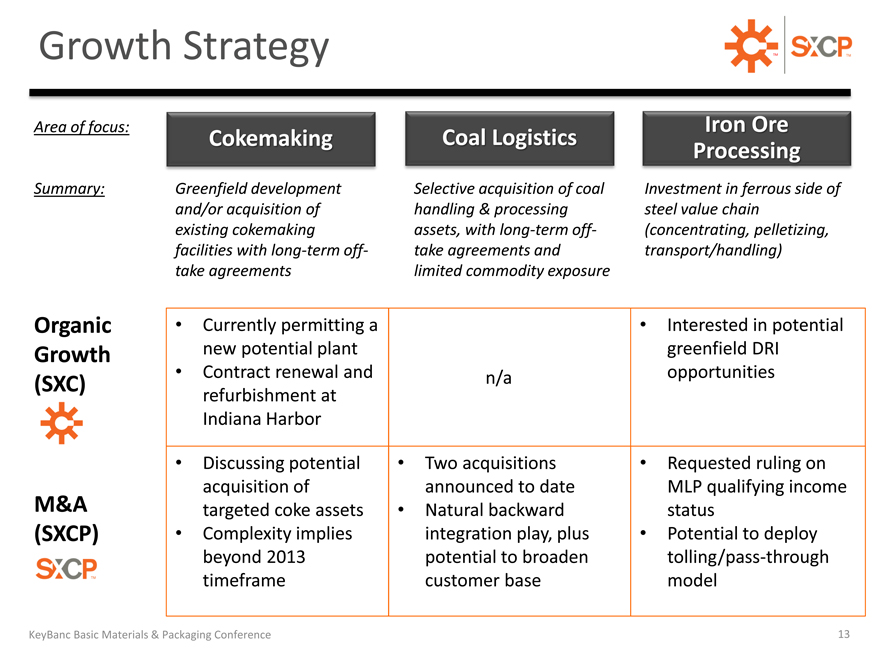
Growth Strategy
Area of focus:
Summary:
Cokemaking
Greenfield development and/or acquisition of existing cokemaking facilities with long-term off-take agreements
Coal Logistics
Selective acquisition of coal handling & processing assets, with long-term off-take agreements and limited commodity exposure
Iron Ore Processin
Investment in ferrous side of steel value chain (concentrating, pelletizing, transport/handling)
Organic Growth (SXC)
M&A (SXCP)
Currently permitting a Interested in potential
new potential plant greenfield DRI
Contract renewal and n/a opportunities
refurbishment at
Indiana Harbor
Discussing potential Two acquisitions Requested ruling on
acquisition of announced to date MLP qualifying income
targeted coke assets Natural backward status
Complexity implies integration play, plus Potential to deploy
beyond 2013 potential to broaden tolling/pass-through
timeframe customer base model
4 | | KeKeyBanc Basic Materials & Packaging Conference 13 |
SXC HIGHLIGHTS AND OUTLOOK
KeyBanc Basic Materials & Packaging Conference
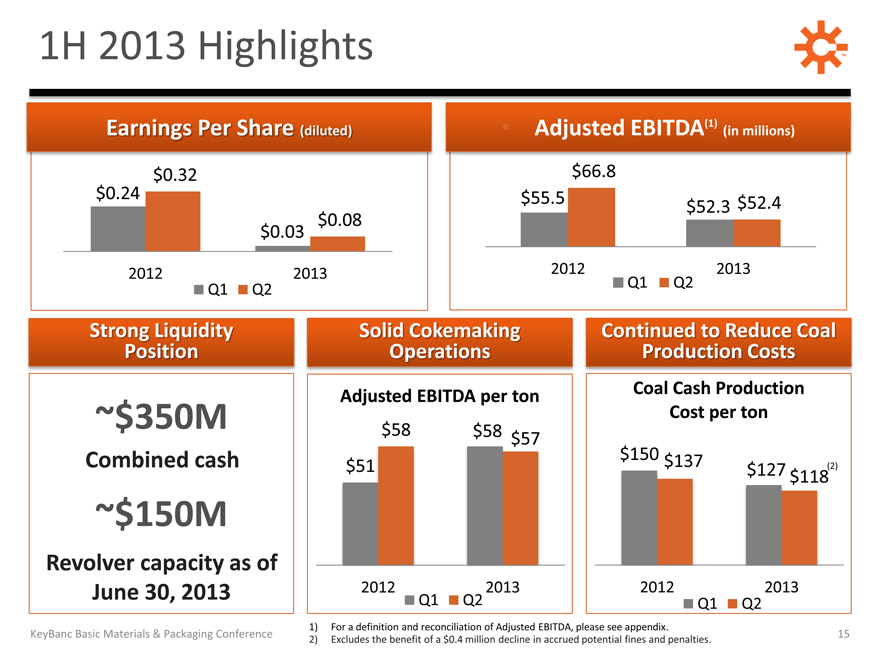
1H 2013 Highlights
Earnings Per Share (diluted)
$0.32 $0.24 $0.08 $0.03
2012 2013 Q1 Q2
Adjusted EBITDA(1)
(in millions)
$66.8 $55.5 $52.4 $52.3
2012 2013 Q1 Q2
Strong Liquidity Position
~$350M
Combined cash
~$150M
Revolver capacity as of June 30, 2013
Solid Cokemaking Operations
Adjusted EBITDA per ton
$58 $58 $57 $51
2012 Q1 Q2 2013
Continued to Reduce Coal Production Costs
Coal Cash Production Cost per ton
$150 $137 $127 (2) $118
2012 2013 Q1 Q2
1) For a definition and reconciliation of Adjusted EBITDA, please see appendix.
KeyBanc Basic Materials & Packaging Conference 15
2) Excludes the benefit of a $0.4 million decline in accrued potential fines and penalties.
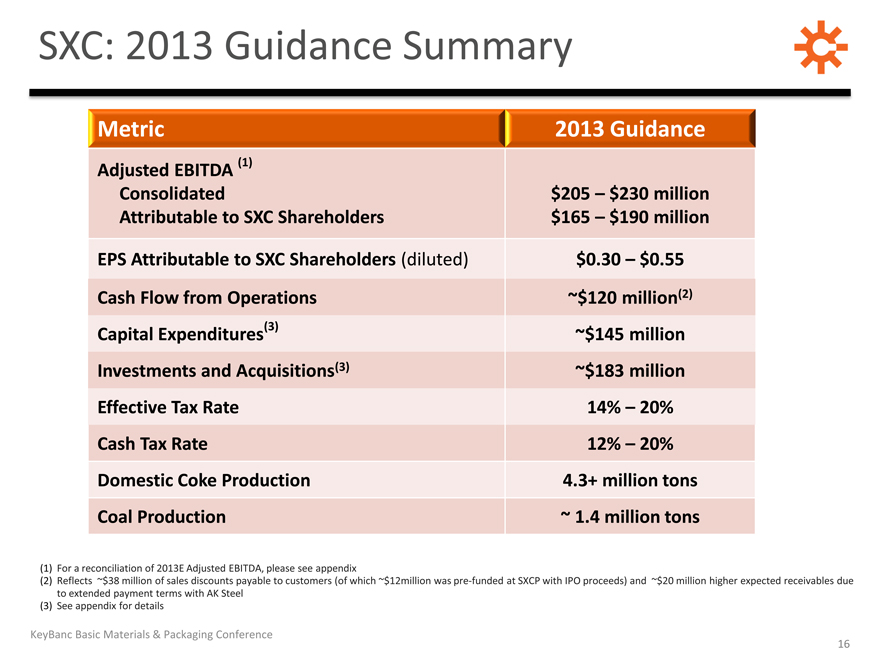
SXC: 2013 Guidance Summary
Metric 2013 Guidance
Adjusted EBITDA (1)
Consolidated $205 – $230 million
Attributable to SXC Shareholders $165 – $190 million
EPS Attributable to SXC Shareholders (diluted) $0.30 – $0.55
Cash Flow from Operations ~$120 million(2)
Capital Expenditures(3) ~$145 million
Investments and Acquisitions(3) ~$183 million
Effective Tax Rate 14% – 20%
Cash Tax Rate 12% – 20%
Domestic Coke Production 4.3+ million tons
Coal Production ~ 1.4 million tons
(1) | | For a reconciliation of 2013E Adjusted EBITDA, please see appendix |
(2) Reflects ~$38 million of sales discounts payable to customers (of which ~$12million was pre-funded at SXCP with IPO proceeds) and ~$20 million higher expected receivables due to extended payment terms with AK Steel (3) See appendix for details
KeyBanc Basic Materials & Packaging Conference 16
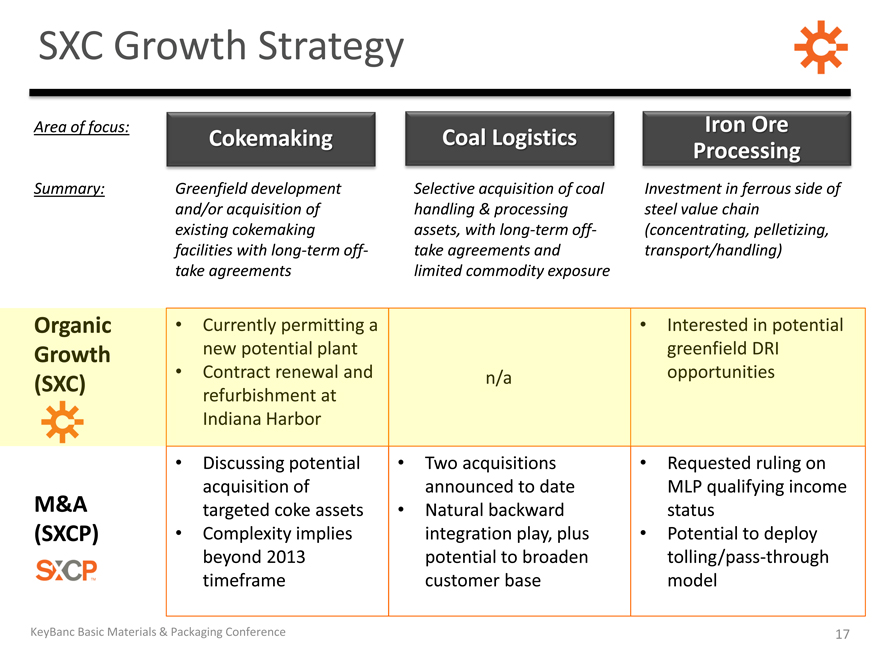
SXC Growth Strategy
Area of focus:
Summary:
Cokemaking
Greenfield development and/or acquisition of existing cokemaking facilities with long-term off-take agreements
Coal Logistics
Selective acquisition of coal handling & processing assets, with long-term off-take agreements and limited commodity exposure
Iron Ore Processin
Investment in ferrous side of steel value chain (concentrating, pelletizing, transport/handling)
Discussing potential Two acquisitions Requested ruling on
acquisition of announced to date MLP qualifying income
M&A targeted coke assets Natural backward status
(SXCP) Complexity implies integration play, plus Potential to deploy
beyond 2013 potential to broaden tolling/pass-through
timeframe customer base model
KeyBanc Basic Materials & Packaging Conference 17
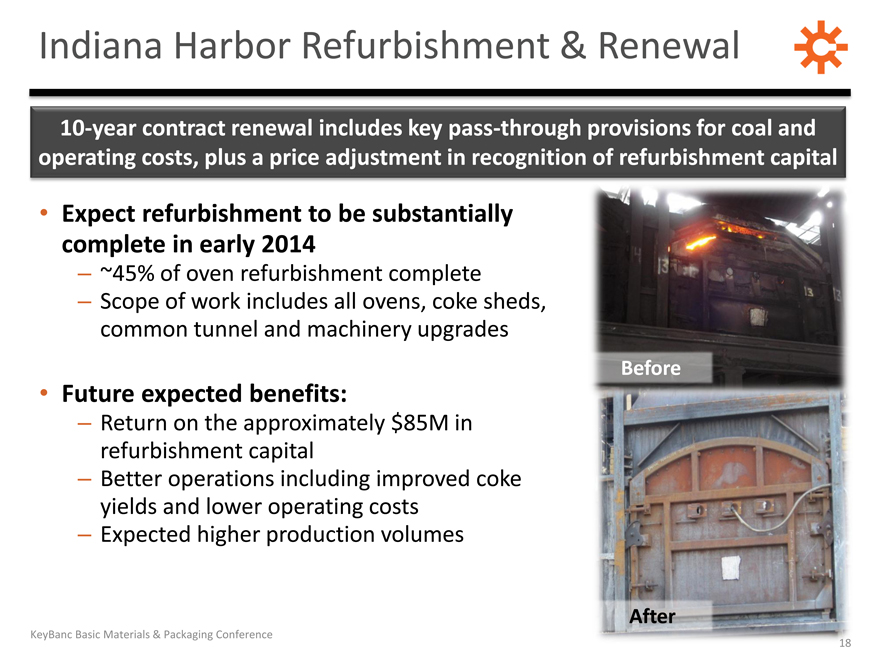
Indiana Harbor Refurbishment & Renewal
10-year contract renewal includes key pass-through provisions for coal and operating costs, plus a price adjustment in recognition of refurbishment capital
Expect refurbishment to be substantially complete in early 2014
– ~45% of oven refurbishment complete
– Scope of work includes all ovens, coke sheds, common tunnel and machinery upgrades
Before
Future expected benefits:
– Return on the approximately $85M in refurbishment capital
– Better operations including improved coke yields and lower operating costs
– Expected higher production volumes
After
KeyBanc Basic Materials & Packaging Conference
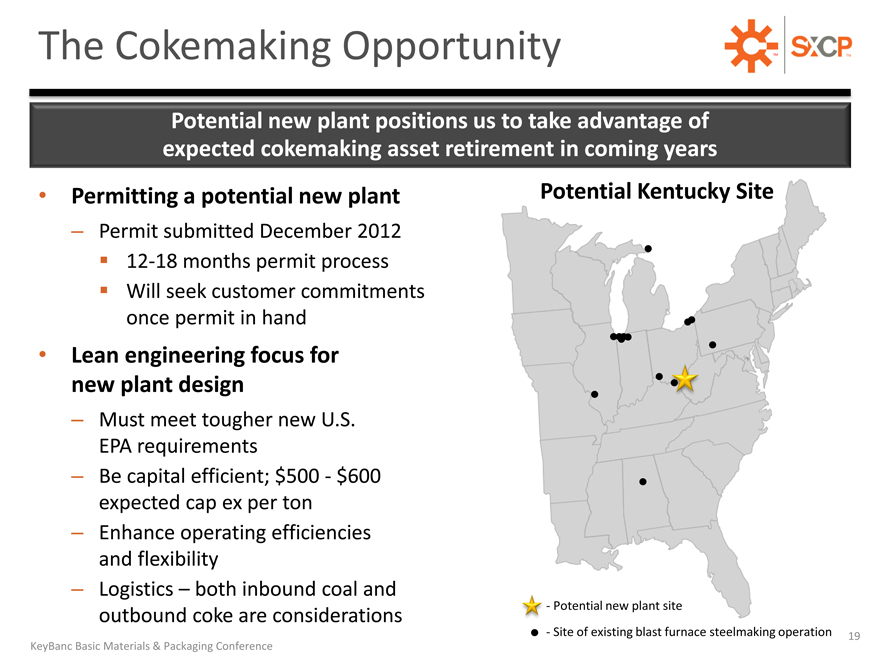
The Cokemaking Opportunity
Potential new plant positions us to take advantage of expected cokemaking asset retirement in coming years
Permitting a potential new plant
– Permit submitted December 2012 ??12-18 months permit process ??Will seek customer commitments once permit in hand
Lean engineering focus for new plant design
– Must meet tougher new U.S.
EPA requirements
– Be capital efficient; $500—$600 expected cap ex per ton
– Enhance operating efficiencies and flexibility
– Logistics – both inbound coal and outbound coke are considerations
Potential Kentucky Site
Potential new plant site
Site of existing blast furnace steelmaking operation
KeyBanc Basic Materials & Packaging Conference 19
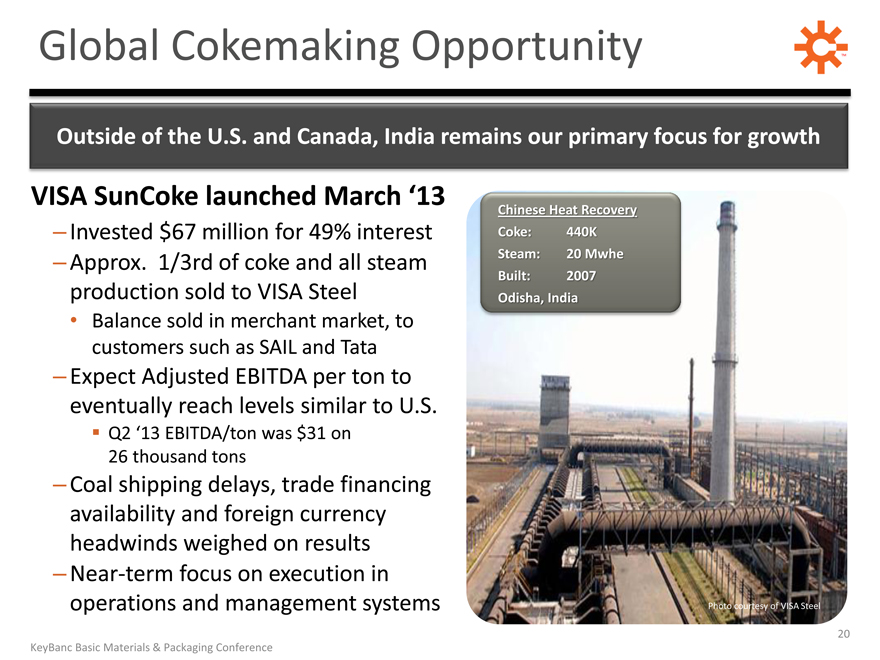
Global Cokemaking Opportunity
Outside of the U.S. and Canada, India remains our primary focus for growth
VISA SunCoke launched March ‘13
– Invested $67 million for 49% interest
– Approx. 1/3rd of coke and all steam production sold to VISA Steel
Balance sold in merchant market, to customers such as SAIL and Tata
– Expect Adjusted EBITDA per ton to eventually reach levels similar to U.S.
??Q2 ‘13 EBITDA/ton was $31 on
26 thousand tons
– Coal shipping delays, trade financing availability and foreign currency headwinds weighed on results
– Near-term focus on execution in operations and management systems
Chinese Heat Recover
Cok 440K
Steam 20 Mwh
Buil 2007
Odisha, Ind
20 KeyBanc Basic Materials & Packaging Conference

SXCP HIGHLIGHTS AND OUTLOOK
SunCoke EnergyTM
KeyBanc Basic Materials & Packaging Conference 21
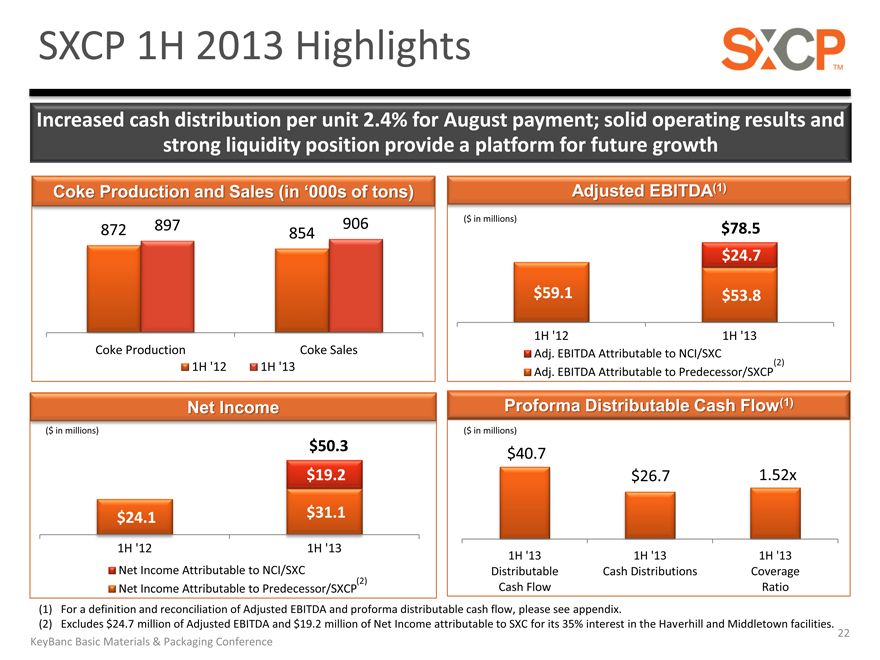
SXCP 1H 2013 Highlights
Increased cash distribution per unit 2.4% for August payment; solid operating results and strong liquidity position provide a platform for future growth
Coke Production and Sales (in ‘000s of ton
872 897 906 854
Coke Production Coke Sales
1H ‘12 1H ‘13
Adjusted EBITD
($ in millions)
$78.5 $24.7
$59.1 $53.8
1H ‘12 1H ‘13
Adj. EBITDA Attributable to NCI/SXC (2) Adj. EBITDA Attributable to Predecessor/SXCP
Net Income $50.3 $19.2
$24.1 $31.1
1H ‘12 1H ‘13
Net Income Attributable to NCI/SXC
Net Income Attributable to Predecessor/SXCP
Proforma Distributable Cash Flo
($ in millions)
$40.7 $26.7 1.52x
1H ‘13 1H ‘13 1H ‘13 Distributable Cash Distributions Coverage Cash Flow Ratio
(1) | | For a definition and reconciliation of Adjusted EBITDA and proforma distributable cash flow, please see appendix. |
(2) Excludes $24.7 million of Adjusted EBITDA and $19.2 million of Net Income attributable to SXC for its 35% interest in the Haverhill and Middletown facilities. 22 KeyBanc Basic Materials & Packaging Conference
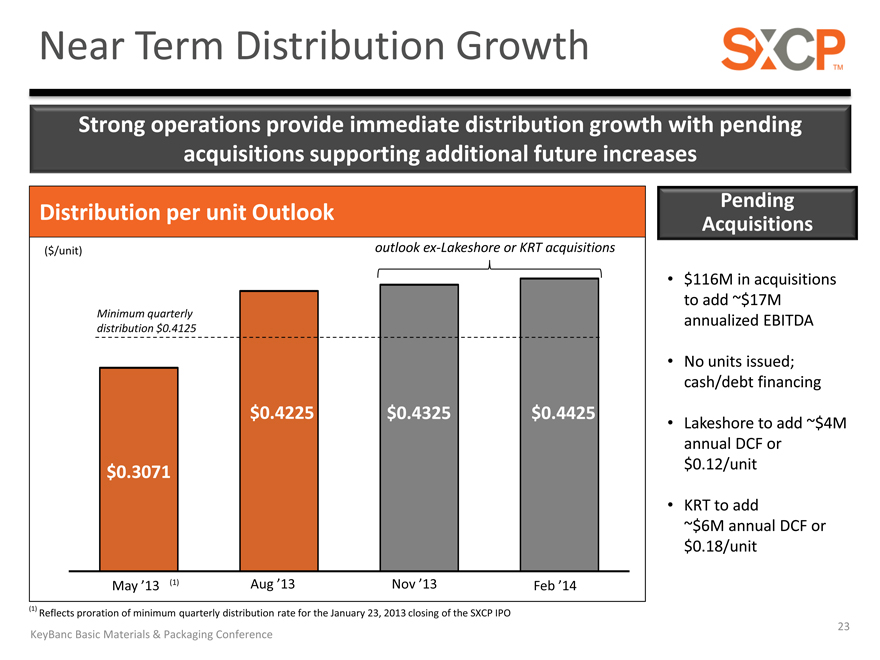
Near Term Distribution Growth
Strong operations provide immediate distribution growth with pending acquisitions supporting additional future increases
Distribution per unit Outlook
outlook ex-Lakeshore or KRT acquisitions
($/unit)
Minimum quarterly distribution $0.4125
$0.4225 $0.4325 $0.4425
$0.3071
Pending Acquisitions
$116M in acquisitions to add ~$17M annualized EBITDA
No units issued; cash/debt financing
Lakeshore to add ~$4M annual DCF or $0.12/unit
KRT to add
~$6M annual DCF or $0.18/unit
May ’13 (1) Aug ’13 Nov ’13 Feb ’14
Reflects proration of minimum quarterly distribution rate for the January 23, 2013 closing of the SXCP IPO
KeyBanc Basic Materials & Packaging Conference 23
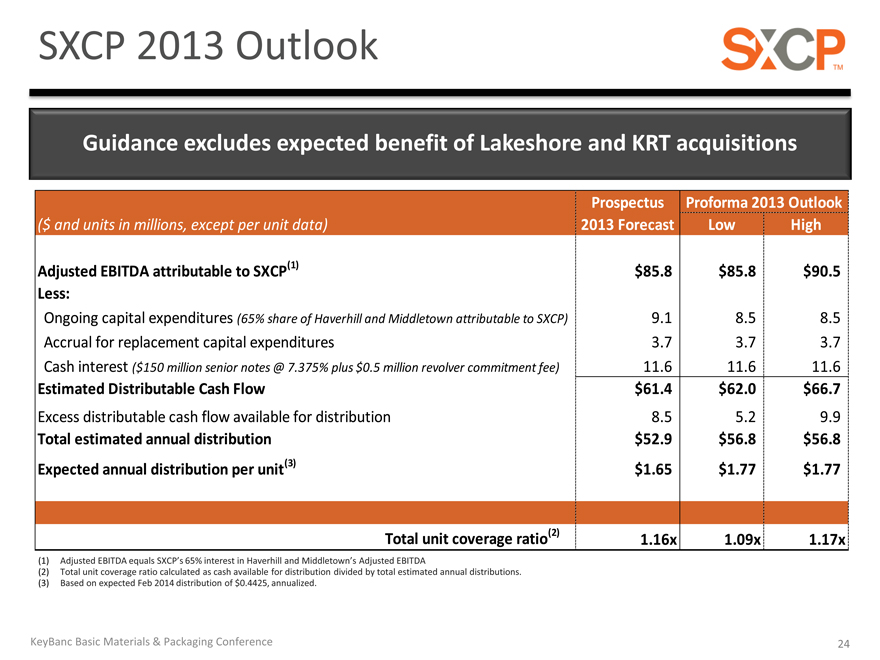
SXCP 2013 Outlook
Guidance excludes expected benefit of Lakeshore and KRT acquisitions
Prospectus Proforma 2013 Outlook
($ and units in millions, except per unit data) 2013 Forecast Low High
Adjusted EBITDA attributable to SXCP(1) $ 85.8 $ 85.8 $ 90.5
Less:
Ongoing capital expenditures (65% share of Haverhill and Middletown attributable to SXCP) 9.1 8.5 8.5
Accrual for replacement capital expenditures 3.7 3.7 3.7
Cash interest ($150 million senior notes @ 7.375% plus $0.5 million revolver commitment fee) 11.6 11.6 11.6
Estimated Distributable Cash Flow $ 61.4 $ 62.0 $ 66.7
Excess distributable cash flow available for distribution 8.5 5.2 9.9
Total estimated annual distribution $ 52.9 $ 56.8 $ 56.8
Expected annual distribution per unit(3) $ 1.65 $ 1.77 $ 1.77
Total unit coverage ratio(2) 1.16x 1.09x 1.17x
(1) | | Adjusted EBITDA equals SXCP’s 65% interest in Haverhill and Middletown’s Adjusted EBITDA |
(2) Total unit coverage ratio calculated as cash available for distribution divided by total estimated annual distributions. (3) Based on expected Feb 2014 distribution of $0.4425, annualized.
KeyBanc Basic Materials & Packaging Conference 24
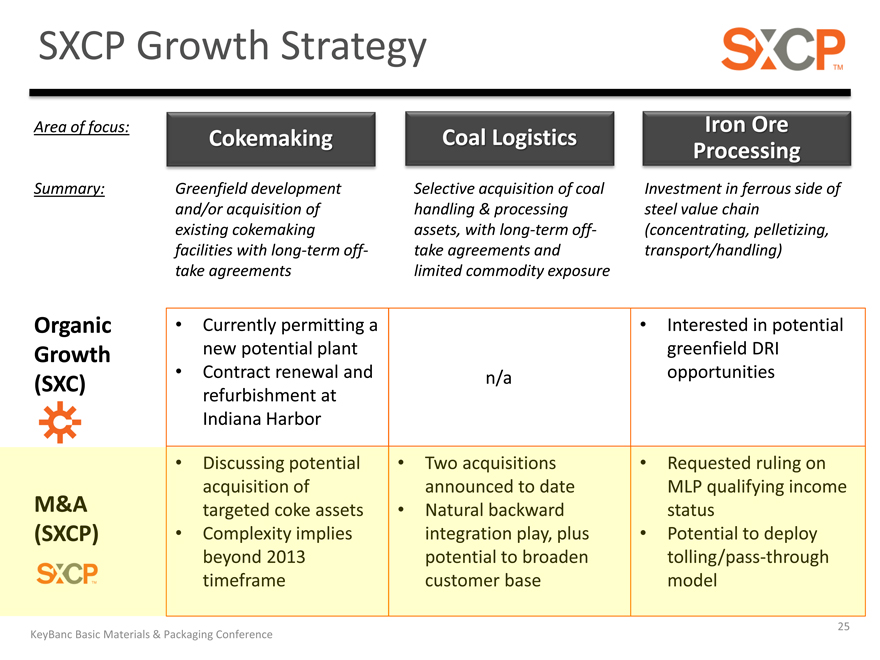
SXCP Growth Strategy
Area of focus:
Summary:
Cokemaking
Greenfield development and/or acquisition of existing cokemaking facilities with long-term off-take agreements
Coal Logistics
Selective acquisition of coal handling & processing assets, with long-term off-take agreements and limited commodity exposure
Iron Ore Processin
Investment in ferrous side of steel value chain (concentrating, pelletizing, transport/handling)
Organic Growth (SXC)
Currently permitting a new potential plant Contract renewal and refurbishment at Indiana Harbor
n/a
Interested in potential greenfield DRI opportunities
M & A
(SXCP)
Discussion potential acquisition of targeted coke asset
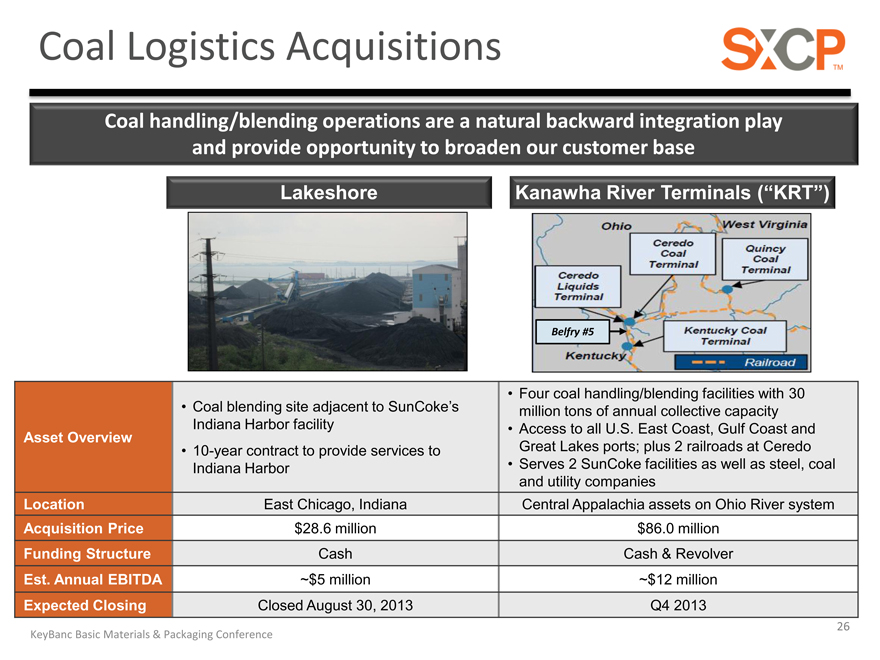
Coal Logistics Acquisitions
Coal handling/blending operations are a natural backward integration play and provide opportunity to broaden our customer base
Lakeshore
Kanawha River Terminals (“KRT”)
Four coal handling/blending facilities with 30
Coal blending site adjacent to SunCoke’s million tons of annual collective capacity
Asset Overview Indiana Harbor facility Access to all U.S. East Coast, Gulf Coast and
10-year contract to provide services to Great Lakes ports; plus 2 railroads at Ceredo
Indiana Harbor Serves 2 SunCoke facilities as well as steel, coal
and utility companies
Location East Chicago, Indiana Central Appalachia assets on Ohio River system
Acquisition Price $28.6 million $86.0 million
Funding Structure Cash Cash & Revolver
Est. Annual EBITDA ~$5 million ~$12 million
Expected Closing Closed August 30, 2013 Q4 2013
26
KeyBanc Basic Materials & Packaging Conference

SunCoke Strategy
Coke Operations Excellence
Maintain top quartile safety performance Sustain high-level of financial and operational achievement at our cokemaking facilities
Execute Organic Growth
Revitalize Indiana Harbor
- Complete refurbishment
- Resolve NOVs
- Renew contract with return on capital
Obtain permit for next potential U.S. facility
Leverage SXCP as Growth Engine
Identify and pursue strategic cokemaking acquisitions in the U.S. and Canada
Evaluate adjacent business lines in coal logistics and ferrous to extend our growth opportunities
Preserve strategic flexibility with non-core asset
Continue to reduce cash costs in face of weak pricing environment
KeyBanc Basic Materials & Packaging Conference 27
APPENDIX
SunCoke Energy TM
28
KeyBanc Basic Materials & Packaging Conference 28
Liquidity & Debt
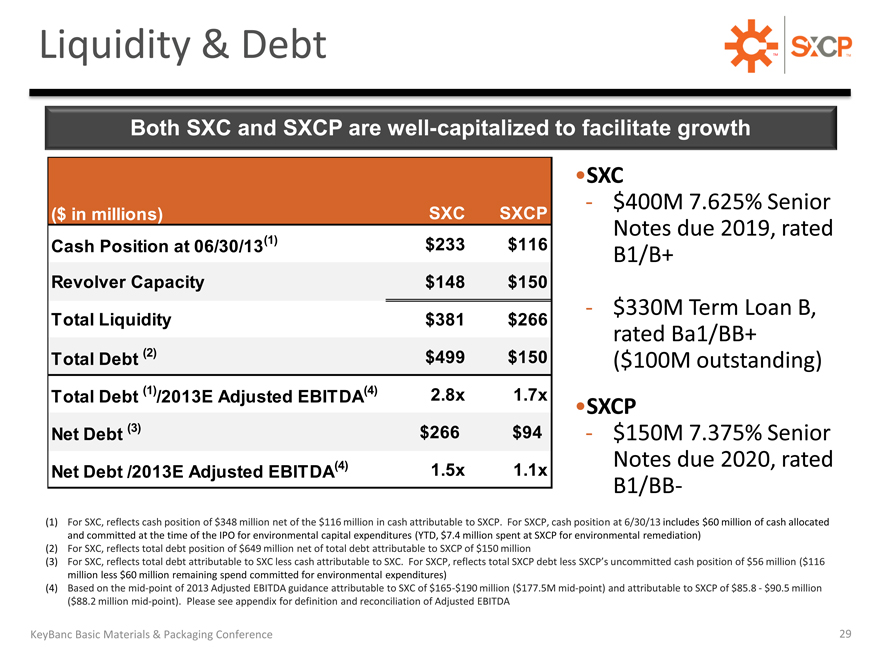
Both SXC and SXCP are well-capitalized to facilitate growth
($ in millions) SXC SXCP
Cash Position at 06/30/13(1) $233 $116
Revolver Capacity $148 $150
Total Liquidity $381 $266
Total Debt (2) $499 $150
Total Debt (1) /2013E Adjusted EBITDA(4) 2.8x 1.7x
Net Debt (3) $266 $94
Net Debt /2013E Adjusted EBITDA(4) 1.5x 1.1x
SXC
- $400M 7.625% Senior Notes due 2019, rated B1/B+
- $330M Term Loan B, rated Ba1/BB+
($100M outstanding)
SXCP
- $150M 7.375% Senior Notes due 2020, rated B1/BB-
(1) For SXC, reflects cash position of $348 million net of the $116 million in cash attributable to SXCP. For SXCP, cash position at 6/30/13 includes $60 million of cash allocated and committed at the time of the IPO for environmental capital expenditures (YTD, $7.4 million spent at SXCP for environmental remediation) (2) For SXC, reflects total debt position of $649 million net of total debt attributable to SXCP of $150 million
(3) For SXC, reflects total debt attributable to SXC less cash attributable to SXC. For SXCP, reflects total SXCP debt less SXCP’s uncommitted cash position of $56 million ($116 million less $60 million remaining spend committed for environmental expenditures) (4) Based on the mid-point of 2013 Adjusted EBITDA guidance attributable to SXC of $165-$190 million ($177.5M mid-point) and attributable to SXCP of $85.8—$90.5 million
($88.2 million mid-point). Please see appendix for definition and reconciliation of Adjusted EBITDA
KeyBanc Basic Materials & Packaging Conference 29
ABOUT SUNCOKE AND THE COKEMAKING PROCESS
SunCoke Energy TM
30
KeyBanc Basic Materials & Packaging Conference
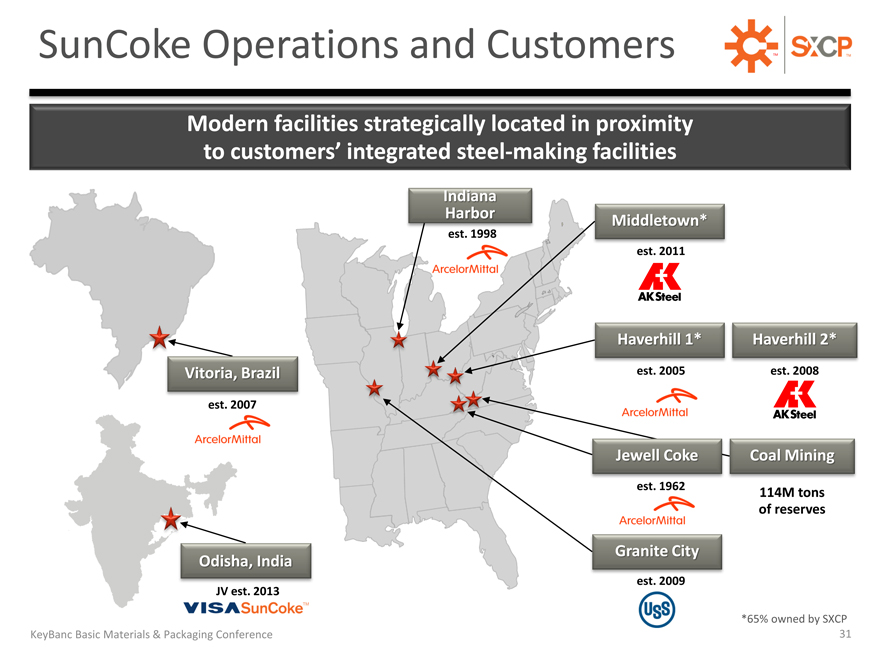
SunCoke Operations and Customers
Modern facilities strategically located in proximity to customers’ integrated steel-making facilities
Indiana Harbor
est. 1998
Middletown*
est. 2011
Vitoria, Brazil
est. 2007
Odisha, India
JV est. 2013
Haverhill
est. 2005
Haverhill
est. 2008
Coal Minin
114M tons of reserves
Granite Cit
est. 2009
*65% owned by SXCP
KeyBanc Basic Materials & Packaging Conference 31
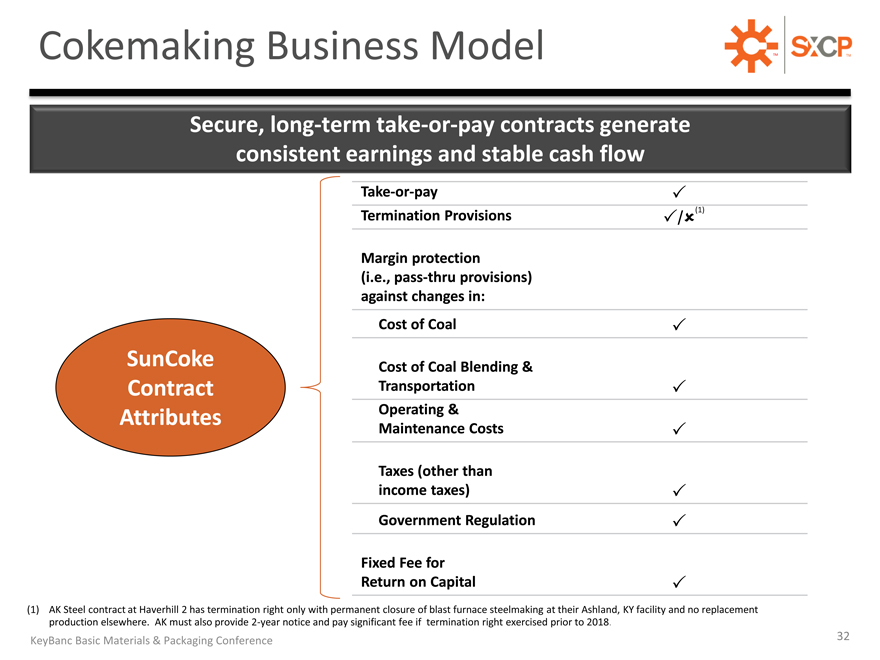
Cokemaking Business Model
Secure, long-term take-or-pay contracts generate consistent earnings and stable cash flow
Take-or-pay
Termination Provisions
Margin protection (i.e., pass-thru provisions) against changes in:
Cost of Coal
Cost of Coal Blending & Transportation Operating & Maintenance Costs
Taxes (other than income taxes)
Government Regulation
Fixed Fee for Return on Capital
(1) AK Steel contract at Haverhill 2 has termination right only with permanent closure of blast furnace steelmaking at their Ashland, KY facility and no replacement production elsewhere. AK must also provide 2-year notice and pay significant fee if termination right exercised prior to 2018.
KeyBanc Basic Materials & Packaging Conference 32
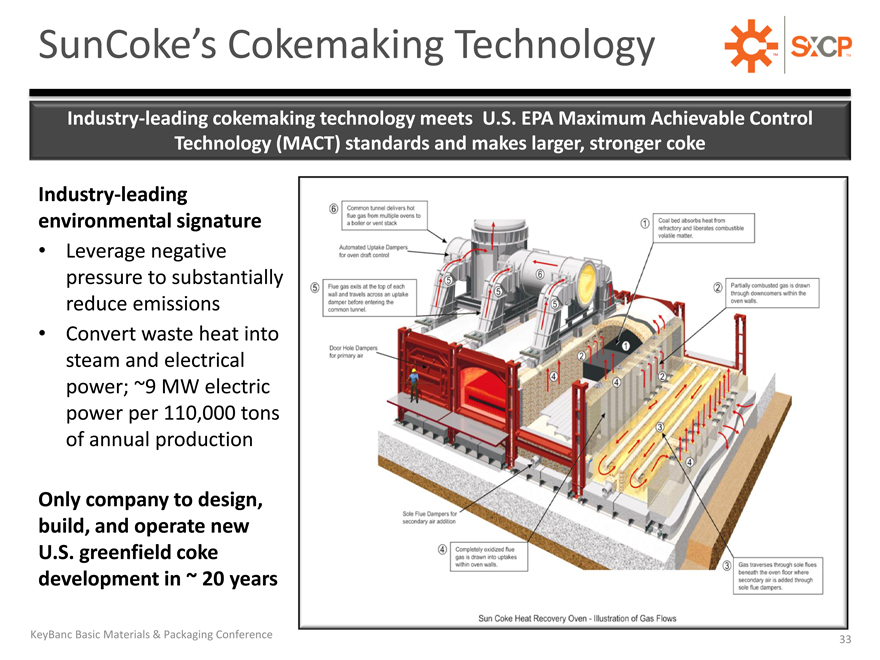
SunCoke’s Cokemaking Technology
Industry-leading cokemaking technology meets U.S. EPA Maximum Achievable Control Technology (MACT) standards and makes larger, stronger coke
Industry-leading environmental signature
Leverage negative pressure to substantially reduce emissions
Convert waste heat into steam and electrical power; ~9 MW electric power per 110,000 tons of annual production
Only company to design, build, and operate new U.S. greenfield coke development in ~ 20 years
KeyBanc Basic Materials & Packaging Conference
33
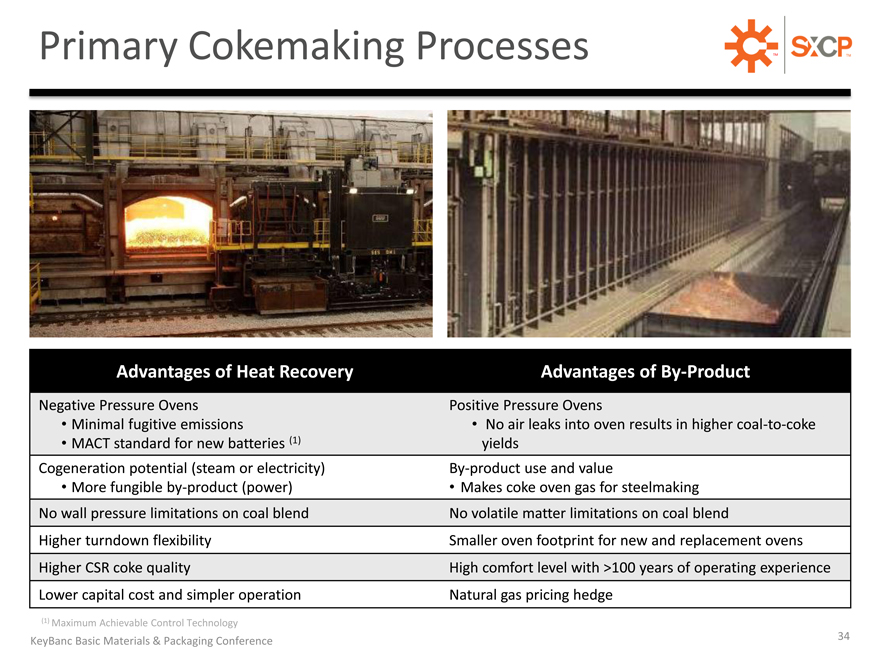
Primary Cokemaking Processes
Advantages of Heat Recovery
Negative Pressure Ovens
Minimal fugitive emissions
MACT standard for new batteries (1) Cogeneration potential (steam or electricity)
More fungible by-product (power) No wall pressure limitations on coal blend
Higher turndown flexibility
Higher CSR coke quality
Lower capital cost and simpler operation
Advantages of By-Product
Positive Pressure Ovens
No air leaks into oven results in higher coal-to-coke yields By-product use and value
Makes coke oven gas for steelmaking No volatile matter limitations on coal blend
Smaller oven footprint for new and replacement ovens High comfort level with >100 years of operating experience Natural gas pricing hedge
(1) | | Maximum Achievable Control Technology |
KeyBanc Basic Materials & Packaging Conference 34
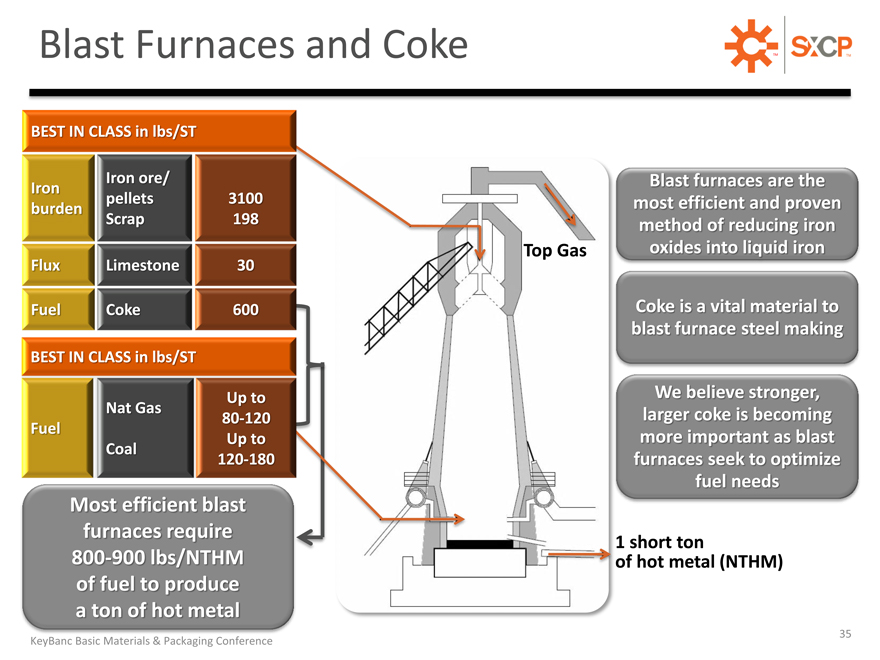
Blast Furnaces and Coke
BEST IN CLASS in lbs/ST
Iron ore/ Iron pellets 3100 burden Scrap 198
Flux Limestone 30 Fuel Coke 600 BEST IN CLASS in lbs/ST
Up to Nat Gas 80-120 Fuel Up to Coal 120-180
Most efficient blast furnaces require
800 900 lbs/NTHM of fuel to produce a ton of hot metal
Blast furnaces are the most efficient and proven method of reducing iron oxides into liquid iro
Coke is a vital material to blast furnace steel makin
We believe stronger, larger coke is becoming more important as blast furnaces seek to optimize fuel needs
1 | | short ton f hot metal (NTHM) |
KeyBanc Basic Materials & Packaging Conference 35
DEFINITIONS AND RECONCILIATIONS
KeyBanc Basic Materials & Packaging Conference
36
Definitions
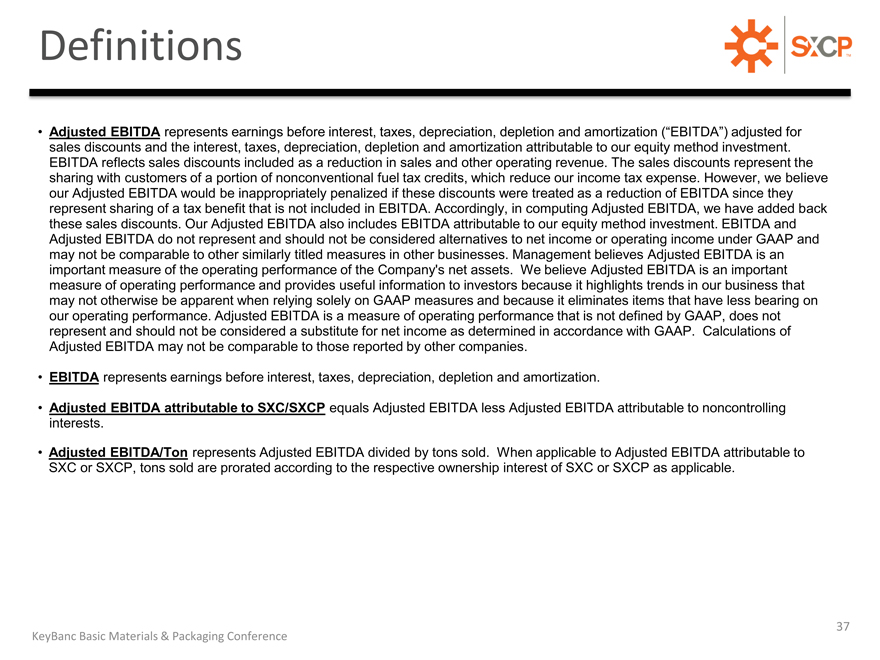
Adjusted EBITDA represents earnings before interest, taxes, sales discounts and the interest, taxes, depreciation, depletion and amortization attributable to our equity method investment.
EBITDA reflects sales discounts included as a reduction in sales and other operating revenue. The sales discounts represent the sharing with customers of a portion of nonconventional fuel tax credits, which reduce our income tax expense. However, we believe our Adjusted EBITDA would be inappropriately penalized if these discounts were treated as a reduction of EBITDA since they represent sharing of a tax benefit that is not included in EBITDA. Accordingly, in computing Adjusted EBITDA, we have added back these sales discounts. Our Adjusted EBITDA also includes EBITDA attributable to our equity method investment. EBITDA and Adjusted EBITDA do not represent and should not be considered alternatives to net income or operating income under GAAP and may not be comparable to other similarly titled measures in other businesses. Management believes Adjusted EBITDA is an important measure of the operating performance of the Company’s net assets. We believe Adjusted EBITDA is an important measure of operating performance and provides useful information to investors because it highlights trends in our business that may not otherwise be apparent when relying solely on GAAP measures and because it eliminates items that have less bearing on our operating performance. Adjusted EBITDA is a measure of operating performance that is not defined by GAAP, does not represent and should not be considered a substitute for net income as determined in accordance with GAAP. Calculations of Adjusted EBITDA may not be comparable to those reported by other companies.
EBITDA represents earnings before interest, taxes, depreciation, depletion and amortization.
Adjusted EBITDA attributable to SXC/SXCP equals Adjusted EBITDA less Adjusted EBITDA attributable to noncontrolling interests.
Adjusted EBITDA/Ton represents Adjusted EBITDA divided by tons sold. When applicable to Adjusted EBITDA attributable to SXC or SXCP, tons sold are prorated according to the
respective ownership interest of SXC or SXCP as applicable.
KeyBanc Basic Materials & Packaging Conference
37
Definitions
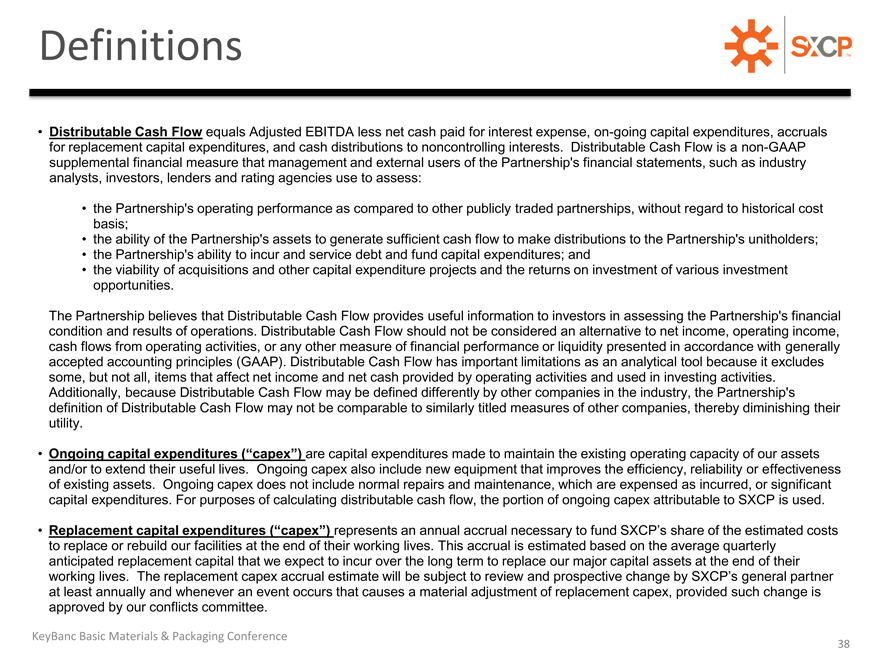
Distributable Cash Flow equals Adjusted EBITDA less net cash paid for interest expense, on-going capital expenditures, accruals for replacement capital expenditures, and cash distributions to noncontrolling interests. Distributable Cash Flow is a non-GAAP supplemental financial measure that management and external users of the Partnership’s financial statements, such as industry analysts, investors, lenders and rating agencies use to assess:
the Partnership’s operating performance as compared to other publicly traded partnerships, without regard to historical cost basis; the ability of the Partnership’s assets to generate sufficient cash flow to make distributions to the Partnership’s unitholders; the Partnership’s ability to incur and service debt and fund capital expenditures; and the viability of acquisitions and other capital expenditure projects and the returns on investment of various investment opportunities.
The Partnership believes that Distributable Cash Flow provides useful information to investors in assessing the Partnership’s financial condition and results of operations. Distributable Cash Flow should not be considered an alternative to net income, operating income, cash flows from operating activities, or any other measure of financial performance or liquidity presented in accordance with generally accepted accounting principles (GAAP). Distributable Cash Flow has important limitations as an analytical tool because it excludes some, but not all, items that affect net income and net cash provided by operating activities and used in investing activities.
Additionally, because Distributable Cash Flow may be defined differently by other companies in the industry, the Partnership’s definition of Distributable Cash Flow may not be comparable to similarly titled measures of other companies, thereby diminishing their utility.
Ongoing capital are capital expenditures (“capex”) made to maintain the existing operating capacity of our assets and/or to extend their useful lives. Ongoing capex also include new equipment that improves the efficiency, reliability or effectiveness of existing assets. Ongoing capex does not include normal repairs and maintenance, which are expensed as incurred, or significant capital expenditures. For purposes of calculating distributable cash flow, the portion of ongoing capex attributable to SXCP is used.
Replacement capital expenditures represents an (“capex”) annual accrual necessary to replace or rebuild our facilities at the end of their working lives. This accrual is estimated based on the average quarterly anticipated replacement capital that we expect to incur over the long term to replace our major capital assets at the end of their working lives. The replacement capex accrual estimate will tner at least annually and whenever an event occurs that causes a material adjustment of replacement capex, provided such change is approved by our conflicts committee.
KeyBanc Basic Materials & Packaging Conference
38
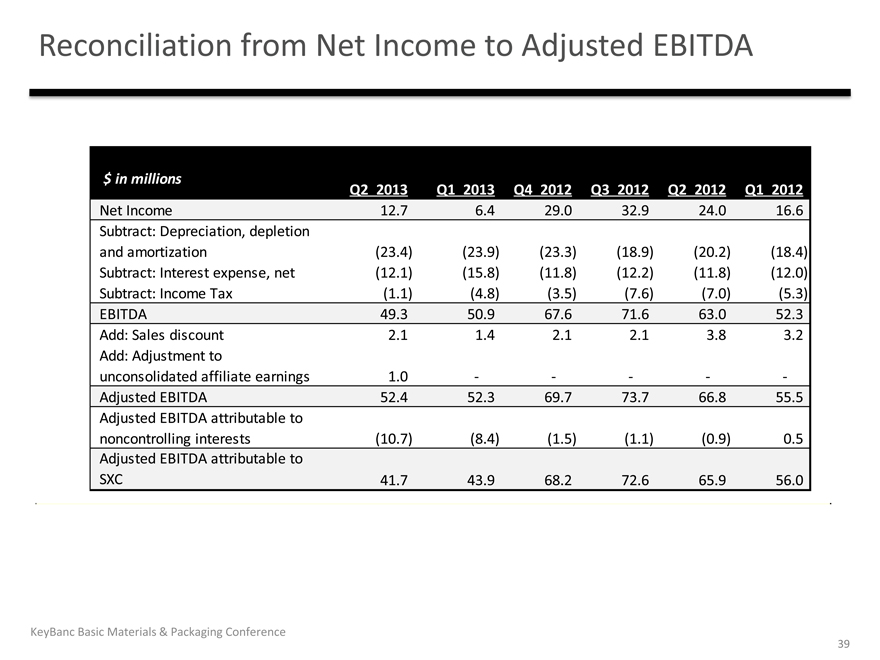
Reconciliation from Net Income to Adjusted EBITDA
$ in millions
Q2 2013 Q1 2013 Q4 2012 Q3 2012 Q2 2012 Q1 2012
Net Income 12.7 6.4 29.0 32.9 24.0 16.6
Subtract: Depreciation, depletion
and amortization (23.4) (23.9) (23.3) (18.9) (20.2) (18.4)
Subtract: Interest expense, net (12.1) (15.8) (11.8) (12.2) (11.8) (12.0)
Subtract: Income Tax (1.1) (4.8) (3.5) (7.6) (7.0) (5.3)
EBITDA 49.3 50.9 67.6 71.6 63.0 52.3
Add: Sales discount 2.1 1.4 2.1 2.1 3.8 3.2
Add: Adjustment to
unconsolidated affiliate earnings 1.0 —————
Adjusted EBITDA 52.4 52.3 69.7 73.7 66.8 55.5
Adjusted EBITDA attributable to
noncontrolling interests (10.7) (8.4) (1.5) (1.1) (0.9) 0.5
Adjusted EBITDA attributable to
SXC 41.7 43.9 68.2 72.6 65.9 56.0
KeyBanc Basic Materials & Packaging Conference
39
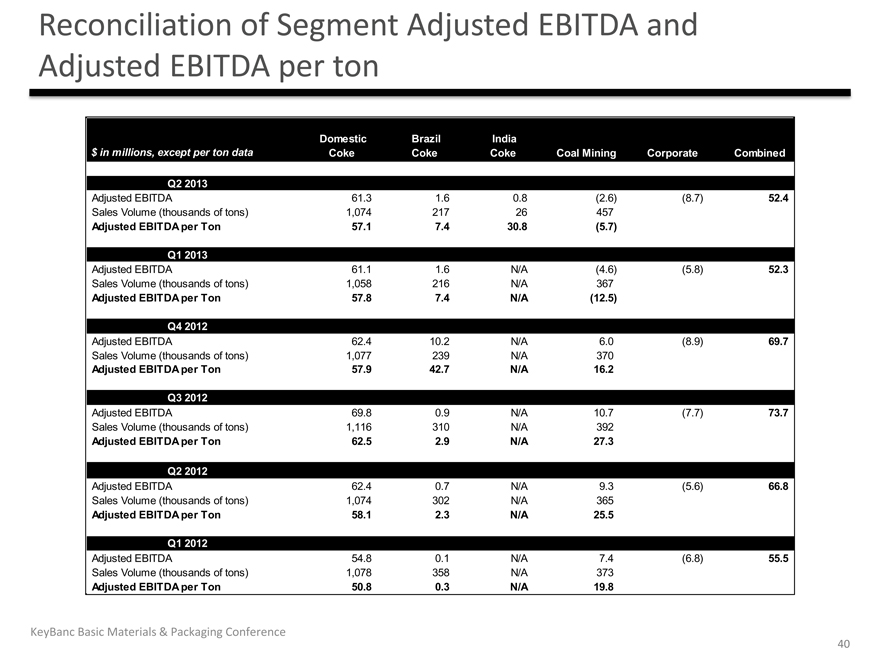
Reconciliation of Segment Adjusted EBITDA and
Adjusted EBITDA per ton
Domestic Brazil India
$ in millions, except per ton data Coke Coke Coke Coal Mining Corporate Combined
Q2 2013
Adjusted EBITDA 61.3 1.6 0.8 (2.6) (8.7) 52.4
Sales Volume (thousands of tons) 1,074 217 26 457
Adjusted EBITDA per Ton 57.1 7.4 30.8 (5.7)
Q1 2013
Adjusted EBITDA 61.1 1.6 N/A (4.6) (5.8) 52.3
Sales Volume (thousands of tons) 1,058 216 N/A 367
Adjusted EBITDA per Ton 57.8 7.4 N/A (12.5)
Q4 2012
Adjusted EBITDA 62.4 10.2 N/A 6.0 (8.9) 69.7
Sales Volume (thousands of tons) 1,077 239 N/A 370
Adjusted EBITDA per Ton 57.9 42.7 N/A 16.2
Q3 2012
Adjusted EBITDA 69.8 0.9 N/A 10.7 (7.7) 73.7
Sales Volume (thousands of tons) 1,116 310 N/A 392
Adjusted EBITDA per Ton 62.5 2.9 N/A 27.3
Q2 2012
Adjusted EBITDA 62.4 0.7 N/A 9.3 (5.6) 66.8
Sales Volume (thousands of tons) 1,074 302 N/A 365
Adjusted EBITDA per Ton 58.1 2.3 N/A 25.5
Q1 2012
Adjusted EBITDA 54.8 0.1 N/A 7.4 (6.8) 55.5
Sales Volume (thousands of tons) 1,078 358 N/A 373
Adjusted EBITDA per Ton 50.8 0.3 N/A 19.8
KeyBanc Basic Materials & Packaging Conference
40
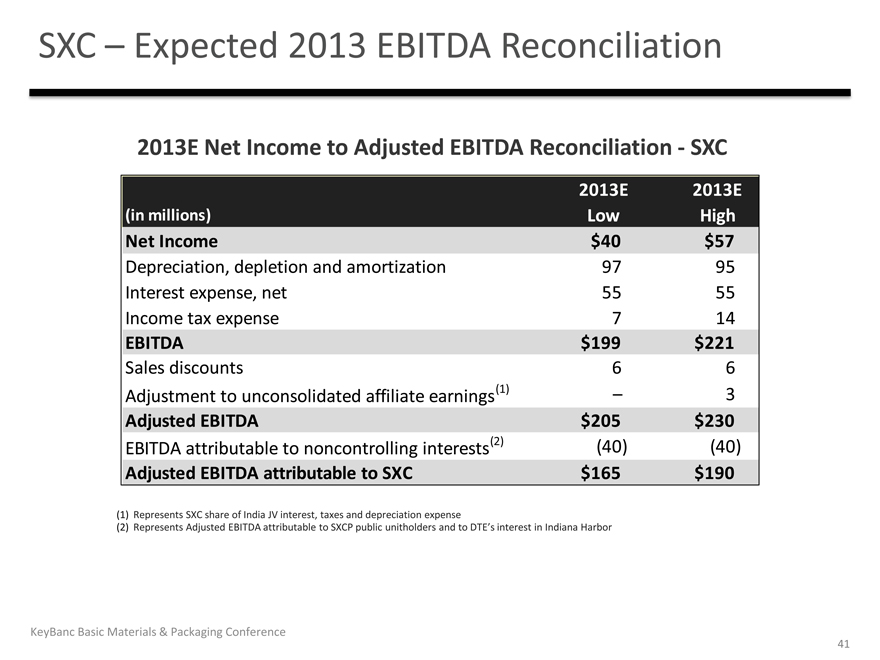
SXC –Expected 2013 EBITDA Reconciliation
2013E Net Income to Adjusted EBITDA Reconciliation—SXC
2013E 2013E
(in millions) Low High
Net Income $40 $57
Depreciation, depletion and amortization 97 95
Interest expense, net 55 55
Income tax expense 7 14
EBITDA $199 $221
Sales discounts 6 6
Adjustment to unconsolidated affiliate earnings(1) – 3
Adjusted EBITDA $205 $230
EBITDA attributable to noncontrolling interests(2) (40) (40)
Adjusted EBITDA attributable to SXC $165 $190
(1) | | Represents SXC share of India JV interest, taxes and depreciation expense |
(2) | | Represents Adjusted EBITDA attributable to SXCP public unitholders |
KeyBanc Basic Materials & Packaging Conference
41
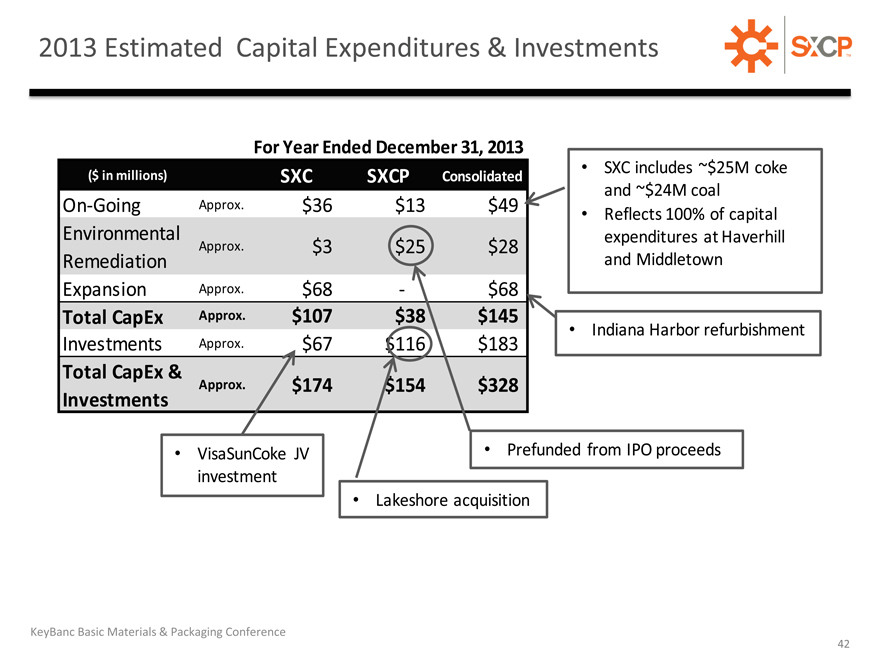
2013 Estimated Capital Expenditures & Investments
For Year Ended December 31, 2013
($ in millions) SXC SXCP Consolidated SXC includes ~$25M coke
and ~$24M coal
On-Going Approx. $36 $13 $49 Reflects 100% of capital
Environmental expenditures at Haverhill
Approx. $3 $25 $28
Remediation and Middletown
Expansion Approx. $68 — $68
Total CapEx Approx. $107 $38 $145 Indiana Harbor refurbishment
Investments Approx. $67 $116 $183
Total CapEx &
Approx. $174 $154 $328
Investments
VisaSunCoke JV Prefunded from IPO proceeds
investment
Lakeshore acquisition
KeyBanc Basic Materials & Packaging Conference
42
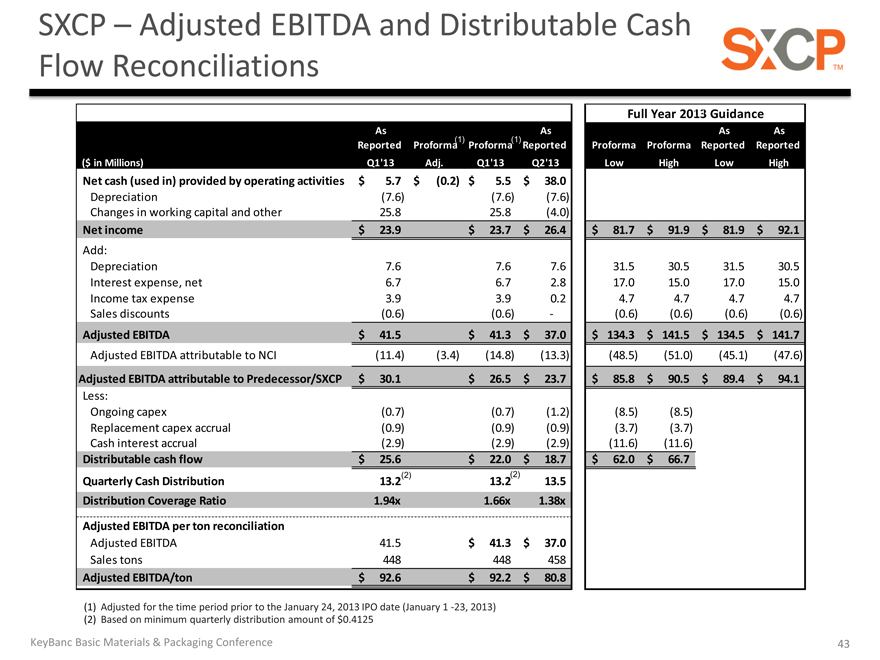
SXCP –Adjusted EBITDA and Distributable Cash
Flow Reconciliations
Full Year 2013(1) Guidance
As As As As
Reported Proforma(1)) Proforma(1)) Reported Proforma Proforma Reported Reported
($ in Millions) Q1’13 Adj. Q1’13 Q2’13 Low High Low High
Net cash (used in) provided by operating activities $ 5.7 $ (0.2) $ 5.5 $ 38.0
Depreciation (7.6) (7.6) (7.6)
Changes in working capital and other 25.8 25.8 (4.0)
Net income $ 23.9 $ 23.7 $ 26.4 $ 81.7 $ 91.9 $ 81.9 $ 92.1
Add:
Depreciation 7.6 7.6 7.6 31.5 30.5 31.5 30.5
Interest expense, net 6.7 6.7 2.8 17.0 15.0 17.0 15.0
Income tax expense 3.9 3.9 0.2 4.7 4.7 4.7 4.7
Sales discounts (0.6) (0.6) — (0.6) (0.6) (0.6) (0.6)
Adjusted EBITDA $ 41.5 $ 41.3 $ 37.0 $ 134.3 $ 141.5 $ 134.5 $ 141.7
Adjusted EBITDA attributable to NCI (11.4) (3.4) (14.8) (13.3) (48.5) (51.0) (45.1) (47.6)
Adjusted EBITDA attributable to Predecessor/SXCP $ 30.1 $ 26.5 $ 23.7 $ 85.8 $ 90.5 $ 89.4 $ 94.1
Less:
Ongoing capex (0.7) (0.7) (1.2) (8.5) (8.5)
Replacement capex accrual (0.9) (0.9) (0.9) (3.7) (3.7)
Cash interest accrual (2.9) (2.9) (2.9) (11.6) (11.6)
Distributable cash flow $ 25.6 $ 22.0 $ 18.7 $ 62.0 $ 66.7
Quarterly Cash Distribution 13.2(2) 13.2(2) 13.5
Distribution Coverage Ratio 1.94x 1.66x 1.38x
Adjusted EBITDA per ton reconciliation
Adjusted EBITDA 41.5 $ 41.3 $ 37.0
Sales tons 448 448 458
Adjusted EBITDA/ton $ 92.6 $ 92.2 $ 80.8
(1) | | Adjusted for the time period prior to the January 24, 2013 IPO date (January 1 -23, 2013) |
(2) | | Based on minimum quarterly distribution amount of $0.4125 |
KeyBanc Basic Materials & Packaging Conference 43
Investor Relations: 630-824-1987 www.suncoke.com