Exhibit 99.2
SunCoke Energy, Inc.
Q3 2013 Earnings
Conference Call
October 25, 2013
SunCoke EnergyTM
Forward-Looking Statements
This slide presentation should be reviewed in conjunction with the Third Quarter 2013 earnings releases of SunCoke Energy, Inc. (SunCoke) and the conference call held on October 25, 2013 at 11:30 a.m. ET.
Some of the information included in this presentation constitutes “forward-looking statements” as defined in Section 27A of the Securities Act of 1933, as amended and Section 21E of the Securities Exchange Act of 1934, as amended. All statements in this presentation that express opinions, expectations, beliefs, plans, objectives, assumptions or projections with respect to anticipated future performance of SunCoke or the Partnership, in contrast with statements of historical facts, are forward-looking statements. Such forward-looking statements are based on management’s beliefs and assumptions and on information currently available. Forward-looking statements include information concerning possible or assumed future results of operations, business strategies, financing plans, competitive position, potential growth opportunities, potential operating performance improvements, the effects of competition and the effects of future legislation or regulations. Forward-looking statements include all statements that are not historical facts and may be identified by the use of forward-looking terminology such as the words “believe,” “expect,” “plan,” “intend,” “anticipate,” “estimate,” “predict,” “potential,” “continue,” “may,” “will,” “should” or the negative of these terms or similar expressions.
Although management believes that its plans, intentions and expectations reflected in or suggested by the forward-looking statements made in this presentation are reasonable, no assurance can be given that these plans, intentions or expectations will be achieved when anticipated or at all. Moreover, such statements are subject to a number of assumptions, risks and uncertainties. Many of these risks are beyond the control of SunCoke and the Partnership, and may cause actual results to differ materially from those implied or expressed by the forward-looking statements. Each of SunCoke and the Partnership has included in its filings with the Securities and Exchange Commission cautionary language identifying important factors (but not necessarily all the important factors) that could cause actual results to differ materially from those expressed in any forward-looking statement. For more information concerning these factors, see the Securities and Exchange Commission filings of SunCoke and the Partnership. All forward-looking statements included in this presentation are expressly qualified in their entirety by such cautionary statements. Although forward-looking statements are based on current beliefs and expectations, caution should be taken not to place undue reliance on any such forward-looking statements because such statements speak only as of the date hereof. SunCoke and the Partnership do not have any intention or obligation to update publicly any forward-looking statement (or its associated cautionary language) whether as a result of new information or future events or after the date of this presentation, except as required by applicable law.
This presentation includes certain non-GAAP financial measures intended to supplement, not substitute for, comparable GAAP measures. Reconciliations of non-GAAP financial measures to GAAP financial measures are provided in the Appendix at the end of the presentation. Investors are urged to consider carefully the comparable GAAP measures and the reconciliations to those measures provided in the Appendix.
SXC Q3 2013 Earnings Call 1
Q3 2013 Highlights
Continued Operations Excellence
Sustained high-level of operating performance in coke business
Driving coal cash cost performance
Maintained top quartile safety performance
Positioned for Future Organic Growth
Indiana Harbor—renewed contract with ArcelorMittal includes return on refurbishment capital; project on track
Leveraged SXCP as Growth Engine
Completed two acquisitions in coal logistics business
Received favorable private letter ruling on iron ore concentrating/pelletizing activities
SXCP raised Q4 distribution outlook; reaching first incentive distribution right (IDR) split
Expect to end year in upper half of initial 2013 Adjusted EBITDA and EPS guidance
SXC Q3 2013 Earnings Call 2
Q3 2013 Earnings Overview
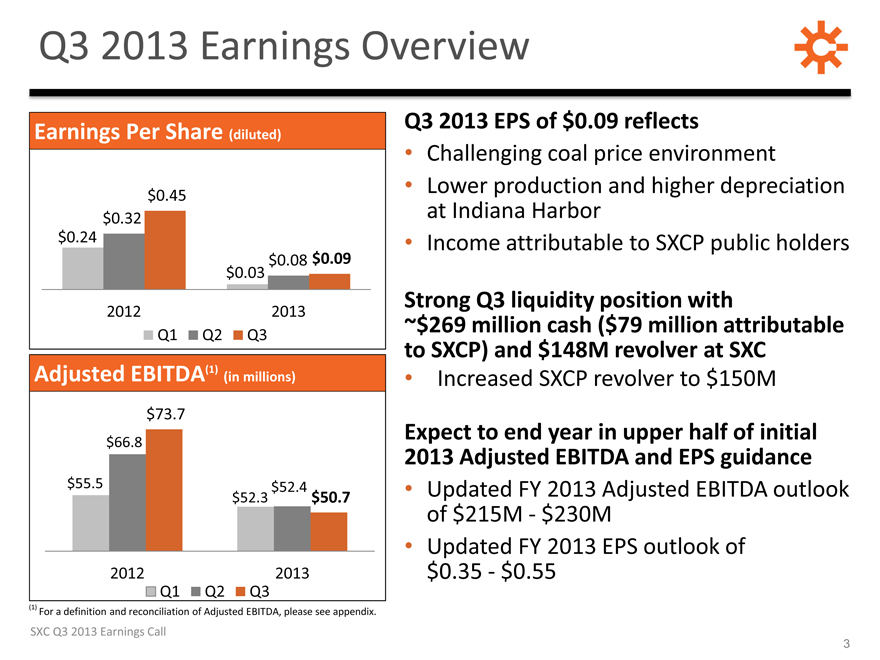
Earnings Per Share (diluted)
$0.24
$0.32
$0.45
$0.03
$0.08
$0.09
2012
2013
Q1
Q2
Q3
Adjusted EBITDA(1) (in millions)
$55.5
$66.8
$73.7
$52.3
$52.4
$50.7
2012
2013
Q1
Q2
Q3
(1) For a definition and reconciliation of Adjusted EBITDA, please see appendix.
Q3 2013 EPS of $0.09 reflects
Challenging coal price environment
Lower production and higher depreciation at Indiana Harbor
Income attributable to SXCP public holders
Strong Q3 liquidity position with
~$269 million cash ($79 million attributable to SXCP) and $148M revolver at SXC
Increased SXCP revolver to $150M
Expect to end year in upper half of initial 2013 Adjusted EBITDA and EPS guidance
Updated FY 2013 Adjusted EBITDA outlook of $215M - $230M
Updated FY 2013 EPS outlook of $0.35 - $0.55
SXC Q3 2013 Earnings Call
3
Q3 2013 Financial Results
| | | | | | |
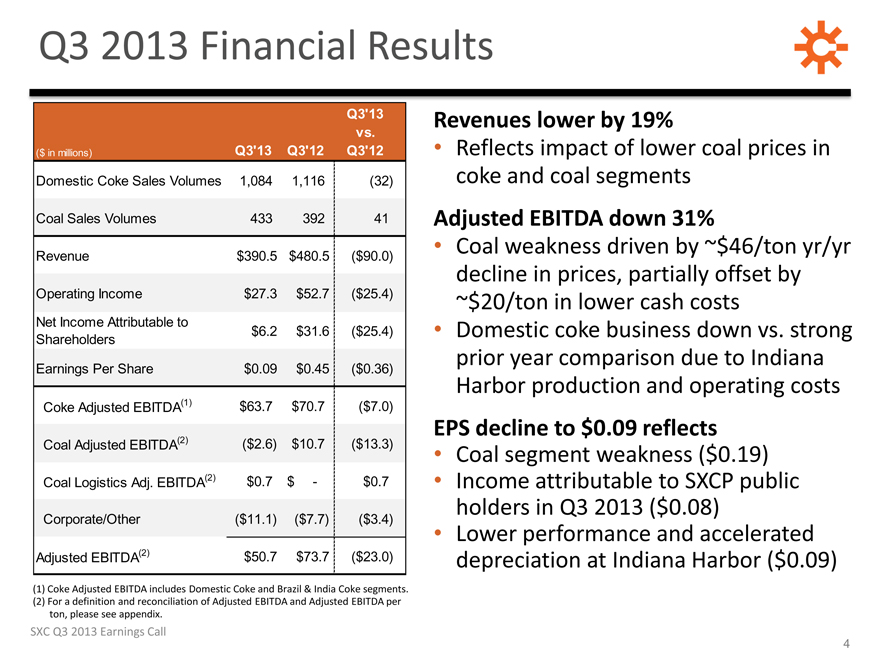
($ in millions) Domestic Coke Sales Volumes Coal Sales Volumes Revenue Operating Income Net Income Attributable to Shareholders Earnings Per Share Coke Adjusted EBITDA(1) Coal Adjusted EBITDA(2) Coal Logistics Adj. EBITDA(2) Corporate/Other Adjusted EBITDA(2) | | Q3’13 1,084 433 $390.5 $27.3 $6.2 $0.09 $63.7 ($2.6) $0.7 ($11.1) $50.7 | | Q3’12 1,116 392 $480.5 $52.7 $31.6 $0.45 $70.7 $10.7 $- ($7.7) $73.7 | | Q3’13 vs. Q3’12 (32) 41 ($90.0) ($25.4) ($25.4) ($0.36) ($7.0) ($13.3) $0.7 ($3.4) ($23.0) |
(1) Coke Adjusted EBITDA includes Domestic Coke and Brazil & India Coke segments.
(2) For a definition and reconciliation of Adjusted EBITDA and Adjusted EBITDA per ton, please see appendix.
Revenues lower by 19%
Reflects impact of lower coal prices in coke and coal segments
Adjusted EBITDA down 31%
Coal weakness driven by ~$46/ton yr/yr decline in prices, partially offset by
~$20/ton in lower cash costs
Domestic coke business down vs. strong prior year comparison due to Indiana Harbor production and operating costs
EPS decline to $0.09 reflects
Coal segment weakness ($0.19)
Income attributable to SXCP public holders in Q3 2013 ($0.08)
Lower performance and accelerated depreciation at Indiana Harbor ($0.09)
SXC Q3 2013 Earnings Call
4
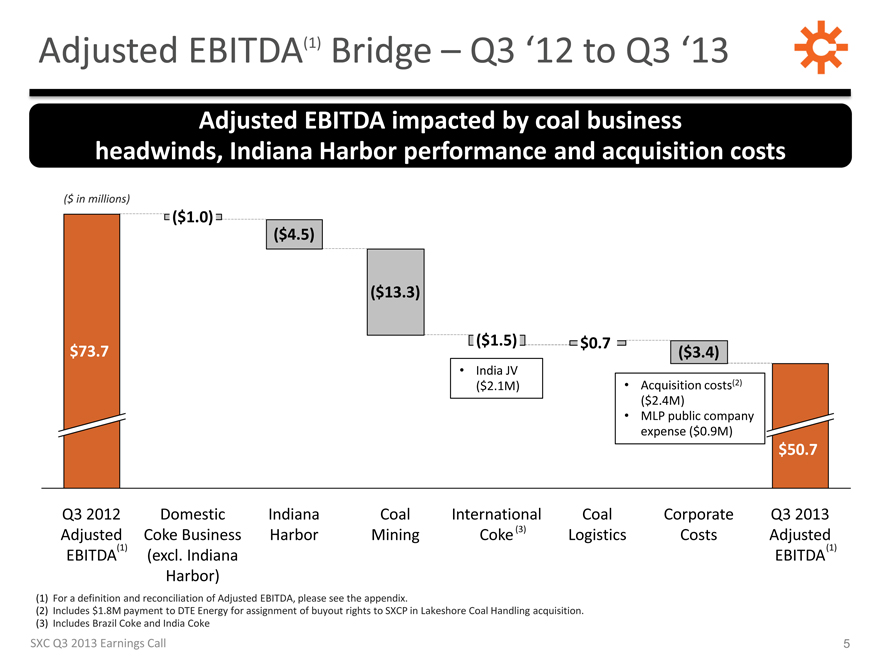
Adjusted EBITDA(1) Bridge – Q3 ‘12 to Q3 ‘13
Adjusted EBITDA impacted by coal business headwinds, Indiana Harbor performance and acquisition costs
($ in millions)
($1.0)
($4.5)
($13.3)
($1.5)
$0.7
$73.7($3.4)
India JV
($2.1M)
Acquisition costs(2)
($2.4M)
MLP public company expense ($0.9M)
$50.7
Q3 2012 Adjusted EBITDA(1)
Domestic Coke Business (excl. Indiana Harbor)
Indiana Harbor
Coal Mining
International Coke (3)
Coal Logistics
Corporate Costs
Q3 2013 Adjusted EBITDA(1)
(1) For a definition and reconciliation of Adjusted EBITDA, please see the appendix.
(2) Includes $1.8M payment to DTE Energy for assignment of buyout rights to SXCP in Lakeshore Coal Handling acquisition.
(3) Includes Brazil Coke and India Coke
SXC Q3 2013 Earnings Call
5
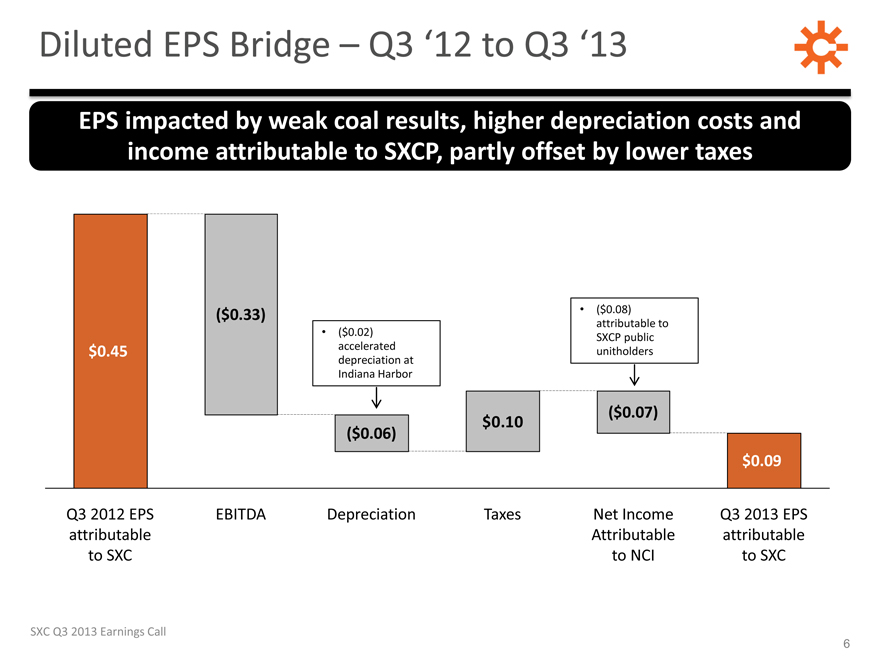
Diluted EPS Bridge - Q3 ‘12 to Q3 ‘13
EPS impacted by weak coal results, higher depreciation costs and income attributable to SXCP, partly offset by lower taxes
$0.45
Q3 2012 EPS attributable to SXC
($0.33) EBITDA
($0.02)
accelerated
depreciation at
Indiana Harbor
($0.06)
Depreciation
$0.10 Taxes
($0.08)
attributable to
SXCP public
unitholders
($0.07)
Net Income Attributable to NCI
$0.09
Q3 2013 EPS attributable to SXC
SXC Q3 2013 Earnings Call 6
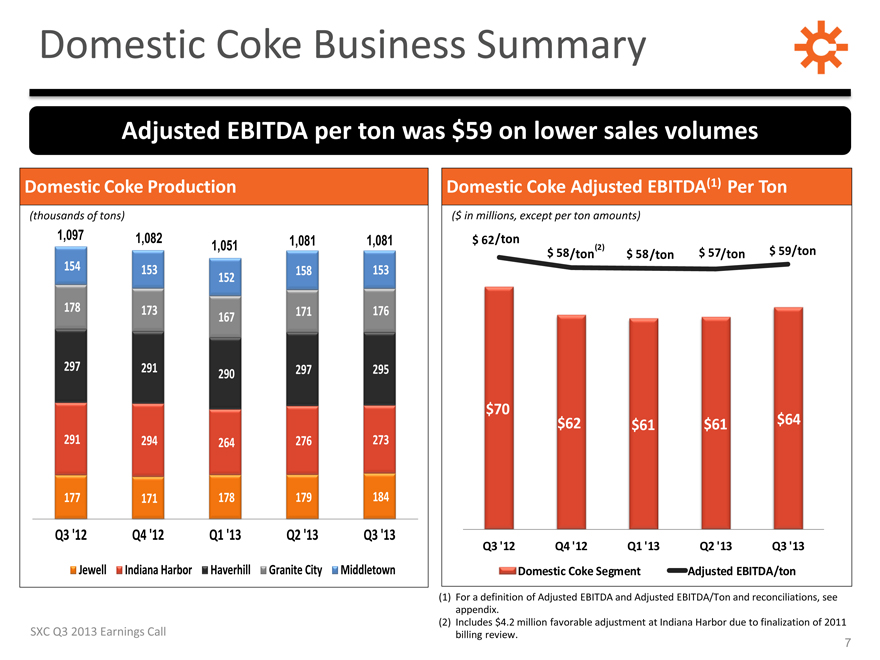
Domestic Coke Business Summary
Adjusted EBITDA per ton was $59 on lower sales volumes
Domestic Coke Production
(thousands of tons)
1,097 1,082 1,051 1,081 1,081
154 153 152 158 153
178 173 167 171 176
297 291 290 297 295
291 294 264 276 273
177 171 178 179 184
Q3 ‘12 Q4 ‘12 Q1 ‘13 Q2 ‘13 Q3 ‘13
Jewell Indiana Harbor Haverhill Granite City Middletown
Domestic Coke Adjusted EBITDA(1) Per Ton
($ in millions, except per ton amounts)
$62/ton $58/ton (2) $ 58/ton $ 57/ton $ 59/ton
$70 $62 $61 $61 $64
Q3 ‘12 Q4 ‘12 Q1 ‘13 Q2 ‘13 Q3 ‘13
Domestic Coke Segment Adjusted EBITDA/ton
(1) For a definition of Adjusted EBITDA and Adjusted EBITDA/Ton and reconciliations, see appendix.
(2) Includes $4.2 million favorable adjustment at Indiana Harbor due to finalization of 2011 billing review.
SXC Q3 2013 Earnings Call
7
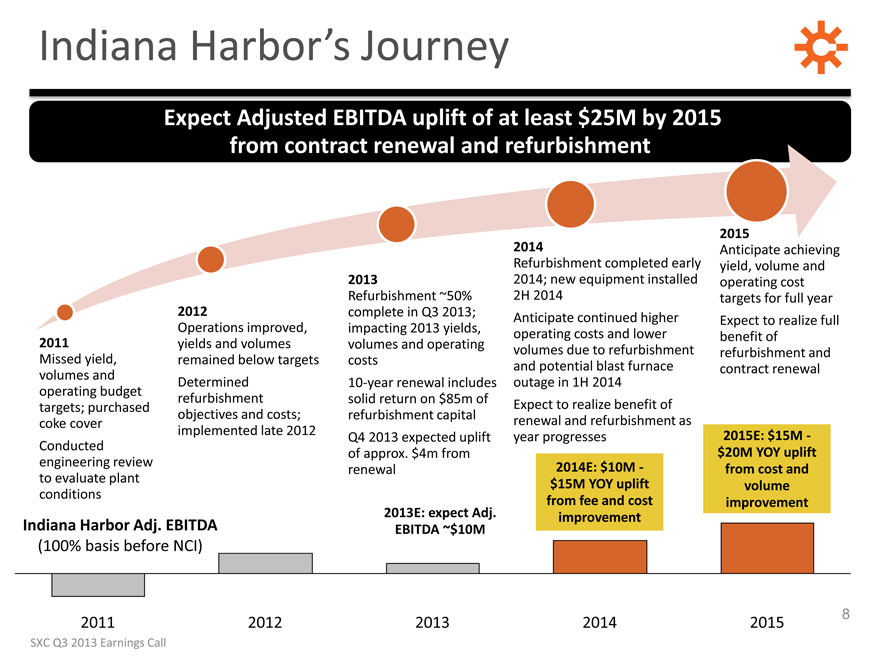
Indiana Harbor’s Journey
Expect Adjusted EBITDA uplift of at least $25M by 2015 from contract renewal and refurbishment
2011
Missed yield, volumes and operating budget targets; purchased coke cover Conducted engineering review to evaluate plant conditions
2012
Operations improved, yields and volumes remained below targets Determined refurbishment objectives and costs; implemented late 2012
2013
Refurbishment ~50% complete in Q3 2013; impacting 2013 yields, volumes and operating costs 10-year renewal includes solid return on $85m of refurbishment capital Q4 2013 expected uplift of approx. $4m from renewal
2014
Refurbishment completed early 2014; new equipment installed 2H 2014
Anticipate continued higher operating costs and lower volumes due to refurbishment and potential blast furnace outage in 1H 2014 Expect to realize benefit of renewal and refurbishment as year progresses
2015
Anticipate achieving yield, volume and operating cost targets for full year Expect to realize full benefit of refurbishment and contract renewal
Indiana Harbor Adj. EBITDA
(100% basis before NCI)
2013E: expect Adj. EBITDA ~$10M
2014E: $10M -$15M YOY uplift from fee and cost improvement
2015E: $15M -$20M YOY uplift from cost and volume improvement
2011 2012 2013 2014 2015
SXC Q3 2013 Earnings Call 8
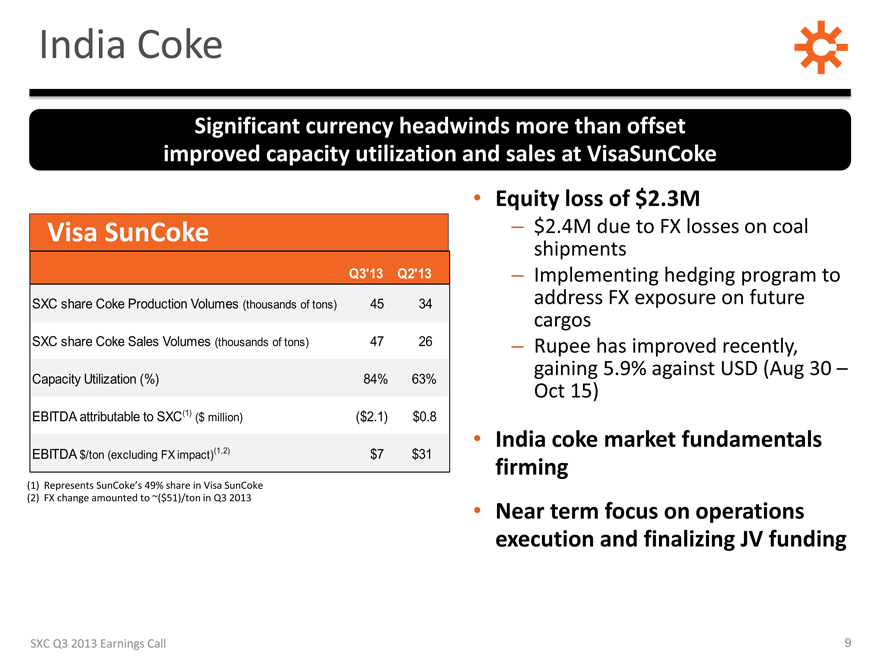
India Coke
Significant currency headwinds more than offset improved capacity utilization and sales at VisaSunCoke
Visa SunCoke
Q3’13 Q2’13
SXC share Coke Production Volumes (thousands of tons) 45 34
SXC share Coke Sales Volumes (thousands of tons) 47 26
Capacity Utilization (%) 84% 63%
EBITDA attributable to SXC(1) ($ million) ($2.1) $0.8
EBITDA $/ton (excluding FX impact)(1,2) $7 $31
(1) Represents SunCoke’s 49% share in Visa SunCoke
(2) FX change amounted to ~($51)/ton in Q3 2013
Equity loss of $2.3M
$2.4M due to FX losses on coal shipments
Implementing hedging program to address FX exposure on future cargos
Rupee has improved recently, gaining 5.9% against USD (Aug 30 - Oct 15)
India coke market fundamentals firming
Near term focus on operations execution and finalizing JV funding
SXC Q3 2013 Earnings Call
9
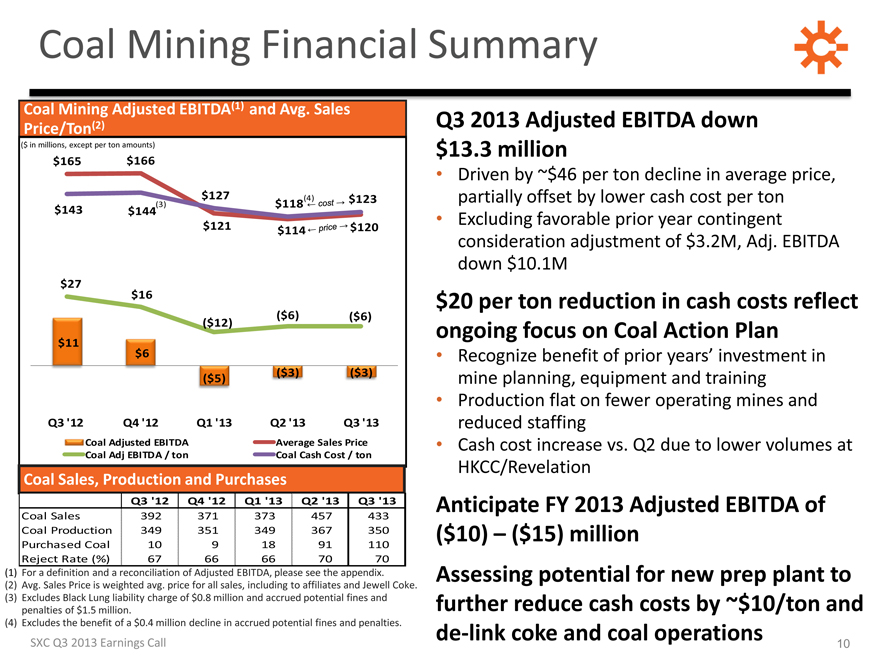
Coal Mining Financial Summary
Coal Mining Adjusted EBITDA(1) and Avg. Sales
Price/Ton(2)
($ in millions, except per ton amounts)
$165 $166
$127 $123
$118 (4) cost
$143 $144 (3)
$121 $114 price $120
$27 $16
($12) ($6) ($6)
$11 $6 ($5) ($3) ($3)
Q3 ‘12 Q4 ‘12 Q1 ‘13 Q2 ‘13 Q3 ‘13
Coal Adjusted EBITDA Average Sales Price
Coal Adj EBITDA / ton Coal Cash Cost / ton
Coal Sales, Production and Purchases
Q3 ‘12 Q4 ‘12 Q1 ‘13 Q2 ‘13 Q3 ‘13
Coal Sales
392 371 373 457 433
Coal Production
349 351 349 367 350
Purchased Coal
10 9 18 91 110
Reject Rate (%)
67 66 66 70 70
(1) For a definition and a reconciliation of Adjusted EBITDA, please see the appendix.
(2) Avg. Sales Price is weighted avg. price for all sales, including to affiliates and Jewell Coke.
(3) Excludes Black Lung liability charge of $0.8 million and accrued potential fines and penalties of $1.5 million.
(4) Excludes the benefit of a $0.4 million decline in accrued potential fines and penalties.
Q3 2013 Adjusted EBITDA down $13.3 million
Driven by ~$46 per ton decline in average price, partially offset by lower cash cost per ton
Excluding favorable prior year contingent consideration adjustment of $3.2M, Adj. EBITDA down $10.1M
$20 per ton reduction in cash costs reflect ongoing focus on Coal Action Plan
Recognize benefit of prior years’ investment in mine planning, equipment and training
Production flat on fewer operating mines and reduced staffing
Cash cost increase vs. Q2 due to lower volumes at HKCC/Revelation
Anticipate FY 2013 Adjusted EBITDA of
($10) - ($15) million
Assessing potential for new prep plant to further reduce cash costs by ~$10/ton and de-link coke and coal operations
SXC Q3 2013 Earnings Call 10
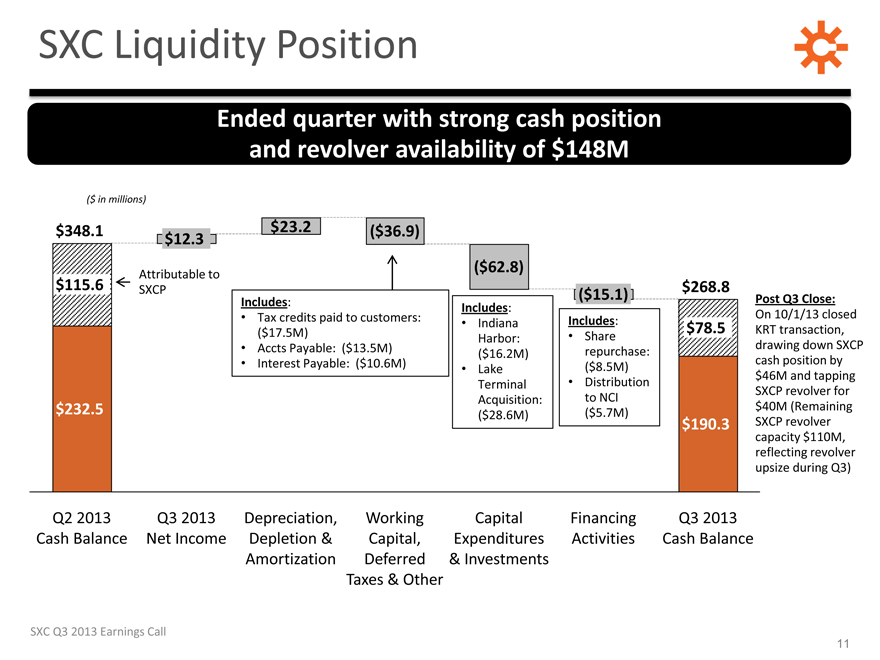
SXC Liquidity Position
Ended quarter with strong cash position and revolver availability of $148M
($ in millions)
($ in millions) $348.1 $115.6 $232.5 Q2 2013 Cash Balance
$12.3 Attributable to SXCP Q3 2013 Net Income
$23.2 ($36.9) ($62.8) ($15.1) Includes: Tax credits paid to customers: ($17.5M) Accts Payable: ($13.5M) Interest Payable: ($10.6M) Depreciation, Depletion & Amortization
Working Capital, Deferred Taxes & Other
Includes: Indiana Harbor: ($16.2M) Lake Terminal Acquisition: ($28.6M) Capital Expenditures & Investments
Includes: Share repurchase: ($8.5M) Distribution to NCI ($5.7M) Financing Activities
$268.8 $78.5 $190.3 Q3 2013 Cash Balance
Post Q3 Close: On 10/1/13 closed KRT transaction, drawing down SXCP cash position by $46M and tapping SXCP revolver for $40M (Remaining SXCP revolver capacity $110M, reflecting revolver upsize during Q3)
SXC Q3 2013 Earnings Call
11
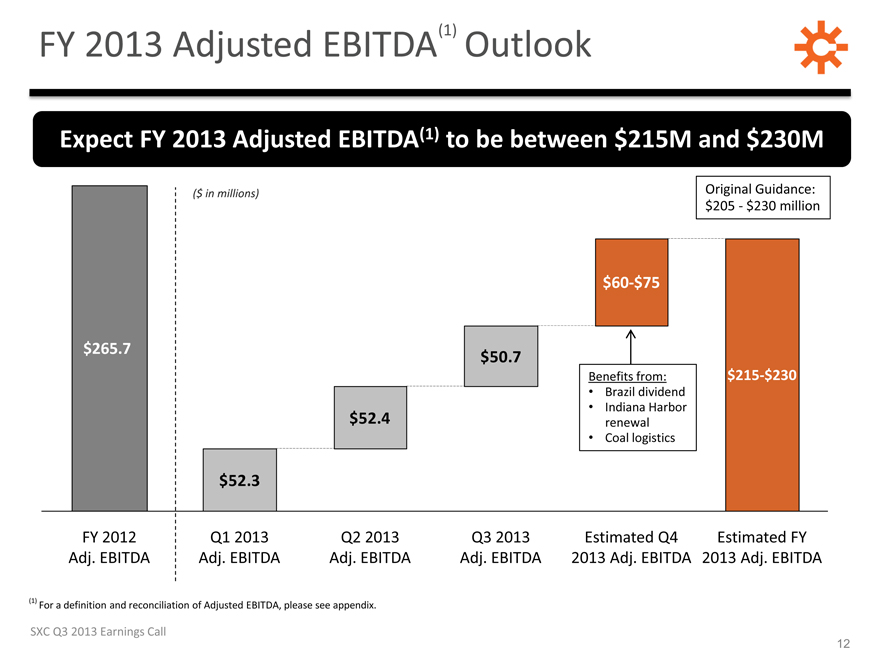
FY 2013 Adjusted EBITDA (1) Outlook
Expect FY 2013 Adjusted EBITDA(1) to be between $215M and $230M
| | | | | | | | | | |
| | | ($ in millions) | | | | | | | | Original Guidance: $205 - $230 million |
| | | | | | | | | $60-$75 | | |
$265.7 | | | | | | $50.7 | | | | |
| | | | | | | | | Benefits from: | | $215-$230 |
| | | | | | | | | Brazil dividend | | |
| | | | | $52.4 | | | | Indiana Harbor renewal | | |
| | | | | | | | | Coal logistics | | |
| | | $52.3 | | | | | | | | |
FY 2012 Adj. EBITDA | | Q1 2013 Adj. EBITDA | | Q2 2013 Adj. EBITDA | | Q3 2013 Adj. EBITDA | | Estimated Q4 2013 Adj. EBITDA | | Estimated FY 2013 Adj. EBITDA |
(1) For a definition and reconciliation of Adjusted EBITDA, please see appendix.
SXC Q3 2013 Earnings Call
12
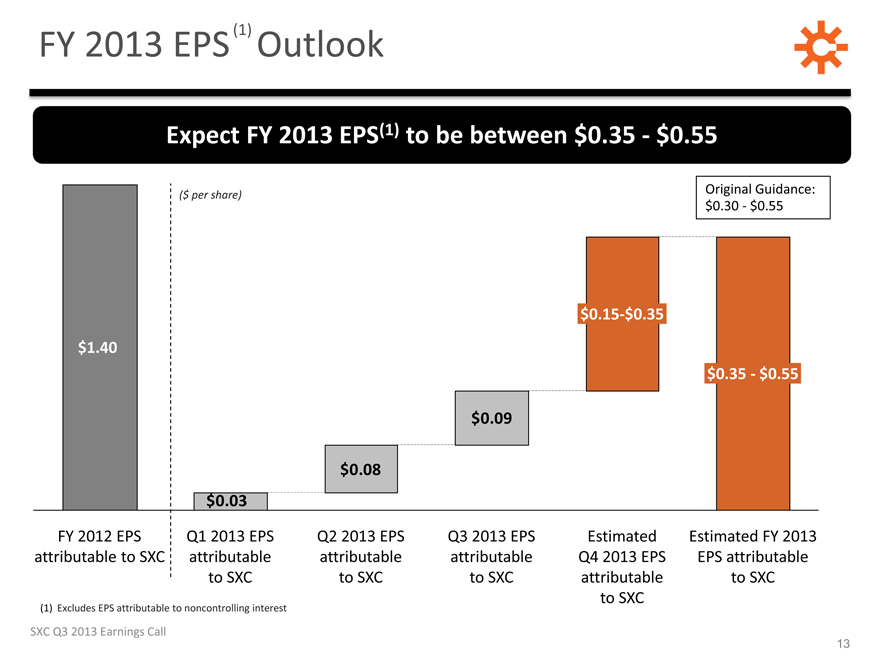
FY 2013 EPS (1) Outlook
Expect FY 2013 EPS(1) to be between $0.35 - $0.55
| | | | | | | | | | |
| | | ($ per share) | | | | | | | | Original Guidance: |
| | | | | | | | | | | $0.30 - $0.55 |
| | | | | | | | | $0.15-$0.35 | | |
$1.40 | | | | | | | | | | |
| | | | | | | | | | | $0.35 - $0.55 |
| | | | | | | $0.09 | | | | |
| | | | | $0.08 | | | | | | |
| | | $0.03 | | | | | | | | |
FY 2012 EPS attributable to SXC | | Q1 2013 EPS attributable to SXC | | Q2 2013 EPS attributable to SXC | | Q3 2013 EPS attributable to SXC | | Estimated Q4 2013 EPS attributable to SXC | | Estimated FY 2013 EPS attributable to SXC |
(1) Excludes EPS attributable to noncontrolling interest
SXC Q3 2013 Earnings Call
13
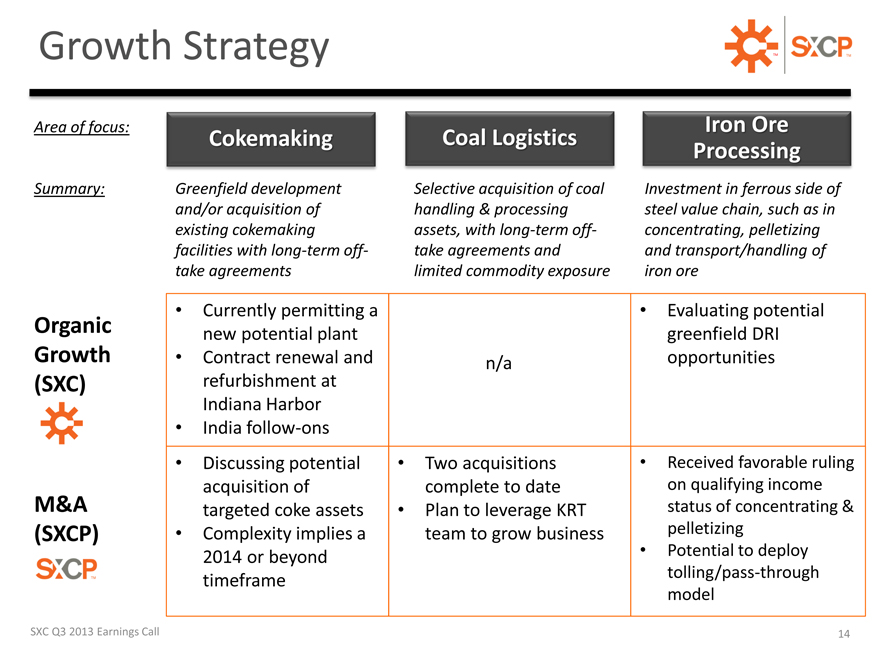
Growth Strategy
| | | | | | |
Area of focus: | | Cokemaking | | Coal Logistics | | Iron Ore Processing |
Summary: | | Greenfield development and/or acquisition of existing cokemaking facilities with long-term off-take agreements | | Selective acquisition of coal handling & processing assets, with long-term off-take agreements and limited commodity exposure | | Investment in ferrous side of steel value chain, such as in concentrating, pelletizing and transport/handling of iron ore |
| | | Currently permitting a new potential plant | | | | Evaluating potential greenfield DRI opportunities |
Organic Growth (SXC) | | Contract renewal and refurbishment at Indiana Harbor | | n/a | | |
| | | India follow-ons | | | | |
| | | Discussing potential acquisition of targeted coke assets | | Two acquisitions complete to date | | Received favorable ruling on qualifying income status of concentrating & pelletizing |
M&A (SXCP) | | Complexity implies a 2014 or beyond timeframe | | Plan to leverage KRT team to grow business | | Potential to deploy tolling/pass-through model |
SXC Q3 2013 Earnings Call
14

QUESTIONS
SunCoke Energy TM
SXC Q3 2013 Earnings Call
15

Investor Relations:
630-824-1907
www.suncoke.com
SunCoke Energy TM

APPENDIX
SunCoke Energy TM
SXC Q3 2013 Earnings Call
17
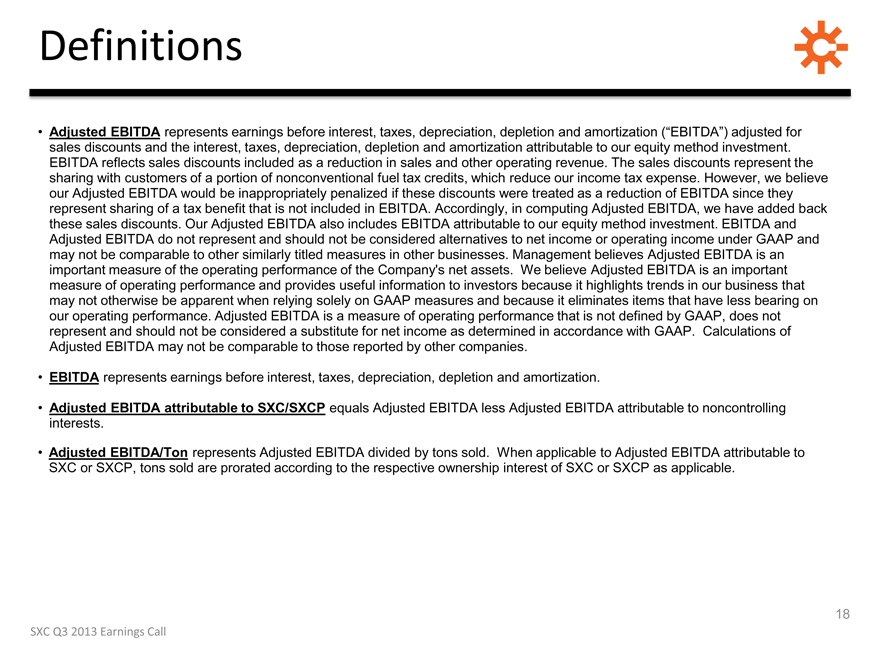
Adjusted EBITDA represents earnings before interest, taxes, depreciation, depletion and amortization (“EBITDA”) adjusted for sales discounts and the interest, taxes, depreciation, depletion and amortization attributable to our equity method investment.
EBITDA reflects sales discounts included as a reduction in sales and other operating revenue. The sales discounts represent the sharing with customers of a portion of nonconventional fuel tax credits, which reduce our income tax expense. However, we believe our Adjusted EBITDA would be inappropriately penalized if these discounts were treated as a reduction of EBITDA since they represent sharing of a tax benefit that is not included in EBITDA. Accordingly, in computing Adjusted EBITDA, we have added back these sales discounts. Our Adjusted EBITDA also includes EBITDA attributable to our equity method investment. EBITDA and Adjusted EBITDA do not represent and should not be considered alternatives to net income or operating income under GAAP and may not be comparable to other similarly titled measures in other businesses. Management believes Adjusted EBITDA is an important measure of the operating performance of the Company’s net assets. We believe Adjusted EBITDA is an important measure of operating performance and provides useful information to investors because it highlights trends in our business that may not otherwise be apparent when relying solely on GAAP measures and because it eliminates items that have less bearing on our operating performance. Adjusted EBITDA is a measure of operating performance that is not defined by GAAP, does not represent and should not be considered a substitute for net income as determined in accordance with GAAP. Calculations of Adjusted EBITDA may not be comparable to those reported by other companies.
EBITDA represents earnings before interest, taxes, depreciation, depletion and amortization.
Adjusted EBITDA attributable to SXC/SXCP equals Adjusted EBITDA less Adjusted EBITDA attributable to noncontrolling interests.
Adjusted EBITDA/Ton represents Adjusted EBITDA divided by tons sold. When applicable to Adjusted EBITDA attributable to SXC or SXCP, tons sold are prorated according to the respective ownership interest of SXC or SXCP as applicable.
18
SXC Q3 2013 Earnings Call
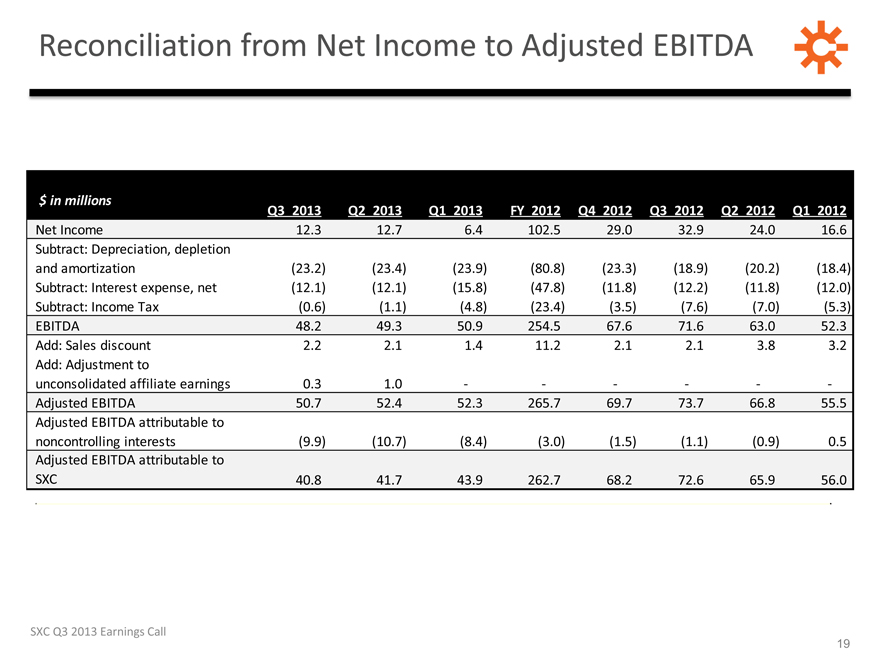
Reconciliation from Net Income to Adjusted EBITDA
| | | | | | | | | | | | | | | | | | | | | | | | | | | | | | | | |
$ in millions | | Q3 | | 2013 | | Q2 | | 2013 | | Q1 | | 2013 | | FY | | 2012 | | Q4 | | 2012 | | Q3 | | 2012 | | Q2 | | 2012 | | Q1 | | 2012 |
Net Income | | | | 12.3 | | | | 12.7 | | | | 6.4 | | | | 102.5 | | | | 29.0 | | | | 32.9 | | | | 24.0 | | | | 16.6 |
Subtract: Depreciation, depletion and amortization | | | | (23.2) | | | | (23.4) | | | | (23.9) | | | | (80.8) | | | | (23.3) | | | | (18.9) | | | | (20.2) | | | | (18.4) |
Subtract: Interest expense, net | | | | (12.1) | | | | (12.1) | | | | (15.8) | | | | (47.8) | | | | (11.8) | | | | (12.2) | | | | (11.8) | | | | (12.0) |
Subtract: Income Tax | | | | (0.6) | | | | (1.1) | | | | (4.8) | | | | (23.4) | | | | (3.5) | | | | (7.6) | | | | (7.0) | | | | (5.3) |
EBITDA | | | | 48.2 | | | | 49.3 | | | | 50.9 | | | | 254.5 | | | | 67.6 | | | | 71.6 | | | | 63.0 | | | | 52.3 |
Add: Sales discount | | | | 2.2 | | | | 2.1 | | | | 1.4 | | | | 11.2 | | | | 2.1 | | | | 2.1 | | | | 3.8 | | | | 3.2 |
Add: Adjustment to unconsolidated affiliate earnings | | | | 0.3 | | | | 1.0 | | | | - | | | | - | | | | - | | | | - | | | | - | | | | - |
Adjusted EBITDA | | | | 50.7 | | | | 52.4 | | | | 52.3 | | | | 265.7 | | | | 69.7 | | | | 73.7 | | | | 66.8 | | | | 55.5 |
Adjusted EBITDA attributable to noncontrolling interests | | | | (9.9) | | | | (10.7) | | | | (8.4) | | | | (3.0) | | | | (1.5) | | | | (1.1) | | | | (0.9) | | | | 0.5 |
Adjusted EBITDA attributable to SXC | | | | 40.8 | | | | 41.7 | | | | 43.9 | | | | 262.7 | | | | 68.2 | | | | 72.6 | | | | 65.9 | | | | 56.0 |
SXC Q3 2013 Earnings Call
19
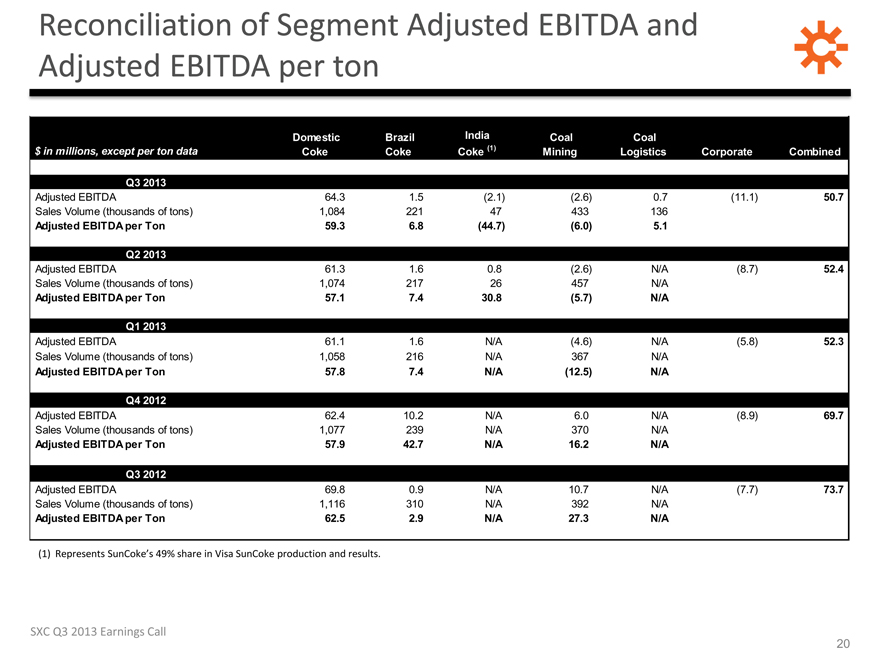
Reconciliation of Segment Adjusted EBITDA and Adjusted EBITDA per ton
| | | | | | | | | | | | | | |
$ in millions, except per ton data Q3 2013 Adjusted EBITDA Sales Volume (thousands of tons) Adjusted EBITDA per Ton Q2 2013 Adjusted EBITDA Sales Volume (thousands of tons) Adjusted EBITDA per Ton Q1 2013 Adjusted EBITDA Sales Volume (thousands of tons) Adjusted EBITDA per Ton Q4 2012 Adjusted EBITDA Sales Volume (thousands of tons) Adjusted EBITDA per Ton Q3 2012 Adjusted EBITDA Sales Volume (thousands of tons) Adjusted EBITDA per Ton | | Domestic
Coke
64.3
1,084
59.3 61.3
1,074
57.1 61.1
1,058
57.8 62.4
1,077
57.9 69.8
1,116
62.5 | | Brazil
Coke
1.5
221
6.8
1.6
217
7.4
1.6
216
7.4
10.2
239
42.7
0.9
310
2.9 | | India Coke (1)
(2.1)
47
(44.7)
0.8
26
30.8
N/A
N/A
N/A
N/A
N/A
N/A
N/A
N/A
N/A | | Coal
Mining
(2.6)
433
(6.0)
(2.6)
457
(5.7)
(4.6)
367
(12.5)
6.0
370
16.2
10.7
392
27.3 | | Coal
Logistics
0.7 136
5.1 N/A
N/A N/
A N/A
N/A N/
A N/A
N/A N/
A N/A
N/A N/
A | | Corporate
(11.1)
(8.7)
(5.8)
(8.9)
(7.7) | | Combined
50.7 52.4
52.3 69.7
73.7 |
(1) Represents SunCoke’s 49% share in Visa SunCoke production and results.
SXC Q3 2013 Earnings Call
20
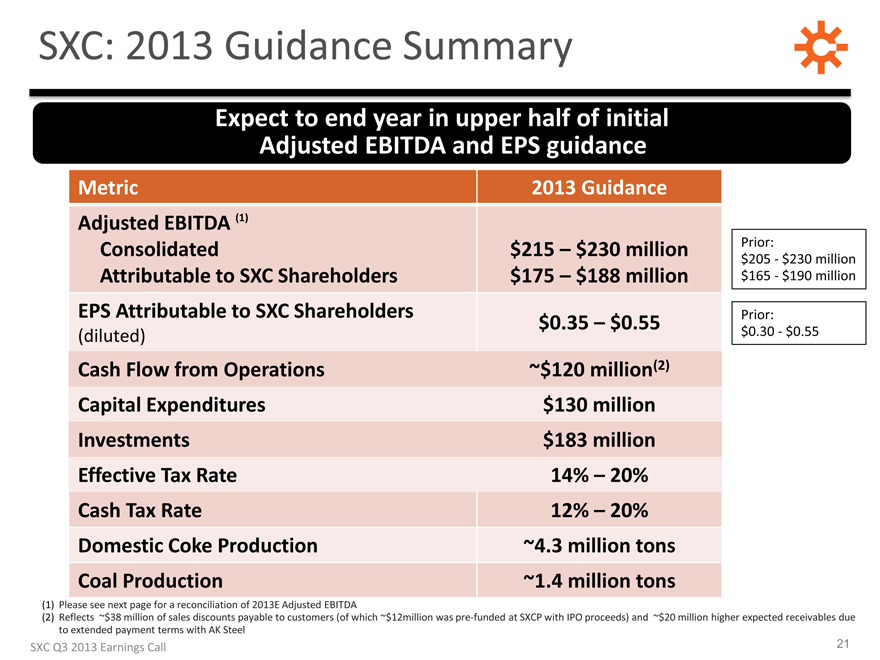
SXC: 2013 Guidance Summary
Expect to end year in upper half of initial Adjusted EBITDA and EPS guidance
| | |
Metric Adjusted EBITDA (1) Consolidated Attributable to SXC Shareholders EPS Attributable to SXC Shareholders (diluted) Cash Flow from Operations Capital Expenditures Investments Effective Tax Rate Cash Tax Rate Domestic Coke Production Coal Production | | 2013 Guidance $215 – $230 million $175 – $188 million $0.35 – $0.55 ~$120 million(2) $130 million $183 million 14% – 20% 12% – 20% ~4.3 million tons ~1.4 million tons |
Prior:
$205 - $ 230 million
Prior:
$0.30 - $ 0.55
(1) Please see next page for a reconciliation of 2013E Adjusted EBITDA
(2) Reflects ~$38 million of sales discounts payable to customers (of which ~$12million was pre-funded at SXCP with IPO proceeds) and ~$20 million higher expected receivables due to extended payment terms with AK Steel
SXC Q3 2013 Earnings Call
21
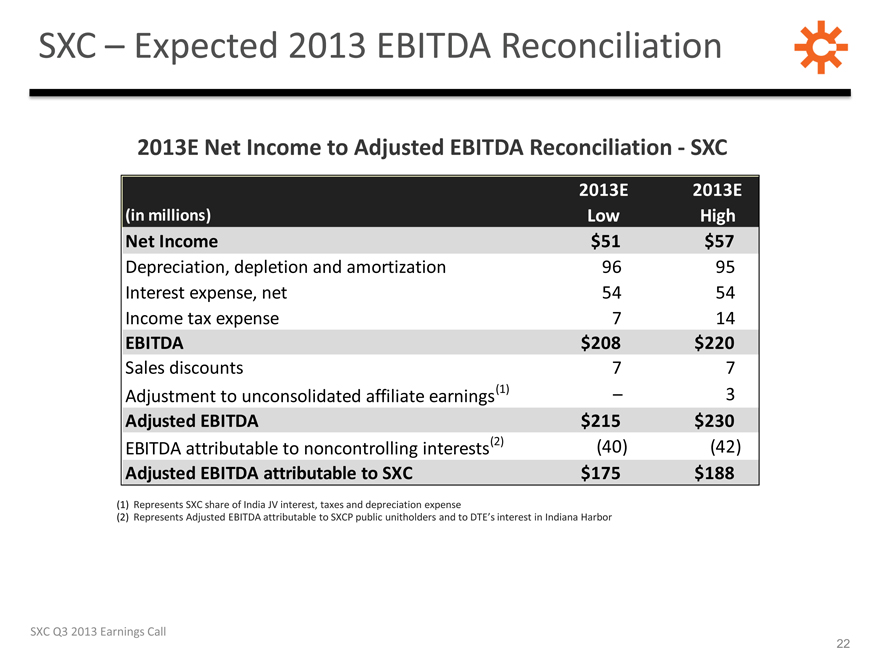
SXC — Expected 2013 EBITDA Reconciliation
2013E Net Income to Adjusted EBITDA Reconciliation - SXC
| | | | |
(in millions) | | 2013E Low | | 2013E High |
Net Income | | $51 | | $57 |
Depreciation, depletion and amortization | | 96 | | 95 |
Interest expense, net | | 54 | | 54 |
Income tax expense | | 7 | | 14 |
EBITDA | | $208 | | $220 |
Sales discounts | | 7 | | 7 |
Adjustment to unconsolidated affiliate earnings(1) | | – | | 3 |
Adjusted EBITDA | | $215 | | $230 |
EBITDA attributable to noncontrolling interests(2) | | (40) | | (42) |
Adjusted EBITDA attributable to SXC | | $175 | | $188 |
(1) Represents SXC share of India JV interest, taxes and depreciation expense
(2) Represents Adjusted EBITDA attributable to SXCP public unitholders and to DTE’s interest in Indiana Harbor
SXC Q3 2013 Earnings Call
22
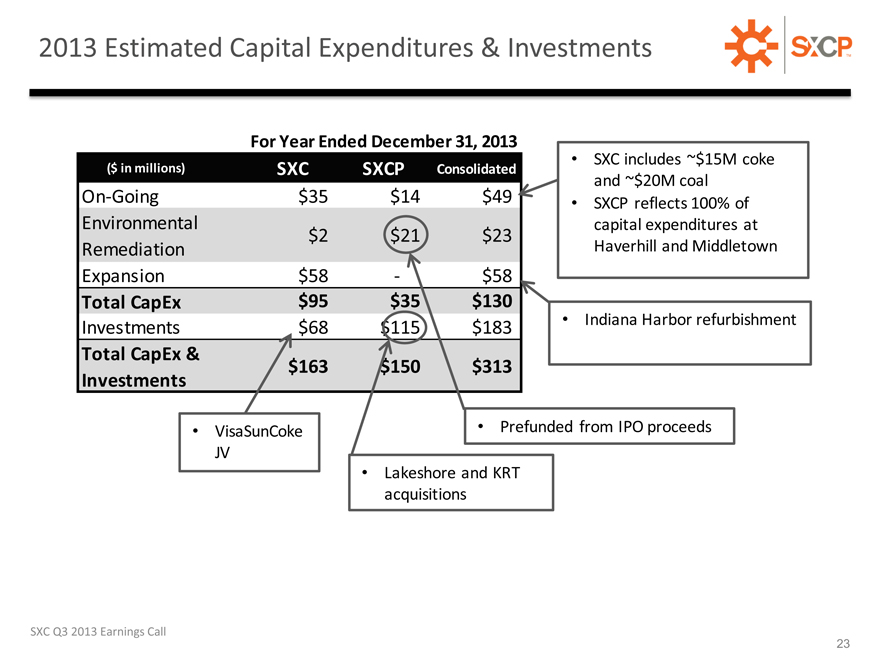
2013 Estimated Capital Expenditures & Investments SXCP
For Year Ended December 31, 2013
| | | | | | |
($ in millions) | | SXC | | SXCP | | Consolidated |
On-Going | | $35 | | $14 | | $49 |
Environmental Remediation | | $2 | | $21 | | $23 |
Expansion | | $58 | | - | | $58 |
Total CapEx | | $95 | | $35 | | $130 |
Investments | | $68 | | $115 | | $183 |
Total CapEx & Investments | | $163 | | $150 | | $313 |
SXC includes ~$15M coke and ~$20M coal
SXCP reflects 100% of capital expenditures at Haverhill and Middletown
Indiana Harbor refurbishment
Prefunded from IPO proceeds
Lakeshore and KRT acquisitions
VisaSunCoke JV
SXC Q3 2013 Earnings Call
23