|
Exhibit 99.2 
|
SunCoke Energy, Inc.
Q1 2014 Earnings
Conference Call
April 24, 2014
Exhibit 99.2
Forward-Looking Statements
This slide presentation should be reviewed in conjunction with the First Quarter 2014 earnings release of SunCoke Energy, Inc. (SunCoke) and the conference call held on April 24, 2014 at 9:45 a.m. ET.
Some of the information included in this presentation constitutes “forward-looking statements” as defined in Section 27A of the Securities Act of 1933, as amended and Section 21E of the Securities Exchange Act of 1934, as amended. All statements in this presentation that express opinions, expectations, beliefs, plans, objectives, assumptions or projections with respect to anticipated future performance of SunCoke or the Partnership, in contrast with statements of historical facts, are forward-looking statements. Such forward-looking statements are based on management’s beliefs and assumptions and on information currently available. Forward-looking statements include information concerning possible or assumed future results of operations, business strategies, financing plans, competitive position, potential growth opportunities, potential operating performance improvements, the effects of competition and the effects of future legislation or regulations. Forward-looking statements include all statements that are not historical facts and may be identified by the use of forward-looking terminology such as the words “believe,” “expect,” “plan,” “intend,” “anticipate,” “estimate,” “predict,” “potential,” “continue,” “may,” “will,” “should” or the negative of these terms or similar expressions.
Although management believes that its plans, intentions and expectations reflected in or suggested by the forward-looking statements made in this presentation are reasonable, no assurance can be given that these plans, intentions or expectations will be achieved when anticipated or at all. Moreover, such statements are subject to a number of assumptions, risks and uncertainties. Many of these risks are beyond the control of SunCoke and the Partnership, and may cause actual results to differ materially from those implied or expressed by the forward-looking statements. Each of SunCoke and the Partnership has included in its filings with the Securities and Exchange Commission cautionary language identifying important factors (but not necessarily all the important factors) that could cause actual results to differ materially from those expressed in any forward-looking statement. For more information concerning these factors, see the Securities and Exchange Commission filings of SunCoke and the Partnership. All forward-looking statements included in this presentation are expressly qualified in their entirety by such cautionary statements. Although forward-looking statements are based on current beliefs and expectations, caution should be taken not to place undue reliance on any such forward-looking statements because such statements speak only as of the date hereof. SunCoke and the Partnership do not have any intention or obligation to update publicly any forward-looking statement (or its associated cautionary language) whether as a result of new information or future events or after the date of this presentation, except as required by applicable law.
This presentation includes certain non-GAAP financial measures intended to supplement, not substitute for, comparable GAAP measures. Reconciliations of non-GAAP financial measures to GAAP financial measures are provided in the Appendix at the end of the presentation. Investors are urged to consider carefully the comparable GAAP measures and the reconciliations to those measures provided in the Appendix.
SXC Q1 2014 Earnings Call
1
Q1 2014 Earnings Overview
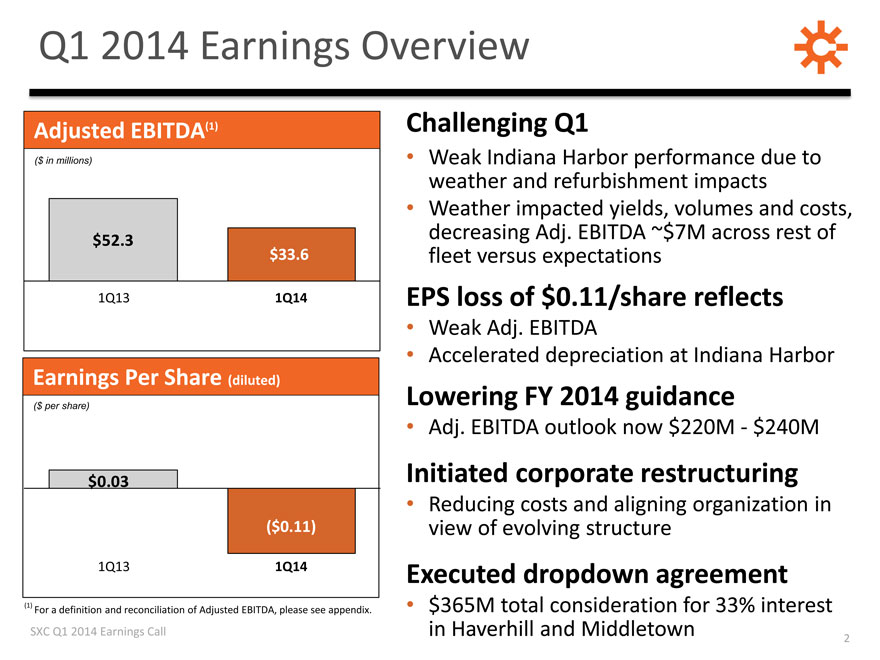
Adjusted EBITDA(1)
($ in millions)
$52.3
$33.6
1Q13 1Q14
Earnings Per Share (diluted)
($ per share)
$0.03
($0.11)
1Q13 1Q14
Challenging Q1
Weak Indiana Harbor performance due to weather and refurbishment impacts Weather impacted yields, volumes and costs, decreasing Adj. EBITDA ~$7M across rest of fleet versus expectations
EPS loss of $0.11/share reflects
Weak Adj. EBITDA
Accelerated depreciation at Indiana Harbor
Lowering FY 2014 guidance
Adj. EBITDA outlook now $220M—$240M
Initiated corporate restructuring
Reducing costs and aligning organization in view of evolving structure
Executed dropdown agreement
$365M total consideration for 33% interest in Haverhill and Middletown
(1)
For a definition and reconciliation of Adjusted EBITDA, please see appendix.
SXC Q1 2014 Earnings Call
2
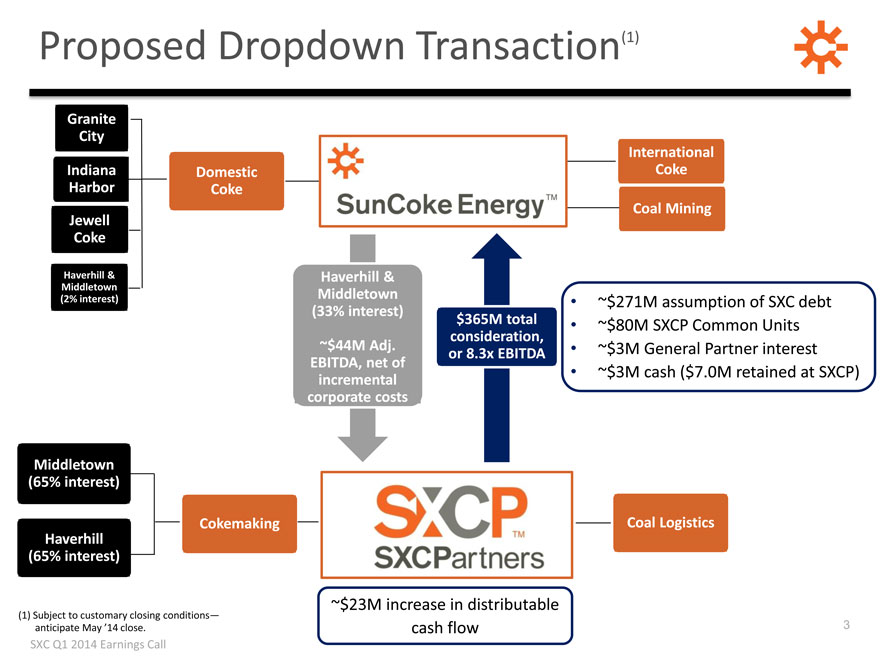
Proposed Dropdown Transaction(1)
Granite
City
International
Indiana Domestic Coke
Harbor Coke
Coal Mining
Jewell
Coke
Haverhill & Haverhill &
Middletown Middletown
(2% interest) ~$271M assumption of SXC debt
(33% interest)
$365M total ~$80M SXCP Common Units
consideration,
~$44M Adj. or 8.3x EBITDA ~$3M General Partner interest
EBITDA, net of ~$3M cash ($7.0M retained at SXCP)
incremental
corporate costs
Middletown
(65% interest)
Cokemaking Coal Logistics
Haverhill
(65% interest)
(1) Subject to customary closing conditions—anticipate May ’14 close.
SXC Q1 2014 Earnings Call
~$23M increase in distributable cash flow
3
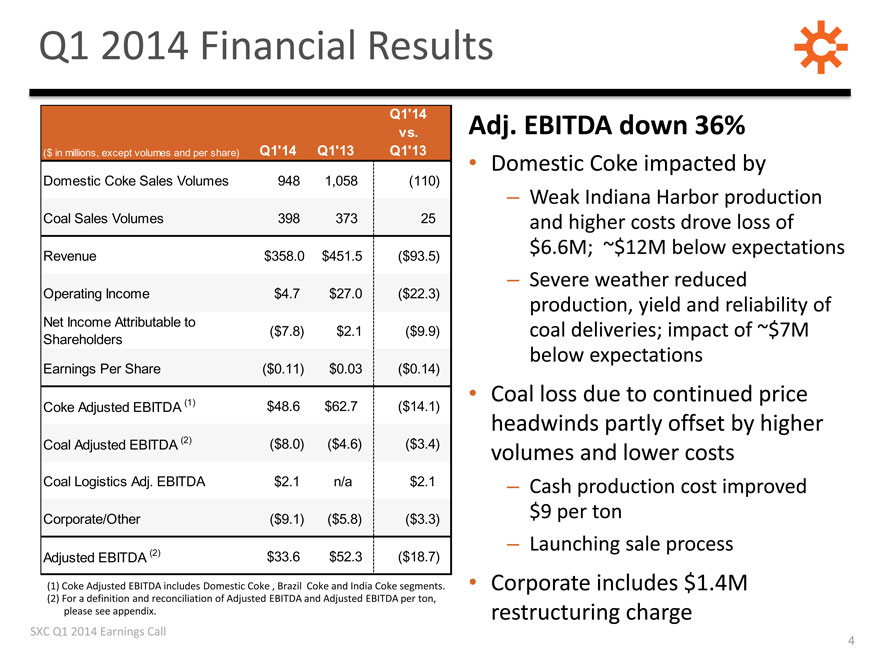
Q1 2014 Financial Results
Q1’14
vs.
($ in millions, except volumes and per share) Q1’14 Q1’13 Q1’13
Domestic Coke Sales Volumes 948 1,058(110)
Coal Sales Volumes 398 373 25
Revenue $358.0 $451.5($93.5)
Operating Income $4.7 $27.0($22.3)
Net Income Attributable to
Shareholders($7.8) $2.1($9.9)
Earnings Per Share($0.11) $0.03($0.14)
Coke Adjusted EBITDA (1) $48.6 $62.7($14.1)
Coal Adjusted EBITDA (2)($8.0)($4.6)($3.4)
Coal Logistics Adj. EBITDA $2.1 n/a $2.1
Corporate/Other($9.1)($5.8)($3.3)
Adjusted EBITDA (2) $33.6 $52.3($18.7)
(1) Coke Adjusted EBITDA includes Domestic Coke , Brazil Coke and India Coke segments.
(2) For a definition and reconciliation of Adjusted EBITDA and Adjusted EBITDA per ton, please see appendix.
SXC Q1 2014 Earnings Call
Adj. EBITDA down 36%
Domestic Coke impacted by
Weak Indiana Harbor production and higher costs drove loss of $6.6M; ~$12M below expectations Severe weather reduced production, yield and reliability of coal deliveries; impact of ~$7M below expectations
Coal loss due to continued price headwinds partly offset by higher volumes and lower costs
Cash production cost improved $9 per ton Launching sale process
Corporate includes $1.4M restructuring charge
4
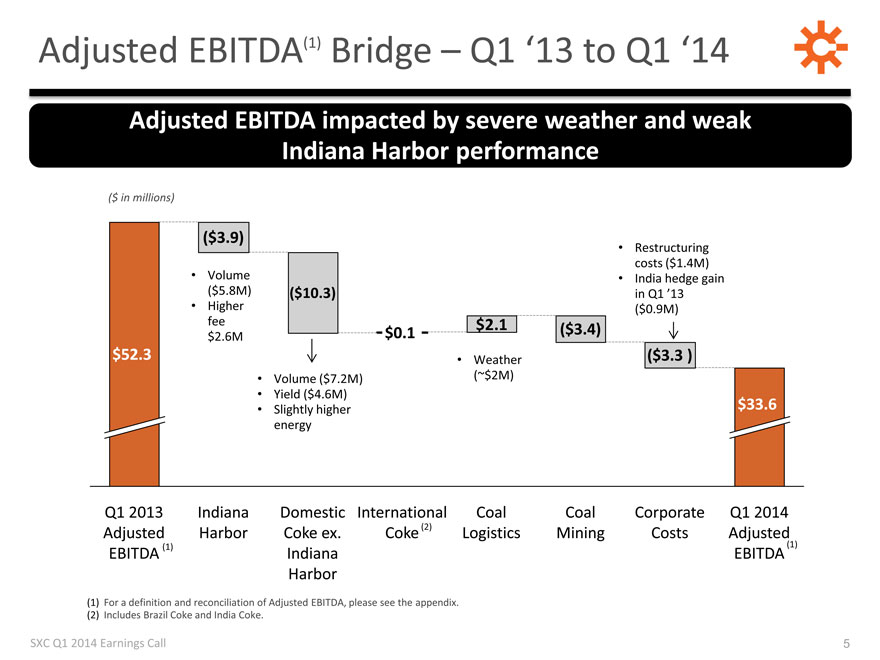
Adjusted EBITDA(1) Bridge – Q1 ‘13 to Q1 ‘14
Adjusted EBITDA impacted by severe weather and weak Indiana Harbor performance
($ in millions)
($3.9)
Restructuring
costs ($1.4M)
Volume India hedge gain
($5.8M)($10.3) in Q1 ’13
Higher($0.9M)
fee $0.1 $2.1($3.4)
$2.6M
$52.3 Weather($3.3 )
Volume ($7.2M)(~$2M)
Yield ($4.6M)
Slightly higher $33.6
energy
Q1 2013 Indiana Domestic International Coal Coal Corporate Q1 2014
Adjusted Harbor Coke ex. Coke (2) Logistics Mining Costs Adjusted
EBITDA (1) Indiana EBITDA (1)
Harbor
(1) For a definition and reconciliation of Adjusted EBITDA, please see the appendix.
(2) Includes Brazil Coke and India Coke.
SXC Q1 2014 Earnings Call
5
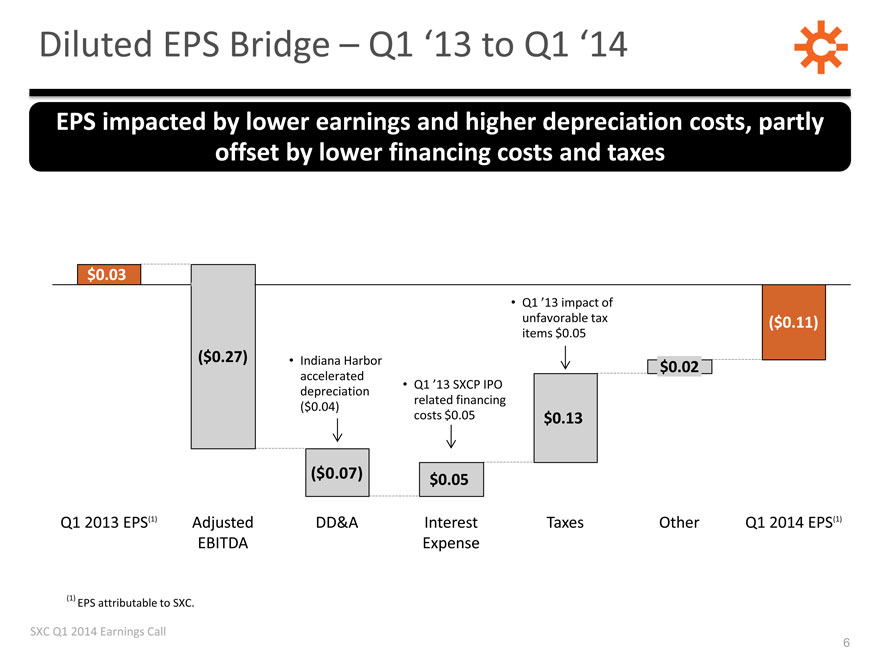
Diluted EPS Bridge – Q1 ‘13 to Q1 ‘14
EPS impacted by lower earnings and higher depreciation costs, partly offset by lower financing costs and taxes
$0.03
Q1 ’13 impact of
unfavorable tax($0.11)
items $0.05
($0.27) Indiana Harbor $0.02
accelerated
depreciation Q1 ’13 SXCP IPO
($0.04) related financing
costs $0.05 $0.13
($0.07) $0.05
Q1 2013 EPS(1) Adjusted DD&A Interest Taxes Other Q1 2014 EPS(1)
EBITDA Expense
(1)
EPS attributable to SXC.
SXC Q1 2014 Earnings Call
6
Domestic Coke Business Summary
Achieved Adjusted EBITDA per ton of $49 in Q1 2014, reflective of loss at Indiana Harbor
Domestic Coke Production Domestic Coke Adjusted EBITDA(1) Per Ton
(thousands of tons)
1,051 1,081 1,081 1,056 54/ton
158 153 944 $ 49/ton(2)
152 154
$61 $61 $64 $57 $47
171 176 150
167 172
153
290 297 295 291
264
264 276 273 255 $57
199 $47
178 179 184 184 178
Q1 ‘13 Q2 ‘13 Q3 ‘13 Q4 ‘13 Q1 ‘14
Q1 ‘13 Q2 ‘13 Q3 ‘13 Q4 ‘13 Q1 ‘14
Jewell Indiana Harbor Haverhill Granite City Middletown Adjusted EBITDA Adjusted EBITDA/ton
(1) For a definition of Adjusted EBITDA and Adjusted EBITDA/Ton and reconciliations, see appendix. (2) Includes Indiana Harbor Adjusted EBITDA loss of $6.6m, or ~$7 per ton.
SXC Q1 201 Earnings Call
7
Indiana Harbor Projects
Refurbishment project completed
(excluding PCM deliveries in Q3/Q4)
$104M capital cost includes replacement of doors, lentils, buckstays, tie rods, stacks and coke shed sections plus 2 new PCMs
In Q1, identified need for oven floor and sole flue replacement on ~80 ovens
Estimate additional ~$15M of capital and $5M of expense
Expect to recognize ~$10M accelerated depreciation of internal oven work Replaced floors and sole flues expected to last longer, require less maintenance and support higher production
Initial plan to scrap and replace 2 of 4 existing PCMs; now scrapping all 4
Anticipate additional accelerated depreciation of
~$8M
SXC Q1 2014 Earnings Call
8
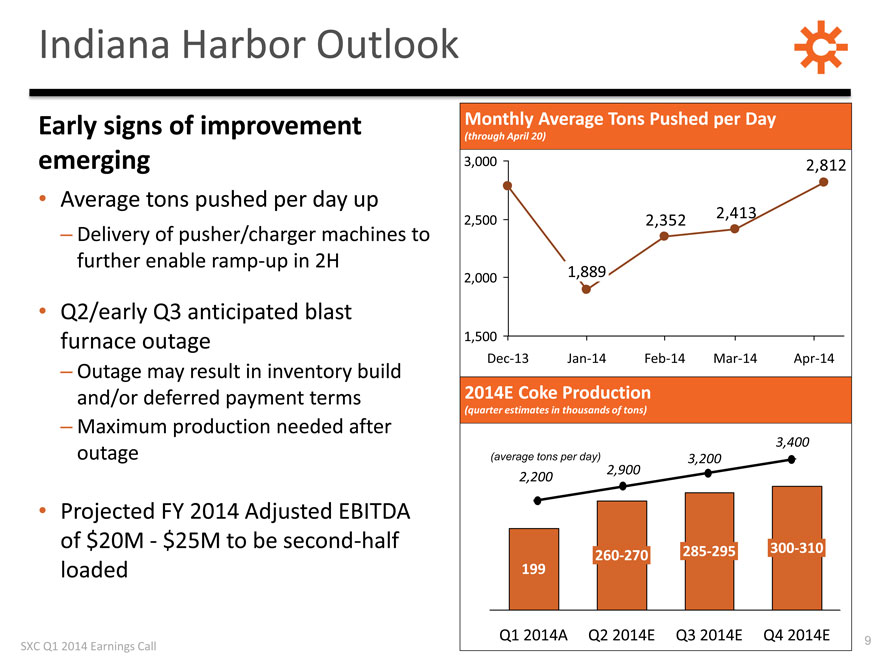
Indiana Harbor Outlook
Early signs of improvement emerging
Average tons pushed per day up
Delivery of pusher/charger machines to further enable ramp-up in 2H
Q2/early Q3 anticipated blast furnace outage
Outage may result in inventory build and/or deferred payment terms Maximum production needed after outage
Projected FY 2014 Adjusted EBITDA of $20M - $25M to be second-half loaded
SXC Q1 2014 Earnings Call
Monthly Average Tons Pushed per Day
(through April 20)
3,000 2,812
2,500 2,352 2,413
2,000 1,889
1,500
Dec-13 Jan-14 Feb-14 Mar-14 Apr-14
2014E Coke Production
(quarter estimates in thousands of tons)
3,400
(average tons per day) 3,200
2,200 2,900
260-270 285-295 300-310
199
Q1 2014A Q2 2014E Q3 2014E Q4 2014E
9
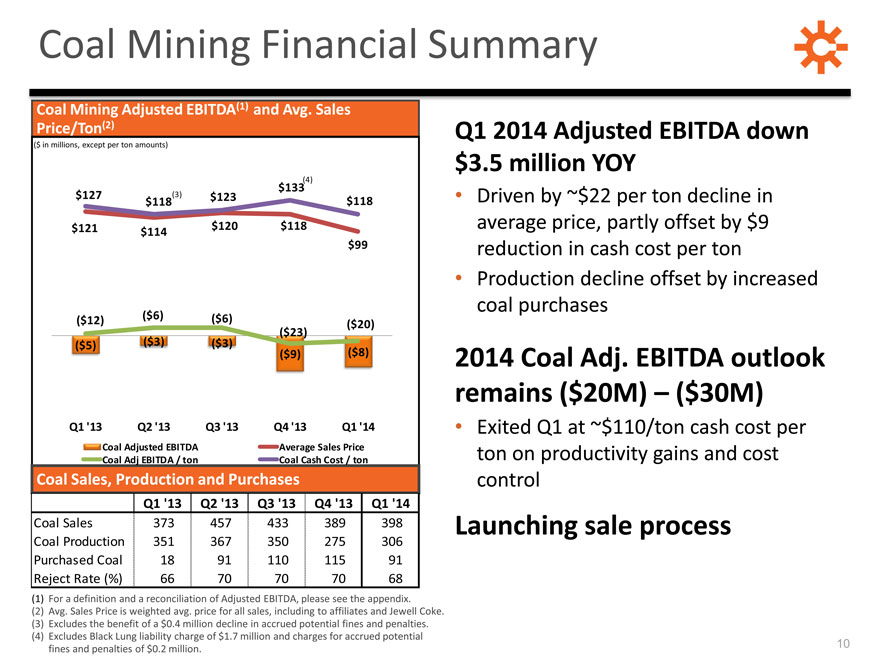
Coal Mining Financial Summary
Coal Mining Adjusted EBITDA(1) and Avg. Sales
Price/Ton(2)
($ in millions, except per ton amounts)
$133(4)
$127 $118(3) $123 $118
$121 $114 $120 $118
$99
($12)($6)($6)
($20)
($23)
($5)($3)($3)
($9)($8)
Q1 ‘13 Q2 ‘13 Q3 ‘13 Q4 ‘13 Q1 ‘14
Coal Adjusted EBITDA Average Sales Price
Coal Sales, Production and Purchases
Coal Adj EBITDA / ton Coal Cash Cost / ton
Q1 ‘13 Q2 ‘13 Q3 ‘13 Q4 ‘13 Q1 ‘14
Coal Sales 373 457 433 389 398
Coal Production 351 367 350 275 306
Purchased Coal 18 91 110 115 91
Reject Rate (%) 66 70 70 70 68
(1) For a definition and a reconciliation of Adjusted EBITDA, please see the appendix. (2) Avg. Sales Price is weighted avg. price for all sales, including to affiliates and Jewell Coke. (3) Excludes the benefit of a $0.4 million decline in accrued potential fines and penalties. (4) Excludes Black Lung liability charge of $1.7 million and charges for accrued potential fines and penalties of $0.2 million.
Q1 2014 Adjusted EBITDA down $3.5 million YOY
Driven by ~$22 per ton decline in average price, partly offset by $9 reduction in cash cost per ton Production decline offset by increased coal purchases
2014 Coal Adj. EBITDA outlook remains ($20M) – ($30M)
Exited Q1 at ~$110/ton cash cost per ton on productivity gains and cost control
Launching sale process
10
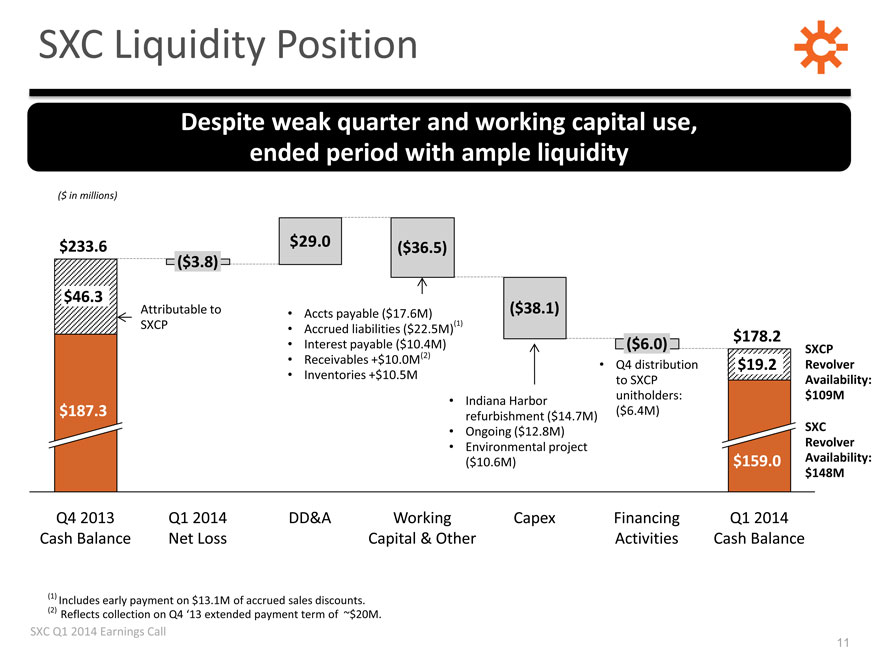
SXC Liquidity Position
Despite weak quarter and working capital use, ended period with ample liquidity
($ in millions)
$233.6 $29.0($36.5)
($3.8)
$46.3
Attributable to Accts payable ($17.6M)($38.1)
SXCP Accrued liabilities ($22.5M)(1)
$178.2
Interest payable ($10.4M)($6.0) SXCP
Receivables +$10.0M(2) Q4 distribution $19.2 Revolver
Inventories +$10.5M to SXCP Availability:
Indiana Harbor unitholders: $109M
$187.3 refurbishment ($14.7M)($6.4M)
Ongoing ($12.8M) SXC
Environmental project Revolver
($10.6M) $159.0 Availability:
$148M
Q4 2013 Q1 2014 DD&A Working Capex Financing Q1 2014
Cash Balance Net Loss Capital & Other Activities Cash Balance
(1) Includes early payment on $13.1M of accrued sales discounts.
(2) Reflects collection on Q4 ‘13 extended payment term of ~$20M.
SXC Q1 2014 Earnings Call
11
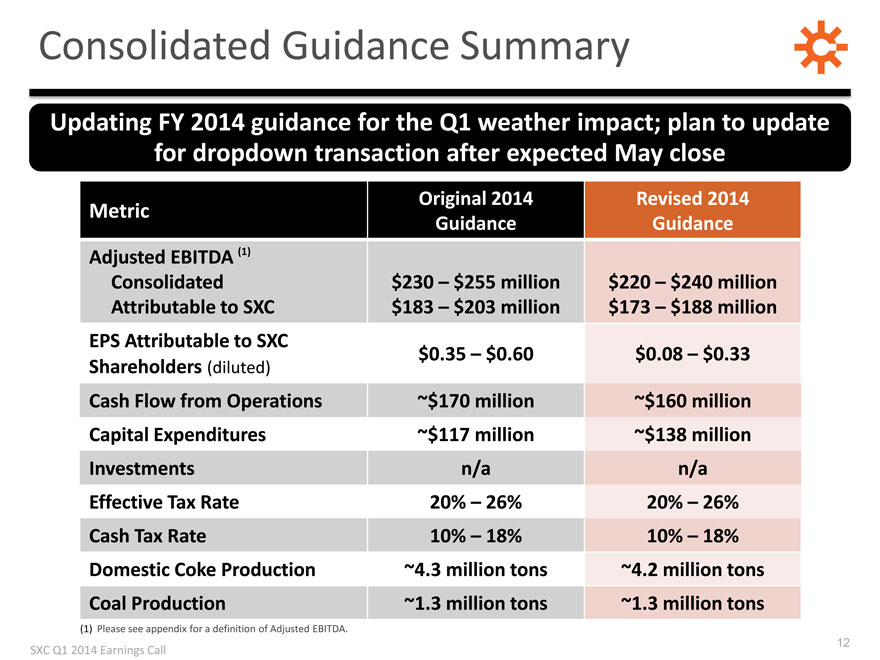
Consolidated Guidance Summary
Updating FY 2014 guidance for the Q1 weather impact; plan to update for dropdown transaction after expected May close
Original 2014 Revised 2014
Metric
Guidance Guidance
Adjusted EBITDA (1)
Consolidated $230 – $255 million $220 – $240 million
Attributable to SXC $183 – $203 million $173 – $188 million
EPS Attributable to SXC
$0.35 – $0.60 $0.08 – $0.33
Shareholders (diluted)
Cash Flow from Operations ~$170 million ~$160 million
Capital Expenditures ~$117 million ~$138 million
Investments n/a n/a
Effective Tax Rate 20% – 26% 20% – 26%
Cash Tax Rate 10% – 18% 10% – 18%
Domestic Coke Production ~4.3 million tons ~4.2 million tons
Coal Production ~1.3 million tons ~1.3 million tons
(1) Please see appendix for a definition of Adjusted EBITDA.
SXC Q1 2014 Earnings Call
12
Diluted EPS Bridge – FY 2014 Guidance Change
Updating FY 2014 guidance for weak Q1 results; plan to update for dropdown transaction after expected May close
~($0.18)
~$0.07
Original FY 2014 EBITDA Accelerated Interest Expense Taxes Current FY 2014
EPS Guidance (1) Depreciation at EPS Guidance(1)
Indiana Harbor
(2) | | After tax impact of earnings/DD&A attributable to SXC assuming assuming 23% effective tax rate. |
SXC Q1 2014 Earnings Call
13
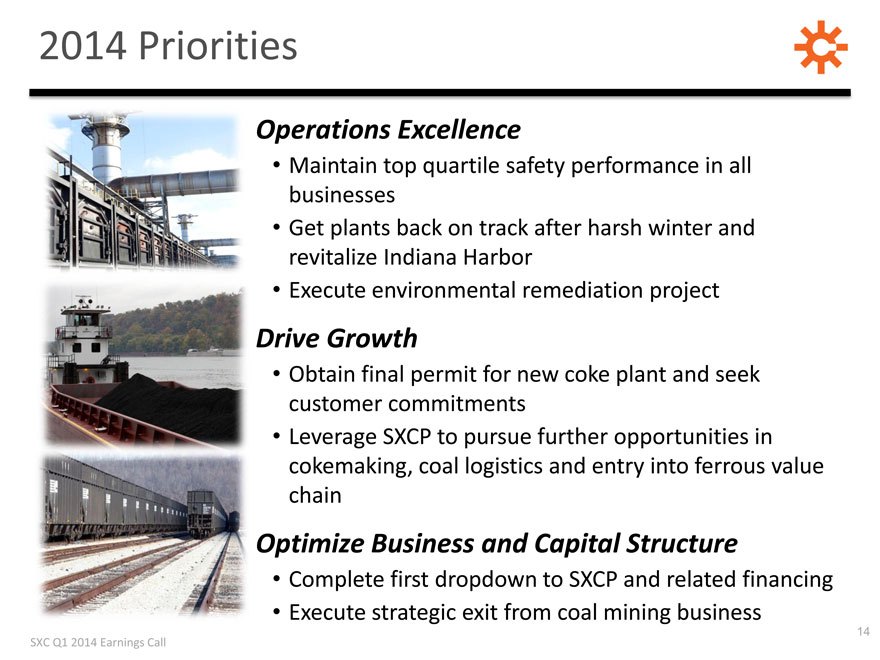
2014 Priorities
Operations Excellence
Maintain top quartile safety performance in all businesses Get plants back on track after harsh winter and revitalize Indiana Harbor Execute environmental remediation project
Drive Growth
Obtain final permit for new coke plant and seek customer commitments Leverage SXCP to pursue further opportunities in cokemaking, coal logistics and entry into ferrous value chain
Optimize Business and Capital Structure
Complete first dropdown to SXCP and related financing Execute strategic exit from coal mining business
SXC Q1 2014 Earnings Call
14
QUESTIONS
SXC Q1 2014 Earnings Call
15
Investor Relations: 630-824-1907 www.suncoke.com
APPENDIX
SXC Q1 2014 Earnings Call
17
Definitions
Adjusted EBITDA represents earnings before interest, taxes, depreciation, depletion and amortization (“EBITDA”) adjusted for sales discounts and the interest, taxes, depreciation, depletion and amortization attributable to our equity method investment. EBITDA reflects sales discounts included as a reduction in sales and other operating revenue. The sales discounts represent the sharing with customers of a portion of nonconventional fuel tax credits, which reduce our income tax expense. However, we believe our Adjusted EBITDA would be inappropriately penalized if these discounts were treated as a reduction of EBITDA since they represent sharing of a tax benefit that is not included in EBITDA. Accordingly, in computing Adjusted EBITDA, we have added back these sales discounts. Our Adjusted EBITDA also includes EBITDA attributable to our equity method investment. EBITDA and Adjusted EBITDA do not represent and should not be considered alternatives to net income or operating income under GAAP and may not be comparable to other similarly titled measures in other businesses. Management believes Adjusted EBITDA is an important measure of the operating performance of the Company’s net assets and provides useful information to investors because it highlights trends in our business that may not otherwise be apparent when relying solely on GAAP measures and because it eliminates items that have less bearing on our operating performance. Adjusted EBITDA is a measure of operating performance that is not defined by GAAP, does not represent and should not be considered a substitute for net income as determined in accordance with GAAP. Calculations of Adjusted EBITDA may not be comparable to those reported by other companies.
EBITDA represents earnings before interest, taxes, depreciation, depletion and amortization.
Adjusted EBITDA attributable to SXC/SXCP equals Adjusted EBITDA less Adjusted EBITDA attributable to noncontrolling interests.
Adjusted EBITDA/Ton represents Adjusted EBITDA divided by tons sold.
SXC Q1 2014 Earnings Call
18
India Coke
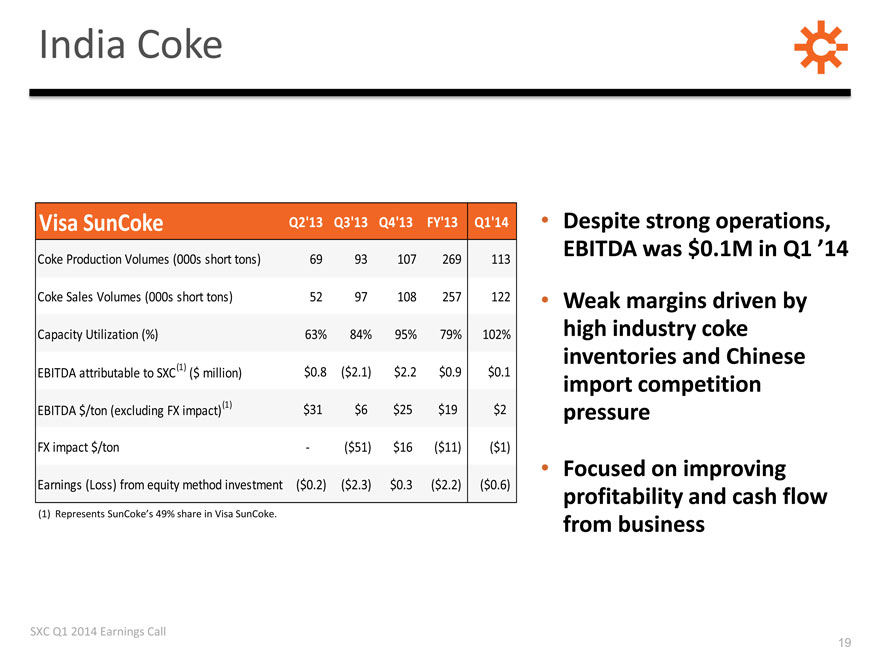
Visa SunCoke Q2’13 Q3’13 Q4’13 FY’13 Q1’14
Coke Production Volumes (000s short tons) 69 93 107 269 113
Coke Sales Volumes (000s short tons) 52 97 108 257 122
Capacity Utilization (%) 63% 84% 95% 79% 102%
EBITDA attributable to SXC (1) ($ million) $0.8($2.1) $2.2 $0.9 $0.1
EBITDA $/ton (excluding FX impact)(1) $31 $6 $25 $19 $2
FX impact $/ton -($51) $16($11)($1)
Earnings (Loss) from equity method investment($0.2)($2.3) $0.3($2.2)($0.6)
(1) Represents SunCoke’s 49% share in Visa SunCoke.
SXC Q1 2014 Earnings Call
Despite strong operations,
EBITDA was $0.1M in Q1 ’14
Weak margins driven by high industry coke inventories and Chinese import competition pressure Focused on improving profitability and cash flow from business
19
Reconciliation from Net Income to Adjusted EBITDA
$ in millions
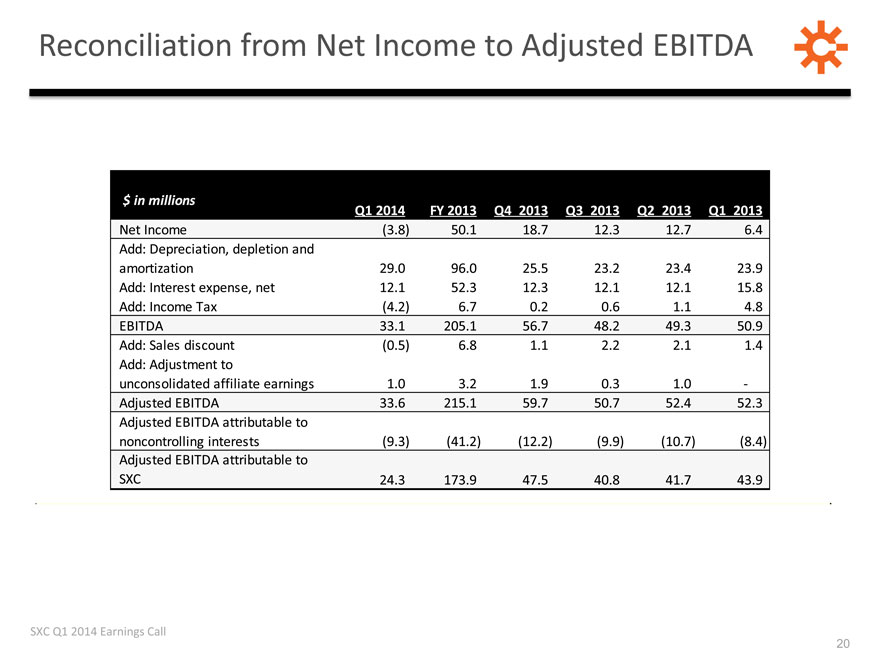
Q1 2014 FY 2013 Q4 2013 Q3 2013 Q2 2013 Q1 2013
Net Income(3.8) 50.1 18.7 12.3 12.7 6.4
Add: Depreciation, depletion and
amortization 29.0 96.0 25.5 23.2 23.4 23.9
Add: Interest expense, net 12.1 52.3 12.3 12.1 12.1 15.8
Add: Income Tax(4.2) 6.7 0.2 0.6 1.1 4.8
EBITDA 33.1 205.1 56.7 48.2 49.3 50.9
Add: Sales discount(0.5) 6.8 1.1 2.2 2.1 1.4
Add: Adjustment to
unconsolidated affiliate earnings 1.0 3.2 1.9 0.3 1.0 -
Adjusted EBITDA 33.6 215.1 59.7 50.7 52.4 52.3
Adjusted EBITDA attributable to
noncontrolling interests(9.3)(41.2)(12.2)(9.9)(10.7)(8.4)
Adjusted EBITDA attributable to
SXC 24.3 173.9 47.5 40.8 41.7 43.9
SXC Q1 2014 Earnings Call
20
Reconciliation of Segment Adjusted EBITDA and Adjusted EBITDA per ton
Domestic Brazil India Coal Coal
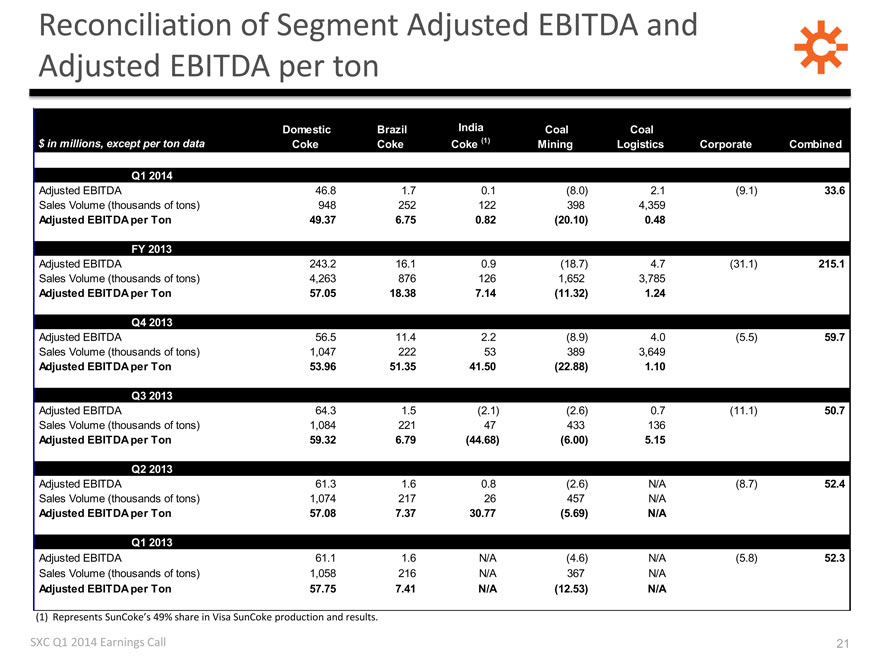
$ in millions, except per ton data Coke Coke Coke (1) Mining Logistics Corporate Combined
Q1 2014
Adjusted EBITDA 46.8 1.7 0.1(8.0) 2.1(9.1) 33.6
Sales Volume (thousands of tons) 948 252 122 398 4,359
Adjusted EBITDA per Ton 49.37 6.75 0.82(20.10) 0.48
FY 2013
Adjusted EBITDA 243.2 16.1 0.9(18.7) 4.7(31.1) 215.1
Sales Volume (thousands of tons) 4,263 876 126 1,652 3,785
Adjusted EBITDA per Ton 57.05 18.38 7.14(11.32) 1.24
Q4 2013
Adjusted EBITDA 56.5 11.4 2.2(8.9) 4.0(5.5) 59.7
Sales Volume (thousands of tons) 1,047 222 53 389 3,649
Adjusted EBITDA per Ton 53.96 51.35 41.50(22.88) 1.10
Q3 2013
Adjusted EBITDA 64.3 1.5(2.1)(2.6) 0.7(11.1) 50.7
Sales Volume (thousands of tons) 1,084 221 47 433 136
Adjusted EBITDA per Ton 59.32 6.79(44.68)(6.00) 5.15
Q2 2013
Adjusted EBITDA 61.3 1.6 0.8(2.6) N/A(8.7) 52.4
Sales Volume (thousands of tons) 1,074 217 26 457 N/A
Adjusted EBITDA per Ton 57.08 7.37 30.77(5.69) N/A
Q1 2013
Adjusted EBITDA 61.1 1.6 N/A(4.6) N/A(5.8) 52.3
Sales Volume (thousands of tons) 1,058 216 N/A 367 N/A
Adjusted EBITDA per Ton 57.75 7.41 N/A(12.53) N/A
(1) Represents SunCoke’s 49% share in Visa SunCoke production and results.
SXC Q1 2014 Earnings Call
21
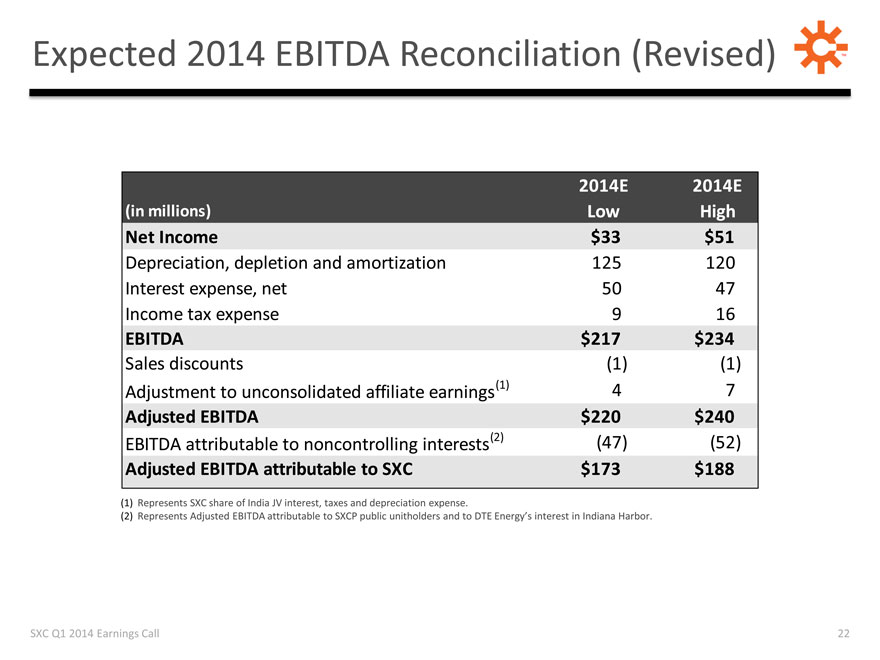
Expected 2014 EBITDA Reconciliation (Revised)
2014E 2014E
(in millions) Low High
Net Income $33 $51
Depreciation, depletion and amortization 125 120
Interest expense, net 50 47
Income tax expense 9 16
EBITDA $217 $234
Sales discounts(1)(1)
Adjustment to unconsolidated affiliate earnings(1) 4 7
Adjusted EBITDA $220 $240
EBITDA attributable to noncontrolling interests(2)(47)(52)
Adjusted EBITDA attributable to SXC $173 $188
(1) Represents SXC share of India JV interest, taxes and depreciation expense.
(2) Represents Adjusted EBITDA attributable to SXCP public unitholders and to DTE Energy’s interest in Indiana Harbor.
SXC Q1 2014 Earnings Call
22
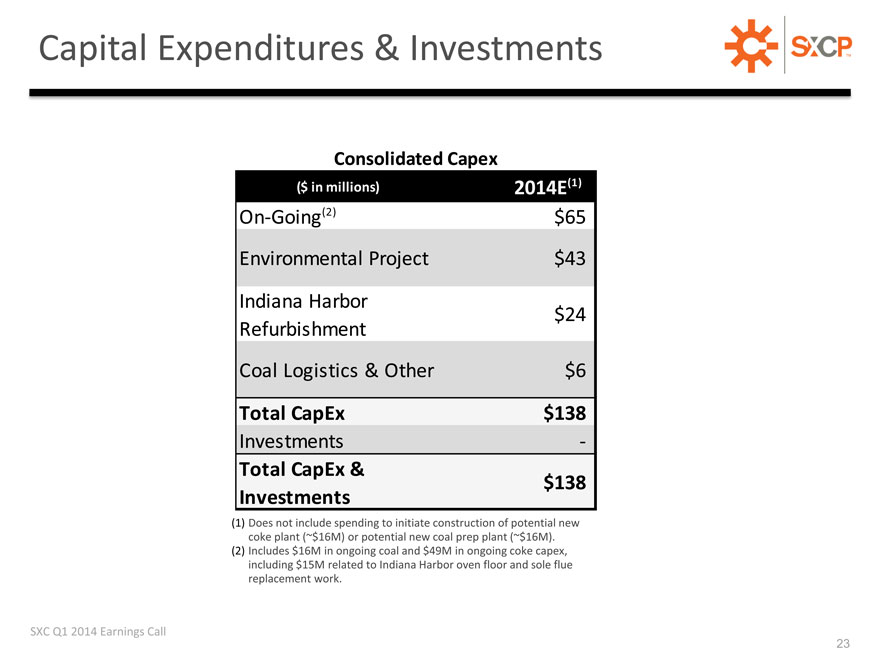
Capital Expenditures & Investments
Consolidated Capex
($ in millions) 2014E(1)
On-Going(2) $65
Environmental Project $43
Indiana Harbor
$24
Refurbishment
Coal Logistics & Other $6
Total CapEx $138
Investments -
Total CapEx &
$138
Investments
(1) Does not include spending to initiate construction of potential new
coke plant (~$16M) or potential new coal prep plant (~$16M).
(2) Includes $16M in ongoing coal and $49M in ongoing coke capex,
including $15M related to Indiana Harbor oven floor and sole flue
replacement work.
SXC Q1 2014 Earnings Call
23