
SunCoke Energy, Inc. Q3 2017 Earnings Conference Call October 26, 2017 Exhibit 99.2
Forward-Looking Statements This slide presentation should be reviewed in conjunction with the Third Quarter 2017 earnings release of SunCoke Energy, Inc. (SXC) and conference call held on October 26, 2017 at 11:00 a.m. ET. Some of the information included in this presentation constitutes “forward-looking statements” as defined in Section 27A of the Securities Act of 1933, as amended and Section 21E of the Securities Exchange Act of 1934, as amended. All statements in this presentation that express opinions, expectations, beliefs, plans, objectives, assumptions or projections with respect to anticipated future performance of SXC or SunCoke Energy Partners, L.P. (SXCP), in contrast with statements of historical facts, are forward-looking statements. Such forward-looking statements are based on management’s beliefs and assumptions and on information currently available. Forward-looking statements include information concerning possible or assumed future results of operations, business strategies, financing plans, competitive position, potential growth opportunities, potential operating performance improvements, the effects of competition and the effects of future legislation or regulations. Forward-looking statements include all statements that are not historical facts and may be identified by the use of forward-looking terminology such as the words “believe,” “expect,” “plan,” “intend,” “anticipate,” “estimate,” “predict,” “potential,” “continue,” “may,” “will,” “should” or the negative of these terms or similar expressions. Although management believes that its plans, intentions and expectations reflected in or suggested by the forward-looking statements made in this presentation are reasonable, no assurance can be given that these plans, intentions or expectations will be achieved when anticipated or at all. Moreover, such statements are subject to a number of assumptions, risks and uncertainties. Many of these risks are beyond the control of SXC and SXCP, and may cause actual results to differ materially from those implied or expressed by the forward-looking statements. Each of SXC and SXCP has included in its filings with the Securities and Exchange Commission cautionary language identifying important factors (but not necessarily all the important factors) that could cause actual results to differ materially from those expressed in any forward-looking statement. For more information concerning these factors, see the Securities and Exchange Commission filings of SXC and SXCP. All forward-looking statements included in this presentation are expressly qualified in their entirety by such cautionary statements. Although forward-looking statements are based on current beliefs and expectations, caution should be taken not to place undue reliance on any such forward-looking statements because such statements speak only as of the date hereof. SXC and SXCP do not have any intention or obligation to update publicly any forward-looking statement (or its associated cautionary language) whether as a result of new information or future events or after the date of this presentation, except as required by applicable law. This presentation includes certain non-GAAP financial measures intended to supplement, not substitute for, comparable GAAP measures. Reconciliations of non-GAAP financial measures to GAAP financial measures are provided in the Appendix at the end of the presentation. Investors are urged to consider carefully the comparable GAAP measures and the reconciliations to those measures provided in the Appendix. SXC Q3 2017 Earnings Call
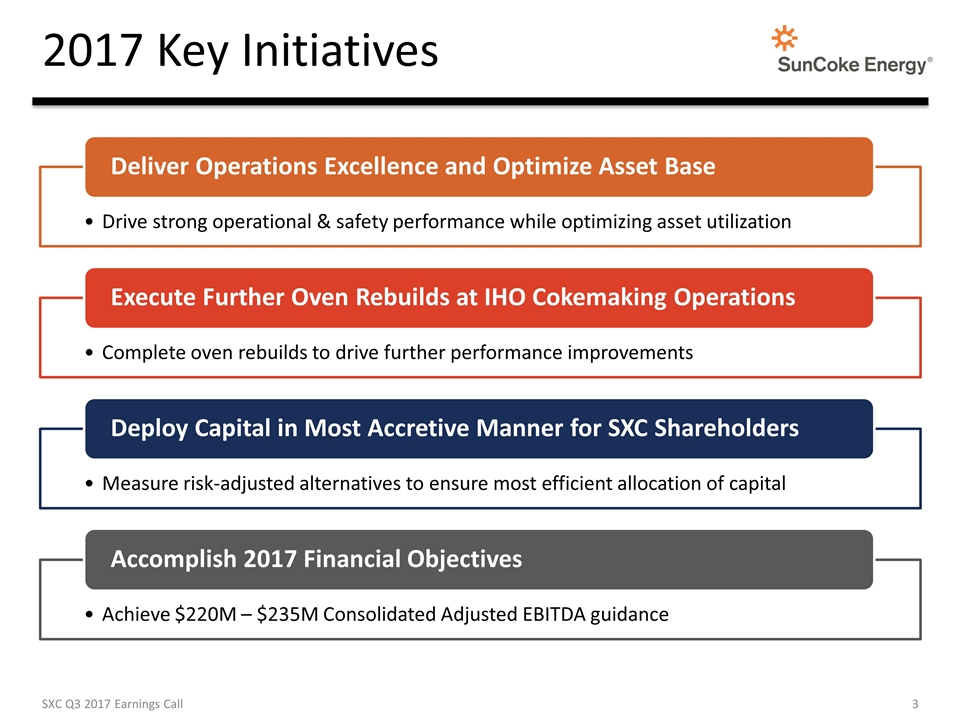
2017 Key Initiatives Drive strong operational & safety performance while optimizing asset utilization Deliver Operations Excellence and Optimize Asset Base Complete oven rebuilds to drive further performance improvements Execute Further Oven Rebuilds at IHO Cokemaking Operations Measure risk-adjusted alternatives to ensure most efficient allocation of capital Deploy Capital in Most Accretive Manner for SXC Shareholders Achieve $220M – $235M Consolidated Adjusted EBITDA guidance Accomplish 2017 Financial Objectives SXC Q3 2017 Earnings Call
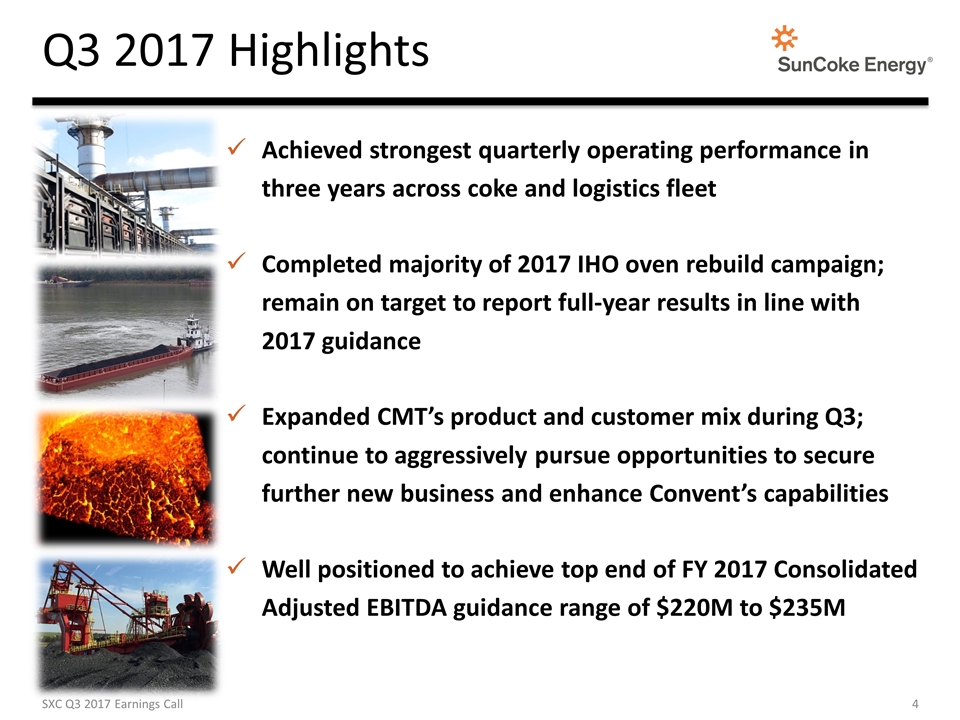
Q3 2017 Highlights Achieved strongest quarterly operating performance in three years across coke and logistics fleet Completed majority of 2017 IHO oven rebuild campaign; remain on target to report full-year results in line with 2017 guidance Expanded CMT’s product and customer mix during Q3; continue to aggressively pursue opportunities to secure further new business and enhance Convent’s capabilities Well positioned to achieve top end of FY 2017 Consolidated Adjusted EBITDA guidance range of $220M to $235M SXC Q3 2017 Earnings Call
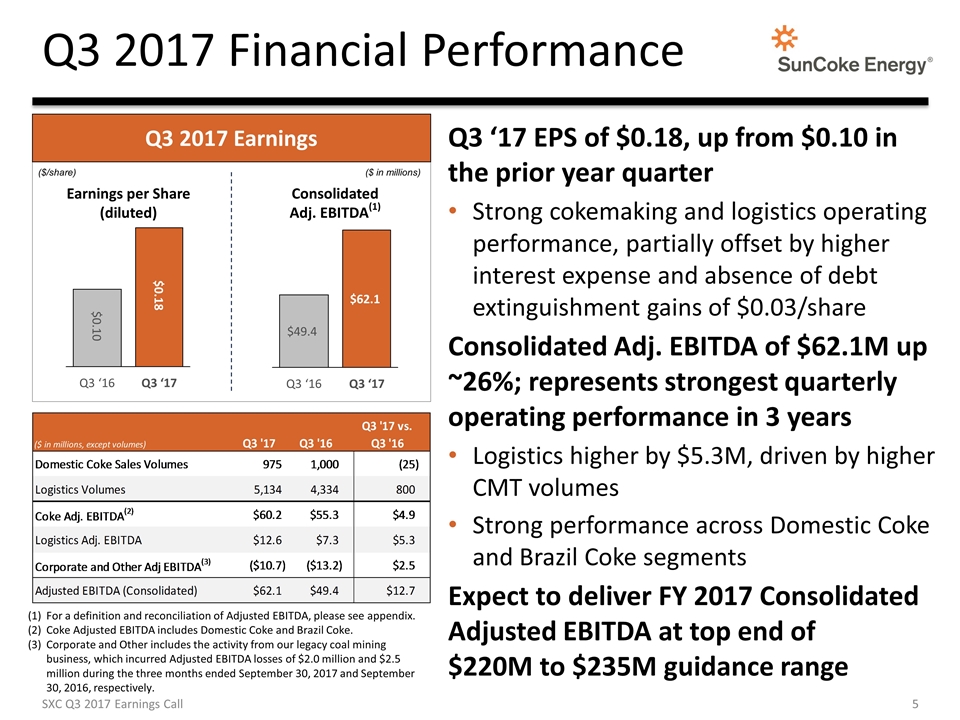
Q3 2017 Financial Performance For a definition and reconciliation of Adjusted EBITDA, please see appendix. Coke Adjusted EBITDA includes Domestic Coke and Brazil Coke. Corporate and Other includes the activity from our legacy coal mining business, which incurred Adjusted EBITDA losses of $2.0 million and $2.5 million during the three months ended September 30, 2017 and September 30, 2016, respectively. Q3 ‘17 EPS of $0.18, up from $0.10 in the prior year quarter Strong cokemaking and logistics operating performance, partially offset by higher interest expense and absence of debt extinguishment gains of $0.03/share Consolidated Adj. EBITDA of $62.1M up ~26%; represents strongest quarterly operating performance in 3 years Logistics higher by $5.3M, driven by higher CMT volumes Strong performance across Domestic Coke and Brazil Coke segments Expect to deliver FY 2017 Consolidated Adjusted EBITDA at top end of $220M to $235M guidance range SXC Q3 2017 Earnings Call ($/share) ($ in millions) Earnings per Share (diluted) Consolidated Adj. EBITDA(1) Q3 2017 Earnings Consolidated SunCoke Consolidated SunCoke Consolidated SunCoke Consolidated SunCoke Financial Results Financial Results Financial Results Financial Results Sep17_QTD Actuals vs. Sep16_QTD Actuals Sep17_QTD Actuals vs. Sep16_QTD Actuals Sep17_QTD Actuals vs. Sep16_QTD Actuals Sep17_YTD Working Estimate vs. Sep16_YTD Actuals Quarter and Year-to-Date Quarter and Year-to-Date Quarter and Year-to-Date Quarter and Year-to-Date Automated From TM-1 MANUAL (sourced from Accounting) Presentation Ready Automated From TM-1 ($ in millions, except volumes) Q3 '17 Q3 '16 Q3 '17 vs.Q3 '16 ($ in millions, except volumes) Q3 '17 Q3 '16 0 Q3 '17 vs.Q3 '16 0 ($ in millions, except volumes) Q3 '17 Q3 '16 0 Q3 '17 vs.Q3 '16 0 ($ in millions, except volumes) Sep '17 YTD Sep '16 YTD Sep '17 YTD vs. Sep '16 YTD Domestic Coke Sales Volumes 974.52303000000006 1,000.52584 -26.002809999999954 Domestic Coke Sales Volumes 1,000 Domestic Coke Sales Volumes 974.52303000000006 1,000 -25.476969999999937 Domestic Coke Sales Volumes 0 2,991.9785899999997 -2,991.9785899999997 Coal Logistics Volumes 5,133.9315899999992 4,332.2004100000004 801.73117999999886 Coal Logistics Volumes 4,334 Logistics Volumes 5,133.9315899999992 4,334 799.93158999999923 Coal Logistics Volumes(2) 0 12,854.920680000001 ,-12,854.920680000001 Coke Adj. EBITDA(2) $60.261206740000034 $55.301105660000111 $4.960101079999923 Coke Adj. EBITDA(2) $60.2 Coke Adj. EBITDA(2) $60.2 $55.301105660000111 $4.8988943399998917 Coke Adj. EBITDA(3) $162.86238808999988 $165.30033611000005 $-2.4379480200001638 Coal Logistics Adj. EBITDA $12.564846310000002 $7.263249570000001 $5.3015967400000008 Coal Logistics Adj. EBITDA Logistics Adj. EBITDA $12.564846310000002 $7.263249570000001 $5.3015967400000008 Coal Logistics Adj. EBITDA $35.684936149999999 $18.575011110000002 $17.109925039999997 Corporate and Other Adj EBITDA(3) $-10.647857889999997 $-13.190989889999997 $2.5431319999999999 Corporate and Other Adj EBITDA(3) $-10.7 Corporate and Other Adj EBITDA(3) $-10.7 $-13.190989889999997 $2.490989889999998 Corporate and Other, including Legacy Costs $-33.291247389999995 $-44.177751250000007 $10.886503860000012 Adjusted EBITDA (Consolidated) $62.178195160000044 $49.373365340000113 $12.804829819999931 Adjusted EBITDA (Consolidated) Adjusted EBITDA (Consolidated) $62.064846310000007 $49.373365340000113 $12.691480969999891 Adjusted EBITDA (Consolidated)(1) $165.25607684999989 $139.69759597000004 $25.558480879999848
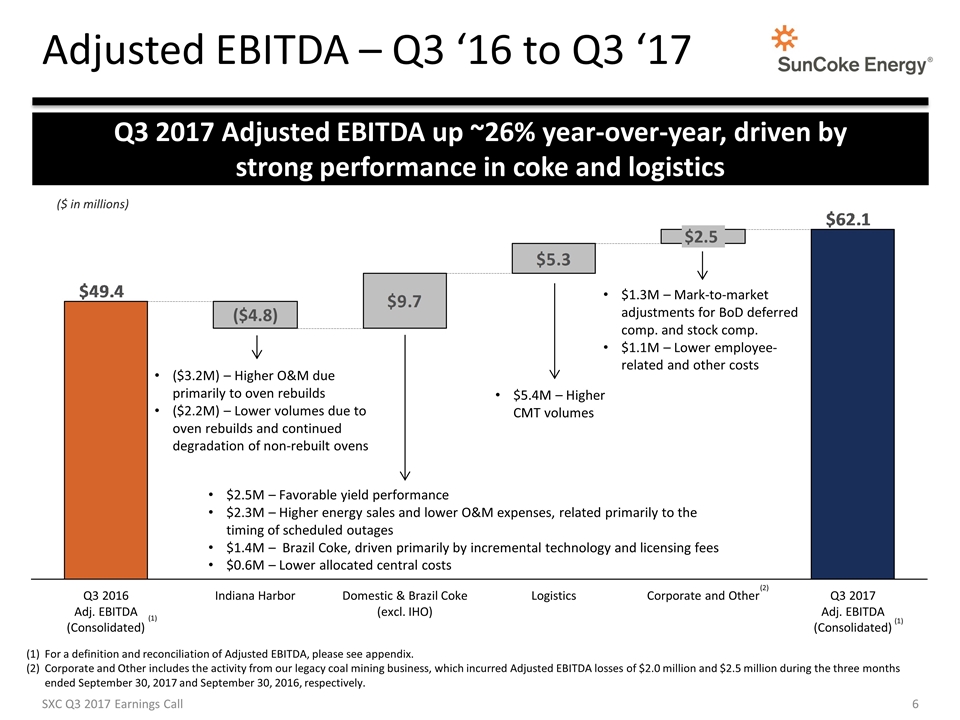
Adjusted EBITDA – Q3 ‘16 to Q3 ‘17 For a definition and reconciliation of Adjusted EBITDA, please see appendix. Corporate and Other includes the activity from our legacy coal mining business, which incurred Adjusted EBITDA losses of $2.0 million and $2.5 million during the three months ended September 30, 2017 and September 30, 2016, respectively. (1) (1) $1.3M – Mark-to-market adjustments for BoD deferred comp. and stock comp. $1.1M – Lower employee-related and other costs SXC Q3 2017 Earnings Call ($3.2M) – Higher O&M due primarily to oven rebuilds ($2.2M) – Lower volumes due to oven rebuilds and continued degradation of non-rebuilt ovens $5.4M – Higher CMT volumes $2.5M – Favorable yield performance $2.3M – Higher energy sales and lower O&M expenses, related primarily to the timing of scheduled outages $1.4M – Brazil Coke, driven primarily by incremental technology and licensing fees $0.6M – Lower allocated central costs ($ in millions) (2) Q3 2017 Adjusted EBITDA up ~26% year-over-year, driven by strong performance in coke and logistics

Domestic Coke Business Summary Domestic Cokemaking Performance /ton /ton /ton /ton /ton 1,000K 964K 946K 953K Sales Tons (Production, Kt) 975K Adj. EBITDA/ton of ~$57 on 981K tons production Strong yield performance Higher energy and lower O&M expenses, related primarily to timing of scheduled outages Lower allocated central costs Partially offset by impact of IHO oven rebuilds on volume and O&M Well positioned to deliver FY ‘17 Domestic Coke Adj. EBITDA/ton at high end of $46 – $49 range For a definition and reconciliation of Adjusted EBITDA and Adjusted EBITDA per ton, please see appendix. SXC Q3 2017 Earnings Call (1) Achieved solid Q3 2017 Domestic Coke results
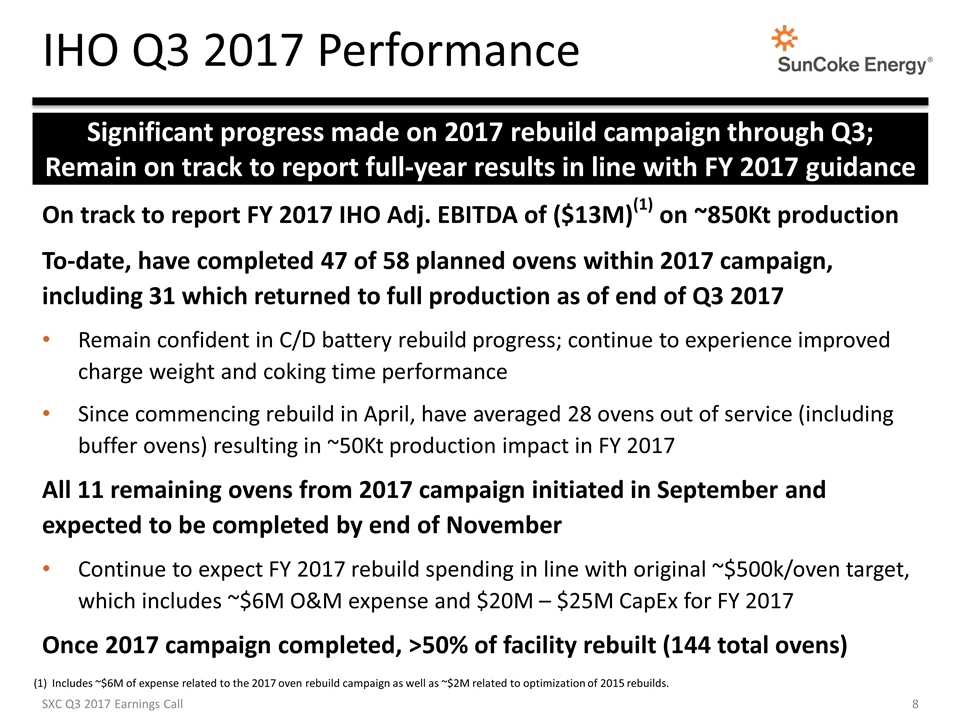
IHO Q3 2017 Performance SXC Q3 2017 Earnings Call On track to report FY 2017 IHO Adj. EBITDA of ($13M)(1) on ~850Kt production To-date, have completed 47 of 58 planned ovens within 2017 campaign, including 31 which returned to full production as of end of Q3 2017 Remain confident in C/D battery rebuild progress; continue to experience improved charge weight and coking time performance Since commencing rebuild in April, have averaged 28 ovens out of service (including buffer ovens) resulting in ~50Kt production impact in FY 2017 All 11 remaining ovens from 2017 campaign initiated in September and expected to be completed by end of November Continue to expect FY 2017 rebuild spending in line with original ~$500k/oven target, which includes ~$6M O&M expense and $20M – $25M CapEx for FY 2017 Once 2017 campaign completed, >50% of facility rebuilt (144 total ovens) Includes ~$6M of expense related to the 2017 oven rebuild campaign as well as ~$2M related to optimization of 2015 rebuilds. Significant progress made on 2017 rebuild campaign through Q3; Remain on track to report full-year results in line with FY 2017 guidance
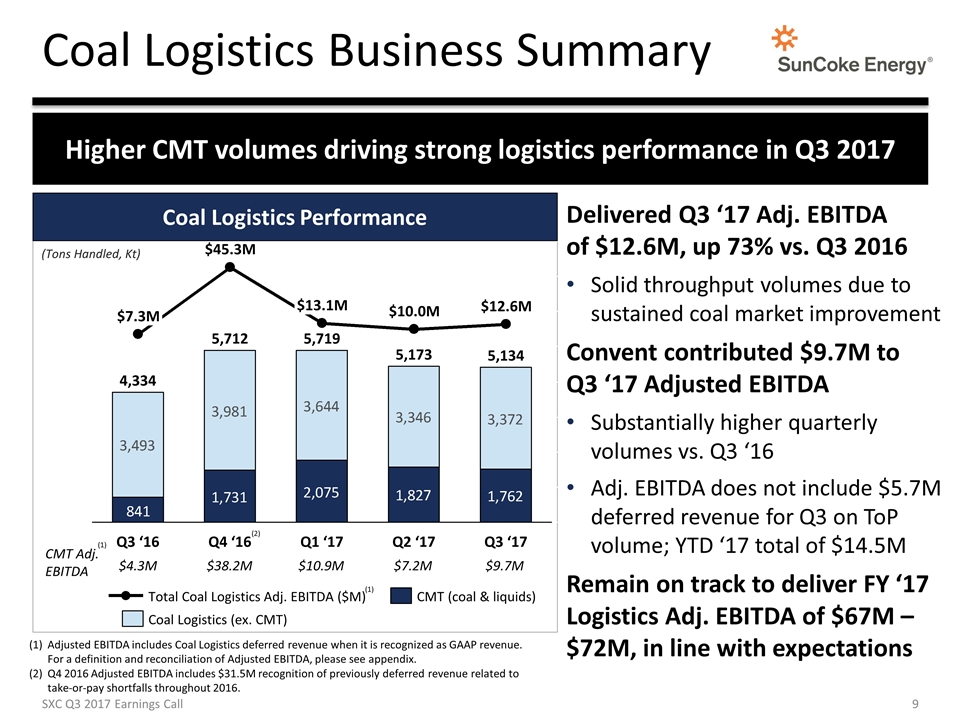
Coal Logistics Business Summary M M M M M (Tons Handled, Kt) Delivered Q3 ‘17 Adj. EBITDA of $12.6M, up 73% vs. Q3 2016 Solid throughput volumes due to sustained coal market improvement Convent contributed $9.7M to Q3 ‘17 Adjusted EBITDA Substantially higher quarterly volumes vs. Q3 ‘16 Adj. EBITDA does not include $5.7M deferred revenue for Q3 on ToP volume; YTD ‘17 total of $14.5M Remain on track to deliver FY ‘17 Logistics Adj. EBITDA of $67M – $72M, in line with expectations Coal Logistics Performance $4.3M $38.2M $10.9M $7.2M CMT Adj. EBITDA $9.7M (1) (1) SXC Q3 2017 Earnings Call Adjusted EBITDA includes Coal Logistics deferred revenue when it is recognized as GAAP revenue. For a definition and reconciliation of Adjusted EBITDA, please see appendix. Q4 2016 Adjusted EBITDA includes $31.5M recognition of previously deferred revenue related to take-or-pay shortfalls throughout 2016. (2) Higher CMT volumes driving strong logistics performance in Q3 2017

Q3 2017 Liquidity SXC Q3 2017 Earnings Call Q3 distribution of $0.5940/unit ($112.7M) – Repayment of CMT seller-financing ($1.0M) – Debt issuance costs related to Q2 2017 refinancing ($0.6M) – Principal payment related to SXCP sale leaseback $100.0M – Net revolver borrowing Total Liquidity (incl. revolver availability): ~$304M (Consolidated) Q2 ‘17 Q3 ‘17 Total Debt $901M $888M Gross Leverage(1) 3.96x 3.90x Gross leverage for Q3 2017 calculated using midpoint of FY 2017E Consolidated Adjusted EBITDA guidance. Maintain strong consolidated liquidity of ~$300M, including >$190M of SXC standalone liquidity
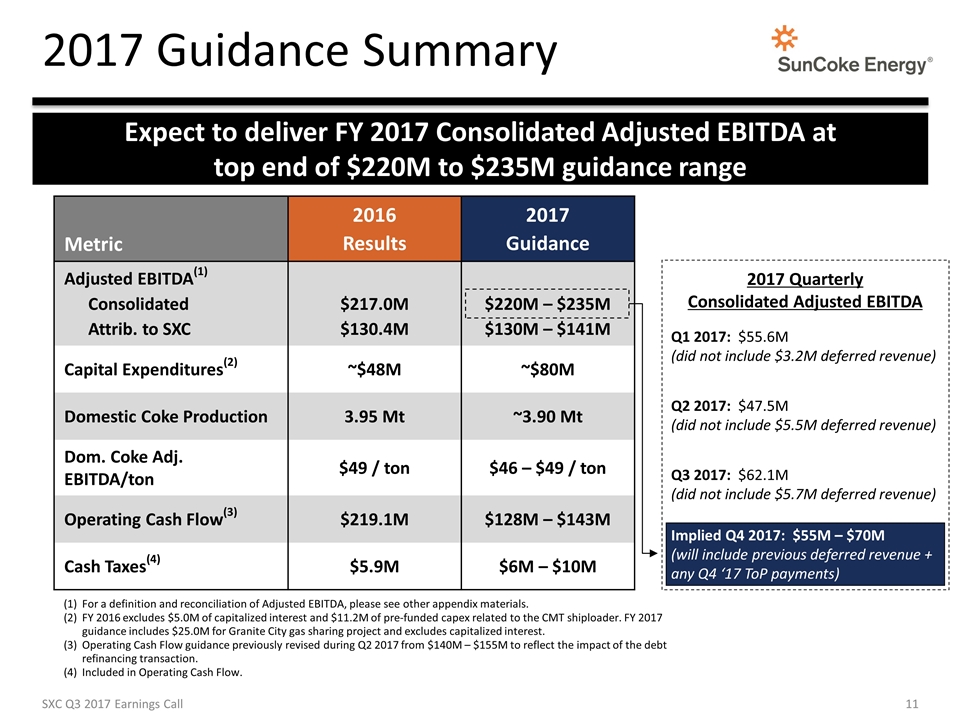
2017 Guidance Summary SXC Q3 2017 Earnings Call Expect to deliver FY 2017 Consolidated Adjusted EBITDA at top end of $220M to $235M guidance range Metric 2016 Results 2017 Guidance Adjusted EBITDA(1) Consolidated Attrib. to SXC $217.0M $130.4M $220M – $235M $130M – $141M Capital Expenditures(2) ~$48M ~$80M Domestic Coke Production 3.95 Mt ~3.90 Mt Dom. Coke Adj. EBITDA/ton $49 / ton $46 – $49 / ton Operating Cash Flow(3) $219.1M $128M – $143M Cash Taxes(4) $5.9M $6M – $10M For a definition and reconciliation of Adjusted EBITDA, please see other appendix materials. FY 2016 excludes $5.0M of capitalized interest and $11.2M of pre-funded capex related to the CMT shiploader. FY 2017 guidance includes $25.0M for Granite City gas sharing project and excludes capitalized interest. Operating Cash Flow guidance previously revised during Q2 2017 from $140M – $155M to reflect the impact of the debt refinancing transaction. Included in Operating Cash Flow. 2017 Quarterly Consolidated Adjusted EBITDA Q1 2017: $55.6M (did not include $3.2M deferred revenue) Q2 2017: $47.5M (did not include $5.5M deferred revenue) Q3 2017: $62.1M (did not include $5.7M deferred revenue) Implied Q4 2017: $55M – $70M (will include previous deferred revenue + any Q4 ‘17 ToP payments)
Capital Allocation Priorities Purchased ~0.5M SXCP units for ~$9M total during Q3 2017 Through October 25, 2017, SXC has purchased ~2.1M total units for ~$36M total YTD unit purchases expected to generate more than $5M additional SXC cash flow annually(1) Purchasing SXCP units in open market continues to represent most attractive use of cash Anticipate purchasing additional SXCP units in Q4 2017; will continue to remain price disciplined Remaining BoD authorization for ~$64M SXCP unit purchases Remain focused on executing $80M CapEx plan for FY 2017E SXC Q3 2017 Earnings Call Assumes SXCP distribution policy held constant at $0.5940 per quarter. Continuing to deploy capital in most efficient manner to maximize value for SXC shareholders

CMT New Business Wins Developed new domestic thermal coal business in Q3 ‘16 U.S. utility shipping thermal coal destined for Florida Expect to handle volumes throughout 2018 Recently secured new aggregates customer (via water to ground storage) Multi-year contract with firm use commitments and upside Began handling volumes in Q3 2017 Successfully handled first trial shipments of rail-borne petcoke for two refinery customers Expect these incremental volumes will contribute $1M – $2M to FY ‘17 Adj. EBITDA Recent Wins SXC Q3 2017 Earnings Call Continue to diversify product and customer mix at CMT with recent aggregates and petcoke shipments in Q3 2017
CMT New Business Opportunities Near-term Opportunities New Capabilities Completed $120M modernization program in late-2016, including commissioning of new shiploader World’s largest fixed-tower shiploader reduces dock times Dual-vessel loading capability can accommodate Panamax, Baby Capes and Capes and load any in under 30 hours Developing short-term and long-term barge unloading solutions Anticipate securing near-term unloading solution in Q4 2017 If long-term solution pursued, anticipate full functionality in ~2 years Once complete, CMT’s multi-modal capabilities would cover all modes of transport options Potential for additional coal export activity (Western low sulfur) Additional dry bulk and petcoke business Would further diversify customer and product base while leveraging existing capacity Utilize existing infrastructure to further diversify product handling into liquids and other industrial materials Strategically positioned as only dry-bulk, rail-serviced terminal on lower Mississippi Site serviced by Canadian National railway, with multiple interchanges possible for UP, BNSF, NS, CSX, and others SXC Q3 2017 Earnings Call Active pipeline of opportunities to grow EBITDA by $5M to $10M in next two years; new capabilities to provide platform for long-term growth

Indiana Harbor outlook
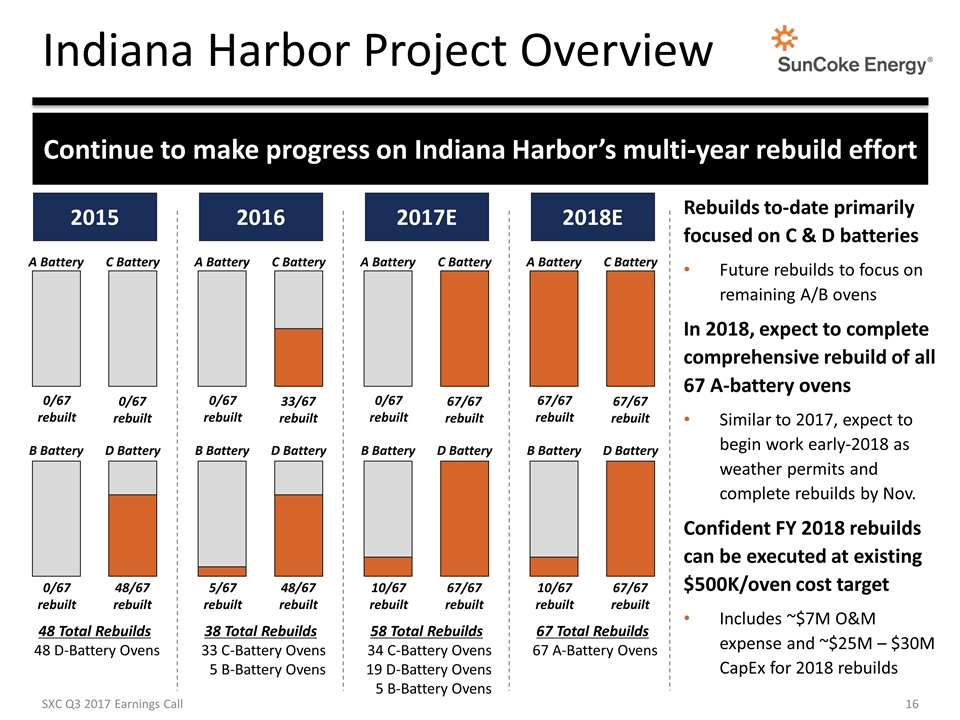
Indiana Harbor Project Overview SXC Q3 2017 Earnings Call 2015 xx A Battery B Battery C Battery D Battery 48 Total Rebuilds 48 D-Battery Ovens 0/67 rebuilt 0/67 rebuilt 48/67 rebuilt 0/67 rebuilt 2017E A Battery B Battery C Battery D Battery 58 Total Rebuilds 34 C-Battery Ovens 19 D-Battery Ovens 5 B-Battery Ovens 0/67 rebuilt 67/67 rebuilt 67/67 rebuilt 10/67 rebuilt 2018E A Battery B Battery C Battery D Battery 67 Total Rebuilds 67 A-Battery Ovens 67/67 rebuilt 67/67 rebuilt 67/67 rebuilt 10/67 rebuilt Rebuilds to-date primarily focused on C & D batteries Future rebuilds to focus on remaining A/B ovens In 2018, expect to complete comprehensive rebuild of all 67 A-battery ovens Similar to 2017, expect to begin work early-2018 as weather permits and complete rebuilds by Nov. Confident FY 2018 rebuilds can be executed at existing $500K/oven cost target Includes ~$7M O&M expense and ~$25M – $30M CapEx for 2018 rebuilds Continue to make progress on Indiana Harbor’s multi-year rebuild effort 2016 A Battery B Battery C Battery D Battery 38 Total Rebuilds 33 C-Battery Ovens 5 B-Battery Ovens 0/67 rebuilt 33/67 rebuilt 48/67 rebuilt 5/67 rebuilt
Indiana Harbor Rebuild Outlook SXC Q3 2017 Earnings Call Once 2018 campaign completed, >75% of facility rebuilt (211 total ovens) Rebuilds completed across entirety of A, C and D batteries (67 ovens per battery) Also rebuilt 10 of 67 B-battery ovens in 2016 and 2017 B-battery ovens among most operationally challenged at IHO Structural integrity compromised in B-battery, contributing to historical operating challenges and increased maintenance costs However, observations of rebuilt ovens to-date encouraging; as expected, significantly improved charge weights and coking times Consistent with rebuild approach, will continue to monitor B-battery performance during 2018 in evaluating potential plan for remaining 57 ovens Assessment could result in rebuilding all, none or some portion of remaining B-Battery ovens Based on oven conditions, would anticipate 50% higher cost for any future rebuilds Will evaluate performance of both rebuilt and non-rebuilt B-battery ovens in assessing economic return on all rebuild options
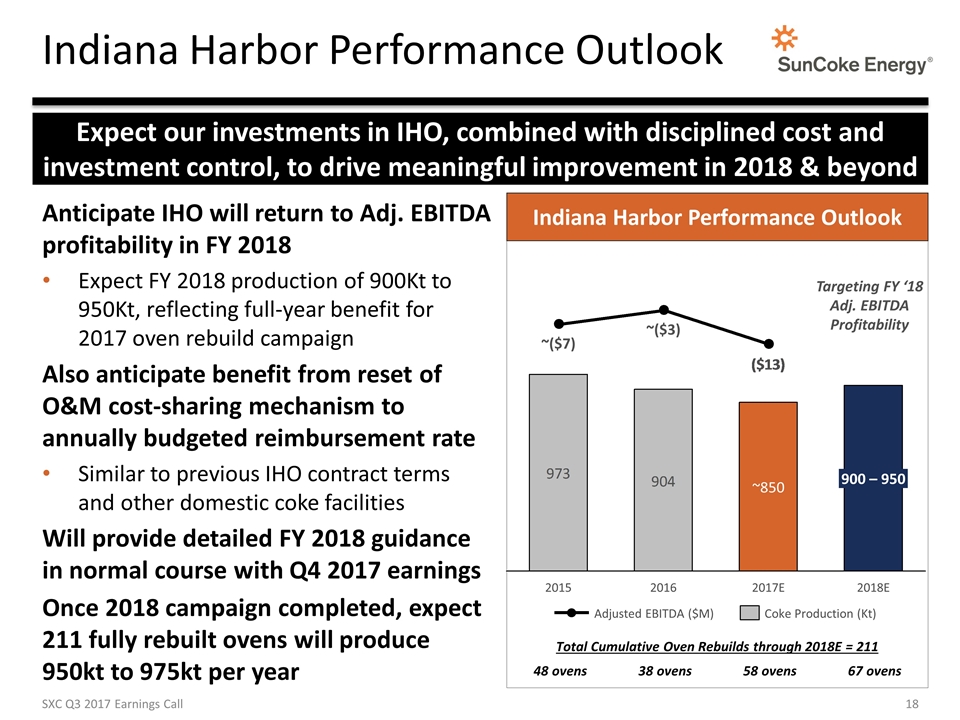
Indiana Harbor Performance Outlook SXC Q3 2017 Earnings Call ~850 ~ ~ 900 – 950 Indiana Harbor Performance Outlook Anticipate IHO will return to Adj. EBITDA profitability in FY 2018 Expect FY 2018 production of 900Kt to 950Kt, reflecting full-year benefit for 2017 oven rebuild campaign Also anticipate benefit from reset of O&M cost-sharing mechanism to annually budgeted reimbursement rate Similar to previous IHO contract terms and other domestic coke facilities Will provide detailed FY 2018 guidance in normal course with Q4 2017 earnings Once 2018 campaign completed, expect 211 fully rebuilt ovens will produce 950kt to 975kt per year Total Cumulative Oven Rebuilds through 2018E = 211 48 ovens 38 ovens 58 ovens 67 ovens Expect our investments in IHO, combined with disciplined cost and investment control, to drive meaningful improvement in 2018 & beyond Targeting FY ‘18 Adj. EBITDA Profitability

Questions

Investor Relations 630-824-1907 www.suncoke.com
Appendix
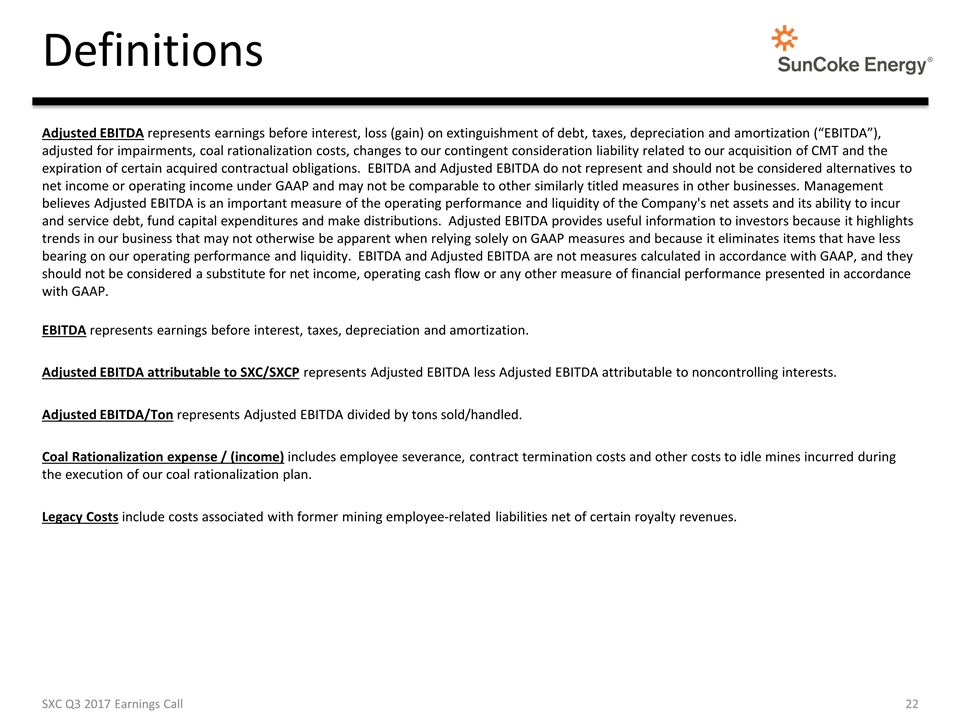
Definitions Adjusted EBITDA represents earnings before interest, loss (gain) on extinguishment of debt, taxes, depreciation and amortization (“EBITDA”), adjusted for impairments, coal rationalization costs, changes to our contingent consideration liability related to our acquisition of CMT and the expiration of certain acquired contractual obligations. EBITDA and Adjusted EBITDA do not represent and should not be considered alternatives to net income or operating income under GAAP and may not be comparable to other similarly titled measures in other businesses. Management believes Adjusted EBITDA is an important measure of the operating performance and liquidity of the Company's net assets and its ability to incur and service debt, fund capital expenditures and make distributions. Adjusted EBITDA provides useful information to investors because it highlights trends in our business that may not otherwise be apparent when relying solely on GAAP measures and because it eliminates items that have less bearing on our operating performance and liquidity. EBITDA and Adjusted EBITDA are not measures calculated in accordance with GAAP, and they should not be considered a substitute for net income, operating cash flow or any other measure of financial performance presented in accordance with GAAP. EBITDA represents earnings before interest, taxes, depreciation and amortization. Adjusted EBITDA attributable to SXC/SXCP represents Adjusted EBITDA less Adjusted EBITDA attributable to noncontrolling interests. Adjusted EBITDA/Ton represents Adjusted EBITDA divided by tons sold/handled. Coal Rationalization expense / (income) includes employee severance, contract termination costs and other costs to idle mines incurred during the execution of our coal rationalization plan. Legacy Costs include costs associated with former mining employee-related liabilities net of certain royalty revenues. SXC Q3 2017 Earnings Call
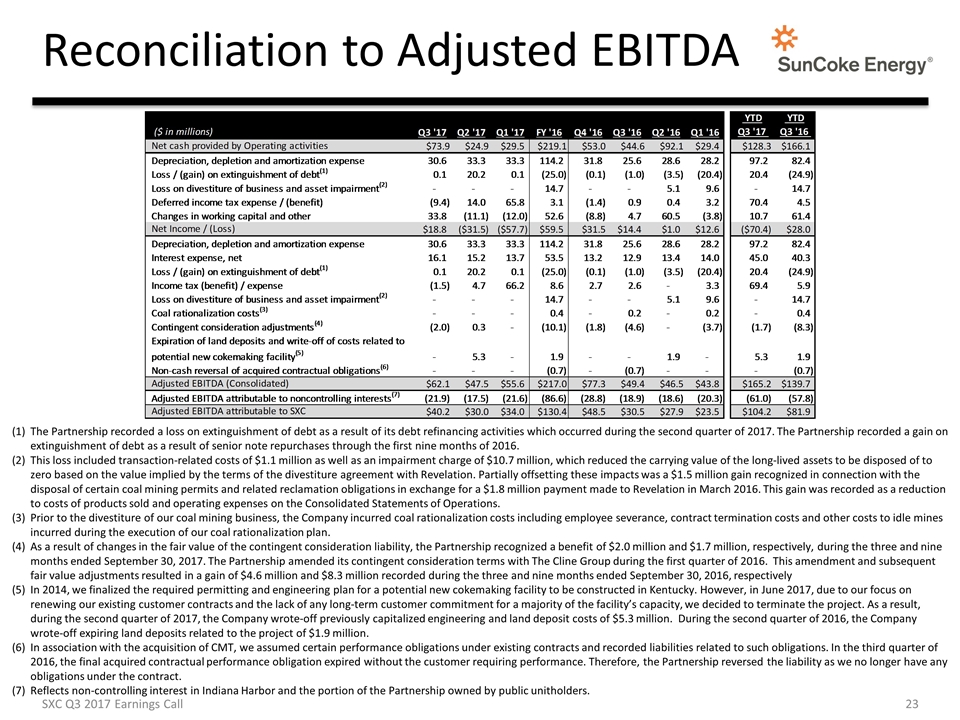
Reconciliation to Adjusted EBITDA The Partnership recorded a loss on extinguishment of debt as a result of its debt refinancing activities which occurred during the second quarter of 2017. The Partnership recorded a gain on extinguishment of debt as a result of senior note repurchases through the first nine months of 2016. This loss included transaction-related costs of $1.1 million as well as an impairment charge of $10.7 million, which reduced the carrying value of the long-lived assets to be disposed of to zero based on the value implied by the terms of the divestiture agreement with Revelation. Partially offsetting these impacts was a $1.5 million gain recognized in connection with the disposal of certain coal mining permits and related reclamation obligations in exchange for a $1.8 million payment made to Revelation in March 2016. This gain was recorded as a reduction to costs of products sold and operating expenses on the Consolidated Statements of Operations. Prior to the divestiture of our coal mining business, the Company incurred coal rationalization costs including employee severance, contract termination costs and other costs to idle mines incurred during the execution of our coal rationalization plan. As a result of changes in the fair value of the contingent consideration liability, the Partnership recognized a benefit of $2.0 million and $1.7 million, respectively, during the three and nine months ended September 30, 2017. The Partnership amended its contingent consideration terms with The Cline Group during the first quarter of 2016. This amendment and subsequent fair value adjustments resulted in a gain of $4.6 million and $8.3 million recorded during the three and nine months ended September 30, 2016, respectively In 2014, we finalized the required permitting and engineering plan for a potential new cokemaking facility to be constructed in Kentucky. However, in June 2017, due to our focus on renewing our existing customer contracts and the lack of any long-term customer commitment for a majority of the facility’s capacity, we decided to terminate the project. As a result, during the second quarter of 2017, the Company wrote-off previously capitalized engineering and land deposit costs of $5.3 million. During the second quarter of 2016, the Company wrote-off expiring land deposits related to the project of $1.9 million. In association with the acquisition of CMT, we assumed certain performance obligations under existing contracts and recorded liabilities related to such obligations. In the third quarter of 2016, the final acquired contractual performance obligation expired without the customer requiring performance. Therefore, the Partnership reversed the liability as we no longer have any obligations under the contract. Reflects non-controlling interest in Indiana Harbor and the portion of the Partnership owned by public unitholders. SXC Q3 2017 Earnings Call
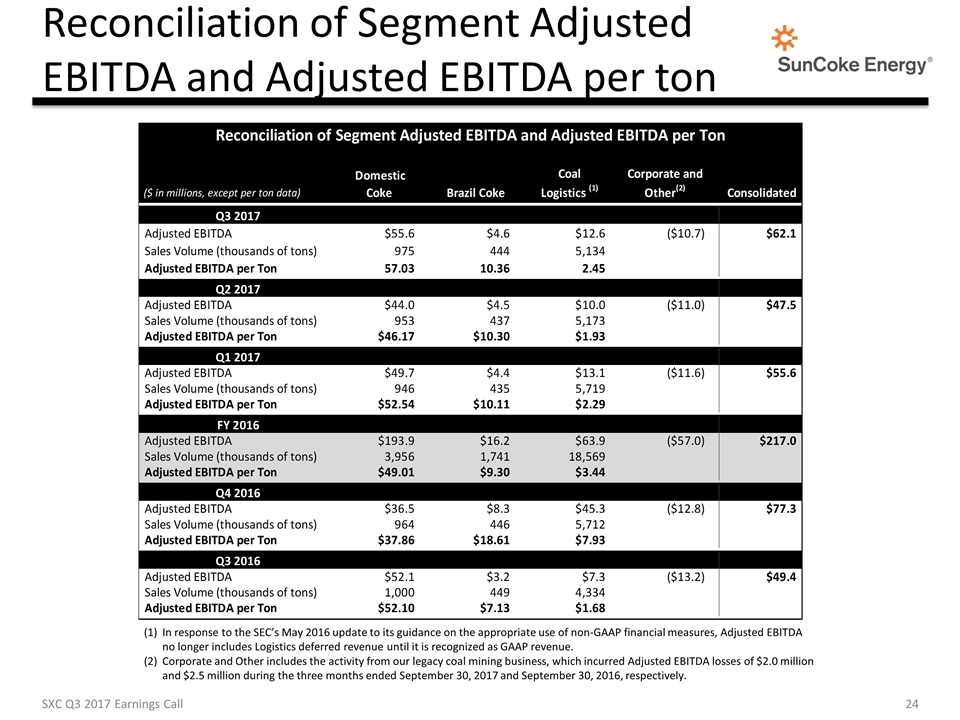
Reconciliation of Segment Adjusted EBITDA and Adjusted EBITDA per ton In response to the SEC’s May 2016 update to its guidance on the appropriate use of non-GAAP financial measures, Adjusted EBITDA no longer includes Logistics deferred revenue until it is recognized as GAAP revenue. Corporate and Other includes the activity from our legacy coal mining business, which incurred Adjusted EBITDA losses of $2.0 million and $2.5 million during the three months ended September 30, 2017 and September 30, 2016, respectively. SXC Q3 2017 Earnings Call Reconciliation of Segment Adjusted EBITDA and Adjusted EBITDA per Ton ($ in millions, except per ton data) Domestic Coke Brazil Coke CoalLogistics (1) Corporate and Other(2) Consolidated Q3 2017 Adjusted EBITDA $55.6 $4.5999999999999996 $12.6 $-10.7 $62.099999999999994 Sales Volume (thousands of tons) 975 444 5,134 Adjusted EBITDA per Ton 57.025641025641029 10.36036036036036 2.4542267238021038 Q2 2017 Adjusted EBITDA $44 $4.5 $10 $-11 $47.5 Sales Volume (thousands of tons) 953 437 5,173 Adjusted EBITDA per Ton $46.169989506820563 $10.297482837528603 $1.9331142470520009 Q1 2017 Adjusted EBITDA $49.7 $4.4000000000000004 $13.1 $-11.6 $55.6 Sales Volume (thousands of tons) 946 435 5,719 Adjusted EBITDA per Ton $52.536997885835092 $10.114942528735632 $2.2906102465465992 FY 2016 Adjusted EBITDA $193.89999999999998 $16.2 $63.899999999999991 $-57 $217 Sales Volume (thousands of tons) 3,956 1,741 18,569.2 Adjusted EBITDA per Ton $49.014155712841244 $9.3049971280873063 $3.4411821726299459 Q4 2016 Adjusted EBITDA $36.5 $8.3000000000000007 $45.3 $-12.8 $77.3 Sales Volume (thousands of tons) 964 446 5,712 Adjusted EBITDA per Ton $37.863070539419084 $18.609865470852021 $7.9306722689075633 Q3 2016 Adjusted EBITDA $52.1 $3.2 $7.3 $-13.2 $49.400000000000006 Sales Volume (thousands of tons) 1,000 449 4,334 Adjusted EBITDA per Ton $52.1 $7.1269487750556797 $1.6843562528841716

Balance Sheet & Debt Metrics Represents mid-point of FY 2017 guidance for Adj. EBITDA (Consolidated), Adj. EBITDA attributable to SXCP, and Adj. EBITDA attributable to SXC. SXC Q3 2017 Earnings Call Note: Interest payments on new 2025 SXCP Sr. Notes made in June and December of each year, as compared to February and August with the previous 2020 SXCP Sr. Notes.
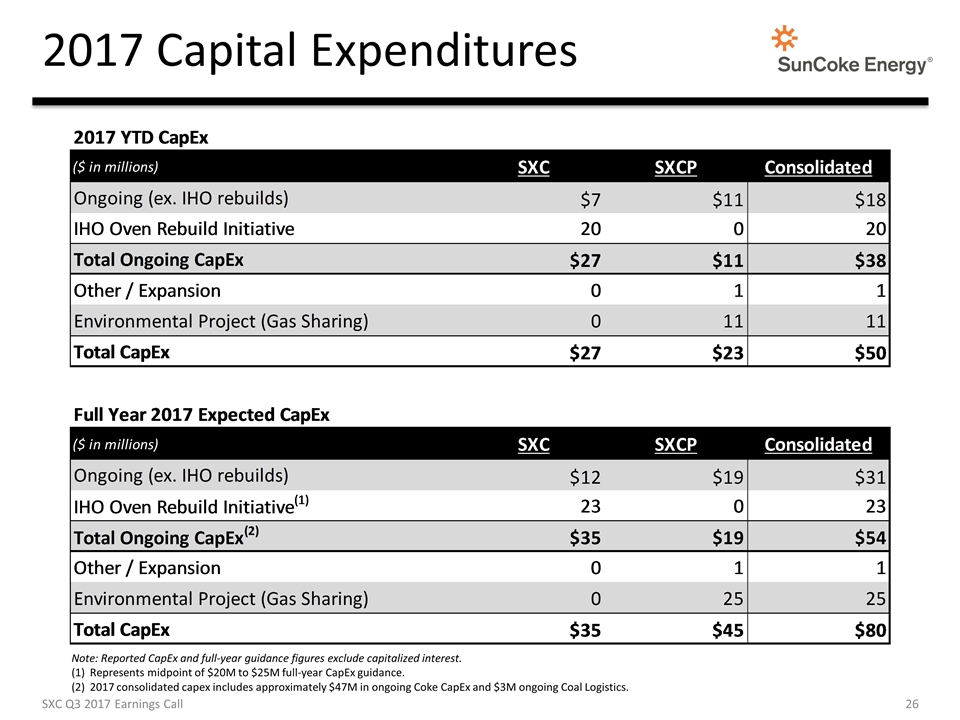
2017 Capital Expenditures SXC Q3 2017 Earnings Call Note: Reported CapEx and full-year guidance figures exclude capitalized interest. Represents midpoint of $20M to $25M full-year CapEx guidance. 2017 consolidated capex includes approximately $47M in ongoing Coke CapEx and $3M ongoing Coal Logistics.
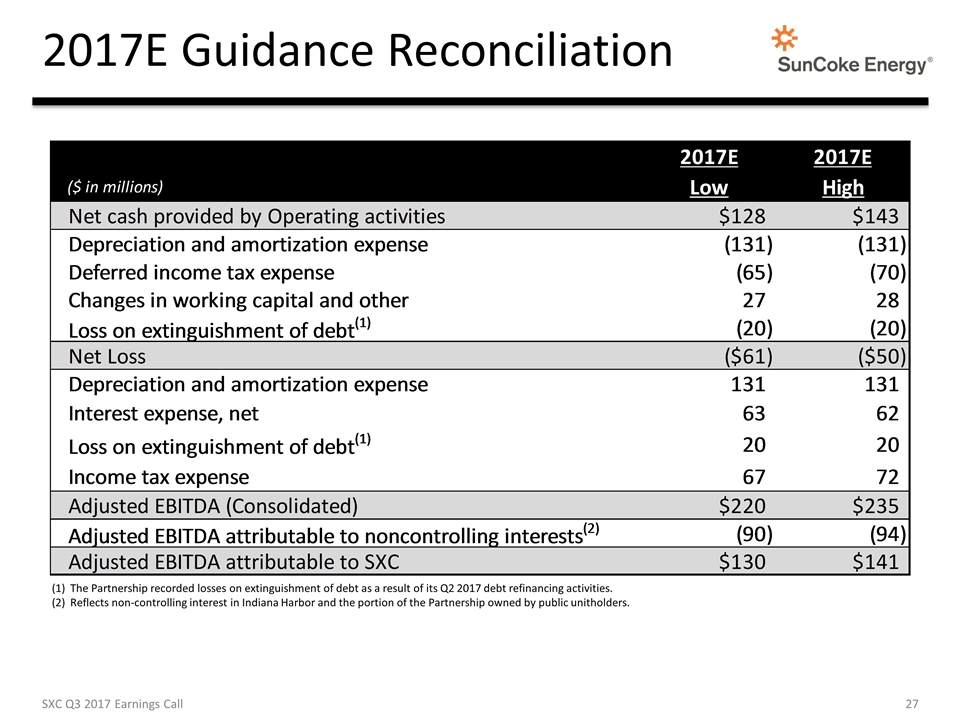
2017E Guidance Reconciliation The Partnership recorded losses on extinguishment of debt as a result of its Q2 2017 debt refinancing activities. Reflects non-controlling interest in Indiana Harbor and the portion of the Partnership owned by public unitholders. SXC Q3 2017 Earnings Call
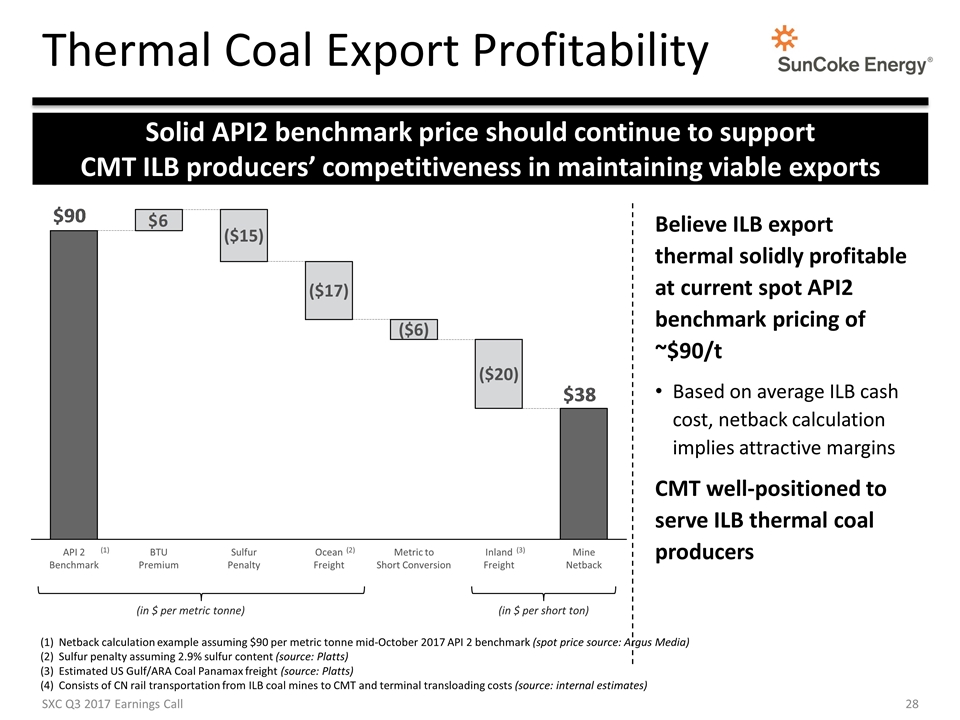
Thermal Coal Export Profitability (in $ per metric tonne) (1) (2) Believe ILB export thermal solidly profitable at current spot API2 benchmark pricing of ~$90/t Based on average ILB cash cost, netback calculation implies attractive margins CMT well-positioned to serve ILB thermal coal producers (in $ per short ton) (3) SXC Q3 2017 Earnings Call Netback calculation example assuming $90 per metric tonne mid-October 2017 API 2 benchmark (spot price source: Argus Media) Sulfur penalty assuming 2.9% sulfur content (source: Platts) Estimated US Gulf/ARA Coal Panamax freight (source: Platts) Consists of CN rail transportation from ILB coal mines to CMT and terminal transloading costs (source: internal estimates) Solid API2 benchmark price should continue to support CMT ILB producers’ competitiveness in maintaining viable exports


