SXC and SXCP Simplification, Q4 & FY 2018 and 2019 Guidance Conference Call February 5, 2019 Exhibit 99.2
Important Notice to Investors This communication includes important information about an agreement for the acquisition by SXC of all publicly held common units of SXCP. SXC expects to file a registration statement on Form S-4 with the Securities and Exchange Commission (“SEC”) containing a prospectus/consent statement/proxy statement of SXC and SXCP. SXC and SXCP security holders are urged to read the prospectus/consent statement/proxy statement and other documents filed with the SEC regarding the proposed transaction carefully and in their entirety when they become available because they will contain important information. Investors will be able to obtain a free copy of the prospectus/consent statement/proxy statement, as well as other filings containing information about the proposed transaction, without charge, at the SEC’s internet site (http://www.sec.gov). Copies of the prospectus/consent statement/proxy statement and the filings with the SEC that will be incorporated by reference in the prospectus/consent statement/proxy statement can also be obtained, without charge, by directing a request either to SXC, 1011 Warrenville Road, 6th Floor, Lisle, IL 60532 USA, Attention: Investor Relations or to SXCP, 1011 Warrenville Road, 6th Floor, Lisle, IL 60532 USA, Attention: Investor Relations. The respective directors and executive officers of SXC and SXCP may be deemed to be “participants” (as defined in Schedule 14A under the Securities Exchange Act of 1934 as amended) in respect of the proposed transaction. Information about SXC’s directors and executive officers is available in SXC’s annual report on Form 10-K for the fiscal year ended December 31, 2017, filed with the SEC on February 15, 2018. Information about SXCP’s directors and executive officers is available in SXCP’s annual report on Form 10-K for the fiscal year ended December 31, 2017 filed with the SEC on February 15, 2018. Other information regarding the participants in the solicitation and a description of their direct and indirect interests, by security holdings or otherwise, will be contained in the prospectus/consent statement/proxy statement and other relevant materials to be filed with the SEC when they become available. This communication shall not constitute an offer to sell or the solicitation of an offer to buy any securities or a solicitation of any vote or approval, nor shall there be any sale of securities in any jurisdiction in which such offer, solicitation or sale would be unlawful prior to registration or qualification under the securities laws of any such jurisdiction. No offering of securities shall be made except by means of a prospectus meeting the requirements of Section 10 of the U.S. Securities Act of 1933, as amended.
Introductory Information for Investors This slide presentation should be reviewed in conjunction with the Fourth Quarter 2018 earnings release of SunCoke Energy, Inc. (SXC) and conference call held on February 5, 2019 at 10:00 a.m. ET. Except for statements of historical fact, information contained in this presentation constitutes “forward-looking statements” as defined in Section 27A of the Securities Act of 1933, as amended and Section 21E of the Securities Exchange Act of 1934, as amended. Such forward-looking statements are based upon information currently available, and express management’s opinions, expectations, beliefs, plans, objectives, assumptions or projections with respect to anticipated future performance of SXC or SunCoke Energy Partners, L.P. (SXCP). These statements are not guarantees of future performance and undue reliance should not be placed on them. Although management believes that its plans, intentions and expectations reflected in, or suggested by, the forward-looking statements made in this presentation are reasonable, no assurance can be given that these plans, intentions or expectations will be achieved when anticipated or at all. Forward-looking statements often may be identified by the use of forward-looking terminology such as the words “believe,” “expect,” “plan,” “intend,” “anticipate,” “contemplate,” “estimate,” “predict,” “guidance,” “forecast,” “potential,” “continue,” “may,” “will,” “could,” “should,” or the negative of these terms or similar expressions, and include, but are not limited to, statements regarding: the expected benefits of the proposed transaction to SXC and SXCP and their shareholders and unitholders, respectively; the anticipated completion of the proposed transaction and the timing thereof; the expected levels of cash distributions by SXCP to its unitholders and dividends by SXC to its shareholders; expected synergies and shareholder value to result from the combined company; future credit ratings; the financial condition of the combined company; and plans and objectives of management for future operations and growth. Such statements are subject to a number of known and unknown risks, and uncertainties, many of which are beyond the control of SXC and SXCP, or are difficult to predict, and may cause actual results to differ materially from those implied or expressed by the forward-looking statements. Each of SXC and SXCP has included in its filings with the Securities and Exchange Commission (SEC) cautionary language identifying important factors (but not necessarily all the important factors) that could cause actual results to differ materially from those expressed in any forward-looking statement. Such factors include, but are not limited to: changes in industry conditions; the ability to renew current customer, supplier and other material agreements; future liquidity, working capital and capital requirements; the ability to successfully implement business strategies and potential growth opportunities; the impact of indebtedness and financing plans, including sources and availability of third-party financing; possible or assumed future results of operations; the outcome of pending and future litigation; potential operating performance improvements and the ability to achieve anticipated cost savings from strategic revenue and efficiency initiatives. For more information concerning these factors, see the SEC filings of SXC and SXCP. All forward-looking statements included in this presentation are expressly qualified in their entirety by the cautionary statements contained in such SEC filings. The forward-looking statements in this presentation speak only as of the date hereof. Except as required by applicable law, SXC and SXCP do not have any intention or obligation to revise or update publicly any forward-looking statement (or associated cautionary language) made herein, whether as a result of new information, future events, or otherwise after the date of this presentation. This presentation includes certain non-GAAP financial measures intended to supplement, not substitute for, comparable GAAP measures. Furthermore, the non-GAAP financial measures presented herein may not be consistent with similar measures provided by other companies. Reconciliations of non-GAAP financial measures to GAAP financial measures are provided in the Appendix at the end of the presentation. Investors are urged to consider carefully the comparable GAAP measures and the reconciliations to those measures provided in the Appendix. These data should be read in conjunction with the periodic reports of SXC and SXCP previously filed with the SEC. Due to rounding, numbers presented throughout this presentation may not add up precisely to the totals indicated and percentages may not precisely reflect the absolute figures for the same reason. Industry and market data used in this presentation have been obtained from industry publications and sources as well as from research reports prepared for other purposes. SXC and SXCP have not independently verified the data obtained from these sources and cannot assure investors of either the accuracy or completeness of such data.
Transaction Positions SunCoke for Long-Term Success Simplifies SunCoke’s organizational structure Improves financial flexibility and strengthens balance sheet Expands universe of strategic growth opportunities Lowers cost of capital and increases liquidity Creates Immediate and Long-Term Value for SXC and SXCP Stakeholders
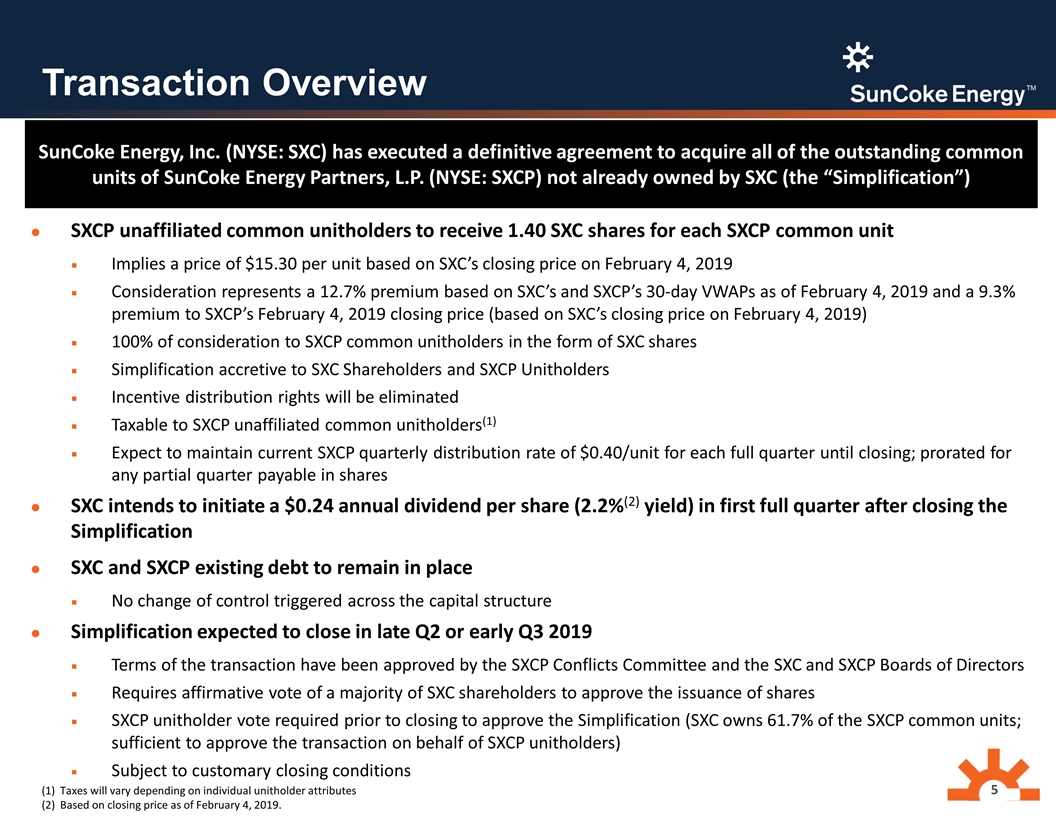
Transaction Overview SXCP unaffiliated common unitholders to receive 1.40 SXC shares for each SXCP common unit Implies a price of $15.30 per unit based on SXC’s closing price on February 4, 2019 Consideration represents a 12.7% premium based on SXC’s and SXCP’s 30-day VWAPs as of February 4, 2019 and a 9.3% premium to SXCP’s February 4, 2019 closing price (based on SXC’s closing price on February 4, 2019) 100% of consideration to SXCP common unitholders in the form of SXC shares Simplification accretive to SXC Shareholders and SXCP Unitholders Incentive distribution rights will be eliminated Taxable to SXCP unaffiliated common unitholders(1) Expect to maintain current SXCP quarterly distribution rate of $0.40/unit for each full quarter until closing; prorated for any partial quarter payable in shares SXC intends to initiate a $0.24 annual dividend per share (2.2%(2) yield) in first full quarter after closing the Simplification SXC and SXCP existing debt to remain in place No change of control triggered across the capital structure Simplification expected to close in late Q2 or early Q3 2019 Terms of the transaction have been approved by the SXCP Conflicts Committee and the SXC and SXCP Boards of Directors Requires affirmative vote of a majority of SXC shareholders to approve the issuance of shares SXCP unitholder vote required prior to closing to approve the Simplification (SXC owns 61.7% of the SXCP common units; sufficient to approve the transaction on behalf of SXCP unitholders) Subject to customary closing conditions Taxes will vary depending on individual unitholder attributes Based on closing price as of February 4, 2019. SunCoke Energy, Inc. (NYSE: SXC) has executed a definitive agreement to acquire all of the outstanding common units of SunCoke Energy Partners, L.P. (NYSE: SXCP) not already owned by SXC (the “Simplification”)
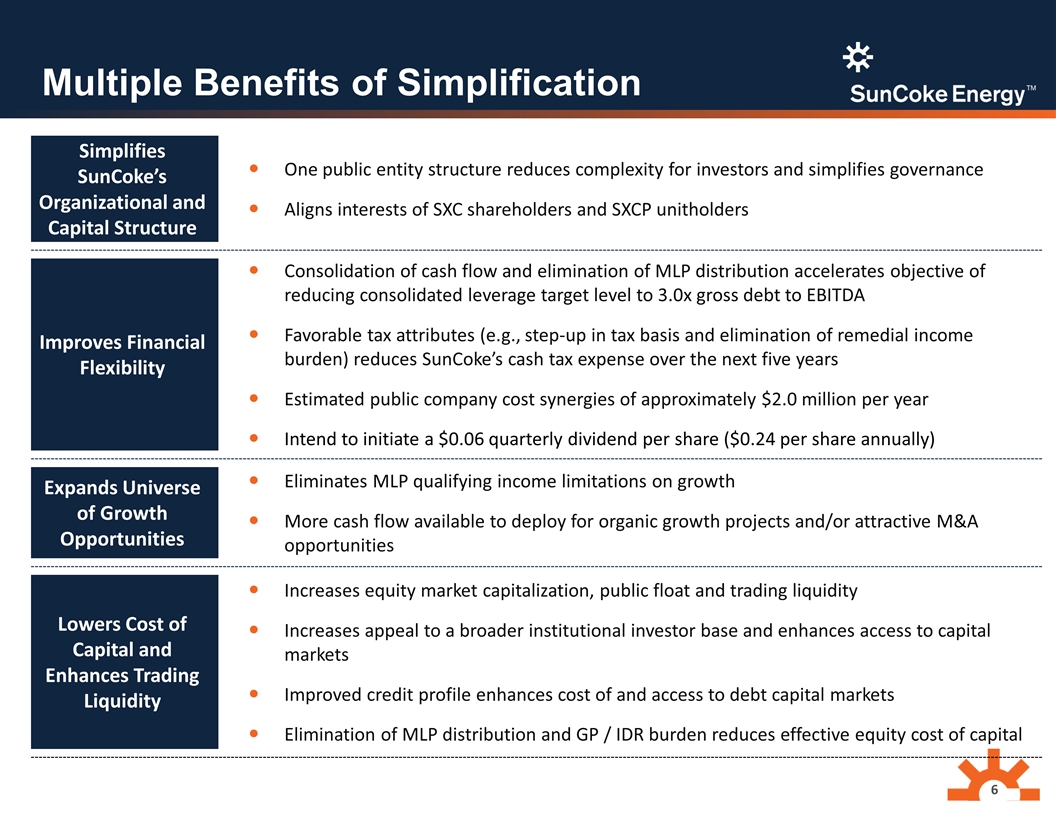
Multiple Benefits of Simplification Simplifies SunCoke’s Organizational and Capital Structure One public entity structure reduces complexity for investors and simplifies governance Aligns interests of SXC shareholders and SXCP unitholders Improves Financial Flexibility Consolidation of cash flow and elimination of MLP distribution accelerates objective of reducing consolidated leverage target level to 3.0x gross debt to EBITDA Favorable tax attributes (e.g., step-up in tax basis and elimination of remedial income burden) reduces SunCoke’s cash tax expense over the next five years Estimated public company cost synergies of approximately $2.0 million per year Intend to initiate a $0.06 quarterly dividend per share ($0.24 per share annually) Expands Universe of Growth Opportunities Eliminates MLP qualifying income limitations on growth More cash flow available to deploy for organic growth projects and/or attractive M&A opportunities Lowers Cost of Capital and Enhances Trading Liquidity Increases equity market capitalization, public float and trading liquidity Increases appeal to a broader institutional investor base and enhances access to capital markets Improved credit profile enhances cost of and access to debt capital markets Elimination of MLP distribution and GP / IDR burden reduces effective equity cost of capital
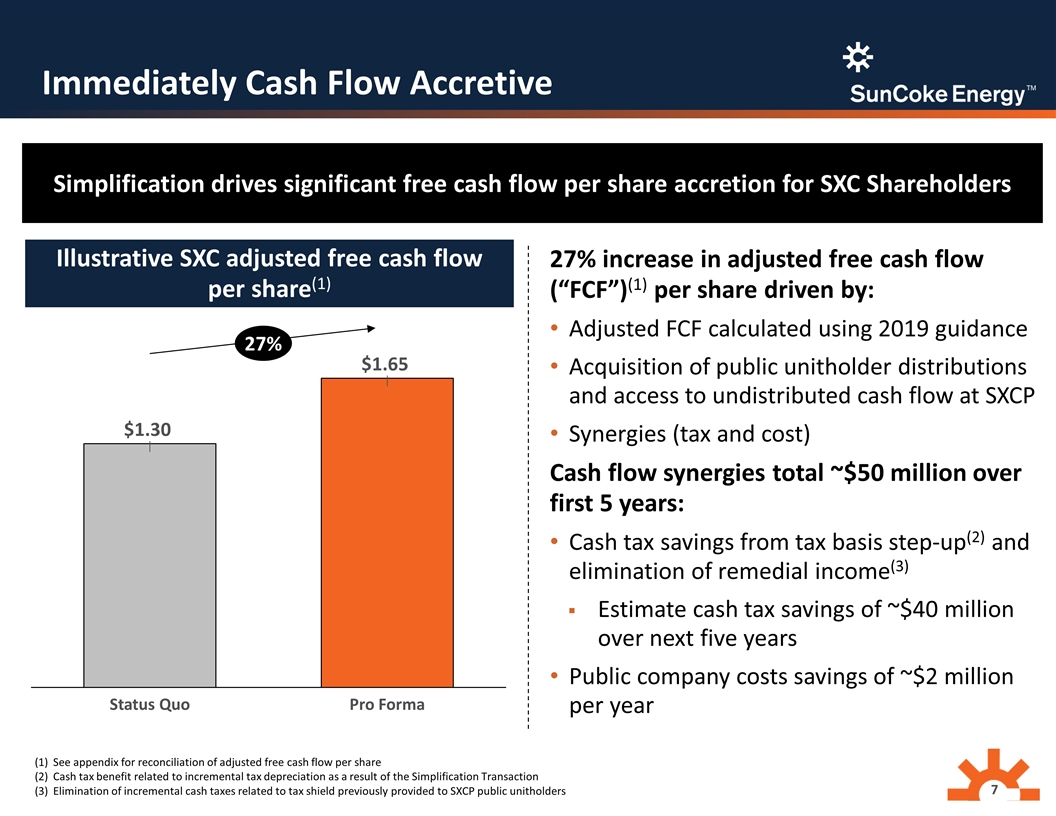
Immediately Cash Flow Accretive Simplification drives significant free cash flow per share accretion for SXC Shareholders 27% increase in adjusted free cash flow (“FCF”)(1) per share driven by: Adjusted FCF calculated using 2019 guidance Acquisition of public unitholder distributions and access to undistributed cash flow at SXCP Synergies (tax and cost) Cash flow synergies total ~$50 million over first 5 years: Cash tax savings from tax basis step-up(2) and elimination of remedial income(3) Estimate cash tax savings of ~$40 million over next five years Public company costs savings of ~$2 million per year See appendix for reconciliation of adjusted free cash flow per share Cash tax benefit related to incremental tax depreciation as a result of the Simplification Transaction Elimination of incremental cash taxes related to tax shield previously provided to SXCP public unitholders Illustrative SXC adjusted free cash flow per share(1) 27%
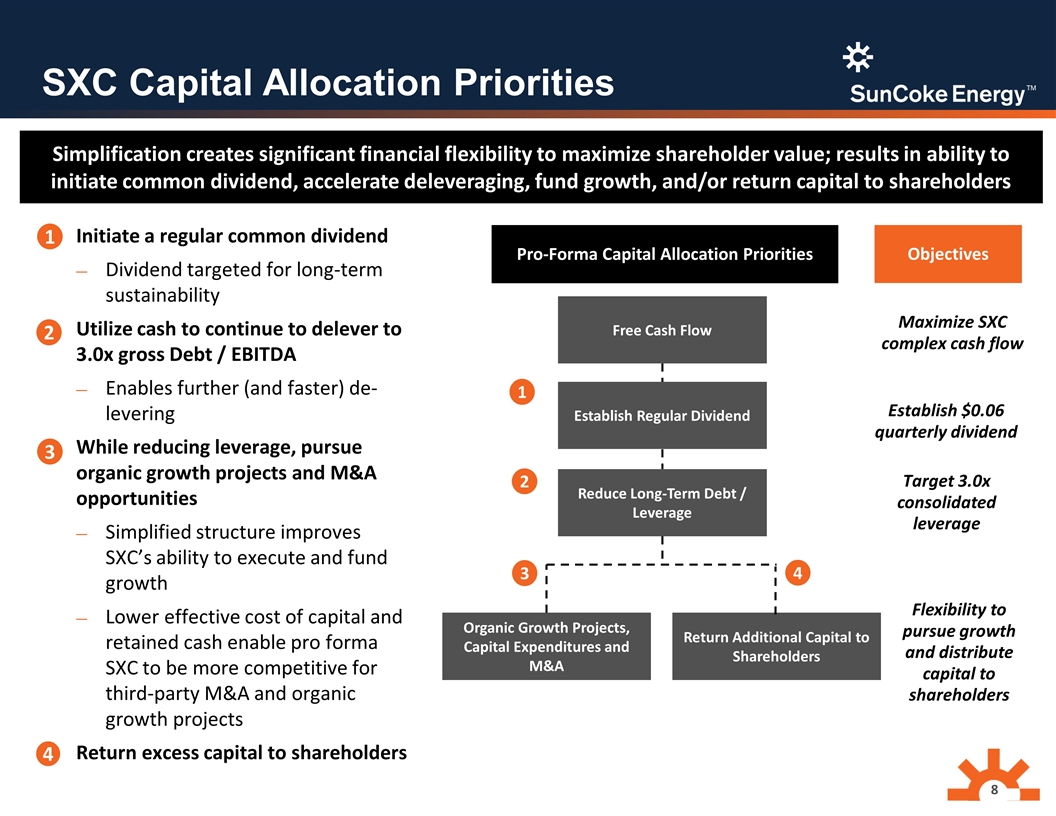
SXC Capital Allocation Priorities Initiate a regular common dividend Dividend targeted for long-term sustainability Utilize cash to continue to delever to 3.0x gross Debt / EBITDA Enables further (and faster) de-levering While reducing leverage, pursue organic growth projects and M&A opportunities Simplified structure improves SXC’s ability to execute and fund growth Lower effective cost of capital and retained cash enable pro forma SXC to be more competitive for third-party M&A and organic growth projects Return excess capital to shareholders Pro-Forma Capital Allocation Priorities 1 2 4 Free Cash Flow Reduce Long-Term Debt / Leverage Organic Growth Projects, Capital Expenditures and M&A 2 4 Objectives Flexibility to pursue growth and distribute capital to shareholders Maximize SXC complex cash flow Establish $0.06 quarterly dividend 3 Simplification creates significant financial flexibility to maximize shareholder value; results in ability to initiate common dividend, accelerate deleveraging, fund growth, and/or return capital to shareholders Return Additional Capital to Shareholders Establish Regular Dividend Target 3.0x consolidated leverage 1 3
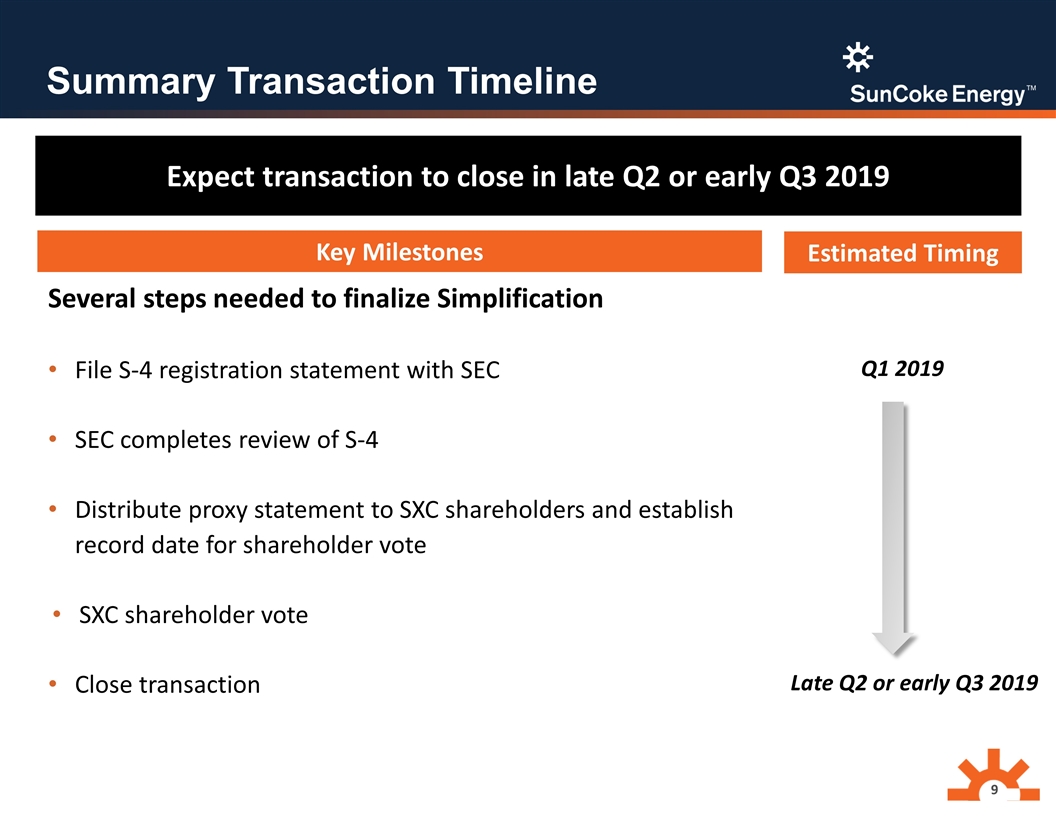
Summary Transaction Timeline Several steps needed to finalize Simplification File S-4 registration statement with SEC SEC completes review of S-4 Distribute proxy statement to SXC shareholders and establish record date for shareholder vote SXC shareholder vote Close transaction Expect transaction to close in late Q2 or early Q3 2019 Key Milestones 9 Estimated Timing Q1 2019 Late Q2 or early Q3 2019
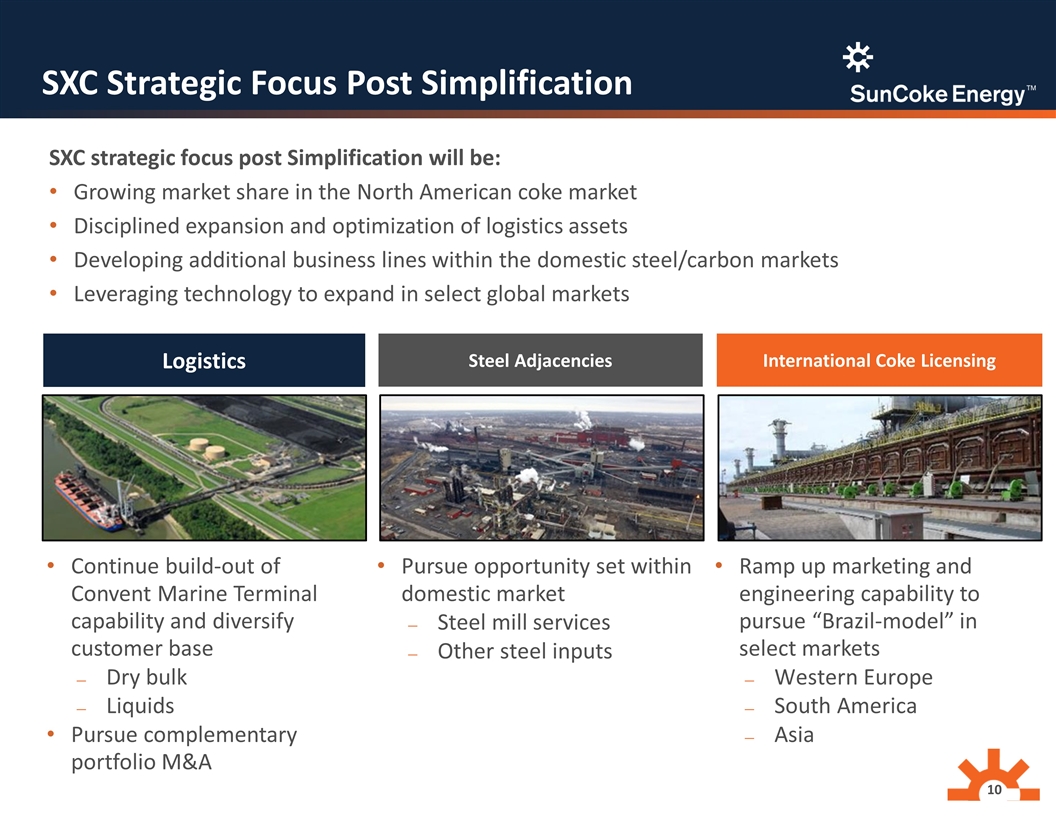
SXC Strategic Focus Post Simplification SXC strategic focus post Simplification will be: Growing market share in the North American coke market Disciplined expansion and optimization of logistics assets Developing additional business lines within the domestic steel/carbon markets Leveraging technology to expand in select global markets Continue build-out of Convent Marine Terminal capability and diversify customer base Dry bulk Liquids Pursue complementary portfolio M&A Pursue opportunity set within domestic market Steel mill services Other steel inputs Ramp up marketing and engineering capability to pursue “Brazil-model” in select markets Western Europe South America Asia International Coke Licensing Logistics Steel Adjacencies
Financial Results
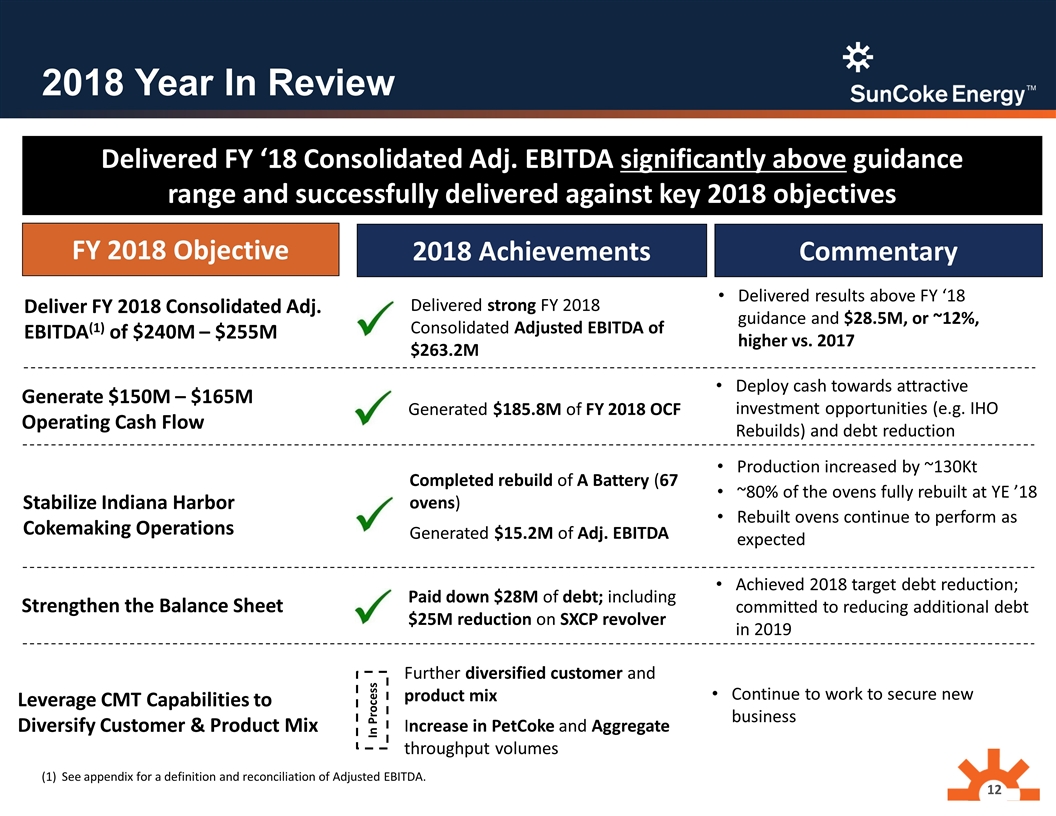
2018 Year In Review Deliver FY 2018 Consolidated Adj. EBITDA(1) of $240M – $255M Generate $150M – $165M Operating Cash Flow Leverage CMT Capabilities to Diversify Customer & Product Mix Stabilize Indiana Harbor Cokemaking Operations Delivered results above FY ‘18 guidance and $28.5M, or ~12%, higher vs. 2017 Delivered FY ‘18 Consolidated Adj. EBITDA significantly above guidance range and successfully delivered against key 2018 objectives Delivered strong FY 2018 Consolidated Adjusted EBITDA of $263.2M FY 2018 Objective 2018 Achievements Commentary Deploy cash towards attractive investment opportunities (e.g. IHO Rebuilds) and debt reduction Generated $185.8M of FY 2018 OCF Continue to work to secure new business Further diversified customer and product mix Increase in PetCoke and Aggregate throughput volumes Production increased by ~130Kt ~80% of the ovens fully rebuilt at YE ’18 Rebuilt ovens continue to perform as expected Completed rebuild of A Battery (67 ovens) Generated $15.2M of Adj. EBITDA In Process Strengthen the Balance Sheet Achieved 2018 target debt reduction; committed to reducing additional debt in 2019 Paid down $28M of debt; including $25M reduction on SXCP revolver See appendix for a definition and reconciliation of Adjusted EBITDA.
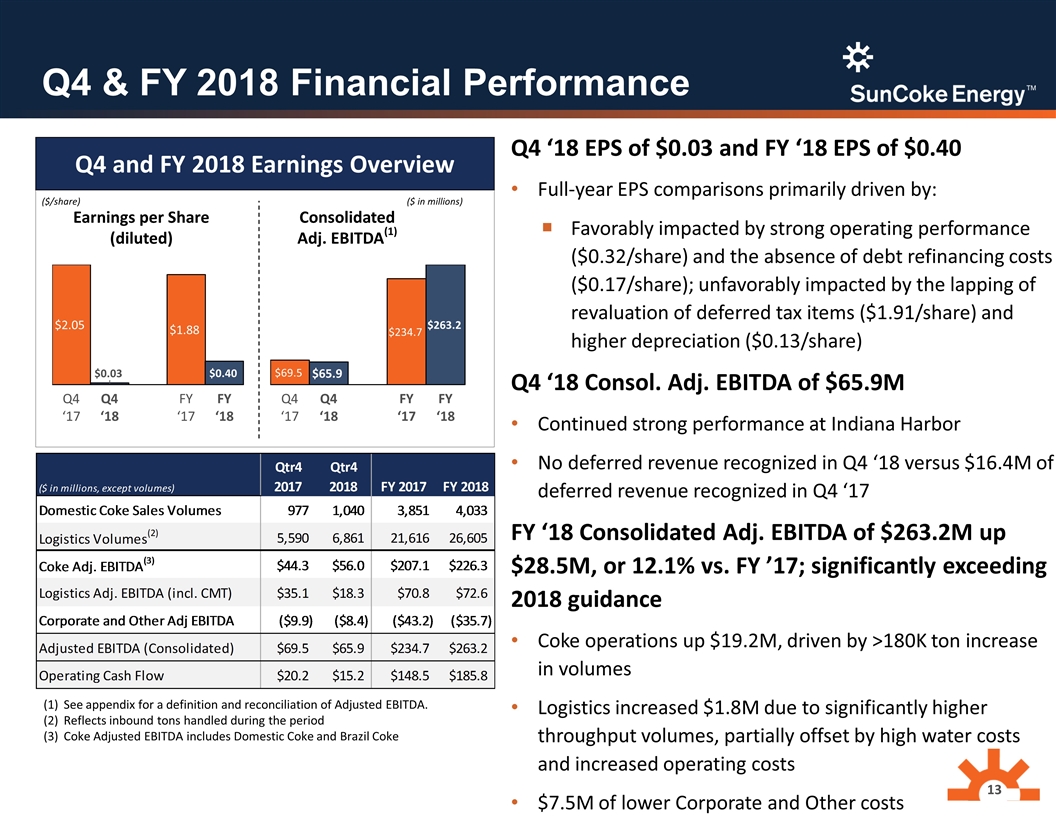
Q4 & FY 2018 Financial Performance See appendix for a definition and reconciliation of Adjusted EBITDA. Reflects inbound tons handled during the period Coke Adjusted EBITDA includes Domestic Coke and Brazil Coke Q4 ‘18 EPS of $0.03 and FY ‘18 EPS of $0.40 Full-year EPS comparisons primarily driven by: Favorably impacted by strong operating performance ($0.32/share) and the absence of debt refinancing costs ($0.17/share); unfavorably impacted by the lapping of revaluation of deferred tax items ($1.91/share) and higher depreciation ($0.13/share) Q4 ‘18 Consol. Adj. EBITDA of $65.9M Continued strong performance at Indiana Harbor No deferred revenue recognized in Q4 ‘18 versus $16.4M of deferred revenue recognized in Q4 ‘17 FY ‘18 Consolidated Adj. EBITDA of $263.2M up $28.5M, or 12.1% vs. FY ’17; significantly exceeding 2018 guidance Coke operations up $19.2M, driven by >180K ton increase in volumes Logistics increased $1.8M due to significantly higher throughput volumes, partially offset by high water costs and increased operating costs $7.5M of lower Corporate and Other costs ($/share) ($ in millions) Earnings per Share (diluted) Consolidated Adj. EBITDA(1) Q4 and FY 2018 Earnings Overview
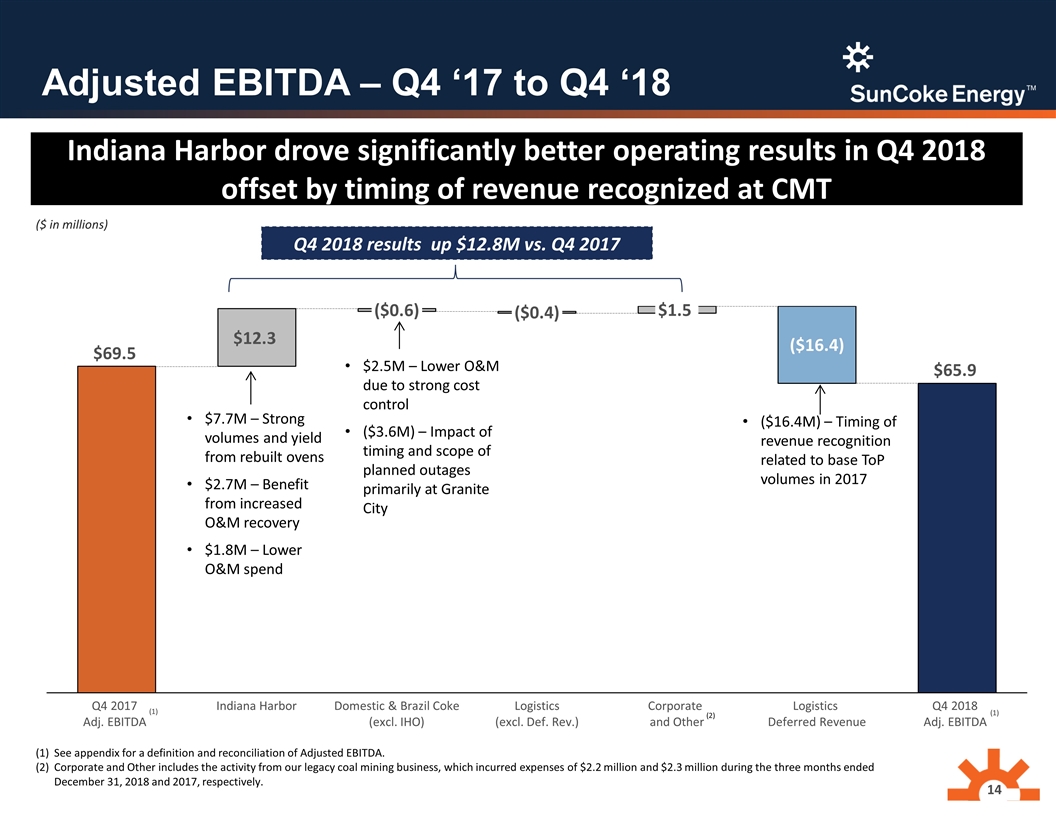
Adjusted EBITDA – Q4 ‘17 to Q4 ‘18 See appendix for a definition and reconciliation of Adjusted EBITDA. Corporate and Other includes the activity from our legacy coal mining business, which incurred expenses of $2.2 million and $2.3 million during the three months ended December 31, 2018 and 2017, respectively. (1) (1) $7.7M – Strong volumes and yield from rebuilt ovens $2.7M – Benefit from increased O&M recovery $1.8M – Lower O&M spend ($ in millions) (2) Indiana Harbor drove significantly better operating results in Q4 2018 offset by timing of revenue recognized at CMT ($16.4M) – Timing of revenue recognition related to base ToP volumes in 2017 Q4 2018 results up $12.8M vs. Q4 2017 $2.5M – Lower O&M due to strong cost control ($3.6M) – Impact of timing and scope of planned outages primarily at Granite City
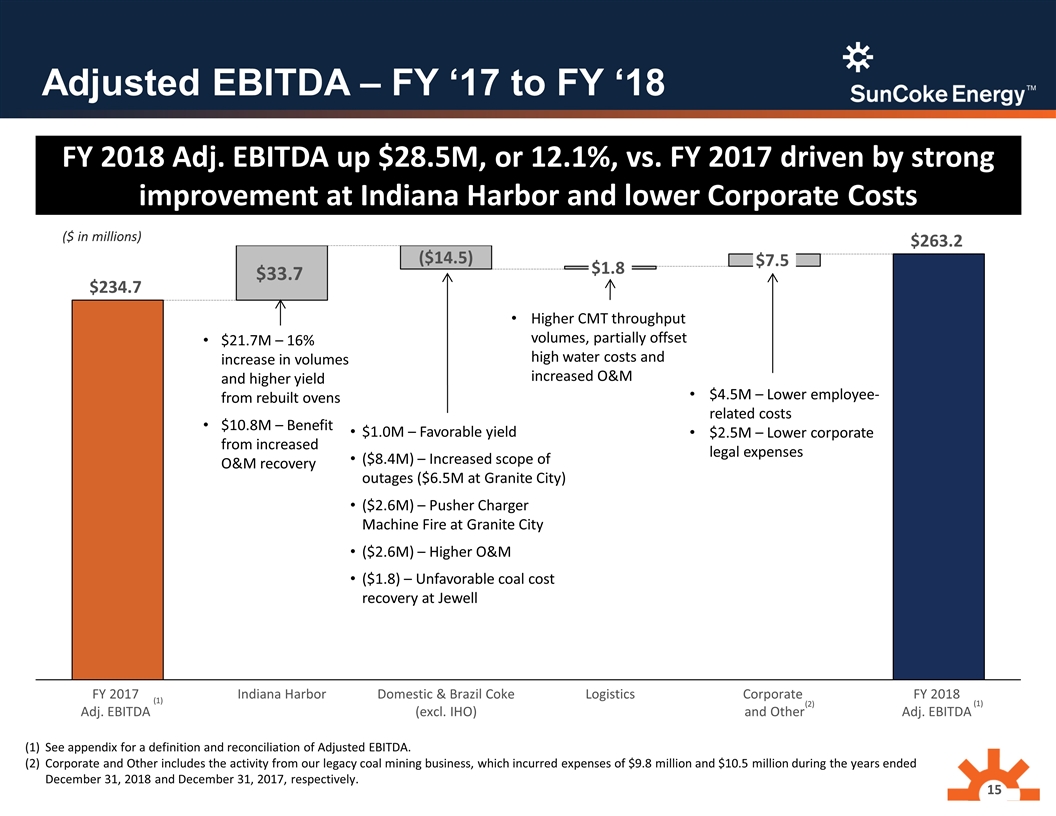
Adjusted EBITDA – FY ‘17 to FY ‘18 See appendix for a definition and reconciliation of Adjusted EBITDA. Corporate and Other includes the activity from our legacy coal mining business, which incurred expenses of $9.8 million and $10.5 million during the years ended December 31, 2018 and December 31, 2017, respectively. (1) (1) $4.5M – Lower employee-related costs $2.5M – Lower corporate legal expenses ($ in millions) (2) FY 2018 Adj. EBITDA up $28.5M, or 12.1%, vs. FY 2017 driven by strong improvement at Indiana Harbor and lower Corporate Costs Higher CMT throughput volumes, partially offset high water costs and increased O&M $21.7M – 16% increase in volumes and higher yield from rebuilt ovens $10.8M – Benefit from increased O&M recovery $1.0M – Favorable yield ($8.4M) – Increased scope of outages ($6.5M at Granite City) ($2.6M) – Pusher Charger Machine Fire at Granite City ($2.6M) – Higher O&M ($1.8) – Unfavorable coal cost recovery at Jewell

FY 2018 Capital Deployment Strong cash flow generation from operations deployed for CapEx, debt reduction, and SXCP distributions Significantly exceeds FY 2018 guidance of $150M – $165M Four quarters of public unitholders distributions $33.6M – IHO oven rebuild initiative $38.8M – Ongoing & other capex $26.6M – GCO gas sharing project(1) Excludes $3.2 million of total capitalized interest (1) Consolidated Revolver Availability $254M (Consolidated) Q4 ‘17 Q4 ‘18 Total Debt $887M $859M Leverage 3.78x 3.26x $25M – SXCP revolving credit facility

2019 Guidance
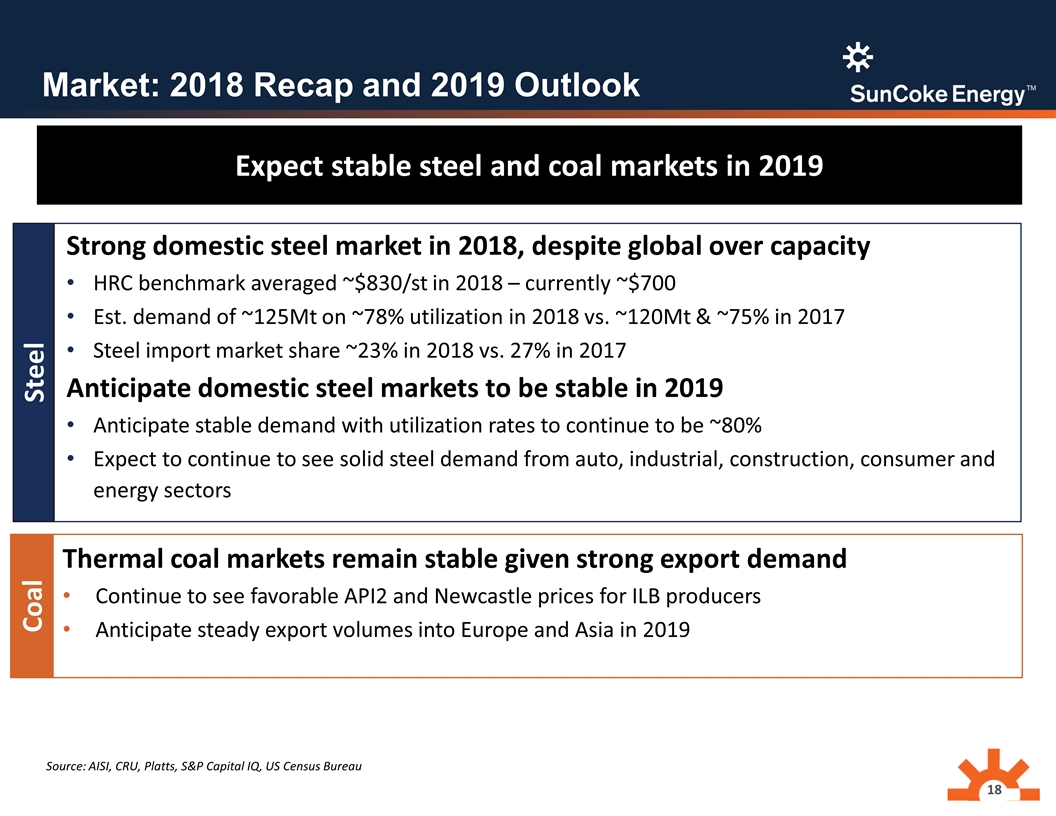
Market: 2018 Recap and 2019 Outlook Expect stable steel and coal markets in 2019 Source: AISI, CRU, Platts, S&P Capital IQ, US Census Bureau Steel Coal Strong domestic steel market in 2018, despite global over capacity HRC benchmark averaged ~$830/st in 2018 – currently ~$700 Est. demand of ~125Mt on ~78% utilization in 2018 vs. ~120Mt & ~75% in 2017 Steel import market share ~23% in 2018 vs. 27% in 2017 Anticipate domestic steel markets to be stable in 2019 Anticipate stable demand with utilization rates to continue to be ~80% Expect to continue to see solid steel demand from auto, industrial, construction, consumer and energy sectors Thermal coal markets remain stable given strong export demand Continue to see favorable API2 and Newcastle prices for ILB producers Anticipate steady export volumes into Europe and Asia in 2019
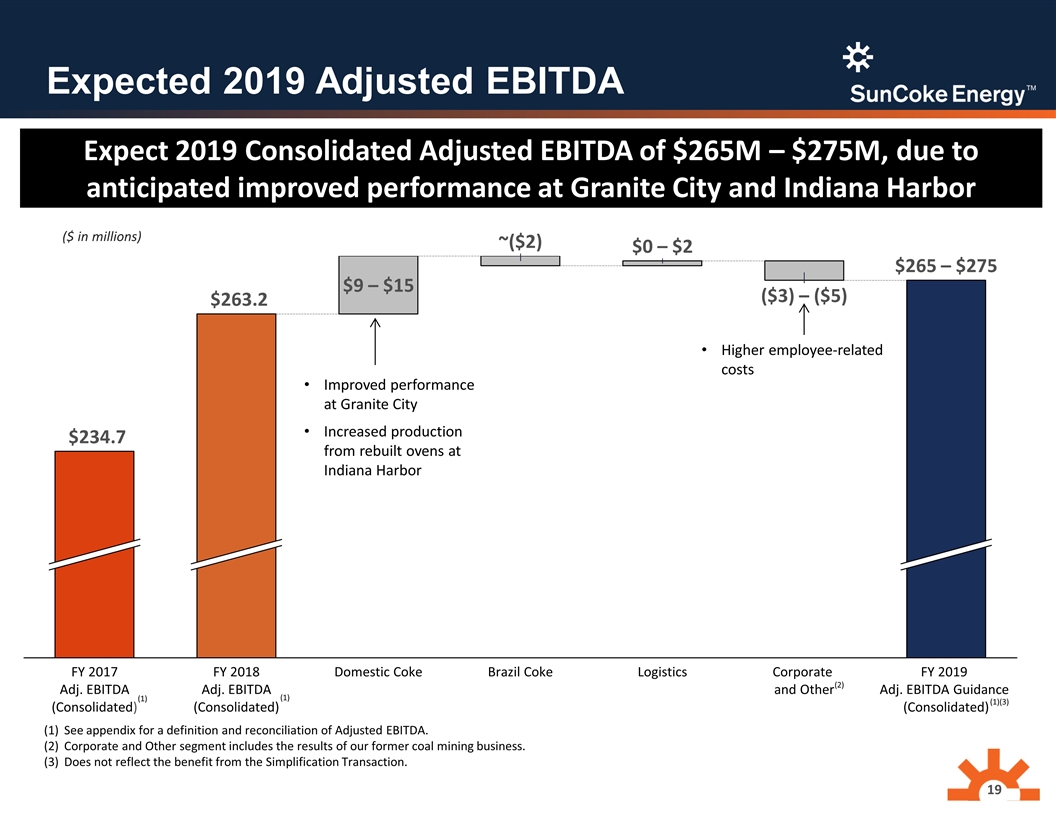
Expected 2019 Adjusted EBITDA Adj. EBITDA (Consolidated) Adj. EBITDA (Consolidated) $9 – $15 ~($2) $0 – $2 ($3) – ($5) $265 – $275 ($ in millions) See appendix for a definition and reconciliation of Adjusted EBITDA. Corporate and Other segment includes the results of our former coal mining business. Does not reflect the benefit from the Simplification Transaction. (1) (1)(3) Improved performance at Granite City Increased production from rebuilt ovens at Indiana Harbor (2) (1) Expect 2019 Consolidated Adjusted EBITDA of $265M – $275M, due to anticipated improved performance at Granite City and Indiana Harbor Higher employee-related costs
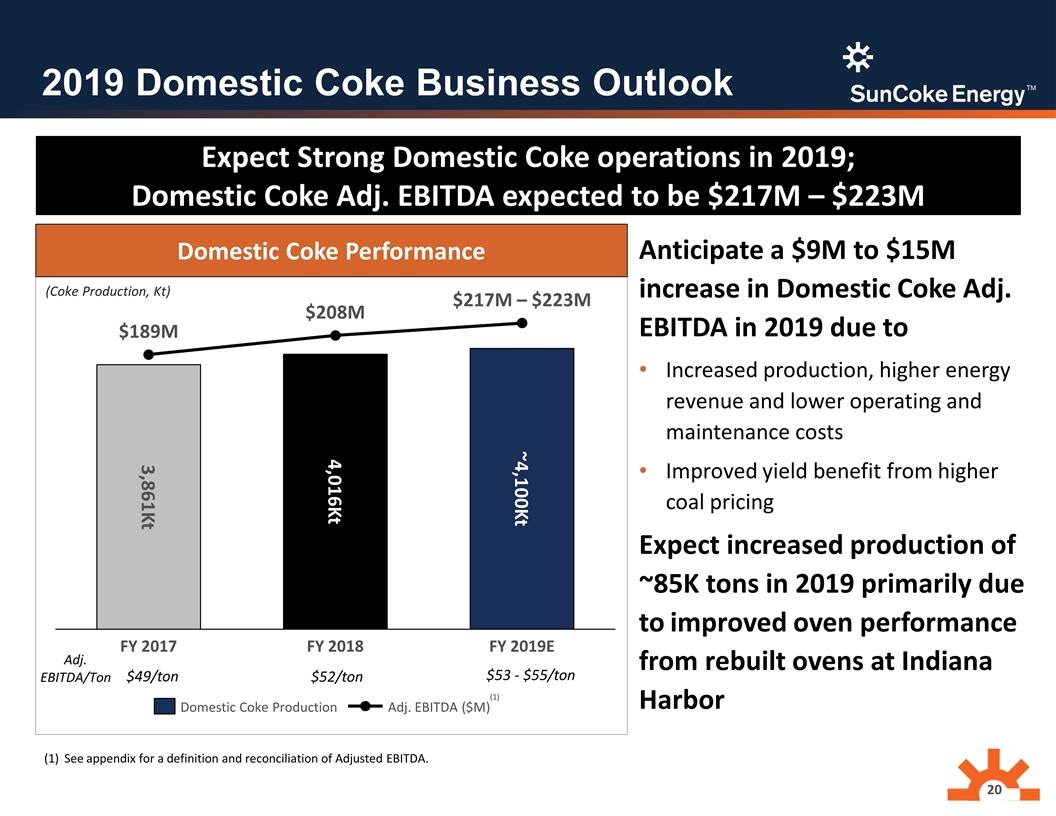
2019 Domestic Coke Business Outlook Expect Strong Domestic Coke operations in 2019; Domestic Coke Adj. EBITDA expected to be $217M – $223M Domestic Coke Performance $217M – $223M ~4,100Kt Kt $M $M Kt Anticipate a $9M to $15M increase in Domestic Coke Adj. EBITDA in 2019 due to Increased production, higher energy revenue and lower operating and maintenance costs Improved yield benefit from higher coal pricing Expect increased production of ~85K tons in 2019 primarily due to improved oven performance from rebuilt ovens at Indiana Harbor See appendix for a definition and reconciliation of Adjusted EBITDA. (Coke Production, Kt) (1) $49/ton $52/ton $53 - $55/ton Adj. EBITDA/Ton
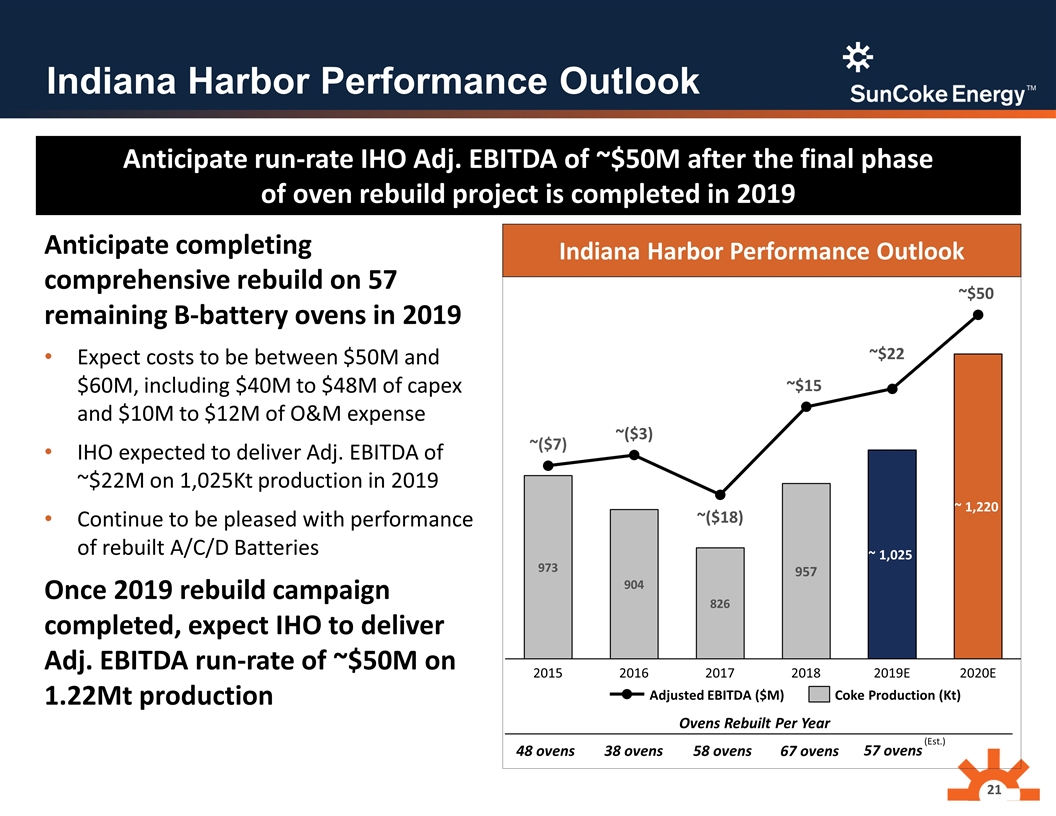
Indiana Harbor Performance Outlook ~ ~ ~ ~ ~ ~ ~ ~ Indiana Harbor Performance Outlook Anticipate completing comprehensive rebuild on 57 remaining B-battery ovens in 2019 Expect costs to be between $50M and $60M, including $40M to $48M of capex and $10M to $12M of O&M expense IHO expected to deliver Adj. EBITDA of ~$22M on 1,025Kt production in 2019 Continue to be pleased with performance of rebuilt A/C/D Batteries Once 2019 rebuild campaign completed, expect IHO to deliver Adj. EBITDA run-rate of ~$50M on 1.22Mt production Ovens Rebuilt Per Year 48 ovens 38 ovens 58 ovens 67 ovens 57 ovens Anticipate run-rate IHO Adj. EBITDA of ~$50M after the final phase of oven rebuild project is completed in 2019 (Est.)
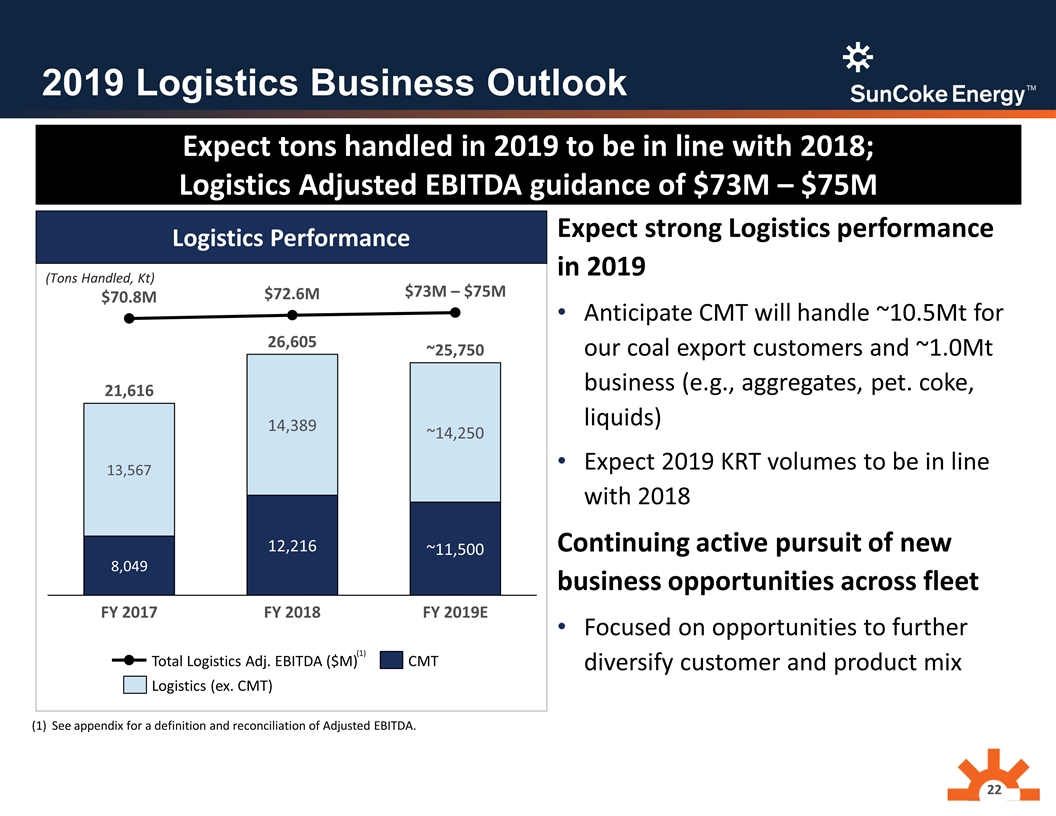
2019 Logistics Business Outlook Expect tons handled in 2019 to be in line with 2018; Logistics Adjusted EBITDA guidance of $73M – $75M M M ~ $73M – $75M ~ ~ (Tons Handled, Kt) Expect strong Logistics performance in 2019 Anticipate CMT will handle ~10.5Mt for our coal export customers and ~1.0Mt business (e.g., aggregates, pet. coke, liquids) Expect 2019 KRT volumes to be in line with 2018 Continuing active pursuit of new business opportunities across fleet Focused on opportunities to further diversify customer and product mix Logistics Performance See appendix for a definition and reconciliation of Adjusted EBITDA. (1)
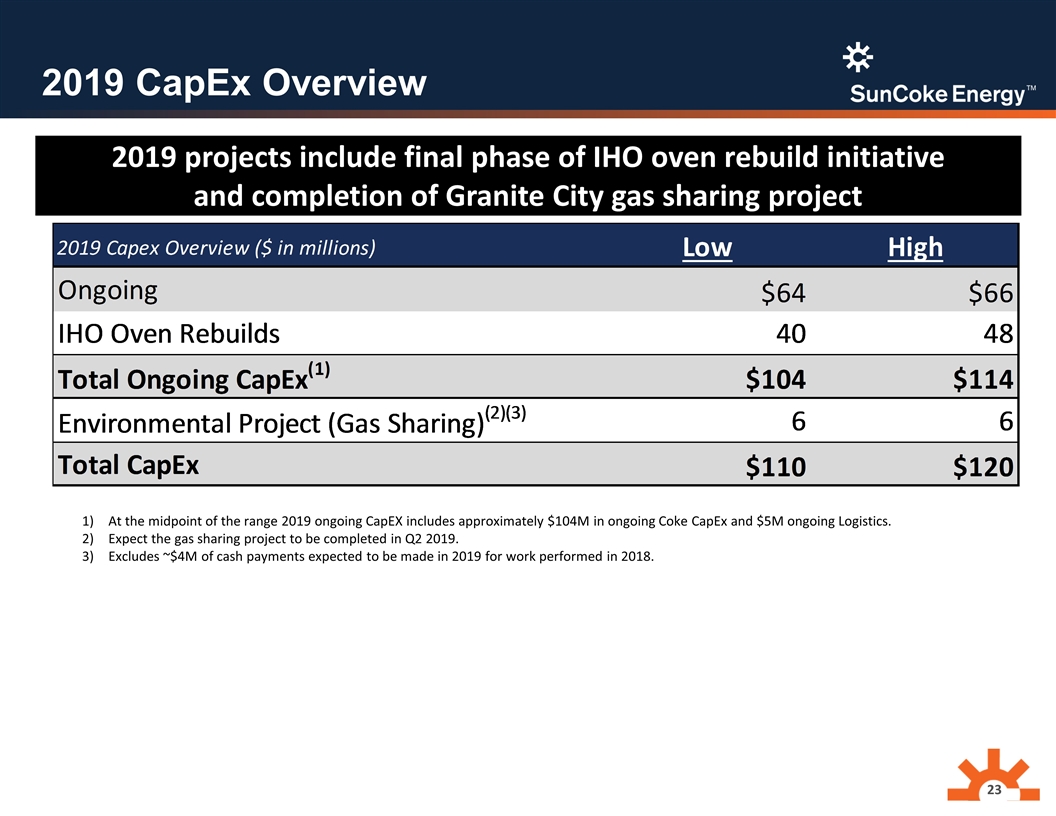
2019 CapEx Overview 2019 projects include final phase of IHO oven rebuild initiative and completion of Granite City gas sharing project At the midpoint of the range 2019 ongoing CapEX includes approximately $104M in ongoing Coke CapEx and $5M ongoing Logistics. Expect the gas sharing project to be completed in Q2 2019. Excludes ~$4M of cash payments expected to be made in 2019 for work performed in 2018.
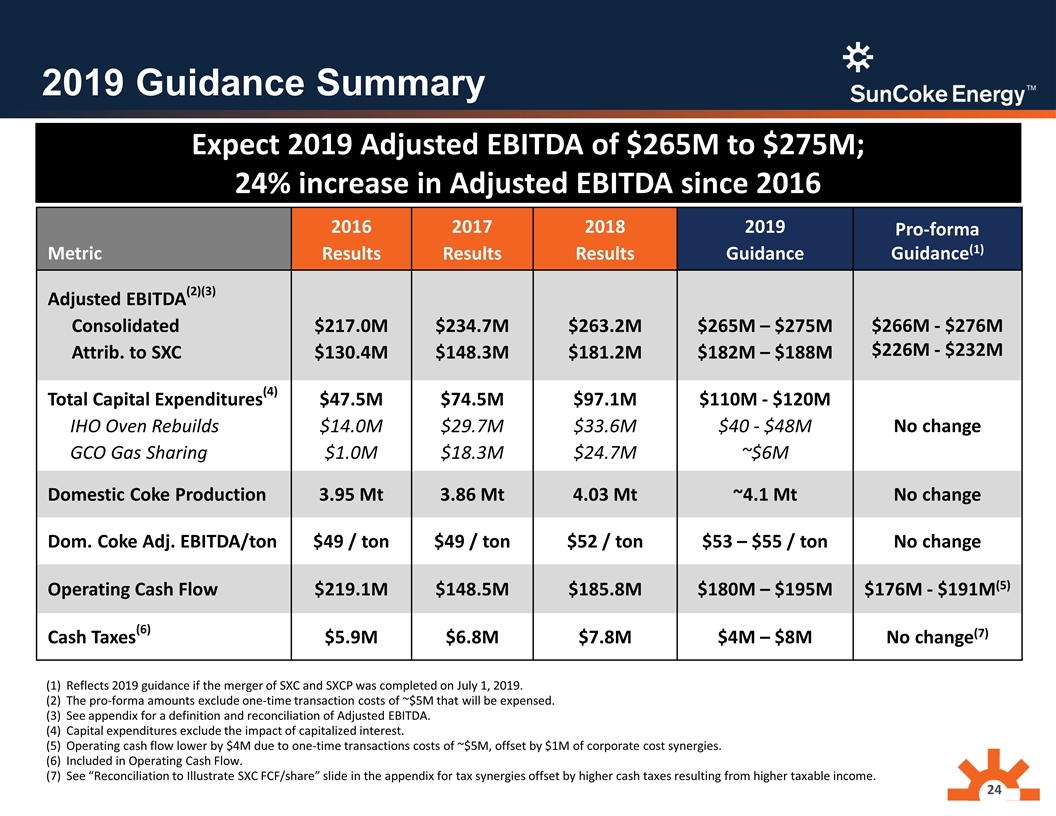
2019 Guidance Summary Metric 2016 Results 2017 Results 2018 Results 2019 Guidance Pro-forma Guidance(1) Adjusted EBITDA(2)(3) Consolidated Attrib. to SXC $217.0M $130.4M $234.7M $148.3M $263.2M $181.2M $265M – $275M $182M – $188M $266M - $276M $226M - $232M Total Capital Expenditures(4) IHO Oven Rebuilds GCO Gas Sharing $47.5M $14.0M $1.0M $74.5M $29.7M $18.3M $97.1M $33.6M $24.7M $110M - $120M $40 - $48M ~$6M No change Domestic Coke Production 3.95 Mt 3.86 Mt 4.03 Mt ~4.1 Mt No change Dom. Coke Adj. EBITDA/ton $49 / ton $49 / ton $52 / ton $53 – $55 / ton No change Operating Cash Flow $219.1M $148.5M $185.8M $180M – $195M $176M - $191M(5) Cash Taxes(6) $5.9M $6.8M $7.8M $4M – $8M No change(7) Reflects 2019 guidance if the merger of SXC and SXCP was completed on July 1, 2019. The pro-forma amounts exclude one-time transaction costs of ~$5M that will be expensed. See appendix for a definition and reconciliation of Adjusted EBITDA. Capital expenditures exclude the impact of capitalized interest. Operating cash flow lower by $4M due to one-time transactions costs of ~$5M, offset by $1M of corporate cost synergies. Included in Operating Cash Flow. See “Reconciliation to Illustrate SXC FCF/share” slide in the appendix for tax synergies offset by higher cash taxes resulting from higher taxable income. Expect 2019 Adjusted EBITDA of $265M to $275M; 24% increase in Adjusted EBITDA since 2016
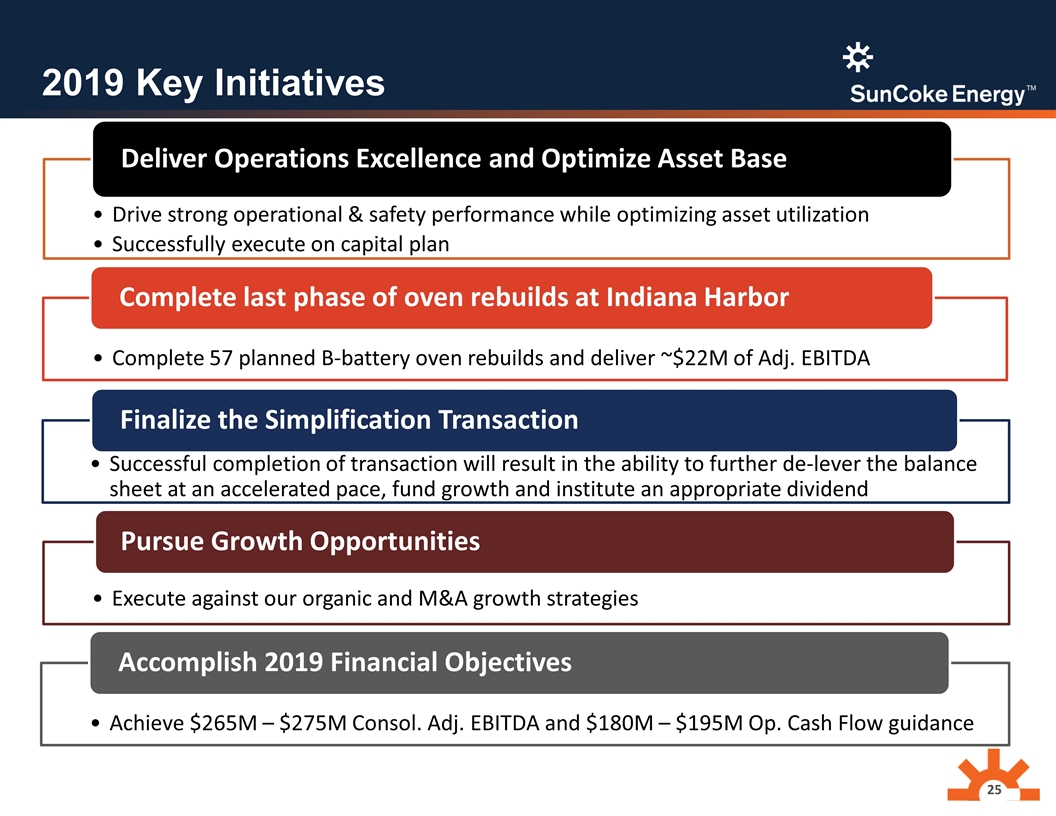
2019 Key Initiatives Drive strong operational & safety performance while optimizing asset utilization Successfully execute on capital plan Deliver Operations Excellence and Optimize Asset Base Complete 57 planned B-battery oven rebuilds and deliver ~$22M of Adj. EBITDA Complete last phase of oven rebuilds at Indiana Harbor Successful completion of transaction will result in the ability to further de-lever the balance sheet at an accelerated pace, fund growth and institute an appropriate dividend Finalize the Simplification Transaction Achieve $265M – $275M Consol. Adj. EBITDA and $180M – $195M Op. Cash Flow guidance Accomplish 2019 Financial Objectives Execute against our organic and M&A growth strategies Pursue Growth Opportunities
Questions
Appendix
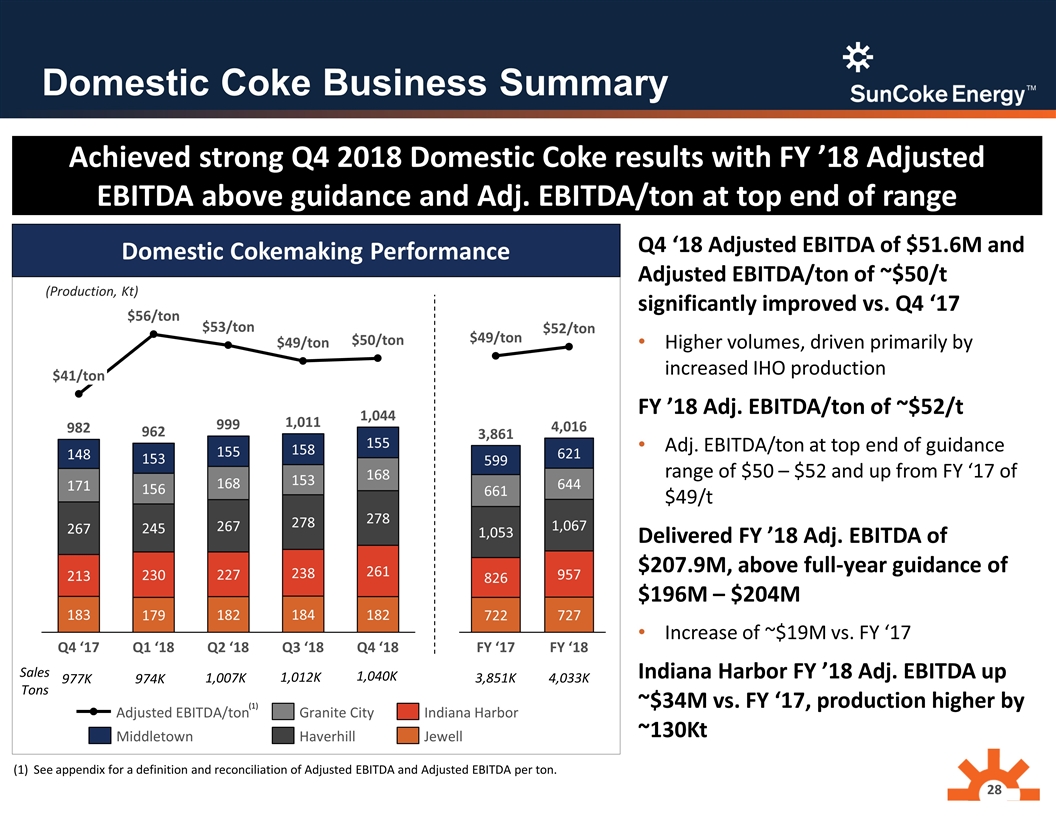
Domestic Coke Business Summary Achieved strong Q4 2018 Domestic Coke results with FY ’18 Adjusted EBITDA above guidance and Adj. EBITDA/ton at top end of range Domestic Cokemaking Performance /ton /ton /ton /ton /ton 977K 974K 1,007K Sales Tons (Production, Kt) 1,012K See appendix for a definition and reconciliation of Adjusted EBITDA and Adjusted EBITDA per ton. (1) /ton /ton 3,851K 4,033K 1,040K Q4 ‘18 Adjusted EBITDA of $51.6M and Adjusted EBITDA/ton of ~$50/t significantly improved vs. Q4 ‘17 Higher volumes, driven primarily by increased IHO production FY ’18 Adj. EBITDA/ton of ~$52/t Adj. EBITDA/ton at top end of guidance range of $50 – $52 and up from FY ‘17 of $49/t Delivered FY ’18 Adj. EBITDA of $207.9M, above full-year guidance of $196M – $204M Increase of ~$19M vs. FY ‘17 Indiana Harbor FY ’18 Adj. EBITDA up ~$34M vs. FY ‘17, production higher by ~130Kt
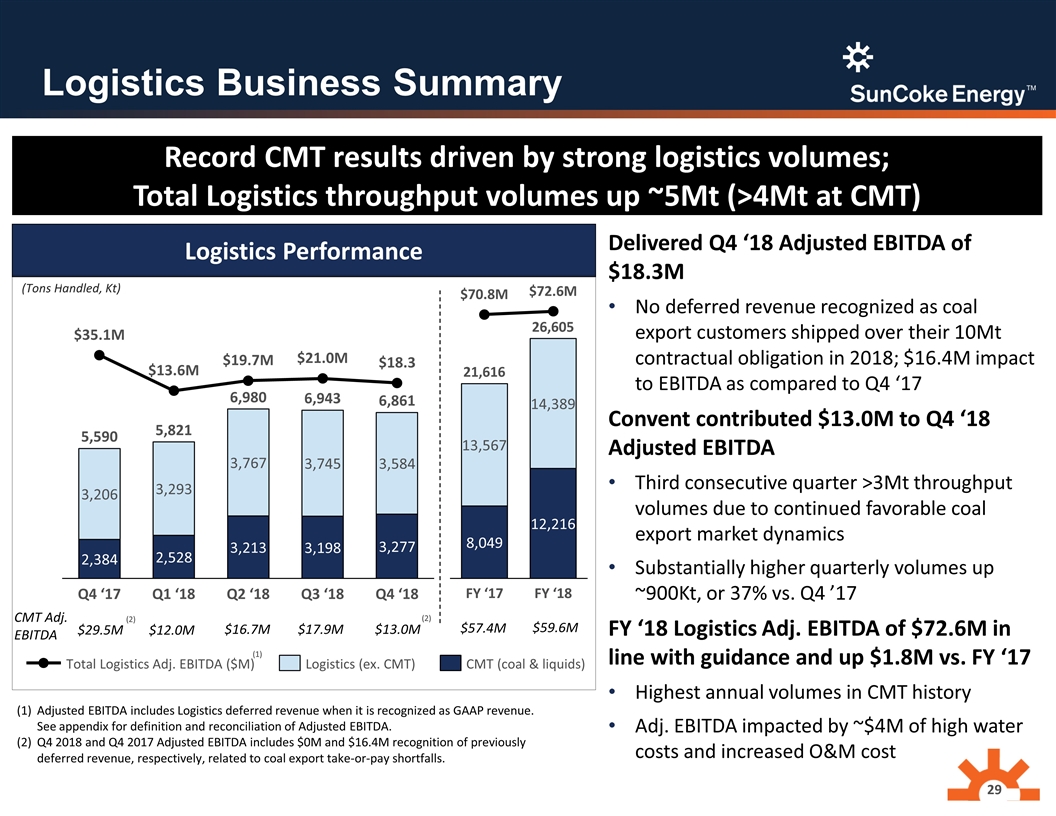
$29.5M Logistics Business Summary Record CMT results driven by strong logistics volumes; Total Logistics throughput volumes up ~5Mt (>4Mt at CMT) Logistics Performance Delivered Q4 ‘18 Adjusted EBITDA of $18.3M No deferred revenue recognized as coal export customers shipped over their 10Mt contractual obligation in 2018; $16.4M impact to EBITDA as compared to Q4 ‘17 Convent contributed $13.0M to Q4 ‘18 Adjusted EBITDA Third consecutive quarter >3Mt throughput volumes due to continued favorable coal export market dynamics Substantially higher quarterly volumes up ~900Kt, or 37% vs. Q4 ’17 FY ‘18 Logistics Adj. EBITDA of $72.6M in line with guidance and up $1.8M vs. FY ‘17 Highest annual volumes in CMT history Adj. EBITDA impacted by ~$4M of high water costs and increased O&M cost (Tons Handled, Kt) Adjusted EBITDA includes Logistics deferred revenue when it is recognized as GAAP revenue. See appendix for definition and reconciliation of Adjusted EBITDA. Q4 2018 and Q4 2017 Adjusted EBITDA includes $0M and $16.4M recognition of previously deferred revenue, respectively, related to coal export take-or-pay shortfalls. M M M M M M CMT Adj. EBITDA $12.0M $16.7M $17.9M $13.0M $57.4M $59.6M (2) (2) (1)
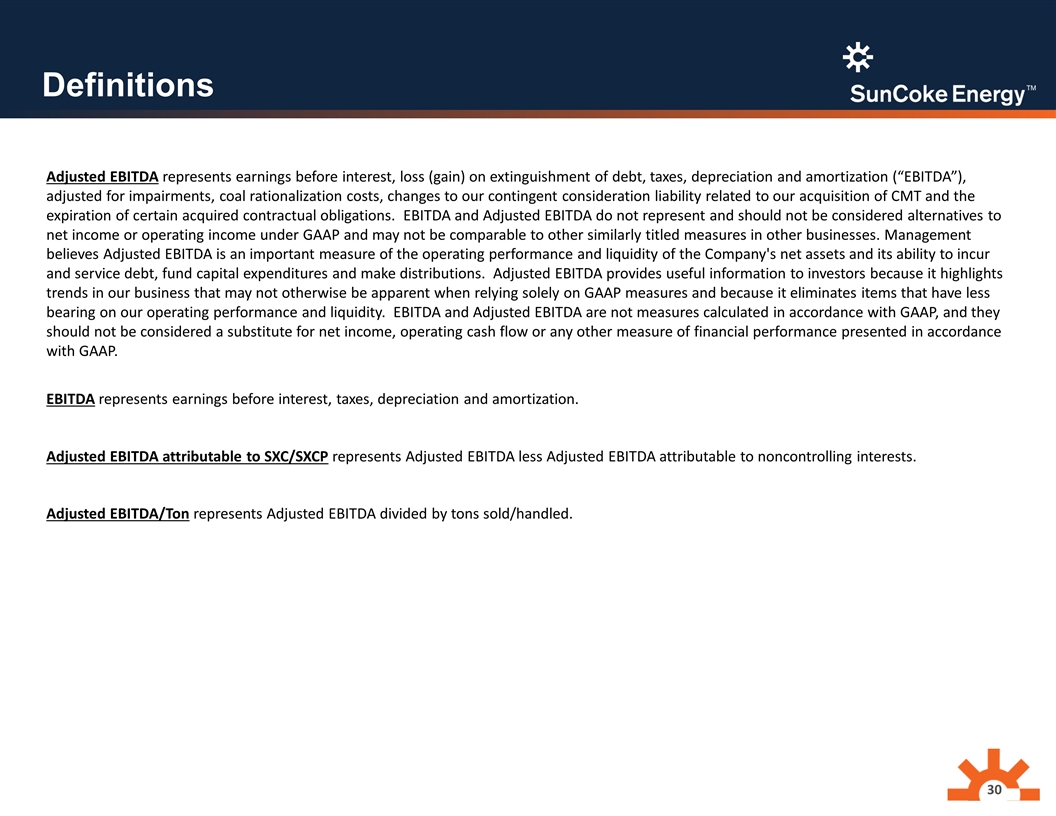
Definitions Adjusted EBITDA represents earnings before interest, loss (gain) on extinguishment of debt, taxes, depreciation and amortization (“EBITDA”), adjusted for impairments, coal rationalization costs, changes to our contingent consideration liability related to our acquisition of CMT and the expiration of certain acquired contractual obligations. EBITDA and Adjusted EBITDA do not represent and should not be considered alternatives to net income or operating income under GAAP and may not be comparable to other similarly titled measures in other businesses. Management believes Adjusted EBITDA is an important measure of the operating performance and liquidity of the Company's net assets and its ability to incur and service debt, fund capital expenditures and make distributions. Adjusted EBITDA provides useful information to investors because it highlights trends in our business that may not otherwise be apparent when relying solely on GAAP measures and because it eliminates items that have less bearing on our operating performance and liquidity. EBITDA and Adjusted EBITDA are not measures calculated in accordance with GAAP, and they should not be considered a substitute for net income, operating cash flow or any other measure of financial performance presented in accordance with GAAP. EBITDA represents earnings before interest, taxes, depreciation and amortization. Adjusted EBITDA attributable to SXC/SXCP represents Adjusted EBITDA less Adjusted EBITDA attributable to noncontrolling interests. Adjusted EBITDA/Ton represents Adjusted EBITDA divided by tons sold/handled.
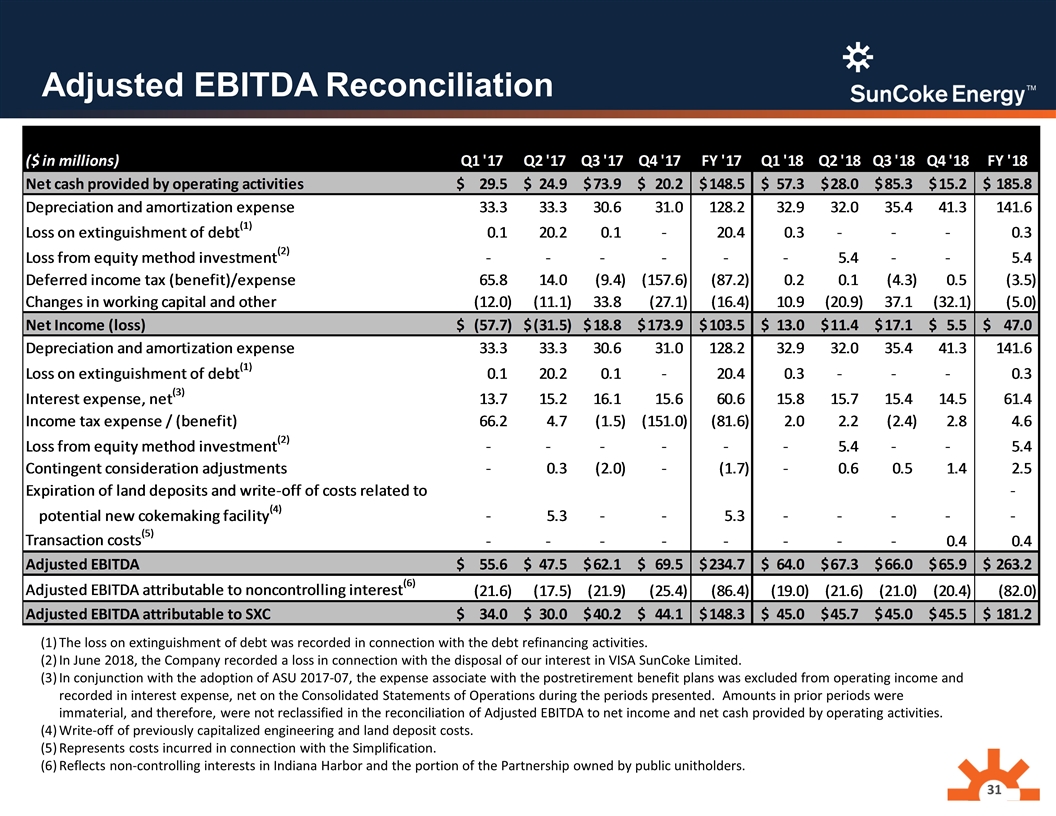
Adjusted EBITDA Reconciliation The loss on extinguishment of debt was recorded in connection with the debt refinancing activities. In June 2018, the Company recorded a loss in connection with the disposal of our interest in VISA SunCoke Limited. In conjunction with the adoption of ASU 2017-07, the expense associate with the postretirement benefit plans was excluded from operating income and recorded in interest expense, net on the Consolidated Statements of Operations during the periods presented. Amounts in prior periods were immaterial, and therefore, were not reclassified in the reconciliation of Adjusted EBITDA to net income and net cash provided by operating activities. Write-off of previously capitalized engineering and land deposit costs. Represents costs incurred in connection with the Simplification. Reflects non-controlling interests in Indiana Harbor and the portion of the Partnership owned by public unitholders.
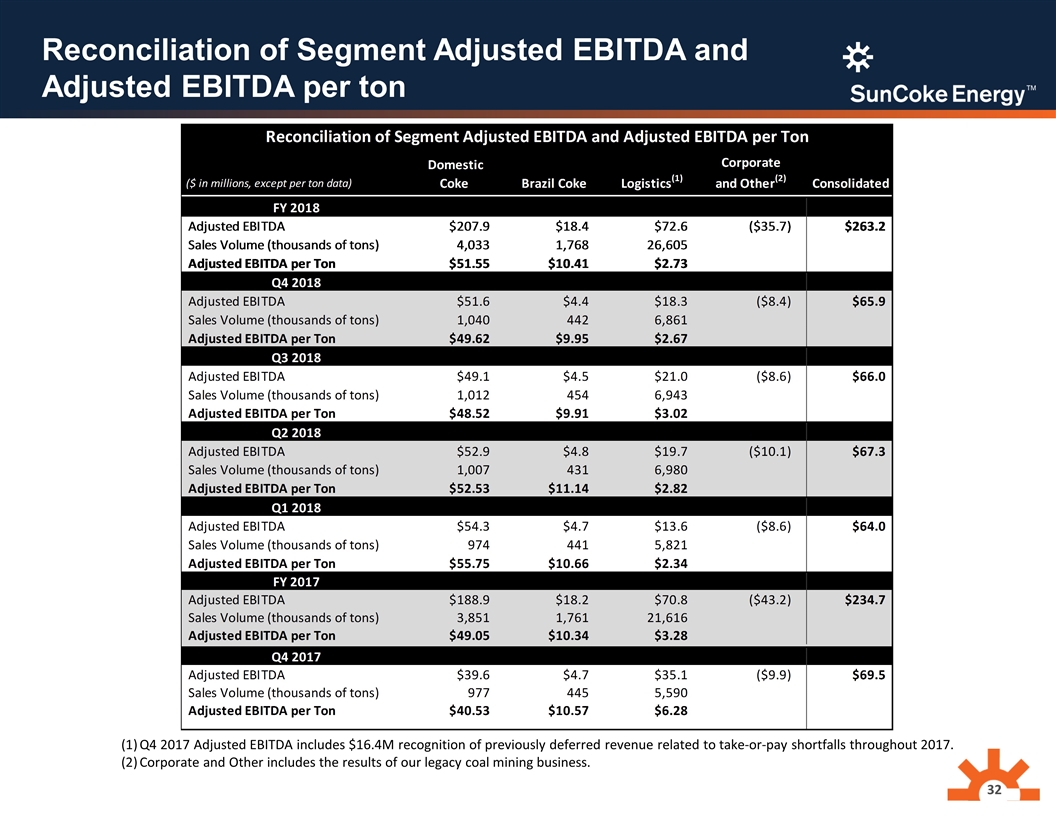
Reconciliation of Segment Adjusted EBITDA and Adjusted EBITDA per ton Q4 2017 Adjusted EBITDA includes $16.4M recognition of previously deferred revenue related to take-or-pay shortfalls throughout 2017. Corporate and Other includes the results of our legacy coal mining business.
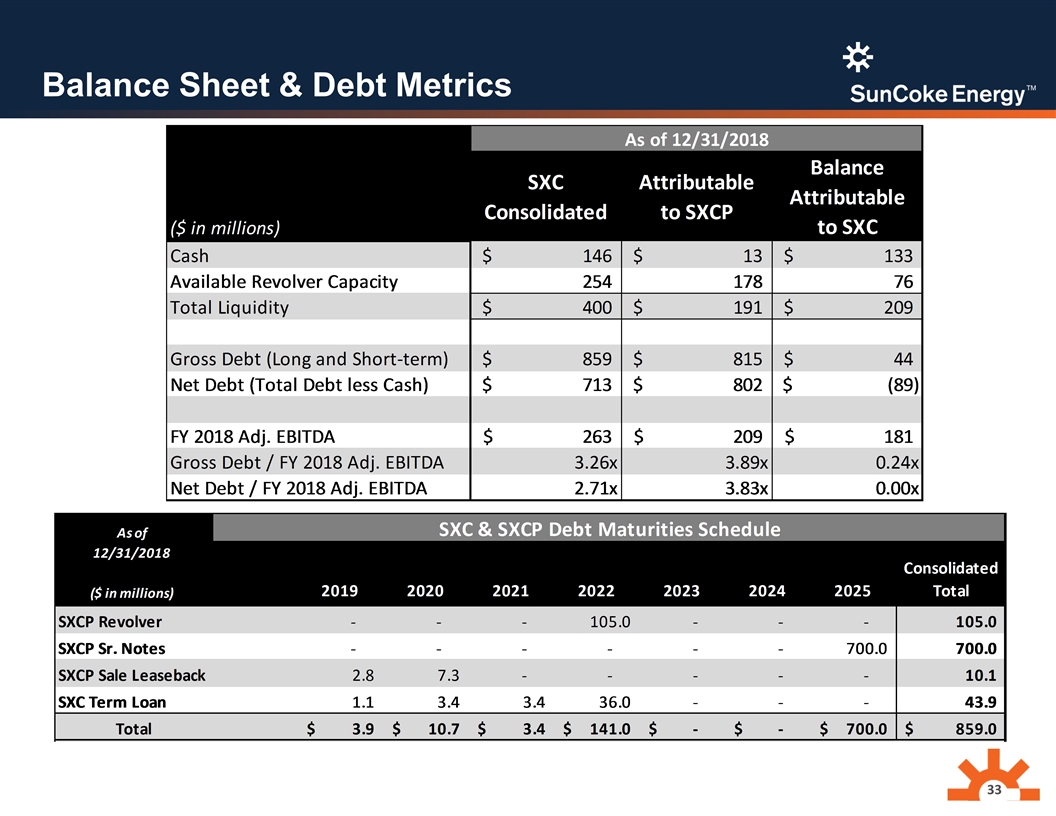
Balance Sheet & Debt Metrics
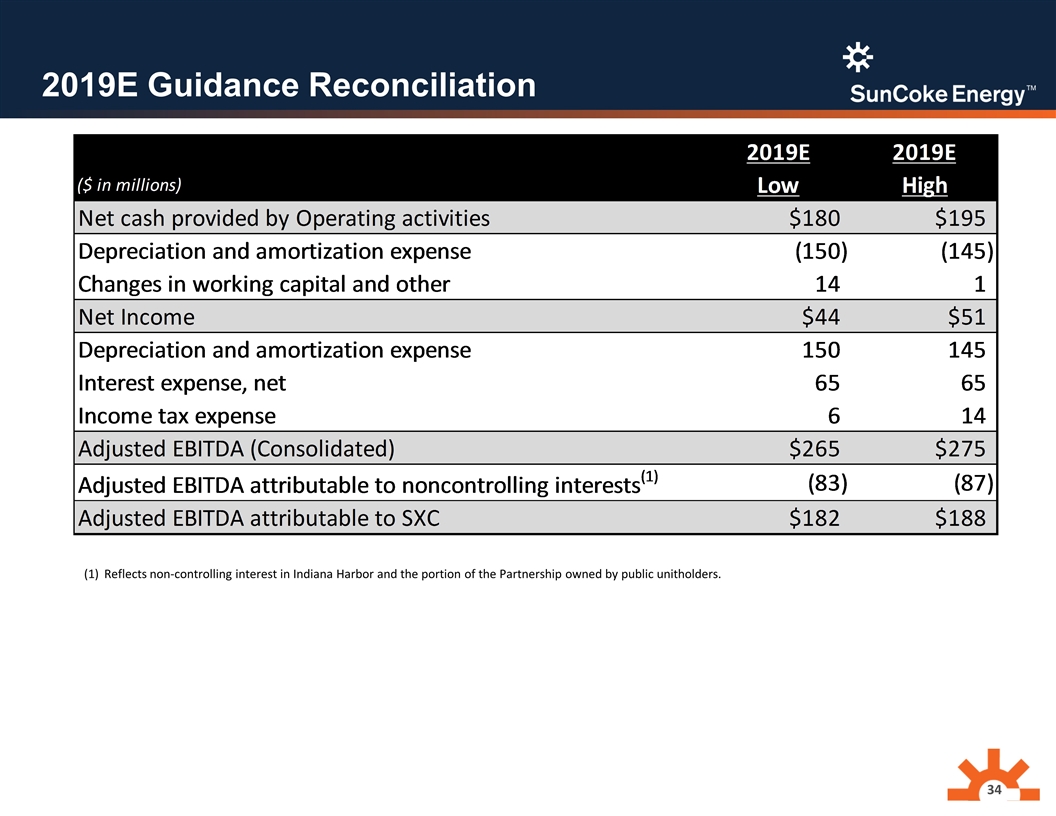
2019E Guidance Reconciliation Reflects non-controlling interest in Indiana Harbor and the portion of the Partnership owned by public unitholders.
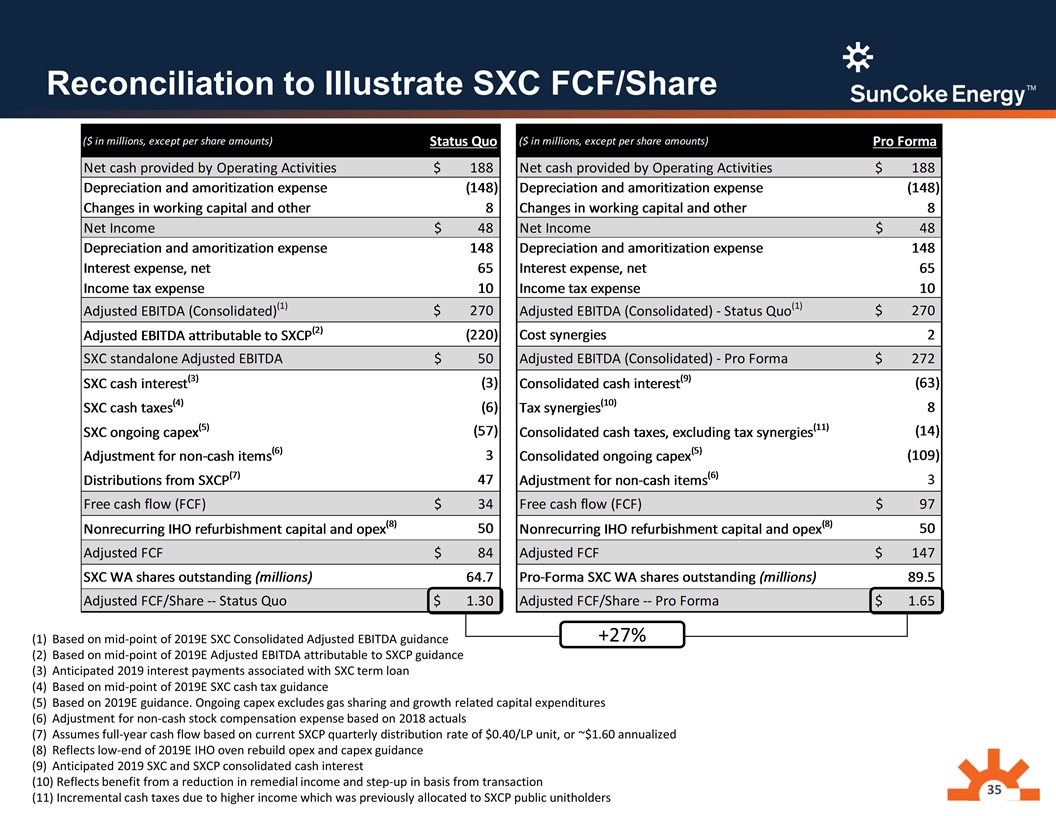
Reconciliation to Illustrate SXC FCF/Share Based on mid-point of 2019E SXC Consolidated Adjusted EBITDA guidance Based on mid-point of 2019E Adjusted EBITDA attributable to SXCP guidance Anticipated 2019 interest payments associated with SXC term loan Based on mid-point of 2019E SXC cash tax guidance Based on 2019E guidance. Ongoing capex excludes gas sharing and growth related capital expenditures Adjustment for non-cash stock compensation expense based on 2018 actuals Assumes full-year cash flow based on current SXCP quarterly distribution rate of $0.40/LP unit, or ~$1.60 annualized Reflects low-end of 2019E IHO oven rebuild opex and capex guidance Anticipated 2019 SXC and SXCP consolidated cash interest Reflects benefit from a reduction in remedial income and step-up in basis from transaction Incremental cash taxes due to higher income which was previously allocated to SXCP public unitholders +27%
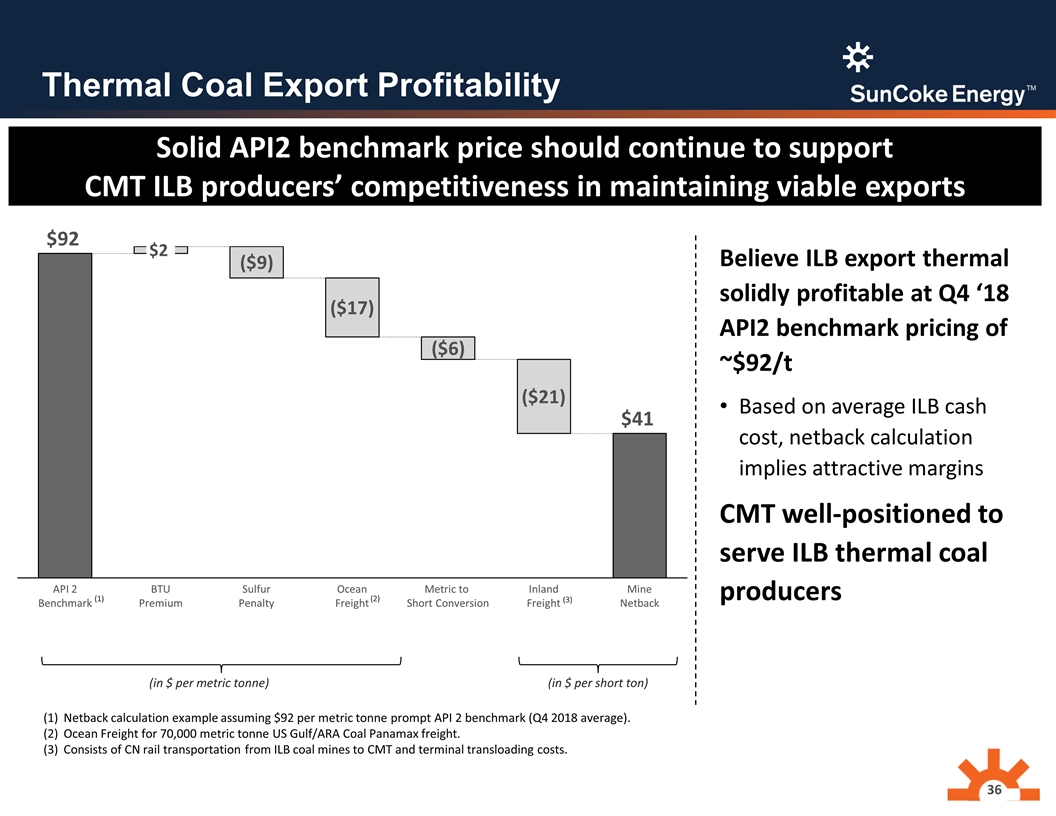
Thermal Coal Export Profitability (in $ per metric tonne) (1) (2) Believe ILB export thermal solidly profitable at Q4 ‘18 API2 benchmark pricing of ~$92/t Based on average ILB cash cost, netback calculation implies attractive margins CMT well-positioned to serve ILB thermal coal producers (in $ per short ton) (3) Netback calculation example assuming $92 per metric tonne prompt API 2 benchmark (Q4 2018 average). Ocean Freight for 70,000 metric tonne US Gulf/ARA Coal Panamax freight. Consists of CN rail transportation from ILB coal mines to CMT and terminal transloading costs. Solid API2 benchmark price should continue to support CMT ILB producers’ competitiveness in maintaining viable exports


