Exhibit 99.1
NasdaqGM: SAEX This brochure may include certain forward - looking statements, including statements regarding future financial performance, future growth and future acquisitions . These statements are based on SAE’s current expectations or beliefs and are subject to uncertainty and changes in circumstances . Actual results may vary materially from those expressed or implied by the statements herein due to changes in economic, business, competitive and/or regulatory factors, and other risks and uncertainties affecting the operation of SAE’s business . These risks, uncertainties and contingencies are set forth in SAE’s filings with the Securities and Exchange Commission . The information set forth herein should be read in light of such risks . Except as required by law, SAE is not under any obligation to, and expressly disclaims any obligation to, update or alter its forward - looking statements, whether as a result of new information, future events, changes in assumptions or otherwise . NasdaqGM: SAEX www.saexploration.com 1 CORPORATE OVERVIEW SAExploration is an internationally - focused oilfield services company offering a full range of vertically - integrated seismic data acquisition and logistical support services in remote and complex environments throughout Alaska, Canada, South America, Southeast Asia and Africa . In addition to the acquisition of 2 - D, 3 - D, time - lapse 4 - D and multi - component seismic data on land, in transition zones and offshore in depths reaching 3 , 000 meters, SAE offers a full suite of logistical support and in - field processing services, such as program design, planning and permitting, camp services and infrastructure, surveying, drilling, environmental assessment and reclamation and community relations . SAE operates crews around the world, performing major projects for its blue - chip customer base, which includes major integrated oil companies, national oil companies and large independent oil and gas exploration companies . Operations are supported through a multi - national presence in the U . S . , Canada, Peru, Colombia, Bolivia, Brazil, New Zealand and Malaysia . SAE was founded in 2006 and is headquartered in Houston, TX . It went public in 2013 via a reverse merger and currently trades on the Nasdaq stock exchange under the ticker symbol “SAEX” . Ticker Symbol : Stock Price : 52 - Week Range : 50 d Avg . Volume : Total Shares (PF) : Market Cap . (PF) : Total Debt (PF) : Headquarters : NasdaqGM: SAEX $2.83 $2.23 - $8.40 8 ,908 17.3 mm $48.9 mm $140.0 mm Houston, TX Source : Nasdaq stock exchange and Company filings . Market data as of close of trading on September 24 , 2015 ( 1 ) Certain market figures have been adjusted to reflect the recent $ 10 million exchange of senior secured notes for ~ 2 . 4 million shares of common stock COMPANY PROFILE (1) KEY INVESTMENT HIGHLIGHTS FULL SERVICE LOGISTICS PROVIDER Majority of revenue is earned through logistics - related activities performed in - house Vertically - integrated model allows customers to work with one company instead of multiple sub - contractors CASH FLOW POTENTIAL GENERATED BY STABLE BACKLOG Focused on high - growth, underdeveloped markets offering ability to leverage fully integrated service offering Disciplined investment into new markets while growing presence in existing markets INTERNATIONAL GEOGRAPHIC DIVERSIFICATION Subject matter experts on operating in the most geographically complex and logistically challenging resource producing regions of the world Vast experience and deep relationships with local communities and governments EXTENSIVE EXPERIENCE IN CHALLENGING ENVIRONMENTS Approximately $ 190 m in backlog and $ 673 m of total bids on June 30 , 2015 , adjusted to reflect four recently announced project awards totaling $ 137 m Strong free cash flow generation with high ROI and clear visibility of future performance STRONG RELATIONSHIPS WITH BLUE CHIP CUSTOMERS Selected relationships with key customers date back 30 years Majority of clients are well - established IOCs, NOCs, and large independents EXPERIENCED MANAGEMENT TEAM WITH SIGNIFICANT OWNERSHIP STAKE Seasoned and dedicated management team with deep industry knowledge having managed multiple companies through various cycles Top three executive officers own approximately one - third of the company ; aligning interests with stockholders INVESTOR CONTACT Ryan Abney Vice President, Capital Markets and IR (281) 258 - 4409 rabney@saexploration.com
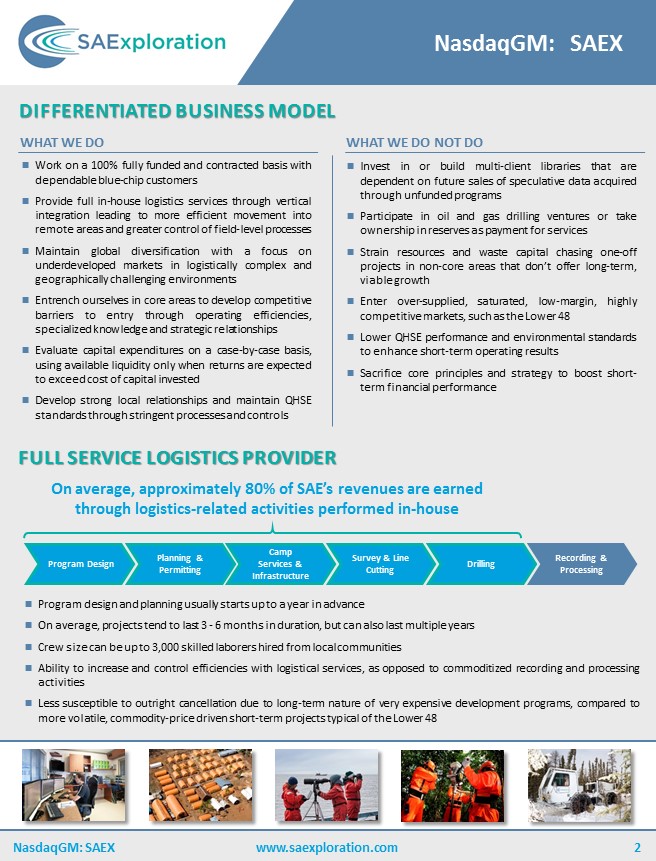
NasdaqGM: SAEX NasdaqGM: SAEX www.saexploration.com 2 Program Design Planning & Permitting Camp Services & Infrastructure Survey & Line Cutting Drilling Recording & Processing On average, approximately 80% of SAE’s revenues are earned through logistics - related activities performed in - house Program design and planning usually starts up to a year in advance On average, projects tend to last 3 - 6 months in duration, but can also last multiple years Crew size can be up to 3 , 000 skilled laborers hired from local communities Ability to increase and control efficiencies with logistical services, as opposed to commoditized recording and processing activities Less susceptible to outright cancellation due to long - term nature of very expensive development programs, compared to more volatile, commodity - price driven short - term projects typical of the Lower 48 FULL SERVICE LOGISTICS PROVIDER Work on a 100 % fully funded and contracted basis with dependable blue - chip customers Provide full in - house logistics services through vertical integration leading to more efficient movement into remote areas and greater control of field - level processes Maintain global diversification with a focus on underdeveloped markets in logistically complex and geographically challenging environments Entrench ourselves in core areas to develop competitive barriers to entry through operating efficiencies, specialized knowledge and strategic relationships Evaluate capital expenditures on a case - by - case basis, using available liquidity only when returns are expected to exceed cost of capital invested Develop strong local relationships and maintain QHSE standards through stringent processes and controls DIFFERENTIATED BUSINESS MODEL Invest in or build multi - client libraries that are dependent on future sales of speculative data acquired through unfunded programs Participate in oil and gas drilling ventures or take ownership in reserves as payment for services Strain resources and waste capital chasing one - off projects in non - core areas that don’t offer long - term, viable growth Enter over - supplied, saturated, low - margin, highly competitive markets, such as the Lower 48 Lower QHSE performance and environmental standards to enhance short - term operating results Sacrifice core principles and strategy to boost short - term financial performance WHAT WE DO WHAT WE DO NOT DO
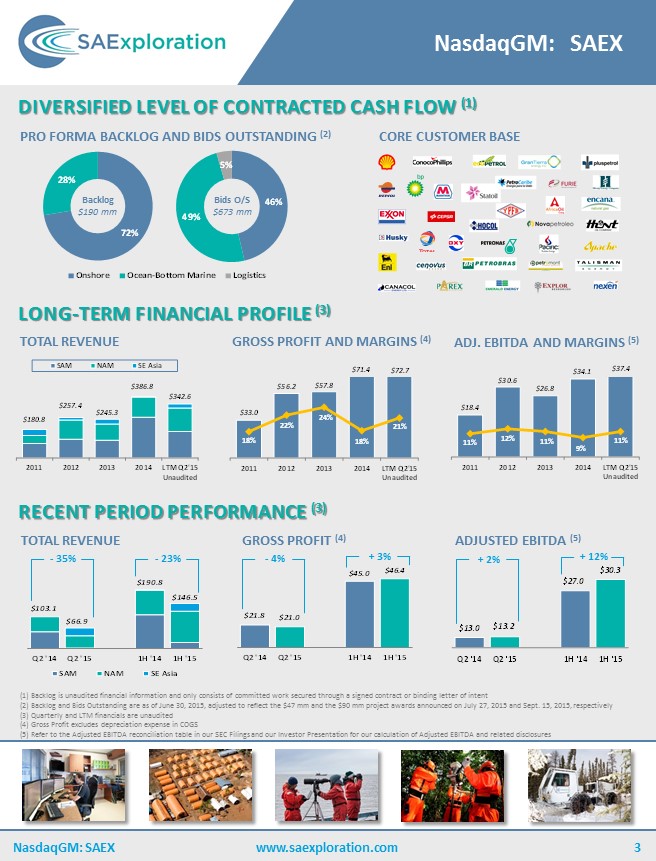
46% 49% 5% Onshore Ocean-Bottom Marine Logistics 72% 28% Onshore Ocean-Bottom Marine NasdaqGM: SAEX NasdaqGM: SAEX www.saexploration.com 3 LONG - TERM FINANCIAL PROFILE (3) DIVERSIFIED LEVEL OF CONTRACTED CASH FLOW (1) RECENT PERIOD PERFORMANCE (3) PRO FORMA BACKLOG AND BIDS OUTSTANDING ( 2 ) CORE CUSTOMER BASE TOTAL REVENUE ADJ . EBITDA AND MARGINS ( 5 ) GROSS PROFIT AND MARGINS ( 4 ) TOTAL REVENUE ADJUSTED EBITDA ( 5 ) GROSS PROFIT ( 4 ) ( 1 ) Backlog is unaudited financial information and only consists of committed work secured through a signed contract or binding letter of intent ( 2 ) Backlog and Bids Outstanding are as of June 30 , 2015 , adjusted to reflect the $ 47 mm and the $ 90 mm project awards announced on July 27 , 2015 and Sept . 15 , 2015 , respectively ( 3 ) Quarterly and LTM financials are unaudited ( 4 ) Gross Profit excludes depreciation expense in COGS ( 5 ) Refer to the Adjusted EBITDA reconciliation table in our SEC Filings and our Investor Presentation for our calculation of Adjusted EBITDA and related disclosures Backlog $190 mm Bids O/S $ 6 73 mm 30% 65% 5% Onshore Ocean-Bottom Marine Logistics $180.8 $257.4 $245.3 $386.8 $342.6 2011 2012 2013 2014 LTM Q2'15 Unaudited SAM NAM SE Asia $33.0 $56.2 $57.8 $71.4 $72.7 18% 22% 24% 18% 21% 13% 15% 18% 20% 23% 25% 28% 30% $0 $10 $20 $30 $40 $50 $60 $70 2011 2012 2013 2014 LTM Q2'15 Unaudited $18.4 $30.6 $26.8 $34.1 $37.4 11% 12% 11% 9% 11% 2% 3% 4% 5% 6% 7% 8% 9% 10% 11% 12% 13% 14% 15% 16% 17% 18% 19% 20% 21% 22% 23% 24% 25% 26% 27% 28% 29% 30% $0 $5 $10 $15 $20 $25 $30 $35 2011 2012 2013 2014 LTM Q2'15 Unaudited $103.1 $66.9 $190.8 $146.5 Q2 '14 Q2 '15 1H '14 1H '15 SAM NAM SE Asia - 35% - 23% $21.8 $21.0 $45.0 $46.4 Q2 '14 Q2 '15 1H '14 1H '15 $13.0 $13.2 $27.0 $30.3 Q2 '14 Q2 '15 1H '14 1H '15 - 4 % + 3% + 2 % + 12%
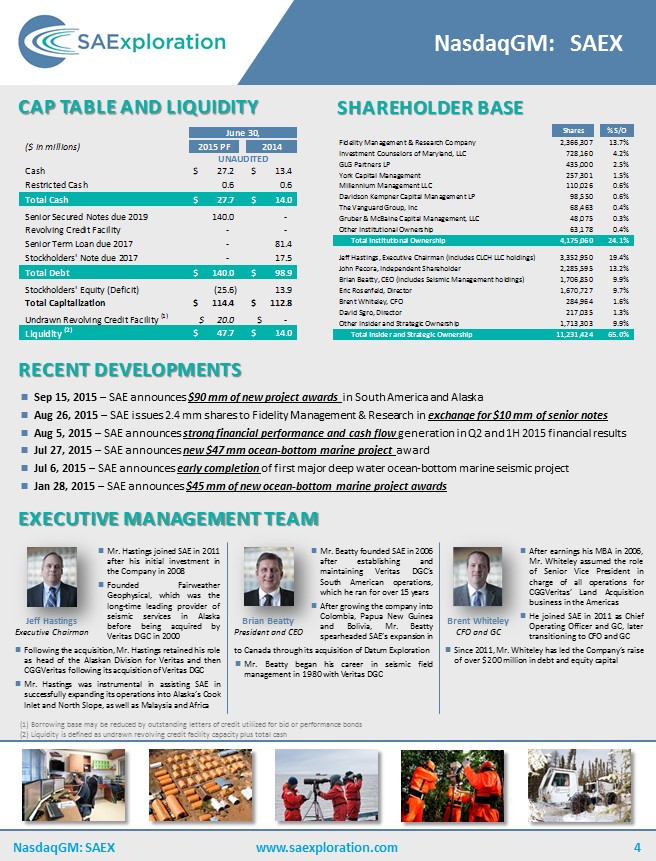
NasdaqGM: SAEX NasdaqGM: SAEX www.saexploration.com 4 RECENT DEVELOPMENTS CAP TABLE AND LIQUIDITY EXECUTIVE MANAGEMENT TEAM SHAREHOLDER BASE Jeff Hastings Executive Chairman Brian Beatty President and CEO Brent Whiteley CFO and GC Mr . Hastings joined SAE in 2011 after his initial investment in the Company in 2008 Founded Fairweather Geophysical, which was the long - time leading provider of seismic services in Alaska before being acquired by Veritas DGC in 2000 Following the acquisition, Mr . Hastings retained his role as head of the Alaskan Division for Veritas and then CGGVeritas following its acquisition of Veritas DGC Mr . Hastings was instrumental in assisting SAE in successfully expanding its operations into Alaska’s Cook Inlet and North Slope, as well as Malaysia and Africa Mr . Beatty founded SAE in 2006 after establishing and maintaining Veritas DGC’s South American operations, which he ran for over 15 years After growing the company into Colombia, Papua New Guinea and Bolivia, Mr . Beatty spearheaded SAE’s expansion in to Canada through its acquisition of Datum Exploration Mr . Beatty began his career in seismic field management in 1980 with Veritas DGC After earnings his MBA in 2006 , Mr . Whiteley assumed the role of Senior Vice President in charge of all operations for CGGVeritas ’ Land Acquisition business in the Americas He joined SAE in 2011 as Chief Operating Officer and GC, later transitioning to CFO and GC Since 2011 , Mr . Whiteley has led the Company’s raise of over $ 200 million in debt and equity capital Sep 15 , 2015 – SAE announces $ 90 mm of new project awards in South America and Alaska Aug 26 , 2015 – SAE issues 2 . 4 mm shares to Fidelity Management & Research in exchange for $ 10 mm of senior notes Aug 5 , 2015 – SAE announces strong financial performance and cash flow generation in Q 2 and 1 H 2015 financial results Jul 27 , 2015 – SAE announces new $ 47 mm ocean - bottom marine project award Jul 6 , 2015 – SAE announces early completion of first major deep water ocean - bottom marine seismic project Jan 28 , 2015 – SAE announces $ 45 mm of new ocean - bottom marine project awards ( 1 ) Borrowing base may be reduced by outstanding letters of credit utilized for bid or performance bonds ( 2 ) Liquidity is defined as undrawn revolving credit facility capacity plus total cash June 30, ($ in millions) 2015 PF 2014 UNAUDITED Cash 27.2$ 13.4$ Restricted Cash 0.6 0.6 Total Cash 27.7$ 14.0$ Senior Secured Notes due 2019 140.0 - Revolving Credit Facility - - Senior Term Loan due 2017 - 81.4 Stockholders' Note due 2017 - 17.5 Total Debt 140.0$ 98.9$ Stockholders' Equity (Deficit) (25.6) 13.9 Total Capitalization 114.4$ 112.8$ Undrawn Revolving Credit Facility (1) 20.0$ -$ Liquidity (2) 47.7$ 14.0$ Shares % S/O Fidelity Management & Research Company 2,366,307 13.7% Investment Counselors of Maryland, LLC 728,160 4.2% GLG Partners LP 435,000 2.5% York Capital Management 257,301 1.5% Millennium Management LLC 110,026 0.6% Davidson Kempner Capital Management LP 98,550 0.6% The Vanguard Group, Inc 68,463 0.4% Gruber & McBaine Capital Management, LLC 48,075 0.3% Other Institutional Ownership 63,178 0.4% Total Institutional Ownership 4,175,060 24.1% Jeff Hastings, Executive Chairman (includes CLCH LLC holdings) 3,352,950 19.4% John Pecora, Independent Shareholder 2,285,595 13.2% Brian Beatty, CEO (includes Seismic Management holdings) 1,706,850 9.9% Eric Rosenfeld, Director 1,670,727 9.7% Brent Whiteley, CFO 284,964 1.6% David Sgro, Director 217,035 1.3% Other Insider and Strategic Ownership 1,713,303 9.9% Total Insider and Strategic Ownership 11,231,424 65.0%