UNITED STATES
SECURITIES AND EXCHANGE COMMISSION
Washington, D.C. 20549
FORM N-CSR
CERTIFIED SHAREHOLDER REPORT OF REGISTERED MANAGEMENT
INVESTMENT COMPANIES
Investment Company Act file number 811-22534
Versus Capital Multi-Manager Real Estate Income Fund LLC
(Exact name of registrant as specified in charter)
5050 South Syracuse Street, Suite 1100
Denver, CO 80237
(Address of principal executive offices) (Zip code)
Mark D. Quam
c/o Versus Capital Advisors LLC
5050 South Syracuse Street, Suite 1100
Denver, CO 80237
(Name and address of agent for service)
COPY TO:
David C. Sullivan, Esq.
Ropes & Gray LLP
Prudential Tower
800 Boylston Street
Boston, MA 02199-3600
Registrant’s telephone number, including area code: (877) 200-1878
Date of fiscal year end: March 31
Date of reporting period: March 31, 2022
Form N-CSR is to be used by management investment companies to file reports with the Commission not later than 10 days after the transmission to stockholders of any report that is required to be transmitted to stockholders under Rule 30e-1 under the Investment Company Act of 1940 (17 CFR 270.30e-1). The Commission may use the information provided on Form N-CSR in its regulatory, disclosure review, inspection, and policymaking roles.
A registrant is required to disclose the information specified by Form N-CSR, and the Commission will make this information public. A registrant is not required to respond to the collection of information contained in Form N-CSR unless the Form displays a currently valid Office of Management and Budget (“OMB”) control number. Please direct comments concerning the accuracy of the information collection burden estimate and any suggestions for reducing the burden to Secretary, Securities and Exchange Commission, 450 Fifth Street, NW, Washington, DC 20549-0609. The OMB has reviewed this collection of information under the clearance requirements of 44 U.S.C. § 3507.
Item 1. Reports to Stockholders.
| | (a) | The Report to Shareholders is attached herewith. |

VERSUS CAPITAL MULTI-MANAGER
REAL ESTATE INCOME FUND LLC
Annual Report
March 31, 2022
VERSUS CAPITAL ADVISORS LLC
This report is for shareholders of Versus Capital Multi-Manager Real Estate Income Fund LLC. It is not
authorized for distribution unless preceded or accompanied by a current prospectus for the Fund. Shares
of the Fund are distributed by Foreside Funds Distributors LLC, Berwyn, Pennsylvania.
TABLE OF CONTENTS
Economic and market conditions change frequently.
There is no assurance that the trends described in this report will continue or commence.
Privacy Notice
This notice describes the Fund’s privacy policy. The Fund is committed to protecting the personal information that it collects about individuals who are prospective, former or current investors. The Fund collects personal information (“Personal Information”) for business purposes, such as to process requests and transactions, to maintain accounts, and to provide customer service. Personal Information is obtained from the following sources:
| • | | Investor applications and other forms, which may include your name(s), address, social security number or tax identification number; |
| • | | Written and electronic correspondence, including telephone contacts; and |
| • | | Transaction history, including information about the Fund’s transactions and balances in your accounts with the Fund or its affiliates or other holdings of the Fund and any affiliation with the Adviser and its subsidiaries. |
The Fund limits access to Personal Information to those employees and service providers who need to know that information for business purposes. Employees are required to maintain and protect the confidentiality of Personal Information. The Adviser, on behalf of the Fund, maintains written policies and procedures that address physical, electronic and administrative safeguards designed to protect Personal Information.
The Fund may share Personal Information described above with the Adviser and its various other affiliates or service providers for business purposes, such as to facilitate the servicing of accounts. The Fund may share the Personal Information described above for business purposes with a non-affiliated third party only as authorized by exceptions to Regulation S-P’s opt-out requirements, for example, if it is necessary to effect, administer, or enforce a transaction that an investor requests or authorizes; (ii) in connection with processing or servicing a financial product or service an investor requests or authorizes; and (iii) in connection with maintaining or servicing the investor’s account with the Fund. The Fund also may disclose Personal Information to regulatory authorities or otherwise as permitted by law. The Fund endeavors to keep its customer files complete and accurate. The Fund should be notified if any information needs to be corrected or updated.
VERSUS CAPITAL MULTI-MANAGER REAL ESTATE INCOME FUND LLC
Shareholder Letter
March 31, 2022 (Unaudited)
Dear Shareholders,
As always, we are grateful for the trust you place in us and greatly appreciate the privilege to invest on your behalf. The twelve month period ended March 31, 2022 (the “Reporting Period”) has been an unusually positive period for real estate and real assets investments. The U.S. economy experienced a historically strong rebound as we saw U.S. real gross domestic product increase at a rate of nearly 6.0% in 2021. The strong economic growth was supported by strong labor markets, consumer spending and private investments.
In the years leading up to the pandemic, the real estate market was fundamentally sound and generally had positive supply and demand balances. These measures were consistent across sectors as demonstrated by low vacancy rates and solid rental growth rates. However, when major economies shut down to combat the pandemic, it placed a severe amount of stress on the demand for space and there was a significant acceleration of existing structural trends in real estate markets. Property sectors including office, retail and hotel sectors experienced strong headwinds, while other sectors such as industrial, life sciences, self-storage and multifamily benefited.
The Fund’s property sector and geographically diverse portfolio of institutional quality assets proved resilient throughout the pandemic, helping to limit downside and maintain weighted average occupancy in the mid-90% range during the Reporting Period. The industrial sector was the strongest performer within the real estate markets, and the VCMIX portfolio benefited from significant appreciation in that sector over the last Reporting Period. U.S. industrial market vacancy rates declined to just over 3%, which is the lowest level on record, and rent growth rose to the highest pace in over 20 years. The multifamily sector was another area that saw significant appreciation over the Reporting Period. In the U.S., multifamily vacancy rates declined to historic lows – nearly 2.0% below pre-pandemic levels. These two sectors were the largest drivers of return in the VCMIX portfolio over the Reporting Period.
While the trends for industrial, multifamily and life sciences were very strong, certain sub-sectors including office, retail and hospitality faced more headwinds during the Reporting Period because of the pandemic. However, we have seen positive trends that we believe will help office and retail recover. Specifically, office vacancy rates declined in the second half of 2021 after rising for six consecutive quarters. On the retail side, leasing activity continued to gain steam in 2021 with net absorption showing the highest numbers since 2017. In addition, in-person shopping increased nearly 20% for retail and food services sales year-over-year.
We have continued to allocate VCMIX capital into funds we believe have the potential to generate attractive risk-adjusted returns by focusing on stable, high-quality cash flows and long-term asset appreciation. As of March 31, 2022, the Fund provided our investors exposure to over $160 billion of high-quality commercial real estate assets spread across over 1,700 distinct investments.
Demand for owning real estate was strong in 2021, and we have continued to witness significant investor appetite for deploying capital into the real estate asset class. 2021 was a record-breaking year for real estate investment sales with over $800 billion in transactions completed, up nearly 90% year-over-year and driven largely by the multifamily and industrial sectors.
VCMIX concluded its fiscal year March 31, 2022 with record performance for the Fund, generating a 21.04% return over the trailing twelve-month period. Over the medium term through March 31, 2022, the Fund has produced three and five-year annualized returns of 8.56% and 7.48%, respectively. The Fund will reach its ten-year track record in the summer of 2022, and through March 31, 2022 has delivered a since-inception annualized return of 7.26%. The Fund’s inception date is July 9, 2012. By comparison, the S&P Real Assets Index returns over the one-year, annualized three-year, five-year, and since VCMIX inception periods, were 13.03%, 7.71%, 6.73%, and 5.21%, respectively. In our opinion, the Fund has performed admirably relative to its benchmark over multiple periods and produced attractive, consistent risk-adjusted returns.
Performance Disclosure: Quoted performance is net of all fees and expenses. Past performance does not guarantee future results. The performance data quoted represents past performance and future returns may be lower or higher. Total return figures include change in share price, reinvestment of dividends and capital gains. The investment return and principal value will fluctuate so that an investor’s shares, when redeemed, may be worth more or less than the original cost and current performance may be lower or higher than the performance quoted. Performance data current to the most recent month end may be obtained by calling 877-200-1878.
With a track record approaching ten years and a proven ability to successfully navigate a significant downturn in the economy and financial markets, we think the case for investing in institutional private real estate funds and customized public real estate securities portfolios has continued to strengthen.
In closing, on behalf of myself and our employees, our best wishes to you and your loved ones for good health and safety. We consider it a privilege to invest on your behalf. Thank you for your continued partnership.
Sincerely,
Mark Quam
Chief Executive Officer
Versus Capital Advisors LLC
2
VERSUS CAPITAL MULTI-MANAGER REAL ESTATE INCOME FUND LLC
Fund Performance
March 31, 2022 (Unaudited)
| | | | | | | | | | | | |
Average Annual Total Returns(a) for the periods ended March 31, 2022 | | | | | | | | | | | | |
| | | | |
| | | 1 Year | | | 5 Year | | | Since
Inception
(July 9, 2012) | |
Versus Capital Multi-Manager Real Estate Income Fund LLC(b) | | | 21.04% | | | | 7.48% | | | | 7.26% | |
S&P Real Assets Index(c) | | | 13.03% | | | | 6.73% | | | | 5.21% | (d) |
Growth of $10,000 for periods ended March 31, 2022(a),(b)
This graph shows the change in value of a hypothetical investment of $10,000 in the Fund made on July 9, 2012 (inception date of the Fund) for the years indicated. For comparison, the same investment is shown in the indicated index.
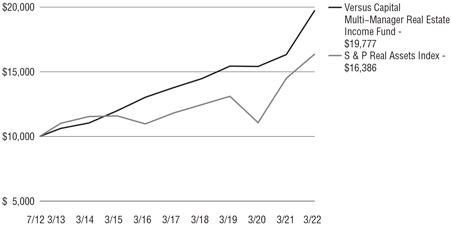
| (a) | Past performance is not indicative of future results. Current performance may be lower or higher than performance in historical periods. |
| (b) | Total return is calculated using the net asset value of the Fund on the beginning and ending date of each period reported. Dividends and distributions are assumed, for purposes of this calculation, to be reinvested at the Fund’s net asset value. Returns are not annualized for periods of less than one year. Brokerage commissions that a shareholder may pay are not reflected. Total return does not reflect the deduction of taxes that a shareholder may pay on Fund distributions or the repurchase of Fund shares. The Fund’s gross expense ratio as of its Prospectus dated July 29, 2021 was 1.25%. |
| (c) | The index is unmanaged and is not available for direct investment. Its performance does not reflect the expenses associated with the active management of a portfolio. |
| (d) | Represents the average annual return of the index from the Fund’s inception date. |
3
VERSUS CAPITAL MULTI-MANAGER REAL ESTATE INCOME FUND LLC
Fund Performance
March 31, 2022 (Unaudited) (continued)
Definitions & Index Descriptions
S&P Real Assets Index is an unmanaged index designed to measure global property, infrastructure, commodities, and inflation-linked bonds using liquid and investable component indices that track public equities, fixed income, and futures. It is not possible to invest directly in an index.
Cash Flow is remaining profits after collecting all rents and income, paying all operating expenses, and setting aside cash reserves for future repairs.
An investment in the Fund is subject to a high degree of risk. These risks include, but are not limited to, the following: Real estate entails special risks, including tenant default, environmental problems, and adverse changes in local economies. The yield from an underlying investment fund could be significantly reduced if it fails to qualify as a REIT (real estate investment trust) for tax purposes. The Fund is “non-diversified” under the Investment Company Act of 1940. Changes in the market value of a single holding may cause greater fluctuation in the Fund’s net asset value than in a “diversified” fund. The Fund is not intended as a complete investment program but instead as a way to help investors diversify into real estate. Diversification does not ensure a profit or guarantee against a loss. A multi-manager strategy involves certain risks. For example, it is possible that some Investment Managers may take similar market positions, thereby interfering with the Fund’s investment goal. The Fund and underlying Investment Managers may borrow as an investment strategy, up to one third of the Fund’s gross asset value. Borrowing presents opportunities to increase the Fund’s return, but potentially increases the losses as well. The Adviser and Investment Managers manage portfolios for themselves and other clients. A conflict of interest between the Fund and these other parties may arise which could disadvantage the Fund. For example, a suitable but limited investment opportunity might be allocated to another client rather than to the Fund. The Fund does not intend to list its Shares on any securities exchange during the offering period, and a secondary market in the Shares is not expected to develop. There is no guarantee that shareholders will be able to sell all of their tendered shares during a quarterly repurchase offer. An investment is not suitable for investors that require liquidity, other than through the Fund’s repurchase policy. You should not expect to be able to sell your Shares other than through the Fund’s repurchase policy, regardless of how the Fund performs.
4
REPORT OF INDEPENDENT REGISTERED PUBLIC ACCOUNTING FIRM
Board of Directors and Shareholders
Versus Capital Multi-Manager Real Estate Income Fund LLC
Opinion on the financial statements
We have audited the accompanying statement of assets and liabilities of Versus Capital Multi-Manager Real Estate Income Fund LLC (the “Fund”), including the portfolio of investments, as of March 31, 2022, and the related statements of operations and cash flows for the year then ended, the statements of changes in net assets for each of the two years in the period then ended, and the financial highlights for each of the five years in the period then ended, and the related notes (collectively referred to as the “financial statements”). In our opinion, the financial statements present fairly, in all material respects, the financial position of the Fund as of March 31, 2022, and the results of its operations and its cash flows for the year then ended, the changes in its net assets for each of the two years in the period then ended, and its financial highlights for each of the five years in the period then ended, in conformity with accounting principles generally accepted in the United States of America.
Basis for opinion
These financial statements are the responsibility of the Fund’s management. Our responsibility is to express an opinion on the Fund’s financial statements based on our audits. We are a public accounting firm registered with the Public Company Accounting Oversight Board (United States) (“PCAOB”) and are required to be independent with respect to the Fund in accordance with the U.S. federal securities laws and the applicable rules and regulations of the Securities and Exchange Commission and the PCAOB
We conducted our audits in accordance with the standards of the PCAOB. Those standards require that we plan and perform the audit to obtain reasonable assurance about whether the financial statements are free of material misstatement, whether due to error or fraud. The Fund is not required to have, nor were we engaged to perform, an audit of its internal control over financial reporting. As part of our audits we are required to obtain an understanding of internal control over financial reporting but not for the purpose of expressing an opinion on the effectiveness of the Fund’s internal control over financial reporting. Accordingly, we express no such opinion
Our audits included performing procedures to assess the risks of material misstatement of the financial statements, whether due to error or fraud, and performing procedures that respond to those risks. Such procedures included examining, on a test basis, evidence regarding the amounts and disclosures in the financial statements. Our procedures included confirmation of securities owned as of March 31, 2022, by correspondence with custodian, underlying fund managers and brokers, or by other appropriate auditing procedures where replies from brokers were not received. Our audits also included evaluating the accounting principles used and significant estimates made by management, as well as evaluating the overall presentation of the financial statements. We believe that our audits provide a reasonable basis for our opinion.
/s/ GRANT THORNTON LLP
We have served as the Fund’s auditor of one or more investment companies in the Fund’s investment company group since 2011.
Chicago, Illinois
May 27, 2022
5
VERSUS CAPITAL MULTI-MANAGER REAL ESTATE INCOME FUND LLC
Portfolio of Investments – March 31, 2022
| | | | | | | | |
Shares | | | | | Value | |
|
| | Private Investment Funds(a) - 77.2% | |
| | | | Diversified – 77.2% | |
| | 103,618 | | | AEW Core Property (U.S.), LP | | $ | 131,921,616 | |
| | — | | | AEW Value Investors US LP(b)(c)(d) | | | 100,587,444 | |
| | 72,560 | | | Barings European Core Property Fund | | | 99,897,361 | |
| | 122,982,873 | | | CBRE U.S. Core Partners LP | | | 246,519,169 | |
| | 11,725,745 | | | CBRE U.S. Logistics Partners LP | | | 14,871,762 | |
| | 89,172 | | | Clarion Gables Multifamily Trust LP | | | 163,644,402 | |
| | 127,263 | | | Clarion Lion Properties Fund LP | | | 245,688,024 | |
| | 18,326 | | | GI Partners ETS Fund(e) | | | 23,057,812 | |
| | — | | | GWL U.S. Property Fund LP(e)(f) | | | 159,144,867 | |
| | 79,032 | | | Harrison Street Core Property Fund | | | 121,423,998 | |
| | 99,046 | | | Heitman America Real Estate LP | | | 150,355,681 | |
| | 144,358 | | | Heitman Core Real Estate Debt Income Trust LP(e) | | | 145,139,154 | |
| | 1,060 | | | Invesco Core Real Estate USA LP | | | 240,625,494 | |
| | 1,049,052 | | | Invesco Real Estate Asia Fund(e) | | | 152,039,042 | |
| | | | LaSalle Property Fund LP | | | | |
| | 19,839 | | | Class A Shares | | | 41,441,777 | |
| | 1,422 | | | Class B Shares | | | 2,970,422 | |
| | 969,603 | | | RREEF America REIT II, Inc. | | | 153,304,977 | |
| | 34,640 | | | TA Realty Core Property Fund, LP | | | 53,556,908 | |
| | 2,610 | | | Trumbull Property Fund LP | | | 30,393,457 | |
| | 2,801 | | | Trumbull Property Income Fund, LP | | | 39,931,938 | |
| | — | | | US Government Building Open-End Feeder, LP(g) | | | 72,180,112 | |
| | — | | | USGBF Alpha Feeder LP(d)(h) | | | 18,522,000 | |
| | 54,495 | | | Walton Street Real Estate Core-Plus Fund, LP | | | 72,507,706 | |
| | | | | | | | |
| | | | Total Private Investment Funds | | | 2,479,725,123 | |
| | | | | | | | |
| | | | (Cost $2,012,002,685) | | | | |
| |
| | Rights - 0.0% | | | | |
| | | | Real Estate Operation/Development – 0.0% | |
| | 250,299 | | | Lendlease Rights, (i) | | | 9,739 | |
| | | | | | | | |
| | | | Total Rights | | | 9,739 | |
| | | | | | | | |
| | | | (Cost $0) | | | | |
|
| | Common Stocks - 12.1% | |
| | | | Apartments/Single Family Residential – 2.2% | |
| | 308,972 | | | American Homes 4 Rent, Class A Shares, REIT | | | 12,368,149 | |
| | 159,949 | | | Apartment Income REIT Corp. | | | 8,550,874 | |
| | 48,690 | | | AvalonBay Communities, Inc., REIT | | | 12,093,135 | |
| | 23,782 | | | Camden Property Trust, REIT | | | 3,952,568 | |
| | 488 | | | Daiwa House REIT Investment Corp. (Japan) | | | 1,315,652 | |
| | 101,774 | | | Equity Residential, REIT | | | 9,151,518 | |
| | 11,795 | | | Essex Property Trust, Inc., REIT | | | 4,074,937 | |
| | 229,230 | | | Independence Realty Trust, Inc., REIT | | | 6,060,841 | |
| | 267,536 | | | Invitation Homes, Inc., REIT | | | 10,749,597 | |
| | 80,036 | | | STORE Capital Corp., REIT | | | 2,339,452 | |
| | | | | | | | |
| | | | | | 70,656,723 | |
| | | | | | | | |
| | | | Diversified – 2.4% | |
| | 375 | | | Activia Properties, Inc., REIT (Japan) | | | 1,307,333 | |
| | 12,496 | | | American Tower Corp., REIT | | | 3,139,245 | |
| | 175,975 | | | Arena, REIT (Australia) | | | 643,950 | |
| | 86,457 | | | Broadstone Net Lease, Inc., REIT | | | 1,883,033 | |
| | 61,769 | | | Charter Hall Group, REIT (Australia) | | | 750,639 | |
| | 467,080 | | | Cromwell European Real Estate Investment Trust, REIT (Singapore) | | | 1,178,093 | |
| | 1,786,480 | | | Digital Core REIT Management Pte, Ltd. (Singapore)(i) | | | 1,982,993 | |
| | 34,658 | | | Digital Realty Trust, Inc., REIT | | | 4,914,504 | |
| | 18,950 | | | DR Horton, Inc. | | | 1,411,965 | |
| | 26,493 | | | Equinix, Inc., REIT | | | 19,647,739 | |
| | 220,944 | | | ESR Kendall Square Co., Ltd., REIT (South Korea) | | | 1,271,749 | |
| | | | | | | | |
Shares | | | | | Value | |
| | |
| | | | Diversified - (continued) | | | | |
| | 93,534 | | | Fabege AB (Sweden) | | $ | 1,381,193 | |
| | 11,350 | | | Gecina SA, REIT (France) | | | 1,430,421 | |
| | 213,776 | | | Ingenia Communities Group, REIT (Australia) | | | 807,047 | |
| | 81,819 | | | InvenTrust Properties Corp., REIT | | | 2,518,389 | |
| | 792,425 | | | Irongate Group, REIT (Australia) | | | 1,130,465 | |
| | 1,244,419 | | | Life Science PLC, REIT (United Kingdom)(i) | | | 1,634,731 | |
| | 220,444 | | | LXP Industrial Trust, REIT | | | 3,460,971 | |
| | 208,978 | | | Merlin Properties Socimi SA, REIT (Spain) | | | 2,443,200 | |
| | 32,391 | | | Minto Apartment Real Estate Investment Trust, 144A, REIT (Canada) | | | 556,281 | |
| | 162,800 | | | Mitsubishi Estate Co., Ltd. (Japan) | | | 2,424,167 | |
| | 626 | | | Mori Hills REIT Investment Corp. (Japan) | | | 775,472 | |
| | 37,777 | | | NSI NV, REIT (Netherlands) | | | 1,659,369 | |
| | 21,643 | | | Persimmon, PLC (United Kingdom) | | | 606,900 | |
| | 978,198 | | | Qualitas, Ltd. (Australia)(i) | | | 1,660,982 | |
| | 3,338 | | | Sekisui House Reit, Inc., REIT (Japan) | | | 2,208,366 | |
| | 170,722 | | | VICI Properties, Inc., REIT | | | 4,858,748 | |
| | 133,683 | | | Vonovia SE (Germany) | | | 6,231,021 | |
| | 38,637 | | | Weyerhaeuser Co., REIT | | | 1,464,342 | |
| | 64,673 | | | Wihlborgs Fastigheter AB (Sweden) | | | 1,352,861 | |
| | | | | | | | |
| | | | | | 76,736,169 | |
| | | | | | | | |
| | | | Health Care – 1.0% | |
| | 64,120 | | | Healthcare Trust of America, Inc., Class A Shares, REIT | | | 2,009,521 | |
| | 164,296 | | | HealthCo, REIT (Australia) | | | 237,286 | |
| | 140,037 | | | Healthpeak Properties, Inc., REIT | | | 4,807,470 | |
| | 156,094 | | | Medical Properties Trust, Inc., REIT | | | 3,299,827 | |
| | 263,659 | | | Sabra Health Care REIT, Inc. | | | 3,925,883 | |
| | 209,128 | | | Ventas, Inc., REIT | | | 12,915,745 | |
| | 67,260 | | | Welltower, Inc., REIT | | | 6,466,376 | |
| | | | | | | | |
| | | | | | 33,662,108 | |
| | | | | | | | |
| | | | Hotels – 0.6% | |
| | 4,430 | | | Choice Hotels International, Inc. | | | 627,997 | |
| | 153,907 | | | Host Hotels & Resorts, Inc., REIT | | | 2,990,413 | |
| | 136,103 | | | MGM Growth Properties LLC, Class A Shares, REIT | | | 5,267,186 | |
| | 94,279 | | | Park Hotels & Resorts, Inc., REIT | | | 1,841,269 | |
| | 228,387 | | | Sunstone Hotel Investors, Inc., REIT(i) | | | 2,690,399 | |
| | 30,307 | | | Travel + Leisure Co. | | | 1,755,987 | |
| | 147,755 | | | Xenia Hotels & Resorts, Inc., REIT(i) | | | 2,850,194 | |
| | | | | | | | |
| | | | | | 18,023,445 | |
| | | | | | | | |
| | | | Office Properties – 1.3% | |
| | 71,087 | | | Alexandria Real Estate Equities, Inc., REIT | | | 14,306,259 | |
| | 37,600 | | | Allied Properties Real Estate Investment Trust, REIT (Canada) | | | 1,402,462 | |
| | 18,559 | | | Boston Properties, Inc., REIT | | | 2,390,399 | |
| | 261,555 | | | Brandywine Realty Trust, REIT | | | 3,698,388 | |
| | 669,900 | | | Capitaland Investment, Ltd. (Singapore)(i) | | | 1,962,857 | |
| | 490,537 | | | Centuria Capital Group (Australia) | | | 1,045,739 | |
| | 106 | | | Daiwa Office Investment Corp., REIT (Japan) | | | 658,039 | |
| | 226,079 | | | Dexus, REIT (Australia) | | | 1,845,409 | |
| | 108,543 | | | Douglas Emmett, Inc., REIT | | | 3,627,507 | |
| | 114,728 | | | Hudson Pacific Properties, Inc., REIT | | | 3,183,702 | |
| | 92,748 | | | Inmobiliaria Colonial Socimi SA, REIT (Spain) | | | 845,480 | |
| | 80,107 | | | Kilroy Realty Corp., REIT | | | 6,121,777 | |
| | | | | | | | |
| | | | | | 41,088,018 | |
| | | | | | | | |
| | | | Real Estate Operation/Development – 0.5% | |
| | 223,455 | | | Aroundtown SA (Luxembourg) | | | 1,276,905 | |
| | 78,509 | | | Castellum AB (Sweden) | | | 1,938,367 | |
| | 99,610 | | | Echo Investment SA (Poland) | | | 83,577 | |
| | 381,228 | | | Hongkong Land Holdings, Ltd. (Hong Kong) | | | 1,862,643 | |
See accompanying notes to financial statements.
6
VERSUS CAPITAL MULTI-MANAGER REAL ESTATE INCOME FUND LLC
Portfolio of Investments – March 31, 2022 (continued)
| | | | | | | | |
Shares | | | | | Value | |
| |
| | | | Real Estate Operation/Development - (continued) | |
| | 621,100 | | | Midea Real Estate Holding, Ltd., 144A (China) | | $ | 1,237,965 | |
| | 217,000 | | | Mitsui Fudosan Co., Ltd. (Japan) | | | 4,644,304 | |
| | 663,425 | | | New World Development Co., Ltd. (Hong Kong) | | | 2,691,614 | |
| | 1,599,791 | | | RAM Essential Services Property Fund (Australia) | | | 1,116,038 | |
| | 622,500 | | | Zhongliang Holdings Group Co., Ltd. (China) | | | 171,652 | |
| | | | | | | | |
| | | | | | 15,023,065 | |
| | | | | | | | |
| | | | Regional Malls – 0.4% | |
| | 41,617 | | | Klepierre SA, REIT (France) | | | 1,108,015 | |
| | 232,676 | | | Macerich Co. (The), REIT | | | 3,639,053 | |
| | 66,297 | | | Simon Property Group, Inc., REIT | | | 8,722,033 | |
| | | | | | | | |
| | | | | | 13,469,101 | |
| | | | | | | | |
| | | | Residential – 0.3% | |
| | 30,997 | | | Equity LifeStyle Properties, Inc., REIT | | | 2,370,651 | |
| | 38,989 | | | Sun Communities, Inc., REIT | | | 6,834,382 | |
| | | | | | | | |
| | | | | | 9,205,033 | |
| | | | | | | | |
| | | | Shopping Centers – 0.4% | |
| | 46,940 | | | Brixmor Property Group, Inc., REIT | | | 1,211,522 | |
| | 990,100 | | | CapitaLand Integrated Commercial Trust, REIT (Singapore) | | | 1,637,962 | |
| | 45,541 | | | Federal Realty Investment Trust, REIT | | | 5,559,190 | |
| | 310 | | | Japan Metropolitan Fund Invest, REIT (Japan) | | | 261,579 | |
| | 234,099 | | | Kite Realty Group Trust, REIT | | | 5,330,434 | |
| | 863,100 | | | Lendlease Global Commercial, REIT (Singapore) | | | 492,087 | |
| | | | | | | | |
| | | | | | 14,492,774 | |
| | | | | | | | |
| | | | Storage – 0.9% | |
| | 67,858 | | | Big Yellow Group, PLC, REIT (United Kingdom) | | | 1,368,028 | |
| | 201,446 | | | CubeSmart, REIT | | | 10,481,235 | |
| | 17,006 | | | Extra Space Storage, Inc., REIT | | | 3,496,434 | |
| | 31,897 | | | Public Storage, REIT | | | 12,448,761 | |
| | 150,309 | | | Safestore Holdings, PLC, REIT (United Kingdom) | | | 2,639,322 | |
| | | | | | | | |
| | | | | | 30,433,780 | |
| | | | | | | | |
| | | | Warehouse/Industrial – 2.1% | |
| | 438,306 | | | Centuria Industrial, REIT (Australia) | | | 1,253,372 | |
| | 890 | | | CRE Logistics, Inc., REIT (Japan) | | | 1,513,221 | |
| | 315,500 | | | Dream Industrial Real Estate Investment Trust, REIT (Canada) | | | 4,073,247 | |
| | 2,618,907 | | | ESR, REIT (Singapore) | | | 829,641 | |
| | 112,497 | | | First Industrial Realty Trust, Inc., REIT | | | 6,964,689 | |
| | 71,709 | | | Goodman Group, REIT (Australia) | | | 1,218,803 | |
| | 888 | | | Industrial & Infrastructure Fund Investment Corp., REIT (Japan) | | | 1,345,382 | |
| | 185,861 | | | Industrial Logistics Properties Trust, REIT | | | 4,213,469 | |
| | 310 | | | Mitsubishi Estate Logistics Investment Corp., REIT (Japan) | | | 1,206,046 | |
| | 282,600 | | | Nexus Industrial, REIT (Canada) | | | 2,886,695 | |
| | 76,573 | | | Plymouth Industrial, Inc., REIT | | | 2,075,128 | |
| | 162,769 | | | Prologis, Inc., REIT | | | 26,283,938 | |
| | 45,925 | | | Rexford Industrial Realty, Inc., REIT | | | 3,425,546 | |
| | 203,510 | | | Segro, PLC, REIT (United Kingdom) | | | 3,577,513 | |
| | 3,080,000 | | | SF Real Estate Investment Trust, REIT (Virgin Islands (British)) | | | 1,279,963 | |
| | 187,456 | | | Summit Industrial Income, REIT (Canada) | | | 3,301,829 | |
| | 840,209 | | | Tritax Big Box REIT, PLC (United Kingdom) | | | 2,660,369 | |
| | | | | | | | |
| | | | | | 68,108,851 | |
| | | | | | | | |
| | | | Total Common Stocks | | | 390,899,067 | |
| | | | | | | | |
| | | | (Cost $356,925,202) | | | | |
| | | | | | | | |
Shares | | | | | Value | |
|
| | Preferred Stocks - 1.3% | |
| | | | Apartments/Single Family Residential – 0.0% | |
| | 765 | | | Agree Realty Corp., REIT, Series A, 4.25% | | $ | 15,208 | |
| | | | American Homes 4 Rent, REIT, | | | | |
| | 18,850 | | | Series G, 5.88% | | | 472,758 | |
| | 6,009 | | | Series H, 6.25% | | | 155,092 | |
| | 5,616 | | | Mid-America Apartment Communities, Inc., REIT, Series I, 8.50% | | | 341,341 | |
| | 3,075 | | | Spirit Realty Capital, Inc., REIT, Series A, 6.00% | | | 77,367 | |
| | | | | | | | |
| | | | | | 1,061,766 | |
| | | | | | | | |
| | | | Diversified – 0.2% | |
| | 20,730 | | | Armada Hoffler Properties, Inc., REIT, Series A, 6.75% | | | 538,565 | |
| | | | Digital Realty Trust, Inc., REIT, | | | | |
| | 22,590 | | | Series J, 5.25% | | | 562,717 | |
| | 27,925 | | | Series K, 5.85% | | | 726,888 | |
| | 20,215 | | | Series L, 5.20% | | | 503,354 | |
| | | | DigitalBridge Group, Inc., REIT, | | | | |
| | 11,725 | | | Series I, 7.15% | | | 291,835 | |
| | 18,525 | | | Series J, 7.13% | | | 457,938 | |
| | | | PS Business Parks, Inc., REIT, | | | | |
| | 26,370 | | | Series X, 5.25% | | | 665,315 | |
| | 23,401 | | | Series Z, 4.88% | | | 549,689 | |
| | | | UMH Properties, Inc., REIT, | | | | |
| | 14,767 | | | Series C, 6.75% | | | 374,934 | |
| | 5,710 | | | Series D, 6.38% | | | 145,891 | |
| | | | | | | | |
| | | | | | 4,817,126 | |
| | | | | | | | |
| | | | Health Care – 0.0% | |
| | | | Diversified Healthcare Trust, REIT, | | | | |
| | 9,960 | | | 6.25% | | | 197,606 | |
| | 3,180 | | | 5.63% | | | 57,590 | |
| | | | | | | | |
| | | | | | 255,196 | |
| | | | | | | | |
| | | | Hotels – 0.1% | |
| | 61,165 | | | Chatham Lodging Trust, REIT, Series A, 6.63% | | | 1,490,591 | |
| | 16,720 | | | DiamondRock Hospitality Co., REIT, 8.25% | | | 450,604 | |
| | | | Hersha Hospitality Trust, REIT, | | | | |
| | 4,575 | | | Series C, 6.88% | | | 106,781 | |
| | 2,490 | | | Series D, 6.50% | | | 55,154 | |
| | | | Pebblebrook Hotel Trust, REIT, | | | | |
| | 1,935 | | | Series F, 6.30% | | | 46,769 | |
| | 23,875 | | | Series G, 6.38% | | | 589,712 | |
| | 34,265 | | | Series H, 5.70% | | | 777,130 | |
| | | | Sunstone Hotel Investors, Inc., REIT, | | | | |
| | 12,100 | | | Series H, 6.13% | | | 291,731 | |
| | 18,855 | | | Series I, 5.70% | | | 430,460 | |
| | | | | | | | |
| | | | | | 4,238,932 | |
| | | | | | | | |
| | | | Office Properties – 0.2% | |
| | 103 | | | Highwoods Properties, Inc., REIT, Series A, 8.63% | | | 133,900 | |
| | 51,505 | | | Hudson Pacific Properties, Inc., REIT, Series C, 4.75% | | | 1,108,903 | |
| | 15,810 | | | Office Properties Income Trust, REIT, 6.38% | | | 392,720 | |
| | 120,531 | | | SL Green Realty Corp., REIT, Series I, 6.50% | | | 3,040,997 | |
| | | | Vornado Realty Trust, REIT, | | | | |
| | 64,748 | | | Series M, 5.25% | | | 1,498,269 | |
| | 22,130 | | | Series N, 5.25% | | | 514,080 | |
| | 60,320 | | | Series O, 4.45% | | | 1,208,209 | |
| | | | | | | | |
| | | | | | 7,897,078 | |
| | | | | | | | |
| | | | Shopping Centers – 0.3% | |
| | 80,969 | | | Kimco Realty Corp., REIT, Series M, 5.25% | | | 2,018,557 | |
| | 24,300 | | | RPT Realty, REIT, Series D, 7.25% | | | 1,440,711 | |
See accompanying notes to financial statements.
7
VERSUS CAPITAL MULTI-MANAGER REAL ESTATE INCOME FUND LLC
Portfolio of Investments – March 31, 2022 (continued)
| | | | | | | | |
Shares | | | | | Value | |
| | |
| | | | Shopping Centers - (continued) | | | | |
| | | | Saul Centers, Inc., REIT, | | | | |
| | 4,995 | | | Series D, 6.13% | | $ | 124,825 | |
| | 52,000 | | | Series E, 6.00% | | | 1,307,727 | |
| | 55,507 | | | SITE Centers Corp., REIT, Series A, 6.38% | | | 1,388,230 | |
| | | | Urstadt Biddle Properties, Inc., REIT, | | | | |
| | 63,325 | | | Series H, 6.25% | | | 1,586,925 | |
| | 39,420 | | | Series K, 5.88% | | | 989,836 | |
| | | | | | | | |
| | | | | | | 8,856,811 | |
| | | | | | | | |
| | | | Storage – 0.4% | | | | |
| | | | Public Storage, REIT, | | | | |
| | 3,375 | | | Series F, 5.15% | | | 85,219 | |
| | 32,680 | | | Series G, 5.05% | | | 819,288 | |
| | 240,998 | | | Series H, 5.60% | | | 6,302,098 | |
| | 50,705 | | | Series I, 4.88% | | | 1,235,681 | |
| | 9,495 | | | Series J, 4.70% | | | 221,328 | |
| | 19,500 | | | Series K, 4.75% | | | 477,360 | |
| | 42,470 | | | Series L, 4.63% | | | 988,702 | |
| | 38,190 | | | Series M, 4.13% | | | 831,014 | |
| | 2,345 | | | Series N, 3.88% | | | 48,026 | |
| | 35,070 | | | Series O, 3.90% | | | 703,504 | |
| | 46,600 | | | Series P, 4.00% | | | 954,834 | |
| | 14,850 | | | Series R, 4.00% | | | 306,355 | |
| | 26,340 | | | Series S, 4.10% | | | 547,082 | |
| | | | | | | | |
| | | | | | | 13,520,491 | |
| | | | | | | | |
| | | | Warehouse/Industrial – 0.1% | | | | |
| | | | Rexford Industrial Realty, Inc., REIT, | | | | |
| | 14,948 | | | Series B, 5.88% | | | 375,942 | |
| | 82,255 | | | Series C, 5.63% | | | 2,059,665 | |
| | | | | | | | |
| | | | | | | 2,435,607 | |
| | | | | | | | |
| | | | Total Preferred Stocks | | | 43,083,007 | |
| | | | | | | | |
| | | | (Cost $45,624,095) | | | | |
| | |
Par | | | | | | |
| |
| | Commercial Mortgage Backed Securities - 3.6% | | | | |
| | | | BANK, 144A | | | | |
| $ | 23,841,000 | | | 1.05%, 10/17/2052 Ser 2019-BN21, Class XF(j) | | | 1,388,226 | |
| | 9,170,167 | | | 1.12%, 12/15/2052 Ser 2019-BN23, Class XD(j) | | | 600,466 | |
| | 9,188,000 | | | 0.71%, 12/15/2053 Ser 2020-BN30, Class XD(j) | | | 410,426 | |
| | 1,600,000 | | | 2.50%, 12/15/2053 Ser 2020-BN30, Class D(j) | | | 1,282,751 | |
| | 1,160,500 | | | 2.50%, 12/15/2053 Ser 2020-BN30, Class E(j) | | | 887,885 | |
| | 8,575,000 | | | 1.56%, 11/15/2054 Ser 2017-BNK9, Class XD(j) | | | 597,947 | |
| | 1,600,000 | | | 3.08%, 6/15/2060 Ser 2017-BNK5, Class D(j) | | | 1,355,915 | |
| | 3,000,000 | | | 4.38%, 6/15/2060 Ser 2017-BNK5, Class E(j) | | | 2,242,222 | |
| | 4,000,000 | | | 1.50%, 11/15/2062 Ser 2019-BN22, Class XF(j) | | | 343,807 | |
| | 3,500,000 | | | 2.08%, 11/15/2062 Ser 2019-BN22, Class F(j) | | | 2,245,064 | |
| | 9,703,500 | | | 1.03%, 1/15/2063 Ser 2020-BN25, Class XD(j) | | | 587,273 | |
| | 6,000,000 | | | 1.50%, 1/15/2063 Ser 2020-BN25, Class XF | | | 522,691 | |
| | 6,000,000 | | | 2.03%, 1/15/2063 Ser 2020-BN25, Class F(j) | | | 3,408,077 | |
| | 1,250,000 | | | 2.50%, 1/15/2063 Ser 2020-BN25, Class E | | | 947,787 | |
| | 2,000,000 | | | 2.25%, 6/15/2063 Ser 2021-BN34, Class F | | | 1,254,096 | |
| | 7,000,000 | | | 1.01%, 5/15/2064 Ser 2021-BN33, Class XD(j) | | | 493,179 | |
| | 12,250,000 | | | BBCMS Mortgage Trust, 1.55%, 10/15/2053 Ser 2020-C8, Class XD, 144A(j) | | | 1,287,122 | |
| | | | BENCHMARK Mortgage Trust, | | | | |
| | 12,667,000 | | | 1.24%, 1/15/2051 Ser 2018-B1, Class XE, 144A(j) | | | 749,000 | |
| | 5,520,000 | | | 1.50%, 4/10/2051 Ser 2018-B3, Class XD, 144A(j) | | | 412,443 | |
| | 1,719,500 | | | 3.26%, 10/10/2051 Ser 2018-B6, Class D, 144A(j) | | | 1,447,112 | |
| | 3,800,000 | | | 1.21%, 2/15/2053 Ser 2020-B16, Class XD, 144A(j) | | | 279,341 | |
| | 1,000,000 | | | 2.50%, 2/15/2053 Ser 2020-B16, Class D, 144A | | | 786,778 | |
| | | | | | | | |
Par | | | | | Value | |
| |
| | Commercial Mortgage Backed Securities (continued) | | | | |
| $ | 1,500,000 | | | 2.50%, 2/15/2053 Ser 2020-B16, Class E, 144A | | $ | 1,125,063 | |
| | 10,000,000 | | | 1.53%, 1/15/2054 Ser 2020-B22, Class XD, 144A(j) | | | 1,034,074 | |
| | 3,950,000 | | | 2.00%, 1/15/2054 Ser 2020-B22, Class D, 144A | | | 2,943,043 | |
| | 3,500,000 | | | 2.00%, 2/15/2054 Ser 2021-B23, Class E, 144A | | | 2,398,172 | |
| | 38,326,798 | | | 1.23%, 4/15/2054 Ser 2021-B25, Class XA(j) | | | 2,899,898 | |
| | 18,000,000 | | | 1.68%, 4/15/2054 Ser 2021-B25, Class XD, 144A(j) | | | 2,112,655 | |
| | 13,000,000 | | | 1.48%, 6/15/2054 Ser 2021-B26, Class XD, 144A(j) | | | 1,387,626 | |
| | 57,358,000 | | | 1.49%, 8/15/2054 Ser 2021-B28, Class XD, 144A(j) | | | 6,093,129 | |
| | 6,500,000 | | | 1.14%, 8/15/2057 Ser 2019-B13, Class XF, 144A(j) | | | 378,838 | |
| | 4,000,000 | | | 1.64%, 8/15/2057 Ser 2019-B13, Class XD, 144A(j) | | | 377,141 | |
| | 6,500,000 | | | 3.00%, 8/15/2057 Ser 2019-B13, Class F, 144A | | | 4,125,116 | |
| | 2,500,000 | | | 3.78%, 3/15/2062 Ser 2019-B10, Class F, 144A(j) | | | 1,452,544 | |
| | 2,750,000 | | | CD Mortgage Trust, 3.26%, 8/15/2051 Ser 2018-CD7, Class D, 144A(j) | | | 2,360,568 | |
| | 4,500,000 | | | CGMS Commercial Mortgage Trust, 3.00%, 8/15/2050 Ser 2017-B1, Class D, 144A | | | 3,771,956 | |
| | | | Citigroup Commercial Mortgage Trust, 144A | | | | |
| | 1,000,000 | | | 5.35%, 9/10/2046 Ser 2013-GC15, Class D(j) | | | 969,079 | |
| | 1,000,000 | | | 3.34%, 6/10/2051 Ser 2018-C5, Class D(j) | | | 833,217 | |
| | 5,000,000 | | | 0.74%, 11/10/2052 Ser 2019-GC43, Class XF(j) | | | 191,466 | |
| | 3,750,000 | | | 0.74%, 11/10/2052 Ser 2019-GC43, Class XG(j) | | | 142,106 | |
| | 3,750,000 | | | 3.00%, 11/10/2052 Ser 2019-GC43, Class G | | | 2,237,630 | |
| | 2,800,000 | | | 3.00%, 8/10/2056 Ser 2019-GC41, Class F | | | 1,746,720 | |
| | | | Comm Mortgage Trust, | | | | |
| | 1,094,000 | | | 5.45%, 5/15/2045 Ser 2012-CR1, Class C(j) | | | 1,084,126 | |
| | 1,000,000 | | | 5.45%, 5/15/2045 Ser 2012-CR1, Class D, 144A(j) | | | 918,811 | |
| | 2,500,000 | | | 4.46%, 12/10/2045 Ser 2012-CR5, Class F, 144A(j) | | | 1,993,882 | |
| | 2,165,000 | | | 4.46%, 12/10/2045 Ser 2012-CR5, Class E, 144A(j) | | | 2,029,508 | |
| | 1,146,500 | | | 4.43%, 1/10/2046 Ser 2013-LC6, Class D, 144A(j) | | | 1,125,844 | |
| | 3,250,000 | | | 4.22%, 3/10/2046 Ser 2013-CR6, Class E, 144A(j) | | | 2,918,035 | |
| | 2,600,000 | | | 5.01%, 5/10/2047 Ser 2014-CR17, Class D, 144A(j) | | | 2,345,576 | |
| | 1,500,000 | | | 3.50%, 9/10/2047 Ser 2014-UBS5, Class D, 144A | | | 1,267,017 | |
| | 2,730,000 | | | 1.14%, 8/15/2057 Ser 2019-GC44, Class XD, 144A(j) | | | 186,872 | |
| | 3,980,500 | | | CSAIL Commercial Mortgage Trust, 2.15%, 3/15/2052 Ser 2019-C15, Class XD, 144A(j) | | | 445,642 | |
| | | | Freddie Mac Multifamily Structured Pass Through Certificates, | | | | |
| | 10,500,000 | | | 2.57%, 11/25/2047 Ser K740, Class X3(j) | | | 1,217,793 | |
| | 10,000,000 | | | 2.72%, 2/25/2049 Ser K123, Class X3(j) | | | 1,821,291 | |
| | 6,880,000 | | | 2.53%, 3/25/2049 Ser K741, Class X3(j) | | | 811,818 | |
| | 4,750,000 | | | 3.06%, 6/25/2049 Ser K743, Class X3(j) | | | 722,639 | |
| | | | GS Mortgage Securities Trust, | | | | |
| | 4,463,000 | | | 5.64%, 8/10/2043 Ser 2010-C1, Class C, 144A(j) | | | 4,137,628 | |
| | 2,500,000 | | | 5.51%, 5/10/2045 Ser 2012-GCJ7, Class D, 144A(j) | | | 2,425,045 | |
| | 2,000,000 | | | 4.89%, 8/10/2046 Ser 2013-GC14, Class F, 144A(j) | | | 1,504,232 | |
| | 1,250,000 | | | 4.89%, 8/10/2046 Ser 2013-GC14, Class D, 144A(j) | | | 1,197,755 | |
| | 3,500,000 | | | 5.16%, 4/10/2047 Ser 2014-GC20, Class D, 144A(j) | | | 2,039,472 | |
| | 3,600,600 | | | 4.68%, 11/10/2047 Ser 2014-GC26, Class C(j) | | | 3,359,808 | |
| | 4,249,000 | | | 2.57%, 5/12/2053 Ser 2020-GC47, Class F, 144A(j) | | | 2,929,149 | |
| | 1,500,000 | | | 3.57%, 5/12/2053 Ser 2020-GC47, Class D, 144A(j) | | | 1,329,904 | |
| | | | JPMBB Commercial Mortgage Securities Trust, | | | | |
| | 1,500,000 | | | 4.70%, 8/15/2046 Ser 2013-C14, Class C(j) | | | 1,430,093 | |
| | 1,425,000 | | | 4.81%, 4/15/2047 Ser 2014-C19, Class D, 144A(j) | | | 1,373,275 | |
| | 2,525,000 | | | 4.03%, 11/15/2047 Ser 2014-C24, Class D, 144A(j) | | | 1,799,181 | |
| | | | Morgan Stanley Bank of America Merrill Lynch Trust, | | | | |
| | 1,250,000 | | | 4.91%, 6/15/2047 Ser 2014-C16, Class D, 144A(j) | | | 949,296 | |
| | 18,969,435 | | | 1.42%, 5/15/2050 Ser 2017-C33, Class XA(j) | | | 906,637 | |
| | | | Morgan Stanley Capital I Trust, 144A | | | | |
| | 1,414,000 | | | 3.00%, 6/15/2052 Ser 2019-H6, Class D | | | 1,173,802 | |
See accompanying notes to financial statements.
8
VERSUS CAPITAL MULTI-MANAGER REAL ESTATE INCOME FUND LLC
Portfolio of Investments – March 31, 2022 (continued)
| | | | | | | | |
Par | | | | | Value | |
|
| | Commercial Mortgage Backed Securities (continued) | |
| $ | 2,629,600 | | | 2.50%, 5/15/2054 Ser 2021-L5, Class F | | $ | 1,688,637 | |
| | 12,377,454 | | | SG Commercial Mortgage Securities Trust, 2.06%, 10/10/2048 Ser 2016-C5, Class XA(j) | | | 666,093 | |
| | 3,350,000 | | | SREIT Trust L + 0.73%, 1.13%, 11/15/2038 Ser 2021-MFP, Class A, 144A(k) | | | 3,284,948 | |
| | | | UBS-Barclays Commercial Mortgage Trust, 144A | | | | |
| | 21,171,160 | | | 1.71%, 12/10/2045 Ser 2012-C4, Class XA(j) | | | 74,395 | |
| | 2,000,000 | | | 5.22%, 8/10/2049 Ser 2012-C3, Class D(j) | | | 2,000,208 | |
| | | | | | | | |
| | | | Total Commercial Mortgage Backed Securities | | | 115,268,061 | |
| | | | | | | | |
| | | | (Cost $126,063,500) | | | | |
| | |
Shares | | | | | | |
| |
| | Short-Term Investment - 4.6% | | | | |
| | 146,857,313 | | | Morgan Stanley Institutional Liquidity Funds - Treasury Securities Portfolio, Institutional Share Class, 0.18% | | | 146,857,313 | |
| | | | | | | | |
| | | | (Cost $146,857,313) | | | | |
| | | | Total Investments - 98.8% | | | 3,175,842,310 | |
| | | | | | | | |
| | | | (Cost $2,687,472,795) | | | | |
| | | | Other Assets - 1.2% | | | 37,653,094 | |
| | | | | | | | |
| | | | Net Assets - 100.0% | | $ | 3,213,495,404 | |
| | | | | | | | |
| (a) | Restricted Securities. |
| (b) | Partnership is not designated in units. The Fund owns approximately 28.4% of this Fund. |
| (d) | The Fund owns more than 25% of the Private Investment Fund, but has contractually limited its voting interests to less than 5% of total voting interests. |
| (e) | The Fund owns more than 5.0% of the Private Investment Fund, but has contractually limited its voting interests to less than 5.0% of total voting interests. |
| (f) | Partnership is not designated in units. The Fund owns approximately 15.9% of this Fund. |
| (g) | Partnership is not designated in units. The Fund owns approximately 2.7% of this Fund. |
| (h) | Partnership is not designated in units. The Fund owns approximately 32.3% of this Fund. |
| (i) | Non-income producing security. |
| (j) | Variable rate security. The coupon is based on an underlying pool of mortgages. The rate reported is the rate in effect at period end. |
| (k) | Variable rate security. Represents the current interest rate for a variable or increasing rate security, determined as [Referenced Rate + Basis-point spread]. |
Portfolio Abbreviations:
144A - Rule 144A Security
L - 30 Day London Inter-bank Offered Rate
LLC - Limited Liability Company
LP - Limited Partnership
PLC - Public Limited Company
REIT - Real Estate Investment Trust
| | | | |
| Industry | | % of Net Assets | |
| |
Diversified | | | 79.8 | % |
Short-Term Investment | | | 4.6 | % |
Commercial Mortgage Backed Securities | | | 3.6 | % |
Apartments/Single Family Residential | | | 2.2 | % |
Warehouse/Industrial | | | 2.2 | % |
Office Properties | | | 1.5 | % |
Storage | | | 1.3 | % |
Health Care | | | 1.0 | % |
Shopping Centers | | | 0.7 | % |
Hotels | | | 0.7 | % |
Real Estate Operation/Development | | | 0.5 | % |
Regional Malls | | | 0.4 | % |
Residential | | | 0.3 | % |
Rights | | | 0.0 | % |
Other Assets net of Liabilities | | | 1.2 | % |
| | | | |
Total | | | 100.0 | % |
| | | | |
See accompanying notes to financial statements.
9
VERSUS CAPITAL MULTI-MANAGER REAL ESTATE INCOME FUND LLC
Statement of Assets and Liabilities
March 31, 2022
| | | | |
ASSETS: | | | | |
Investments: | | | | |
Non-affiliated investment in securities at cost | | $ | 2,612,472,795 | |
Non-affiliated investment net unrealized appreciation | | | 462,782,071 | |
| | | | |
Total non-affiliated investment in securities, at fair value | | | 3,075,254,866 | |
| | | | |
Affiliated investment in securities at cost | | | 75,000,000 | |
Affiliated net unrealized appreciation | | | 25,587,444 | |
| | | | |
Total affiliated investment in securities, at fair value | | | 100,587,444 | |
| | | | |
Cash | | | 15,604 | |
Foreign Currency (Cost $71,986) | | | 71,866 | |
Receivables for: | | | | |
Dividends and interest | | | 18,361,891 | |
Fund shares sold | | | 7,260,114 | |
Reclaims | | | 102,725 | |
Investments sold | | | 23,602,640 | |
| | | | |
Total receivables | | | 49,327,370 | |
Prepaid expenses | | | 67,926 | |
| | | | |
Total Assets | | | 3,225,325,076 | |
| | | | |
LIABILITIES: | | | | |
Payables for: | | | | |
Adviser fees | | | 7,767,133 | |
Investments purchased | | | 3,528,721 | |
Administrative fees | | | 147,235 | |
Professional fees | | | 127,963 | |
Transfer agent fees | | | 49,070 | |
Custodian fees | | | 24,375 | |
Accrued expenses and other liabilities | | | 185,175 | |
| | | | |
Total Liabilities(a) | | | 11,829,672 | |
| | | | |
| |
NET ASSETS | | $ | 3,213,495,404 | |
| | | | |
NET ASSETS consist of: | | | | |
Paid-in capital | | $ | 2,661,575,426 | |
Total distributable earnings | | | 551,919,978 | |
| | | | |
TOTAL NET ASSETS | | $ | 3,213,495,404 | |
| | | | |
| |
Net Assets | | $ | 3,213,495,404 | |
Shares of beneficial interest outstanding (unlimited authorization) | | | 102,260,626 | |
| | | | |
Net asset value price per share (Net Assets/Shares Outstanding) | | $ | 31.42 | |
| | | | |
| (a) | See Note 9. Restricted Securities for detail of Commitments and Contingencies related to unfunded commitments. |
See accompanying notes to financial statements.
10
VERSUS CAPITAL MULTI-MANAGER REAL ESTATE INCOME FUND LLC
Statement of Operations
For the Year Ended March 31, 2022
| | | | |
Investment Income: | | | | |
Dividends from non-affiliated investments | | $ | 76,359,485 | |
Dividends from affiliated investments | | | 1,534,829 | |
Interest income | | | 8,104,377 | |
Less: foreign taxes withheld | | | (406,807 | ) |
| | | | |
Total Investment Income | | | 85,591,884 | |
| | | | |
Expenses: | | | | |
Adviser fees (Note 4) | | | 29,581,245 | |
Interest and Line of Credit fees | | | 1,305,460 | |
Administration fees | | | 852,537 | |
Shareholder reporting fees | | | 476,628 | |
Professional fees | | | 401,386 | |
Custodian fees | | | 266,382 | |
Transfer agent fees | | | 265,888 | |
Directors’ fees (Note 4) | | | 249,328 | |
Registration fees | | | 28,638 | |
Other expenses | | | 295,639 | |
| | | | |
Total Expenses | | | 33,723,131 | |
| | | | |
Net Investment Income | | | 51,868,753 | |
| | | | |
Net Realized and Unrealized Gain (Loss) on Investments: | | | | |
Net realized gain on non-affiliated investments | | | 122,199,060 | |
Net realized gain on foreign currency transactions | | | 178,045 | |
Net change in unrealized appreciation on non-affiliated investments and foreign currency | | | 344,272,632 | |
Net change in unrealized appreciation on affiliated investments | | | 24,716,542 | |
| | | | |
Net Realized and Unrealized Gain on Investments | | | 491,366,279 | |
| | | | |
Net Increase in Net Assets Resulting from Operations | | $ | 543,235,032 | |
| | | | |
See accompanying notes to financial statements.
11
VERSUS CAPITAL MULTI-MANAGER REAL ESTATE INCOME FUND LLC
Statement of Changes in Net Assets
| | | | | | | | | | |
| | | Year Ended
March 31, 2022 | | Year Ended
March 31, 2021 |
| | |
Increase in Net Assets: | | | | | | | | | | |
From Operations: | | | | | | | | | | |
Net investment income | | | $ | 51,868,753 | | | | $ | 54,463,564 | |
Net realized gain on investments and foreign currency transactions | | | | 122,377,105 | | | | | 53,979,290 | |
Net change in unrealized appreciation on investments and foreign currency | | | | 368,989,174 | | | | | 49,373,268 | |
| | | | | | | | | | |
Net Increase in Net Assets Resulting From Operations | | | | 543,235,032 | | | | | 157,816,122 | |
| | | | | | | | | | |
| | |
Distributions to Shareholders from: | | | | | | | | | | |
Net investment income and net realized gains | | | | (170,821,298 | ) | | | | (87,948,261 | ) |
Return of capital | | | | (8,592,647 | ) | | | | (20,449,303 | ) |
| | | | | | | | | | |
Total Distributions | | | | (179,413,945 | ) | | | | (108,397,564 | ) |
| | | | | | | | | | |
| | |
Capital Share Transactions: | | | | | | | | | | |
Shares issued | | | | 743,276,979 | | | | | 363,971,004 | |
Reinvested dividends | | | | 36,255,366 | | | | | 22,028,613 | |
Shares redeemed | | | | (426,118,962 | ) | | | | (904,369,665 | ) |
| | | | | | | | | | |
Net Increase (Decrease) in Net Assets | | | | | | | | | | |
Resulting From Capital Share Transactions | | | | 353,413,383 | | | | | (518,370,048 | ) |
| | | | | | | | | | |
Total Increase (Decrease) in Net Assets | | | | 717,234,470 | | | | | (468,951,490 | ) |
| | | | | | | | | | |
Net Assets: | | | | | | | | | | |
Beginning of Year | | | $ | 2,496,260,934 | | | | $ | 2,965,212,424 | |
| | | | | | | | | | |
End of Year | | | $ | 3,213,495,404 | | | | $ | 2,496,260,934 | |
| | | | | | | | | | |
| | |
Share Transactions: | | | | | | | | | | |
Shares sold | | | | 25,303,369 | | | | | 13,483,119 | |
Shares issued in reinvestment of dividends | | | | 1,233,237 | | | | | 825,886 | |
Shares redeemed | | | | (14,802,602 | ) | | | | (33,815,167 | ) |
| | | | | | | | | | |
Net Increase (Decrease) in Shares of Beneficial Interest Outstanding | | | | 11,734,004 | | | | | (19,506,162 | ) |
| | | | | | | | | | |
See accompanying notes to financial statements.
12
VERSUS CAPITAL MULTI-MANAGER REAL ESTATE INCOME FUND LLC
Statement of Cash Flows
For the Year Ended March 31, 2022
| | | | |
Cash Flows Used in Operating Activities: | | | | |
Net increase in net assets resulting from operations | | $ | 543,235,032 | |
Adjustments to Reconcile Net Increase in Net Assets Resulting | | | | |
From Operations to Net Cash Used in Operating Activities: | | | | |
Purchases of investment securities | | | (1,106,439,676 | ) |
Proceeds from disposition of investment securities | | | 928,275,137 | |
Net purchases of short-term investment securities | | | (51,441,600 | ) |
Net change in unrealized appreciation on investments and foreign currency | | | (368,989,174 | ) |
Net realized gain from investments sold and foreign currency transactions | | | (122,377,105 | ) |
Net amortization/(accretion) of premium/(discount) | | | 757,852 | |
Increase in dividends and interest receivable | | | (1,947,630 | ) |
Increase in reclaims receivable | | | (31,782 | ) |
Decrease in prepaid expenses | | | 427,197 | |
Increase in Adviser fees payable | | | 1,245,720 | |
Increase in administrative fees payable | | | 30,970 | |
Decrease in professional fees payable | | | (119,000 | ) |
Decrease in custodian fees payable | | | (16,380 | ) |
Decrease in transfer agent fees payable | | | (18,783 | ) |
Increase in accrued expenses and other liabilities | | | 12,116 | |
| | | | |
Net Cash Used in Operating Activities | | | (177,397,106 | ) |
| | | | |
Cash Flows From Financing Activities: | | | | |
Proceeds from shares issued | | | 746,489,859 | |
Payments of shares redeemed | | | (426,118,962 | ) |
Dividends paid (net of reinvestment of dividends) | | | (143,158,579 | ) |
| | | | |
Net Cash Provided by Financing Activities | | | 177,212,318 | |
| | | | |
Effect of exchange rate changes on foreign currency | | | 175,853 | |
| | | | |
Net Decrease in Cash | | | (8,935 | ) |
| | | | |
Cash and Foreign Currency: | | | | |
Beginning of period | | | 96,405 | |
| | | | |
End of period | | $ | 87,470 | |
| | | | |
Supplemental Disclosure of Cash Flow Information: | | | | |
Interest paid during the year | | $ | 48,681 | |
Reinvestment of dividends | | | 36,255,366 | |
See accompanying notes to financial statements.
13
VERSUS CAPITAL MULTI-MANAGER REAL ESTATE INCOME FUND LLC
Financial Highlights
| | | | | | | | | | | | | | | | | | | | |
| | | Year Ended
March 31,
2022 | | | Year Ended
March 31,
2021 | | | Year Ended
March 31,
2020 | | | Year Ended
March 31,
2019 | | | Year Ended
March 31,
2018 | |
Net Asset Value, Beginning of Year | | $ | 27.57 | | | $ | 26.95 | | | $ | 28.22 | | | $ | 27.70 | | | $ | 27.52 | |
Income from Investment Operations: | | | | | | | | | | | | | | | | | | | | |
Net investment income(a) | | | 0.56 | | | | 0.56 | | | | 0.67 | | | | 0.77 | | | | 0.65 | |
Net realized and unrealized gain (loss) | | | 5.20 | | | | 1.12 | | | | (0.74 | ) | | | 0.99 | | | | 0.79 | |
| | | | | | | | | | | | | | | | | | | | |
Total from investment operations | | | 5.76 | | | | 1.68 | | | | (0.07 | ) | | | 1.76 | | | | 1.44 | |
| | | | | | | | | | | | | | | | | | | | |
| | | | | |
Less Distributions to Shareholders from: | | | | | | | | | | | | | | | | | | | | |
Distribution from net investment income and net realized gains | | | (1.82 | )(b) | | | (0.86 | ) | | | (0.73 | ) | | | (0.79 | ) | | | (0.61 | ) |
Return of Capital | | | (0.09 | ) | | | (0.20 | ) | | | (0.47 | ) | | | (0.45 | ) | | | (0.65 | ) |
| | | | | | | | | | | | | | | | | | | | |
Total Distributions | | | (1.91 | ) | | | (1.06 | ) | | | (1.20 | ) | | | (1.24 | ) | | | (1.26 | ) |
| | | | | | | | | | | | | | | | | | | | |
Net Asset Value, End of Year | | $ | 31.42 | | | $ | 27.57 | | | $ | 26.95 | | | $ | 28.22 | | | $ | 27.70 | |
| | | | | | | | | | | | | | | | | | | | |
Total Return Based On Net Asset Value | | | 21.04 | % | | | 6.00 | % | | | (0.27 | )% | | | 6.70 | % | | | 5.32 | % |
Ratios and Supplemental Data | | | | | | | | | | | | | | | | | | | | |
Net assets, end of year (000’s) | | $ | 3,213,495 | | | $ | 2,496,261 | | | $ | 2,965,212 | | | $ | 2,797,314 | | | $ | 2,184,488 | |
Ratios of gross expenses to average net assets | | | 1.24 | % | | | 1.20 | % | | | 1.19 | % | | | 1.17 | % | | | 1.24 | % |
Ratios of net expenses to average net assets | | | 1.24 | % | | | 1.20 | % | | | 1.19 | % | | | 1.17 | % | | | 1.24 | % |
Ratios of net investment income to average net assets | | | 1.90 | % | | | 2.09 | % | | | 2.37 | % | | | 2.77 | % | | | 2.37 | % |
Portfolio turnover rate | | | 33.66 | % | | | 26.19 | % | | | 15.77 | % | | | 13.48 | % | | | 13.03 | % |
| (a) | Per Share amounts are calculated based on average outstanding shares. |
| (b) | Includes one-time distribution of net realized gains of $0.74 per share paid on December 29, 2021. |
See accompanying notes to financial statements.
14
VERSUS CAPITAL MULTI-MANAGER REAL ESTATE INCOME FUND LLC
Notes to Financial Statements
March 31, 2022
NOTE 1. ORGANIZATION
Versus Capital Multi-Manager Real Estate Income Fund LLC (the “Fund”) is a Delaware limited liability company registered under the Investment Company Act of 1940, as amended (the “1940 Act”), as a non-diversified, closed-end management investment company that is operated as an interval fund. The Fund’s primary investment objective is to seek consistent current income, while its secondary objectives are capital preservation and long-term capital appreciation. The Fund attempts to achieve these objectives by allocating its capital among a select group of institutional asset managers (the “Investment Managers”) with expertise in managing portfolios of real estate and real estate-related investments. The Fund is authorized to issue an unlimited number of common shares of beneficial interest without par value and has registered an aggregate offering amount of $5.5 billion. The Fund’s investment adviser is Versus Capital Advisors LLC (the ‘‘Adviser’’).
NOTE 2. SIGNIFICANT ACCOUNTING POLICIES
The Fund is an investment company that follows the accounting and reporting guidance of Accounting Standards Codification Topic 946 applicable to investment companies. The following is a summary of significant accounting policies followed by the Fund in the preparation of its financial statements.
Investment Income and Securities Transactions - Dividend income is recorded on the ex-dividend date, except for certain dividends from foreign securities where the ex-dividend date may have passed, which are recorded as soon as the Fund is informed of the ex-dividend date. Dividend income is recorded net of applicable withholding taxes. Interest income is accrued daily. Premiums and discounts are amortized or accreted on an effective yield method on fixed income securities. Dividend income from REIT investments is recorded using management’s estimate of the percentage of income included in distributions received from such investments based on historical information and other industry sources. The return of capital portion of the estimate is a reduction to investment income and a reduction in the cost basis of each investment which increases net realized gain (loss) and net change in unrealized appreciation (depreciation). If the return of capital distributions exceed its cost basis, the distributions are treated as realized gains. The actual amounts of income, return of capital, and capital gains are only determined by each REIT after its fiscal year-end, and may differ from the estimated amounts. The Fund may be subject to foreign taxes on income, gains on investments or currency repatriation, a portion of which may be recoverable. The Fund will accrue such taxes and reclaims as applicable, based upon their current interpretation of tax rules and regulations that exist in the markets in which the Fund invests. Securities are accounted for on a trade date basis. The cost of securities sold is determined and gains (losses) are based upon the specific identification method.
Foreign Currency - Foreign currencies, investments and other assets and liabilities are translated into U.S. dollars at the exchange rates at 4:00 p.m. U.S. ET (Eastern Time). Fluctuations in the value of the foreign currencies and other assets and liabilities resulting from changes in exchange rates are recorded as unrealized foreign currency gains (losses). Realized gains (losses) and unrealized appreciation (depreciation) on investment securities and income and expenses are translated on the respective dates of such transactions. The effects of changes in foreign currency exchange rates on investments in securities are not segregated in the Statement of Operations from the effects of changes in market prices of those securities, and are included with the net realized and net change in unrealized gain or loss on investment securities.
Dividends and Distributions to Shareholders - The Fund will make regular quarterly distributions to shareholders of all or a portion of any dividends or investment income it earns on investments. In addition, the Fund will make regular distributions to the shareholders of all or a portion of capital gains distributed to the Fund by Investment Funds and capital gains earned by the Fund from the disposition of Investment Funds or other investments, together with any dividends or interest income earned from such investments. A portion of any distribution may be a return of capital or from other capital sources. Dividends and distributions to shareholders are recorded on the ex-dividend date.
U.S. Federal Income Tax Information - The Fund intends to qualify each year as a “regulated investment company” under the Internal Revenue Code of 1986, as amended. By so qualifying, the Fund will not be subject to federal income taxes to the extent that it distributes substantially all of its net investment income and any realized capital gains. This policy may cause multiple distributions during the course of the year, which are recorded on the ex-dividend date.
As of and during the year ended March 31, 2022, the Fund did not have a liability for any unrecognized tax obligations. The Fund recognizes interest and penalties, if any, related to unrecognized tax obligations as income tax expense in the statement of operations. During the year, the Fund did not incur any interest or penalties. The Fund identifies its major tax jurisdiction as U.S. Federal.
Dividends from net investment income and distributions from realized gains are determined in accordance with federal income tax regulations, which may differ from net investment income and realized gains recognized for financial reporting purposes. Accordingly, the character of distributions and composition of net assets for tax purposes may differ from those reflected in the accompanying financial statements. To the extent these differences are permanent, such amounts are reclassified within the capital accounts at fiscal year end based on the tax treatment; temporary differences do not require such reclassification. As of March 31, 2022, permanent differences identified and reclassified among the components of net assets were to increase undistributed net investment income by approximately $52,356,000, to decrease accumulated net realized gain by approximately $46,015,000 and to decrease paid-in-capital by approximately $6,341,000.
For the year ended March 31, 2022, tax character of the distribution paid by the Fund was approximately $75,147,000 of ordinary income dividends, approximately $95,674,000 of long-term capital gains and approximately $8,593,000 of return of capital. For the year ended March 31, 2021, tax character of the distribution paid by the Fund was approximately $22,759,000 of ordinary income dividends, approximately $65,190,000 of long-term capital gains and approximately $20,449,000 of return of capital. Distribution from net investment income and short-term capital gains are treated as ordinary income for federal income tax purposes.
15
VERSUS CAPITAL MULTI-MANAGER REAL ESTATE INCOME FUND LLC
Notes to Financial Statements
March 31, 2022 (continued)
Net capital losses incurred may be carried forward for an unlimited time period, and retain their tax character as either short-term or long-term capital losses. As of March 31, 2022, the Fund had no capital loss carryovers available to offset future capital gains.
Under federal tax law, capital and qualified ordinary losses realized after October 31 and December 31, respectively, may be deferred and treated as having arisen on the first day of the following fiscal year. For the year ended March 31, 2022, the Fund elected to defer approximately $5,456,000 in qualified late year losses.
As of March 31, 2022, the gross unrealized appreciation and depreciation and net unrealized appreciation on a tax basis were approximately $599,104,000, $(41,615,000) and $557,490,000, respectively. The aggregate cost of securities for federal income tax purposes at March 31, 2022, was approximately $2,618,341,000.
Guarantees and Indemnifications - In the normal course of business, the Fund enters into contracts with service providers that contain general indemnification clauses. The Fund’s maximum exposure under these arrangements is unknown and this would involve future claims against the Fund that have not yet occurred. Based on experience, the Fund would expect the risk of loss to be remote.
Use of Estimates - The preparation of financial statements in accordance with accounting principles generally accepted in the United States of America requires management to make estimates and assumptions that affect the reported amounts of assets and liabilities (disclosure of contingent assets and liabilities) at the date of the financial statements and the reported amounts of increases and decreases in net assets from operations during the reporting period. Actual results could differ from those estimates.
NOTE 3. SECURITIES VALUATION
Consistent with Section 2(a)(41) of the 1940 Act, the Fund prices its securities as follows:
Publicly Traded Securities - Investments in securities that are listed on the New York Stock Exchange (the “NYSE”) are valued, except as indicated below, at the official closing price reflected at the close of the NYSE on the business day as of which such value is being determined. If there has been no published closing price on such day, the securities are valued at the mean of the closing bid and ask prices for the day or, if no ask price is available, at the bid price. Securities not listed on the NYSE but listed on other domestic or foreign securities exchanges are valued in a similar manner. Securities traded on more than one securities exchange are valued at the closing price of the exchange representing the principal market for such securities on the business day as of which such value is being determined. If, after the close of a domestic or foreign market, but prior to the close of business on the day the securities are being valued, market conditions change significantly, the domestic or foreign securities may be valued pursuant to procedures established by the Board of Directors (the “Board”).
Securities traded in the over-the-counter market, such as fixed-income securities and certain equities, including listed securities whose primary market is believed by the Advisor to be over-the-counter, are valued at the official closing prices as reported by sources as the Board deems appropriate to reflect their fair market value. If there has been no official closing price on such day, the securities are valued at the mean of the closing bid and ask prices for the day or, if no ask price is available, at the bid price. Fixed-income securities typically will be valued on the basis of prices provided by a pricing service, generally an evaluated price or the mean of closing bid and ask prices obtained by the pricing service, when such prices are believed by the Adviser to reflect the fair market value of such securities. Furthermore, the Fund’s Adviser will review the valuation methodology of any pricing service used in the Fund’s investment valuation process, subject to oversight and/or approval of the Board.
Short-term debt securities, which have a maturity date of 60 days or less, are valued at amortized cost, which approximates fair value.
Investments in open-end mutual funds are valued at their closing NAV.
Securities for which market prices are unavailable, or securities for which the Adviser determines that the market quotation is unreliable, will be valued at fair value pursuant to procedures approved by the Board. In these circumstances, the Adviser determines fair value in a manner that fairly reflects the market value of the security on the valuation date based on consideration of any information or factors it deems appropriate. These may include recent transactions in comparable securities, information relating to the specific security and developments in the markets. The Fund’s use of fair value pricing may cause the NAV of the Shares to differ from the NAV that would be calculated using market quotations. Fair value pricing involves subjective judgments and it is possible that the fair value determined for a security may be materially different than the value that could be realized upon the sale of such security.
Private Investment Funds - The Board has adopted procedures pursuant to which the Fund will value its investments in Private Investment Funds. Before investing in any Private Investment Fund, the Adviser will conduct a due diligence review of the valuation methodology utilized by such Private Investment Fund, which as a general matter will employ market values when available, and otherwise look at principles of fair value that the Adviser reasonably believes to be consistent with (but not necessarily the same as) those used by the Fund for valuing its own investments. The Adviser shall use its best efforts to ensure that each private Investment Fund has in place policies and procedures that are consistent with the practices provided for in the Real Estate Information Standards (‘‘REIS’’), as established and amended by the National Council of Real Estate Investment Fiduciaries (‘‘NCREIF’’) in conjunction with the Pension Real Estate Association (‘‘PREA’’), or comparable standards which may apply. REIS provides underlying principles behind the disclosure of reliable information with adequate policies and practices that include, but are not limited to the following:
| • | | Property valuation standards and policy that are expected to be applied consistent with Generally Accepted Accounting Principles (“GAAP”) fair value principles and uniform appraisal standards or such comparable standards as may apply to international managers. Real estate investments are required |
16
VERSUS CAPITAL MULTI-MANAGER REAL ESTATE INCOME FUND LLC
Notes to Financial Statements
March 31, 2022 (continued)
| | to be valued, (a) internally (by the Private Investment Fund’s manager) with third party (preferably an accounting or valuation firm) oversight to assure the reasonableness of and compliance with valuation policies, at least quarterly and (b) externally by an appraiser or other third party preferably once annually, but at least once every 36 months. Furthermore, the valuations should be performed with impartiality, objectivity and independence, and with control to demonstrate they have been completed fairly. This includes the maintenance of records of methods and techniques for valuation with sufficient documentation to understand the scope of work completed. |
| • | | Market Value Accounting and Reporting Standards including the production of quarterly financial statements and annual audited financials. This also incorporates quarterly performance measurement and reporting standards for every asset held by the Private Investment Fund. After investing in a Private Investment Fund, the Adviser will monitor the valuation methodology used by such Private Investment Fund and its manager. |
The Fund values its investments in Private Investment Funds based in large part on valuations provided by the managers of the Private Investment Funds and their agents. These fair value calculations will involve significant professional judgment by the managers of the Private Investment Funds in the application of both observable and unobservable attributes. The calculated NAVs of the Private Investment Funds’ assets may differ from their actual realizable value or future fair value. Valuations will be provided to the Fund based on the interim unaudited financial records of the Private Investment Funds and, therefore, will be estimates subject to adjustment (upward or downward) upon the auditing of such financial records and may fluctuate as a result. The Board and the Adviser may not have the ability to assess the accuracy of these valuations. Because a significant portion of the Fund’s assets are invested in Investment Funds, these valuations have a considerable impact on the Fund’s NAV.
For each quarterly period that the NAVs of the Private Investment Funds are calculated by the managers of such funds, each Private Investment Fund’s NAV is typically adjusted based on the actual income and appreciation or depreciation realized by such Private Investment Fund when the quarterly valuations and income are reported. The Adviser will review this information for reasonableness based on its knowledge of current market conditions and the individual characteristics of each Investment Fund and may clarify or validate the reported information with the applicable manager of the Private Investment Fund. The Adviser may conclude, in certain circumstances, that the information provided by any such manager does not represent the fair value of the Fund’s investment in a Private Investment Fund and is not indicative of what actual fair value would be under current market conditions. In those circumstances, the Adviser’s Valuation Committee may determine to value the Fund’s investment in the Private Investment Fund at a discount or a premium to the reported value received from the Private Investment Fund. Any such decision will be made in good faith by the Adviser’s Valuation Committee, subject to the review and ratification of the Board’s Valuation Committee. The Fund’s valuation of each Private Investment Fund is individually updated as soon as the Adviser completes its reasonableness review, including any related necessary additional information validations with the manager of the Private Investment Fund, and typically within 45 calendar days after the end of each quarter for all Private Investment Funds. Additionally, between the quarterly valuation periods, the NAVs of such Private Investment Funds are adjusted daily based on the total return that each private Investment Fund is estimated by the Adviser to generate during the current quarter. The Adviser’s Valuation Committee monitors these estimates regularly and updates them as necessary if macro or individual fund changes warrant any adjustments, subject to the review and supervision of the Board’s Valuation Committee. The March 31, 2022 Portfolio of Investments presented herein reports the value of all the Fund’s investments in Private Investment Funds at the respective NAVs provided by the managers of the Private Investment Funds and their agents, which may differ from the valuations used by the Fund in its March 31, 2022 NAV calculation.
Due to the inherent uncertainty of determining the fair value of investments that do not have readily available market quotations, the fair value of the Fund’s investments may fluctuate from period to period. Additionally, the fair value of investments may differ significantly from the values that would have been used had a ready market existed for such investments and may differ materially from the values the Fund may ultimately realize. Further, such investments may be subject to legal and other restrictions on resale or may otherwise be less liquid than publicly traded securities.
Fair Value Measurements: The inputs and valuation techniques used to measure fair value of the Fund’s investments are summarized into three levels as described in the hierarchy below:
| | | | | | |
| | • Level 1 | | – unadjusted quoted prices in active markets for identical securities |
| | • Level 2 | | – prices determined using other significant observable inputs (including quoted prices for similar securities, interest rates, pre-payment speeds, credit risk, etc.) |
| | • Level 3 | | – significant unobservable inputs (including the Fund’s own assumptions in determining the fair value of investments) |
At the end of each calendar quarter, management evaluates the classification of Levels 1, 2 and 3 assets and liabilities. Various factors are considered, such as changes in liquidity from the prior reporting period; whether or not a broker is willing to execute at the quoted price; the depth and consistency of prices from third party pricing services; the existence of contemporaneous, observable trades in the market; and changes in listings or delistings on national exchanges. The inputs or methodology used for valuing securities are not necessarily an indication of the risk associated with investing in those securities. A summary of inputs used to value the Fund’s investments as of March 31, 2022 is as follows:
| | | | | | | | | | | | | | | | | | | | |
| | | Total Market
Value at
03/31/2022 | | Level 1
Quoted
Price | | Level 2
Significant
Observable
Inputs | | Level 3
Significant
Unobservable
Inputs |
| | | | |
Common Stocks* | | | $ | 390,899,067 | | | | $ | 317,922,333 | | | | $ | 72,976,734 | | | | | $— | |
Rights* | | | | 9,739 | | | | | — | | | | | 9,739 | | | | | — | |
17
VERSUS CAPITAL MULTI-MANAGER REAL ESTATE INCOME FUND LLC
Notes to Financial Statements
March 31, 2022 (continued)
| | | | | | | | | | | | | | | | | | | | |
| | | Total Market
Value at
03/31/2022 | | Level 1
Quoted
Price | | Level 2
Significant
Observable
Inputs | | Level 3
Significant
Unobservable
Inputs |
Preferred Stocks* | | | $ | 43,083,007 | | | | $ | 43,083,007 | | | | $ | — | | | | | $— | |
Commercial Mortgage Backed Securities | | | | 115,268,061 | | | | | — | | | | | 115,268,061 | | | | | — | |
Short-Term Investment | | | | 146,857,313 | | | | | 146,857,313 | | | | | — | | | | | — | |
| | | | | | | | | | | | | | | | | | | | |
| | | | |
Subtotal | | | $ | 696,117,187 | | | | $ | 507,862,653 | | | | $ | 188,254,534 | | | | | $— | |
| | | | | | | | | | | | | | | | | | | | |
| | | | |
Private Investment Funds (held at NAV)* | | | | 2,479,725,123 | | | | | | | | | | | | | | | | |
| | | | | | | | | | | | | | | | | | | | |
| | | | |
Total | | | $ | 3,175,842,310 | | | | | | | | | | | | | | | | |
| | | | | | | | | | | | | | | | | | | | |
| * | See Portfolio of Investments for industry breakout. |
NOTE 4. FEES AND OTHER TRANSACTIONS WITH AFFILIATES
Pursuant to an Investment Management Agreement, Versus Capital Advisors LLC serves as the investment adviser to the Fund. For its services under this agreement, the Fund pays the Adviser an Investment Management Fee at an annual rate of 0.95% of the Fund’s NAV, which accrues daily based on the net assets of the Fund and is paid quarterly. The Fund incurred fees to the Adviser of approximately $25,935,000 for the year ended March 31, 2022, which are included within Adviser fees on the accompanying statement of operations.
The Adviser has retained the services of Security Capital Research & Management, Inc. and Principal Real Estate Investors, LLC as sub-advisers of the Fund (the “Sub-Advisers”). The Sub-Advisers each manage a specified portion of the Fund’s assets to be invested in domestic and international publicly traded real estate securities, such as common and preferred stock of publicly listed REITs, commercial mortgage-backed securities, commercial real estate collateralized debt obligations, and senior unsecured debt of REITs. Fees paid to the Sub-Advisers are based on the average net assets that they manage at an annual rate between 0.45% and 1.00%. The Fund incurred fees to the Sub-Advisers of approximately $3,646,000 for the year ended March 31, 2022, which are included within Adviser fees on the accompanying statement of operations.
Foreside Funds Distributors LLC, (the “Distributor”) serves as the Fund’s statutory underwriter and facilitates the distribution of Shares.
The Fund pays each Independent Director a fee per annum. In addition, the Fund reimburses each of the Independent Directors for travel and other expenses incurred in connection with attendance at meetings; provided, however, that if more than three board meetings require out-of-town travel time, such additional travel time may be billed at the rate set forth in the Board of Directors Retainer Agreement or as amended by action of the Board from time to time. Each of the Independent Directors is a member of all Committees. The Chairman of the Audit Committee receives an additional fee per annum. Other members of the Board and executive officers of the Fund receive no compensation. The Fund also reimburses the Adviser for a portion of the compensation that it pays to the Fund’s Chief Compliance Officer.
NOTE 5. MARKET RISK FACTORS
The Fund’s investments in securities and/or financial instruments may expose the Fund to various market risk factors including, but not limited to the following:
General Market Fluctuations Will Affect the Fund’s Returns. The Fund’s investments in Private Investment Funds and real estate securities may be negatively affected by the broad investment environment in the real estate market, the debt market and/or the equity securities market.
General Risks of the Private Investment Funds Investing in Real Estate. The Fund will not invest in real estate directly, but, because the Fund will invest in Private Investment Funds that qualify as REITs or investment vehicles treated similarly as private REITs, the Fund’s investment portfolio will be significantly impacted by the performance of the real estate market.
Risks of Investing in Equity Securities. The prices of equity and preferred securities fluctuate based on changes in a company’s financial condition and overall market and economic conditions. Preferred securities may be subject to additional risks, such as risks of deferred distributions, liquidity risks, and differences in shareholder rights associated with such securities.
Unfunded Commitments. In order to meet its obligation to provide capital for unfunded commitments, the Fund may have to hold some, or in certain cases a substantial amount, of its assets temporarily in money market securities, cash or cash equivalents, possibly for several months; liquidate portfolio securities at an inopportune time; or borrow under a line of credit. This could make it difficult or impossible to take or liquidate a position in a particular security at a price consistent with the Adviser’s strategy.
Risks Relating to Current Interest Rate Environment. A wide variety of factors can cause interest rates or yields of U.S. Treasury securities (or yields of other types of bonds) to rise (e.g., central bank monetary policies, inflation rates, general economic conditions, reduced market demand for low yielding investments, etc.). The U.S. Federal Reserve has recently begun raising interest rates in light of recent inflationary pressures and interest rates may increase rapidly. Thus, the Fund currently faces a heightened level of risk associated with rising interest rates and/or bond yields.
18
VERSUS CAPITAL MULTI-MANAGER REAL ESTATE INCOME FUND LLC
Notes to Financial Statements
March 31, 2022 (continued)
Liquidity Risk. The Fund will invest in restricted securities and other investments that are illiquid. Restricted securities are securities that may not be sold to the public without an effective registration statement under the Securities Act, or, if they are unregistered, may be sold only in a privately negotiated transaction or pursuant to an exemption from registration under the Securities Act. The Fund may be unable to sell restricted and other illiquid securities at the most opportune times or at prices approximating the value at which it purchased such securities. The Fund’s portfolio may include a number of investments for which no market exists and which have substantial restrictions on transferability.
Market Disruption, Health Crises, Terrorism and Geopolitical Risks. The Fund’s investments may be negatively affected by the broad investment environment in the real estate market, the debt market and/or the equity securities market. The investment environment is influenced by, among other things, interest rates, inflation, politics, fiscal policy, current events, competition, productivity and technological and regulatory change. In addition, the Fund may be adversely affected by uncertainties such as war, terrorism, international political developments, sanctions or embargos, tariffs and trade wars, changes in government policies, global health crises or similar pandemics, and other related geopolitical events may lead to increased short-term market volatility and have adverse long-term effects on world economies and markets generally, as well as adverse effects on issuers of securities and the value of investments.
NOTE 6. INVESTMENT TRANSACTIONS
For the year ended March 31, 2022, the purchases and sales of investment securities, excluding short-term investments and U.S. Government securities were approximately $1,063,034,000 and $890,876,000, respectively. For the year ended March 31, 2022, the purchases and sales of U.S. Government securities were approximately $2,225,000 and $0, respectively.
NOTE 7. REPURCHASE OFFERS
The Fund has a fundamental policy that it will make quarterly Repurchase Offers for no less than 5% of its shares outstanding at NAV, unless suspended or postponed in accordance with regulatory requirements (as discussed below), and that each quarterly repurchase pricing shall occur no later than the 14th day after the Repurchase Request Deadline (defined below), or the next Business Day if the 14th is not a Business Day (each a “Repurchase Pricing Date”). In general, the Repurchase Pricing Date occurs on the Repurchase Request Deadline and settlement occurs 3 days later. Shares will be repurchased at the NAV per Share determined as of the close of regular trading on the NYSE on the Repurchase Pricing Date.
Shareholders will be notified in writing about each quarterly Repurchase Offer, how they may request that the Fund repurchase their shares and the Repurchase Request Deadline, which is the date the Repurchase Offer ends. The Repurchase Request Deadline will be determined by the Board. The time between the notification to shareholders and the Repurchase Request Deadline may vary from no more than 42 days to no less than 21 days. The repurchase price of the shares will be the NAV as of the close of regular trading on the NYSE on the Repurchase Pricing Date. Payment pursuant to the repurchase will be made to the shareholders within seven days of the Repurchase Pricing Date (the “Repurchase Payment Deadline”). Certain authorized institutions, including custodians and clearing platforms, may set times prior to the Repurchase Request Deadline by which they must receive all documentation they may require relating to repurchase requests and may require additional information. In addition, certain clearing houses may allow / require shareholders to submit their tender request only on the Repurchase Request Deadline.
Shares tendered for repurchase by shareholders prior to any Repurchase Request Deadline will be repurchased subject to the aggregate repurchase amounts established for that Repurchase Request Deadline. Repurchase proceeds will be paid to shareholders prior to the Repurchase Payment Deadline.
The Board, or a committee thereof, in its sole discretion, will determine the number of shares that the Fund will offer to repurchase (the “Repurchase Offer Amount”) for a given Repurchase Request Deadline. The Repurchase Offer Amount, however, will be no less than 5% of the total number of shares outstanding on the Repurchase Request Deadline.
If Share repurchase requests exceed the number of Shares in the Fund’s Repurchase Offer, the Fund may, in its sole discretion (i) repurchase the tendered Shares on a pro rata basis or (ii) increase the number of Shares to be repurchased by up to 2% of the Fund’s outstanding Shares. If Share repurchase requests exceed the number of Shares in the Fund’s Repurchase Offer plus 2% of the Fund’s outstanding Shares, the Fund is required to repurchase the Shares on a pro rata basis. However, the Fund may accept all shares tendered for repurchase by shareholders who own less than one hundred shares and who tender all of their Shares before prorating other amounts tendered. Because of the potential for proration, tendering shareholders may not have all of their tendered Shares repurchased by the Fund.
19
VERSUS CAPITAL MULTI-MANAGER REAL ESTATE INCOME FUND LLC
Notes to Financial Statements
March 31, 2022 (continued)
Results of the Fund’s Repurchase Offers during the year ended March 31, 2022 are as follows:
| | | | | | | | | | | | | | | | | | | | | | | | | |
Repurchase
Request
Deadline/Pricing
Date | | Repurchase
Offer Amount
(Percentage) | | Repurchase
Offer Amount
(Shares) | | Shares
Tendered for
Repurchase | | Percentage of
Tendered
Shares
Repurchased | | Value of
Repurchased
Shares |
| | | | | |
April 23, 2021 | | | | 8 | % | | | | 7,338,912 | | | | | 6,161,022 | | | | | 100 | % | | | $ | 171,021,942 | |
July 23, 2021 | | | | 8 | | | | | 7,392,545 | | | | | 3,040,247 | | | | | 100 | % | | | | 87,506,629 | |
October 22, 2021 | | | | 8 | | | | | 7,547,208 | | | | | 2,805,071 | | | | | 100 | % | | | | 83,450,871 | |
January 28, 2022 | | | | 8 | | | | | 7,877,501 | | | | | 2,796,262 | | | | | 100 | % | | | | 84,139,520 | |
NOTE 8. LINE OF CREDIT
Effective April 15, 2021, the Fund renewed its $150,000,000 line of credit (“LOC”) with Zions Bancorporation N.A. dba Vectra Bank Colorado (“Vectra”). Borrowings, if any, under the LOC bear interest at the one month LIBOR/Rate plus 1.50% at the time of borrowing with a minimum interest rate of 2.50%. The Fund incurred interest expense of approximately $49,000 during the year ended March 31, 2022. In addition, the Fund incurs a Non-Utilization Fee equal to 0.375% on the portion of the LOC not being used and certain origination and structuring fees (the “other LOC fees”). The Fund incurred other LOC fees equal to approximately $1,256,000 during the year ended March 31, 2022. As collateral for the lines of credit, the Fund would grant Vectra a first position security interest in and lien on securities held by the Fund in a collateral account. The Fund’s outstanding borrowings from the LOC were $0 at March 31, 2022 and the Fund complied with all covenants of the LOC during the year ended March 31, 2022.
Effective April 13, 2022, the Fund renewed its LOC with an increased borrowing limit of $172,500,000. Borrowings, if any, under the April 13, 2022 renewal bear interest at the one-month Secured Overnight Financing Rate (SOFR), plus 1.60% at the time of borrowing.
NOTE 9. RESTRICTED SECURITIES
Restricted securities include securities that have not been registered under the Securities Act of 1933, as amended, and securities that are subject to restrictions on resale. The Fund may invest in restricted securities that are consistent with the Fund’s investment objective and investment strategies. Investments in restricted securities are valued at net asset value as practical expedient for fair value, or fair value as determined in good faith in accordance with procedures adopted by the Board. It is possible that the estimated value may differ significantly from the amount that might ultimately be realized in the near term, and the difference could be material. Each of the following securities can suspend redemptions if its respective Board deems it in the best interest of its shareholders. This and other important information are described in the Fund’s Prospectus.
As of March 31, 2022, the Fund invested in the following restricted securities:
| | | | | | | | | | | | | | | | | | | | | | | | | | | | |
Security(a) | | Acquisition
Date(b) | | | Shares/Par | | | Cost
($1,000s) | | | Value
($1,000s) | | | Unfunded
Commitments
($1,000)(c) | | | % of
Net
Assets | | | Redemption
Notice(d) | |
| | | | | | | | | | | | | | | | | | | | | | | | | | | | |
AEW Core Property (U.S.), LP | | | 7/2/2013 | | | | 103,618 | | | $ | 101,472 | | | $ | 131,922 | | | $ | — | | | | 4.1 | % | | | 45 Days(e) | |
AEW Value Investors US LP | | | 8/17/2017 | | | | — | (f) | | | 75,000 | | | | 100,587 | | | | — | | | | 3.1 | % | | | 90 Days | |
Barings European Core Property Fund | | | 6/13/2017 | | | | 72,560 | | | | 100,046 | | | | 99,897 | | | | 27,905 | | | | 3.1 | % | | | 60 Days(g) | |
CBRE U.S. Core Partners LP | | | 3/29/2018 | | | | 122,982,873 | | | | 195,312 | | | | 246,519 | | | | — | | | | 7.7 | % | | | 60 Days | |
CBRE U.S. Logistics Partners LP | | | 3/31/2022 | | | | 11,725,745 | | | | 14,933 | | | | 14,872 | | | | 185,128 | | | | 0.5 | % | | | 90 Days(h) | |
Clarion Gables Multifamily Trust LP | | | 3/4/2019 | | | | 89,172 | | | | 115,944 | | | | 163,644 | | | | 10,000 | | | | 5.1 | % | | | 90 Days | |
Clarion Lion Properties Fund LP | | | 7/1/2013 | | | | 127,263 | | | | 174,217 | | | | 245,688 | | | | — | | | | 7.6 | % | | | 90 Days | |
GI Partners ETS Fund | | | 9/24/2021 | | | | 18,326 | | | | 18,681 | | | | 23,058 | | | | 61,652 | | | | 0.7 | % | | | 90 Days(h) | |
GWL U.S. Property Fund LP | | | 12/30/2019 | | | | — | (i) | | | 125,000 | | | | 159,145 | | | | — | | | | 5.0 | % | | | 90 Days | |
Harrison Street Core Property Fund | | | 8/13/2014 | | | | 79,032 | | | | 110,617 | | | | 121,424 | | | | — | | | | 3.8 | % | | | 45 Days | |
Heitman America Real Estate LP | | | 12/2/2014 | | | | 99,046 | | | | 119,927 | | | | 150,356 | | | | — | | | | 4.7 | % | | | 90 Days | |
Heitman Core Real Estate Debt Income Trust LP | | | 4/1/2017 | | | | 144,358 | | | | 146,897 | | | | 145,139 | | | | — | | | | 4.5 | % | | | 90 Days | |
Invesco Core Real Estate USA LP | | | 12/31/2013 | | | | 1,060 | | | | 189,500 | | | | 240,626 | | | | — | | | | 7.5 | % | | | 45 Days | |
Invesco Real Estate Asia Fund | | | 9/30/2014 | | | | 1,049,052 | | | | 133,426 | | | | 152,039 | | | | — | | | | 4.7 | % | | | 45 Days | |
LaSalle Property Fund LP | | | | | | | | | | | | | | | | | | | | | | | | | | | | |
Class A Shares | | | 8/31/2015 | | | | 19,839 | | | | 32,120 | | | | 41,442 | | | | — | | | | 1.3 | % | | | 45 Days(g) | |
Class B Shares | | | 8/31/2015 | | | | 1,422 | | | | 2,302 | | | | 2,970 | | | | — | | | | 0.1 | % | | | 45 Days(g) | |
RREEF America REIT II, Inc. | | | 9/30/2013 | | | | 969,603 | | | | 116,840 | | | | 153,305 | | | | 2,250 | | | | 4.8 | % | | | 45 Days | |
TA Realty Core Property Fund, LP | | | 1/3/2022 | | | | 34,640 | | | | 49,490 | | | | 53,557 | | | | 75,000 | | | | 1.7 | % | | | 45 Days | |
Trumbull Property Fund LP | | | 9/30/2013 | | | | 2,610 | | | | 28,137 | | | | 30,393 | | | | — | | | | 0.9 | % | | | 60 Days(j) | |
Trumbull Property Income Fund, LP | | | 4/1/2016 | | | | 2,801 | | | | 34,447 | | | | 39,932 | | | | — | | | | 1.2 | % | | | 60 Days | |
US Government Building Open-End Feeder, LP | | | 5/1/2014 | | | | — | (k) | | | 51,887 | | | | 72,180 | | | | — | | | | 2.2 | % | | | 60 Days | |
20
VERSUS CAPITAL MULTI-MANAGER REAL ESTATE INCOME FUND LLC
Notes to Financial Statements
March 31, 2022 (continued)
| | | | | | | | | | | | | | | | | | | | | | | | | | | | | | | | | | | |
Security(a) | | Acquisition
Date(b) | | Shares/Par | | Cost
($1,000s) | | Value
($1,000s) | | Unfunded
Commitments
($1,000)(c) | | % of
Net
Assets | | Redemption
Notice(d) |
USGBF Alpha Feeder LP | | | | 10/1/2021 | | | | | — | (l) | | | $ | 15,037 | | | | $ | 18,522 | | | | $ | 15,000 | | | | | 0.6 | % | | | | 60 Days(m) | |
Walton Street Real Estate Core-Plus Fund, LP. | | | | 9/29/2021 | | | | | 54,495 | | | | | 60,771 | | | | | 72,508 | | | | | 14,045 | | | | | 2.3 | % | | | | 45 Days(h) | |
| | | | | | | | | | | | | | | | | | | | | | | | | | | | | | | | | | | |
Total | | | | | | | | | | | | | $ | 2,012,003 | | | | $ | 2,479,725 | | | | $ | 390,980 | | | | | 77.2 | % | | | | | |
| | | | | | | | | | | | | | | | | | | | | | | | | | | | | | | | | | | |
| (a) | The investment funds are open-ended Investment Funds organized to serve as a collective investment vehicle through which eligible investors may invest in a professionally managed real estate portfolio of equity and debt investments consisting of multi-family, industrial, retail and office properties in targeted metropolitan areas. The principal investment objective of the Investment Funds is to generate attractive, predictable investment returns from a target portfolio of low-risk equity investments in income-producing real estate while maximizing the total return to shareholders through cash dividends and appreciation in the value of shares. |
| (b) | Represents initial acquisition date as shares are purchased at various dates through the current period. |
| (c) | Unfunded Commitments approximate their fair values. |
| (d) | The investment funds provide for a quarterly redemption subject to the notice period listed. |
| (e) | The Fund submitted a partial redemption request prior to period end, but will maintain market exposure to the investment through a future date. The Investment Manager expects to meet all redemptions over time. |
| (f) | Partnership is not designated in units. The Fund owns approximately 28.4% at March 31, 2022. |
| (g) | The Fund submitted a full redemption request prior to period end, but will maintain market exposure to the investment through a future date. The Investment Manager expects to meet all redemptions over time. |
| (h) | 3 year lockup from initial purchase. |
| (i) | Partnership is not designated in units. The Fund owns approximately 15.9% at March 31, 2022. |
| (j) | The Fund submitted a full redemption request prior to period end, but will maintain market exposure to the investment through a future date. The Investment Manager expects to meet all redemptions over time. |
| (k) | Partnership is not designated in units. The Fund owns approximately 2.7% at March 31, 2022. |
| (l) | Partnership is not designated in units. The Fund owns approximately 32.3% of this Fund. |
| (m) | Each capital contribution is subject to a two year lockup. |
NOTE 10. AFFILIATED ISSUERS
The following table lists each issuer owned by the Fund that may be deemed an “affiliated company” under the 1940 Act, as well as transactions that occurred in the security of such issuer during the year ended March 31, 2022:
| | | | | | | | | | | | | | | | | | | | | | | | | | | | | | | | | | | | | | | | |
Affiliated Investment | | Value
at
03/31/21 | | Purchases | | Income
Distributions | | Sales | | Realized
Gain/Loss | | Change
in
App/Dep | | Value
at
03/31/2022 | | Shares
Held at
03/31/2022 |
| | | | | | | | |
AEW Value Investors US LP | | | | $28,088,644 | | | | | $47,782,258 | | | | | $1,534,829 | | | | | $— | | | | | $— | | | | | $24,716,542 | | | | | $100,587,444 | | | — | |
NOTE 11. RECENT ACCOUNTING PRONOUNCEMENTS
In March 2020, the Financial Accounting Standards Board issued Accounting Standards Update 2020-04, Reference Rate Reform (Topic 848) – Facilitation of the Effects of Reference Rate Reform on Financial Reporting (the “ASU”), which provides optional, temporary relief with respect to the financial reporting of contracts subject to certain types of modifications due to the planned discontinuation of the London Interbank Offered Rate (LIBOR) and other interbank-offered based reference rates as of the end of 2021. The guidance is effective for certain reference rate-related contract modifications that occur during the period March 12, 2020 through December 31, 2022. The Adviser doesn’t believe there will be a material impact to the financial statements as a result of the ASU.
In December 2020, the SEC adopted a final rule (Rule 2a-5) under the 1940 Act addressing fair valuation of fund investments. The new rule sets forth requirements for good faith determinations of fair value as well as for the performance of fair value determinations, including related oversight and reporting obligations. The new rule also defines “readily available market quotations” for purposes of the definition of “value” under the Act, and the SEC noted that this definition would apply in all contexts under the Act. The effective date for the rule is March 8, 2021. The SEC adopted an eighteen-month transition period beginning from the effective date for the new rule. The Adviser is currently evaluating the impact, if any, on the financial statements.
21
VERSUS CAPITAL MULTI-MANAGER REAL ESTATE INCOME FUND LLC
Notes to Financial Statements
March 31, 2022 (continued)
NOTE 12. SUBSEQUENT EVENTS
The Fund offered to repurchase 8% of its outstanding shares, representing 8,301,690 shares, with respect to its April 22, 2022 Repurchase Offer. Shareholders actually tendered 3,481,134 total shares for repurchase. The Fund repurchased 100% of total tendered shares, representing approximately $108,889,878.
Management has evaluated the impact of all subsequent events on the Fund through the date the financial statements were issued and determined that there are no additional subsequent events to report.
22
VERSUS CAPITAL MULTI-MANAGER REAL ESTATE INCOME FUND LLC
Additional Information (Unaudited)
SECURITY PROXY VOTING
The Fund’s policy is to vote its proxies in accordance with the recommendations of management. A description of the policies and procedures that the Fund uses to determine how to vote proxies relating to portfolio securities is available without charge upon request by calling (866) 280-1952 and on the SEC’s website at http://www.sec.gov.
PORTFOLIO HOLDINGS
The Fund files its complete schedule of portfolio holdings with the SEC for the first and third quarters of each fiscal year on Form N-PORT, which has replaced Form N-Q, within 60 days after the end of the period. Copies of the Fund’s Forms N-PORT are available without a charge, upon request, by contacting the Fund at (866) 459-2772 and on the SEC’s website at http://www.sec.gov.
DIVIDEND REINVESTMENT PLAN
All distributions paid by the Fund will be reinvested in additional Shares of the Fund unless a shareholder “opts out” (elects not to reinvest in Shares), pursuant to the Fund’s Dividend Reinvestment Policy. A shareholder may elect initially not to reinvest by indicating that choice on a shareholder certification. Thereafter, a shareholder is free to change his, her or its election on a quarterly basis by contacting BNY Mellon (or, alternatively, by contacting the Selling Agent that sold such shareholder his, her or its Shares, who will inform the Fund). Shares purchased by reinvestment will be issued at their NAV on the ex-dividend date. There is no Sales Load or other charge for reinvestment. The Fund reserves the right to suspend or limit at any time the ability of shareholders to reinvest distributions. The automatic reinvestment of dividends and capital gain distributions does not relieve participants of any U.S. federal income tax that may be payable (or required to be withheld) on such distributions.
23
VERSUS CAPITAL MULTI-MANAGER REAL ESTATE INCOME FUND LLC
Additional Information (Unaudited)
DIRECTORS AND OFFICERS
The Board has overall responsibility to manage and control the business affairs of the Fund, including the complete and exclusive authority to oversee and to establish policies regarding the management, conduct and operation of the Fund’s business. The Board exercises the same powers, authority and responsibilities on behalf of the Fund as are customarily exercised by the board of directors of a registered investment company organized as a corporation. Information pertaining to the Board is set forth below.
| | | | | | | | | | |
Name, Address, and Year of Birth(1)
| | Position(s) Held with Fund | | Term of
Office
and
Length of
Time
Served (2) | | Principal Occupation(s) During Past 5 Years | | Number of
Portfolios in
Fund
Complex(3)
Overseen by
Director | | Other Public Company
Directorships
Held
by Director |
| Independent Directors (4) |
Robert F. Doherty; 1964 | | Independent Director | | Since
March 2019 | | Chief Financial Officer of Sustainable Living Partners (2018 - present); Partner of Renova Capital Partners (2010 - present); Chief Financial Officer of Ensyn Corporation (2013-2018). | | 2 | | 0 |
Jeffry A. Jones; 1959 | | Independent Director | | Since inception | | Principal of SmithJones, (Real Estate) (2008 to present). | | 2 | | 0 |
Richard J. McCready; 1958 | | Lead Independent Director | | Lead Independent Director (March 2020 - present); Independent Director since inception | | President of The Davis Companies (2014 - present). | | 2 | | 0 |
Paul E. Sveen; 1961 | | Independent Director | | Since inception | | Chief Financial Officer of Beam Technologies (February 2020 - present); Chief Financial Officer of Paypal’s merchant lending platform (2018 - 2020); Chief Financial Officer of Swift Financial (2016 - 2018); Managing Partner of Pantelan Real Estate Services LLC (2013 - 2016). | | 2 | | 0 |
| Interested Directors (5) |
Casey Frazier; 1977 | | Director; Chief Investment Officer | | Since inception | | Chief Investment Officer of the Adviser (2011 - present); Chief Investment Officer of Versus Capital Real Assets Fund LLC 2017 to present). | | 2 | | 0 |
William R. Fuhs, Jr.; 1968 | | Chairman of the Board; President | | Since inception | | President of the Adviser (2010 - present); President of Versus Capital Real Assets Fund (2017 - present); Chief Financial Officer of the Adviser (2010 - 2016). | | 2 | | 0 |
24
VERSUS CAPITAL MULTI-MANAGER REAL ESTATE INCOME FUND LLC
Additional Information (Unaudited)
| | | | | | | | | | |
Name, Address, and Year of Birth(1)
| | Position(s) Held with Fund | | Term of
Office
and
Length of
Time
Served (2) | | Principal Occupation(s) During Past 5 Years | | Number of
Portfolios in
Fund
Complex(3)
Overseen by
Director | | Other Public Company
Directorships
Held
by Director |
Mark D. Quam; 1970 | | Director; Chief Executive Officer | | Since March 2019 | | Chief Executive Officer of the Adviser (2010 - present); Chief Executive Officer of Versus Capital Real Assets Fund LLC (2017 - present). | | 2 | | 0 |
(1) The address of each member of the Board is: c/o Versus Capital Multi-Manager Real Estate Income Fund LLC, 5050 S. Syracuse Street, Suite 1100, Denver, Colorado 80237.
(2) Each Director will serve for the duration of the Fund, or until his death, resignation, termination, removal or retirement.
(3) The term “Fund Complex” as used herein includes the Fund and Versus Capital Real Assets Fund LLC.
(4) “Independent Directors” means members of the Board who are not “interested persons” of the Fund, the Adviser, the Securities Sub-Advisers, the Distributor, or any affiliate of the Fund, the Adviser, the Securities Sub-Advisers or the Distributor, as defined by the Investment Company Act (the “Independent Directors”).
(5) “Interested Directors” means members of the Board who are “interested person,” as defined in the Investment Company Act, because of such person’s affiliation with the Fund (the “Interested Directors”).
Additional information about the Directors is available in the Fund’s Statement of Additional information.
25
VERSUS CAPITAL MULTI-MANAGER REAL ESTATE INCOME FUND LLC
Additional Information (Unaudited)
OFFICERS
The address, year of birth, and a description of principal occupations during the past five years are listed below for each officer of the Fund.
| | | | | | |
Name, Address and Year of
Birth(1) | | Position(s) Held with Fund | | Term of Office and Length of Time Served(2) | | Principal Occupation(s) During Past 5 Years |
| | | | |
Mark D. Quam; 1970 | | Chief Executive Officer | | Since inception | | Chief Executive Officer of the Adviser (2010 to present); Chief Executive Officer of Versus Capital Real Assets fund LLC (2017 to present). |
| | | | |
William R. Fuhs, Jr.; 1968 | | President | | Since inception | | President of the Adviser (2010 to present); Chief Financial Officer of the Adviser (2010 to 2016); President of Versus Capital Real Assets Fund (2017 to present). |
| | | | |
Casey Frazier; 1977 | | Chief Investment Officer | | Since inception | | Chief Investment Officer of the Adviser (2011 to present); Chief Investment Officer of Versus Capital Real Assets Fund LLC (2017 to present). |
| | | | |
Dave Truex; 1983 | | Deputy Chief Investment Officer | | Since November 2021 | | Deputy Chief Investment Officer of Versus Capital Real Estate Assets Fund LLC (November 2021 to Present); Deputy Chief Investment Officer of the Adviser (2017 to Present); Portfolio Manager for Colorado’s Public Employees Retirement Association (2013 to 2017). |
| | | | |
Brian Petersen; 1970 | | Chief Financial Officer, Treasurer | | Since August 2019 | | Chief Financial Officer and Chief Operating Officer of the Adviser (January 2022 to present); Managing Director, Fund Financial Operations of the Adviser (July 2019 to December 2021); Chief Financial Officer and Treasurer of Versus Capital Real Assets Fund LLC, (August 2019 to present); Senior Vice President of OFI Global Asset Management, Inc. (January 2017 to May 2019); Vice President of OFI Global Asset Management, Inc. (2007-2017). |
| | | | |
Dustin C. Rose; 1983 | | Assistant Treasurer | | Since November 2021 | | Assistant Treasurer of Versus Capital Real Estate Assets Fund LLC (November 2021 to Present); Director of Fund Financial Operations of the Adviser (2020 to present); Assistant Vice President of OFI Global Asset Management, Inc. (2016 to 2020). |
| | | | |
Steve Andersen; 1976 | | Chief Compliance Officer and Secretary | | Since October 2018 | | Chief Risk Officer of the Adviser (February 2022 to present); Chief Compliance Officer of the Adviser, the Fund, and Versus Capital Real Assets Fund LLC (October 2018 - present); Secretary of the Fund and Versus Capital Real Assets Fund LLC (December 2018 - present); Chief Operating Officer of the Adviser (October 2018 to January 2022); Vice President of Compliance at Janus Henderson Investors (August 2017 to August 2018); Assistant Vice President of Compliance at Janus Capital Group (January 2016 to August 2017); Senior Compliance Manager at Janus Capital Group (August 2011 to January 2016). |
26
VERSUS CAPITAL MULTI-MANAGER REAL ESTATE INCOME FUND LLC
Additional Information (Unaudited)
| | | | | | |
Name, Address and Year of
Birth(1) | | Position(s) Held with Fund | | Term of Office and Length of Time Served(2) | | Principal Occupation(s) During Past 5 Years |
| | | | |
Jill Varner; 1990 | | Assistant Secretary | | Since August 2020 | | Deputy Chief Compliance Officer of the Adviser (February 2022 to present);Assistant Secretary of Versus Capital Real Assets Fund LLC (August 2020 to present); Director of Compliance and Operations of the Adviser (August 2019 to February 2022); Compliance Manager at Janus Henderson Investors (January 2019 to July 2019); Senior Compliance Analyst at Janus Henderson Investors (June 2017 to December 2018); and Senior Compliance Associate at Coleman Research Group (July 2013 to May 2017). |
(1) The address of each officer of the Fund is: c/o Versus Capital Multi-Manager Real Estate Income Fund LLC, 5050 S. Syracuse Street, Suite 1100, Denver, Colorado 80237.
(2) Each officer will serve for the duration of the Fund, or until his or her death, resignation, termination, removal or retirement.
27
Item 2. Code of Ethics.
| | (a) | The registrant, as of the end of the period covered by this report, has adopted a code of ethics that applies to the registrant’s principal executive officer, principal financial officer, principal accounting officer or controller, or persons performing similar functions. |
| | (b) | No disclosures are required by this Item 2(b). |
| | (c) | There have been no amendments, during the period covered by this report, to a provision of the code of ethics that applies to the registrant’s principal executive officer, principal financial officer, principal accounting officer or controller, or persons performing similar functions. |
| | (d) | The registrant has not granted, during the period covered by this report any waivers, including an implicit waiver, from a provision of the code of ethics that applies to the registrant’s principal executive officer, principal financial officer, principal accounting officer or controller, or persons performing similar functions, regardless of whether these individuals are employed by the registrant or a third party, that relates to one or more of the items set forth in paragraph (b) of this item’s instructions. |
| | (f) | A copy of the registrant’s code of ethics that applies to the registrant’s principal executive officer, principal financial officer, principal accounting officer or controller, or persons performing similar functions, is available on its Internet website at: https://www.versuscapital.com/wp-content/uploads/Versus-Capital-Code-of-Ethics.pdf |
Item 3. Audit Committee Financial Expert.
(a)(1) The registrant’s board of directors has determined that the registrant has at least one audit committee financial expert serving on its audit committee.
(a)(2) The audit committee financial expert is Robert Doherty, who is “independent” for purposes of this Item 3 of Form N-CSR.
(a)(3) Not applicable.
Item 4. Principal Accountant Fees and Services.
Audit Fees
| | (a) | The aggregate fees billed for each of the last two fiscal years for professional services rendered by the principal accountant for the audit of the registrant’s annual financial statements or services that are normally provided by the accountant in connection with statutory and regulatory filings or engagements for those fiscal years were $61,372 for 2021 and $62,500 for 2022. |
Audit-Related Fees
| | (b) | The aggregate fees billed in each of the last two fiscal years for assurance and related services by the principal accountant that are reasonably related to the performance of the audit of the registrant’s financial statements and are not reported under paragraph (a) of this Item were $3,817 for 2021 and $3,908 for 2022. |
The nature of the services include the issuance of consents in conjunction with the registrant’s registration statement filings.
Tax Fees
| | (c) | The aggregate fees billed in each of the last two fiscal years for professional services rendered by the principal accountant for tax compliance, tax advice, and tax planning were $26,006 for 2021 and $29,856 for 2022. |
The nature of the services include the review of federal and state tax returns.
All Other Fees
| | (d) | The aggregate fees billed in each of the last two fiscal years for products and services provided by the principal accountant, other than the services reported in paragraphs (a) through (c) of this Item were $0 for 2021 and $0 for 2020. |
| | (e)(1) | Disclose the audit committee’s pre-approval policies and procedures described in paragraph (c)(7) of Rule 2-01 of Regulation S-X. |
The registrant’s Audit Committee has adopted an Audit Committee Charter that governs the Audit Committee’s pre-approval process. The Audit Committee Charter states that the Audit Committee may review and approve in advance any audit or non-audit engagement or relationship between the Fund and the independent auditors, other than “prohibited non-auditing services” (as defined in Section 201 of the Sarbanes-Oxley Act of 2002).
The Audit Committee may delegate to the Chairman of the Audit Committee the authority to pre-approve any audit or non-audit services to be provided by the independent auditors up to a maximum of $5,000 so long as it is presented to the full Audit Committee at its next regularly scheduled meeting.
| | (e)(2) | The percentage of services described in each of paragraphs (b) through (d) of this Item that were approved by the audit committee pursuant to paragraph (c)(7)(i)(C) of Rule 2-01 of Regulation S-X are as follows: |
| | (b) | | 0% for 2021 and 0% for 2022 |
| | (c) | | 0% for 2021 and 0% for 2022 |
| | (g) | There were no non-audit fees billed by the registrant’s accountant for services rendered to the registrant’s investment adviser (not including any sub-adviser whose role is primarily portfolio management and is subcontracted with or overseen by another investment adviser), and any entity controlling, controlled by, or under common control with the adviser that provides ongoing services to the registrant for each of the last two fiscal years. Aggregate non-audit fees billed by the registrant’s accountant for services rendered to the registrant, were $29,823 for fiscal 2021 and $33,764 for fiscal 2022. |
Item 5. Audit Committee of Listed Registrants.
Not applicable.
Item 6. Investments.
| (a) | Schedule of Investments in securities of unaffiliated issuers as of the close of the reporting period is included as part of the report to shareholders filed under Item 1(a) of this form. |
| Item 7. | Disclosure of Proxy Voting Policies and Procedures for Closed-End Management Investment Companies. |
PROXY VOTING POLICIES AND PROCEDURES
The Fund is a fund of funds that invests primarily in Investment Funds which have investors other than the Fund. The Fund may invest substantially all of its assets in non-voting securities of Investment Funds.
The Fund has delegated voting of proxies in respect of portfolio holdings to Versus Capital Advisors LLC (the “Adviser”), to vote the Fund’s proxies in accordance with the Adviser’s proxy voting guidelines and procedures. For assets sub-advised by other investment managers (“Sub-Advisers”), the Adviser has delegated its authority to vote proxies to those Sub-Advisers. Investment Funds typically do not submit matters to investors for vote; however, if an Investment Fund submits a matter to the Fund for vote (and the Fund holds voting interests in the Investment Fund), the Adviser will vote on the matter in a way that it believes is in the best interest of the Fund and in accordance with the following proxy voting guidelines (the “Voting Guidelines”):
• In voting proxies, the Adviser is guided by general fiduciary principles. The Adviser’s goal is to act prudently, solely in the best interest of the Fund.
• The Adviser attempts to consider all factors of its vote that could affect the value of the investment and will vote proxies in the manner that it believes will be consistent with efforts to maximize shareholder values.
• The Adviser, absent a particular reason to the contrary, generally will vote with management’s recommendations on routine matters. Other matters will be voted on a case-by-case basis.
The Adviser applies its Voting Guidelines in a manner designed to identify and address material conflicts that may arise between the Adviser’s interests and those of its clients before voting proxies on behalf of such clients. The Adviser relies on the following to seek to identify conflicts of interest with respect to proxy voting and assess their materiality:
• The Adviser’s employees are under an obligation (i) to be aware of the potential for conflicts of interest on the part of the Adviser with respect to voting proxies on behalf of client accounts both as a result of an employee’s personal relationships and due to special circumstances that may arise during the conduct of the Adviser’s business, and (ii) to bring conflicts of interest of which they become aware to the attention of certain designated persons.
• Such designated persons work with appropriate personnel of the Adviser to determine whether an identified conflict of interest is material. A conflict of interest will be considered material to the extent that it is determined that such conflict has the potential to influence the Adviser’s
decision-making in voting the proxy. All materiality determinations will be based on an assessment of the particular facts and circumstances. The Adviser shall maintain a written record of all materiality determinations.
• If it is determined that a conflict of interest is not material, the Adviser may vote proxies notwithstanding the existence of the conflict.
• If it is determined that a conflict of interest is material, the Adviser may seek legal assistance from appropriate counsel for the Adviser to determine a method to resolve such conflict of interest before voting proxies affected by the conflict of interest. Such methods may include:
| | • | | disclosing the conflict to the Board and obtaining the consent of the Board before voting; |
| | • | | engaging another party on behalf of the Fund to vote the proxy on its behalf; |
| | • | | engaging a third party to recommend a vote with respect to the proxy based on application of the policies set forth herein; or |
| | • | | such other method as is deemed appropriate under the circumstances given the nature of the conflict. |
The Adviser shall maintain a written record of the method used to resolve a material conflict of interest. Information regarding how the Adviser and the Sub-Advisers voted the Fund’s proxies related to the Fund’s portfolio holdings during the most recent 12-month period ended June 30th is available without charge, upon request, by calling 1-877-200-1878, and is available on the SEC’s website at http://www.sec.gov.
Principal Real Estate Investors
Proxy Voting and Class Action Monitoring
Rule 206(4)-6
Background
Rule 206(4)-6 under the Advisers Act requires every investment adviser who exercises voting authority with respect to client securities to adopt and implement written policies and procedures, reasonably designed to ensure that the adviser votes proxies in the best interest of its clients. The procedures must address material conflicts that may arise in connection with proxy voting. The Rule further requires the adviser to provide a concise summary of the adviser’s proxy voting process and offer to provide copies of the complete proxy voting policy and procedures to clients upon request. Lastly, the Rule requires that the adviser disclose to clients how they may obtain information on how the adviser voted their proxies.
Policy
The Advisers believe that proxy voting and the analysis of corporate governance issues, in general, are important elements of the portfolio management services provided to advisory clients. The Advisers’ guiding principles in performing proxy voting are to make decisions that (i) favor proposals that tend to maximize a company’s shareholder value and (ii) are not influenced by conflicts of interest. These
principles reflect the Advisers’ belief that sound corporate governance creates a framework within which a company can be managed in the interests of its shareholders.
In addition, as a fiduciary, the Advisers also monitor certain Clients’ ability to participate in class action events through the regular portfolio management process. Accordingly, the Advisers have adopted the policies and procedures set out below, which are designed to ensure that the Advisers comply with legal, fiduciary, and contractual obligations with respect to proxy voting and class actions.
Proxy Voting Procedures
The Advisers have implemented these procedures with the premise that portfolio management personnel base their determinations of whether to invest in a particular company on a variety of factors, and while corporate governance is one such factor, it may not be the primary consideration. As such, the principles and positions reflected in the procedures are designed to guide in the voting of proxies, and not necessarily in making investment decisions.
The Investment Accounting Department has assigned a Proxy Voting Team to manage the proxy voting process. The Investment Accounting Department has delegated the handling of class action activities to a Senior Investment Accounting Leader.
Institutional Shareholder Services
Based on the Advisers’ investment philosophy and approach to portfolio construction, and given the complexity of the issues that may be raised in connection with proxy votes, the Advisers have retained the services of Institutional Shareholder Services (“ISS”). ISS is a leading global provider of investment decision support tools.
ISS offers proxy voting solutions to institutional clients globally. The services provided to the Advisers include in-depth research, voting recommendations, vote execution, recordkeeping, and reporting.
The Advisers have elected to follow the ISS Standard Proxy Voting Guidelines (the “Guidelines”), which embody the positions and factors that the Advisers’ Portfolio Management Teams (“PM Teams”) generally consider important in casting proxy votes.1 The Guidelines address a wide variety of individual topics, including, among other matters, shareholder voting rights, anti-takeover defenses, board structures, the election of directors, executive and director compensation, reorganizations, mergers, and various shareholder proposals. In connection with each proxy vote, ISS prepares a written analysis and recommendation (“ISS Recommendation”) that reflects ISS’s application of the Guidelines to the particular proxy issues. ISS Proxy Voting Guidelines Summaries are accessible to all PM Teams on the ISS system. They are also available from the Proxy Voting Team.
Voting Against ISS Recommendations
On any particular proxy vote, Portfolio Managers may decide to diverge from the Guidelines. Where the Guidelines do not direct a particular response and instead list relevant factors, the ISS Recommendation will reflect ISS’s own evaluation of the factors.
| 1 | The Advisers have various Portfolio Manager Teams organized by asset classes and investment strategies. |
If the Portfolio Manager’s judgment differs from that of ISS, a written record is created reflecting the process (See Appendix titled “Report for Proxy Vote(s) Against the ISS Recommendation(s)”), including:
| | 1. | The requesting PM Team’s reasons for the decision; |
| | 2. | The approval of the lead Portfolio Manager for the requesting PM Team; |
| | 3. | Notification to the Proxy Voting Team and other appropriate personnel (including other Advisers Portfolio Managers who may own the particular security); |
| | 4. | A determination that the decision is not influenced by any conflict of interest; and review and approval by the Compliance Department. |
(In certain cases, Portfolio Managers may not be allowed to vote against ISS recommendations due to a perceived conflict of interest. For example, Portfolio Managers will vote with ISS recommendations in circumstances where PGI is an adviser to the PGI CITs and those CITs invest in Principal mutual funds.)
Conflicts of Interest
The Advisers have implemented procedures designed to prevent conflicts of interest from influencing proxy voting decisions. These procedures include our use of the Guidelines and ISS Recommendations. Proxy votes cast by the Advisers in accordance with the Guidelines and ISS Recommendations are generally not viewed as being the product of any conflicts of interest because the Advisers cast such votes pursuant to a pre-determined policy based upon the recommendations of an independent third party.
Our procedures also prohibit the influence of conflicts of interest where a PM Team decides to vote against an ISS Recommendation, as described above. In exceptional circumstances, the approval process may also include consultation with the Advisers’ senior management, the Law Department, Outside Counsel, and/or the Client whose account may be affected by the conflict. The Advisers maintain records of the resolution of any proxy voting conflict of interest.
Proxy Voting Instructions and New Accounts
Institutional Accounts
As part of the new account opening process for discretionary institutional Clients that require the Adviser to vote proxies, the Advisers’ Investment Accounting Department is responsible for sending a proxy letter to the Client’s custodian. This letter instructs the custodian to send the Client’s proxy materials to ISS for voting. The custodian must complete the letter and provide it to ISS, with a copy to the Advisers’ Investment Accounting Department. This process is designed to ensure and document that the custodian is aware of its responsibility to send proxies to ISS.
The Investment Accounting Department is responsible for maintaining this proxy instruction letter in the Client’s file and for scanning it into the Advisers’ OnBase system. These steps are part of the Advisers’ Account Opening Process.
SMA - Wrap Accounts
The Advisers’ SMA Operations Department is responsible for servicing wrap accounts, which includes providing instructions to the relevant wrap sponsor for setting up accounts with ISS.
Fixed Income and Private Investments
Voting decisions with respect to Client investments in fixed income securities and the securities of privately-held issuers will generally be made by the relevant Portfolio Managers based on their assessment of the particular transactions or other matters at issue.
Client Direction
Clients may choose to vote proxies themselves, in which case they must arrange for their custodians to send proxy materials directly to them. Clients may provide specific vote instructions for their own ballots. Upon request, the Advisers may be able to accommodate individual Clients that have developed their own guidelines. Clients may also discuss with the Advisers the possibility of receiving individualized reports or other individualized services regarding proxy voting conducted on their behalf. Such requests should be centralized through the Advisers’ Proxy Voting Team.
Securities Lending
At times, neither the Advisers nor ISS will be allowed to vote proxies on behalf of Clients when those Clients have adopted a securities lending program. Typically, Clients who have adopted securities lending programs have made a general determination that the lending program provides a greater economic benefit than retaining the ability to vote proxies. Notwithstanding this fact, in the event that a proxy voting matter has the potential to materially enhance the economic value of the Client’s position and that position is lent out, the Advisers will make reasonable efforts to inform the Client that neither the Advisers nor ISS is able to vote the proxy until the lent security is recalled.
Abstaining from Voting Certain Proxies
The Advisers shall at no time ignore or neglect their proxy voting responsibilities. However, there may be times when refraining from voting is in the Client’s best interest, such as when the Advisers’ analysis of a particular proxy issue reveals that the cost of voting the proxy may exceed the expected benefit to the Client. Such proxies may be voted on a best-efforts basis. These issues may include, but are not limited to:
| | • | | Restrictions for share blocking countries;2 |
| | • | | Casting a vote on a foreign security may require that the adviser engage a translator; |
| | • | | Restrictions on foreigners’ ability to exercise votes; |
| | • | | Requirements to vote proxies in person; |
| | • | | Requirements to provide local agents with power of attorney to facilitate the voting instructions; |
| | • | | Untimely notice of shareholder meeting; |
| | • | | Restrictions on the sale of securities for a period of time in proximity to the shareholder meeting. |
2 In certain markets where share blocking occurs, shares must be “frozen” for trading purposes at the custodian or sub-custodian in order to vote. During the time that shares are blocked, any pending trades will not settle. Depending on the market, this period can last from one day to three weeks. Any sales that must be executed will settle late and potentially be subject to interest charges or other punitive fees.
Proxy Solicitation
Employees should inform the Advisers’ Proxy Voting Team of the receipt of any solicitation from any person related to Clients’ proxies. As a matter of practice, the Advisers do not reveal or disclose to any third party how the Advisers may have voted (or intend to vote) on a particular proxy until after such proxies have been counted at a shareholder’s meeting. However, the Proxy Voting Team may disclose that it is the Advisers’ general policy to follow the ISS Guidelines. At no time may any Employee accept any remuneration in the solicitation of proxies.
Handling of Information Requests Regarding Proxies
Employees may be contacted by various entities that request or provide information related to particular proxy issues. Specifically, investor relations, proxy solicitation, and corporate/financial communications firms (e.g., Ipreo, DF King, Georgeson Shareholder) may contact the Advisers to ask questions regarding total holdings of a particular stock across advisory Clients, or how the Advisers intends to vote on a particular proxy. In addition, issuers may call (or hire third parties to call) with intentions to influence the Advisers’ votes (i.e., to vote against ISS).
Employees that receive information requests related to proxy votes should forward such communications (e.g., calls, e-mails, etc.) to the Advisers’ Proxy Voting Team. The Proxy Voting Team will take steps to verify the identity of the caller and his/her firm prior to exchanging any information. In addition, the Proxy Voting Team may consult with the appropriate Portfolio Manager(s) and/or the CCO with respect to the type of information that can be disclosed. Certain information may have to be provided pursuant to foreign legal requirements (e.g., Section 793 of the UK Companies Act).
External Managers
Where Client assets are placed with managers outside of the Advisers, whether through separate accounts, funds- of-funds or other structures, such external managers are responsible for voting proxies in accordance with the managers’ own policies. The Advisers may, however, retain such responsibilities where deemed appropriate.
Proxy Voting Errors
In the event that any Employee becomes aware of an error related to proxy voting, he/she must promptly report that matter to the Advisers’ Proxy Voting Team. The Proxy Voting Team will take immediate steps to determine whether the impact of the error is material and to address the matter. The Proxy Voting Team, with the assistance of the CCO (or designee), will generally prepare a memo describing the analysis and the resolution of the matter. Supporting documentation (e.g., correspondence with ISS, Client, Portfolio Managers/ analysts, etc.) will be maintained by the Compliance Department. Depending on the severity of the issue, the Law Department, Outside Counsel, and/or affected Clients may be contacted. However, the Advisers may opt to refrain from notifying nonmaterial de minimis errors to Clients.
Recordkeeping
The Advisers must maintain the documentation described in the following section for a period of not less than five (5) years, the first two (2) years at the principal place of business. The Proxy Voting Team, in
coordination with ISS, is responsible for the following procedures and for ensuring that the required documentation is retained.
Client request to review proxy votes:
| | • | | Any request, whether written (including e-mail) or oral, received by any Employee of the Advisers, must be promptly reported to the Proxy Voting Team. All written requests must be retained in the Client’s permanent file. |
| | • | | The Proxy Voting Team records the identity of the Client, the date of the request, and the disposition (e.g., provided a written or oral response to Client’s request, referred to third party, not a proxy voting client, other dispositions, etc.) in a suitable place. |
| | • | | The Proxy Voting Team furnishes the information requested to the Client within a reasonable time period (generally within 10 business days). The Advisers maintain a copy of the written record provided in response to Client’s written (including e-mail) or oral request. A copy of the written response should be attached and maintained with the Client’s written request, if applicable and maintained in the permanent file. |
| | • | | Clients are permitted to request the proxy voting record for the 5-year period prior to their request. |
Proxy statements received regarding client securities:
| | • | | Upon inadvertent receipt of a proxy, the Advisers forward the proxy to ISS for voting, unless the client has instructed otherwise. |
Note: The Advisers are permitted to rely on proxy statements filed on the SEC’s EDGAR system instead of keeping their own copies.
Proxy voting records:
| | • | | The Advisers’ proxy voting record is maintained by ISS. The Proxy Voting Team, with the assistance of the Investment Accounting and SMA Operations Departments, periodically ensures that ISS has complete, accurate, and current records of Clients who have instructed the Advisers to vote proxies on their behalf. |
| | • | | The Advisers maintain documentation to support the decision to vote against the ISS recommendation. |
| | • | | The Advisers maintain documentation or any communications received from third parties, other industry analysts, third party service providers, company’s management discussions, etc. that were material in the basis for any voting decision. |
Procedures for Class Actions
In general, it is the Advisers’ policy not to file class action claims on behalf of Clients. The Advisers specifically do not act on behalf of former Clients who may have owned the affected security but subsequently terminated their relationship with the Advisers. The Advisers only file class actions on behalf of Clients if that responsibility is specifically stated in the advisory contract, as it is the Advisers’ general policy not to act as lead plaintiff in class actions.
The process of filing class action claims is carried out by the Investment Accounting Department. In the event the Advisers opt out of a class action settlement, the Advisers will maintain documentation of any cost/benefit analysis to support that decision.
The Advisers are mindful that they have a duty to avoid and detect conflicts of interest that may arise in the class action claim process. Where actual, potential or apparent conflicts are identified regarding any material matter, the Advisers manage the conflict by seeking instruction from the Law Department and/or outside counsel.
Disclosure
The Advisers ensure that Part 2A of Form ADV is updated as necessary to reflect: (i) all material changes to this policy; and (ii) regulatory requirements.
Responsibility
Various individuals and departments are responsible for carrying out the Advisers’ proxy voting and class action practices, as mentioned throughout these policies and procedures. The Investment Accounting Department has assigned a Proxy Voting Team to manage the proxy voting process. The Investment Accounting Department has delegated the handling of class action activities to a Senior Investment Accounting Leader.
In general, the Advisers’ CCO (or designee) oversees the decisions related to proxy voting, class actions, conflicts of interest, and applicable record keeping and disclosures. In addition, the Compliance Department periodically reviews the voting of proxies to ensure that all such votes - particularly those diverging from the judgment of ISS - were voted in a manner consistent with the Advisers’ fiduciary duties.
Security Capital Research & Management Incorporated (“SC-R&M”) Compliance Policy
Regulatory Category: Proxy Voting
Overview:
| Ø | Advisers are fiduciaries and must act in the best interest of the client with respect to functions undertaken on behalf of the client, including proxy voting activities. |
| Ø | Advisers must have written policies and procedures regarding how proxies are voted. The policies and procedures must include procedures intended to prevent material conflicts of interest from affecting the manner in which proxies are voted. |
| Ø | SC-R&M has adopted written policies and procedures that address how proxies are voted and how this information can be obtained by clients. |
Applicable Regulation:
| Ø | Investment Advisers Act of 1940: Rule 206(4)-6 |
Summary of Regulatory Requirements:
| 1. | An adviser must adopt and implement written policies and procedures reasonably designed to ensure that: |
| | a. | proxies are voted in the best interest of the client; |
| | b. | conflicts are identified and handled appropriately; and |
| | c. | fiduciary obligations are fulfilled. |
| 2. | An adviser must disclose to its clients how they may obtain information on how proxies were voted for securities held for their accounts. |
| 3. | An adviser must disclose to clients information about its proxy voting policies and procedures and how clients may obtain the policies and procedures. |
Activities Conducted by SC-R&M to Satisfy Regulatory Requirements:
| | 1. | SC-R&M seeks to have each investment management agreement set forth whether SC-R&M or the client is responsible for voting proxies. If SC-R&M is responsible, it is SC-R&M’s obligation to vote proxies in the best interests of the client and in accordance with SC-R&M’s Proxy Voting Procedures and Guidelines. |
| | 2. | Investment personnel are principally responsible for determining how to vote individual proxies in accordance with the SC-R&M Proxy Voting Procedures and Guidelines. |
| | 3. | It is SC-R&M’s policy to vote all proxies received on securities held in portfolios, over which SC-R&M has discretionary management and proxy voting authority, unless SC-R&M determines that it should not vote the security in accordance with SEC or other applicable regulatory guidance. These instances include but are not limited to: (a) if the security is on loan and the negative consequences to the client of recalling the loaned securities outweighs the benefits of voting in the particular instance; and (b) if the proxy involves foreign securities and the expense and administrative inconvenience or other costs outweigh the benefits to the clients of voting the securities. |
| | 4. | To assist SC-R&M’s investment personnel with proxy voting proposals, SC-R&M has retained the services of independent proxy voting vendors. The vendors may assist with such items as: (a) coordinating with client custodians to ensure that all proxy materials are processed in a timely fashion; (b) voting all proposals that are clearly covered in the SC-R&M Proxy Voting Procedures and Guidelines; (c) providing SC-R&M with a comprehensive analysis of each proxy proposal; and (d) providing SC-R&M with recommendations on how to vote each proxy proposal based on the SC-R&M Proxy Voting Procedures and Guidelines. |
| | 5. | To oversee and monitor the proxy voting process on an on-going basis, SC-R&M has established a Proxy Committee that meets annually or more frequently as circumstances dictate. The Proxy Committee is comprised of the Proxy Administrator and senior officers from the Investment, Legal, Compliance, Operations and Risk Management Departments. |
| | 6. | The primary functions of the Proxy Committee are: to periodically review general proxy voting matters, to review and approve the SC-R&M Proxy Voting Procedures and Guidelines annually, and to provide advice and recommendations on general proxy voting matters, as well as on specific voting issues to be implemented. The Proxy Committee will also oversee any third party vendors to which it has delegated proxy voting responsibilities and the level of services they provide, as well as determining the that there are no conflicts of interest that would prevent the vendor from providing such services prior to delegating proxy responsibilities. The JPMC Third Party Oversight group supports the Proxy Committee in its oversight of vendors. |
| | 7. | SC-R&M has established the role of a Proxy Administrator to oversee the proxy voting process. The Proxy Administrator is charged with: |
| | ○ | | evaluating the quality of services provided by the third party proxy vendor, if retained; |
| | ○ | | escalating proposals identified by the third party proxy vendor as non-routine, but for which a Guideline exists, to the attention of the appropriate investment professionals and confirming the third party proxy vendor’s recommendation with the appropriate SC-R&M investment professional; |
| | ○ | | escalating proposals identified by the third party proxy vendor as not being covered by the Guidelines, to the appropriate investment professional and obtaining a recommendation with respect thereto; |
| | ○ | | reviewing recommendations of SC-R&M investment professionals with respect to proposals not covered by the Guidelines or to override the Guidelines; |
| | ○ | | referring investment considerations regarding overrides to the Proxy Committee, if necessary; |
| | ○ | | determining, in the case of overrides, whether a material conflict exists; |
| | ○ | | escalating material conflicts to the Proxy Committee; and maintaining the required records. The Proxy Administrator utilizes an automated system to communicate, track and store the relevant data regarding the proxy voting process. |
| | 8. | Investment personnel analyze issues to determine if any conflict regarding proxy voting exists, and if any material conflict is identified, the matter is referred to the Proxy Administrator or its designee. |
| | 9. | Generally, when a material conflict of interest is identified by the Proxy Administrator or investment professional responsible for the particular proxy vote, a third party proxy voting vendor will be directed to vote the proxy in accordance with the SC-R&M Proxy Voting Procedures and Guidelines or by using its own guidelines. In addition, it is the responsibility of the Proxy Administrator to raise the matter to Legal and Compliance, where appropriate, and to the Proxy Committee, to review the conflict of interest votes. Examples of such material conflicts of interest that could arise include circumstances in which: (i) management of a SC-R&M client or prospective client, distributor or |
| | prospective distributor of its investment management products, or critical vendor, is soliciting proxies and failure to vote in favor of management may harm SC-R&M’s relationship with such company and materially impact SC-R&M’s business; or (ii) a personal relationship between a SC-R&M officer and the management of a company or other proponent of a proxy proposal could impact SC-R&M’s voting decision. |
| | 10. | An investment professional may override the recommendation of the proxy service and/or the SC-R&M policy position in situations in which no conflict of interest has been identified. If so, certification by the investment professional is required and must include: a written analysis supporting their recommendation, confirmation that the Information Safeguarding and Barriers Policy was not violated, and a statement that they are not aware of any personal or other relationship that could present an actual or potential conflict of interest. |
| | 11. | SC-R&M Operations, along with the Compliance Department, verifies that SC-R&M’s ADV contains appropriate client disclosure on how to obtain the SC-R&M Proxy Voting Procedures and Guidelines and voting records. |
| | 12. | SC-R&M clients can obtain voting records for their portfolio(s) as well as a copy of the SC-R&M Proxy Voting Procedures and Guidelines by contacting their Client Account Manager. |
| | 13. | SC-R&M maintains all proxy voting records in an easily accessible place for seven (7) years, with the first two years at an on-site location. |
Areas of Responsibility
| Ø | Third Party Oversight Group |
Applicable Policies
| Ø | Information Safeguarding and Barriers Policy – Firmwide |
| Ø | SC-R&M Conflicts of Interest, including Safeguarding of Inside Information Policy |
| Ø | SC-R&M Proxy Voting Procedures and Guidelines |
| Ø | SC-R&M Compliance with Securities Position Regulations Policy |
Updated: April 2022
Item 8. Portfolio Managers of Closed-End Management Investment Companies.
(a)(1) Identification of Portfolio Manager(s) or Management Team Members and Description of Role of Portfolio Manager(s) or Management Team Members
As of March 31, 2022, the following individuals have primary responsibility for the day-to-day implementation of the registrant’s investment strategy (the “Portfolio Managers”):
Versus Capital Advisors LLC
The management of the Fund’s investment portfolio will be the responsibility of the Adviser and the Adviser’s Investment Committee:
| | | | | | |
| Name | | Title | | Since | | Recent Experience |
| Casey Frazier, CFA | | Chief Investment Officer | | Inception | | Chief Investment Officer of Versus Capital Advisors. Mr. Frazier is the Chairman of the Versus Investment Committee. He has served as the CIO since joining the Adviser in 2011. |
| Bill Fuhs | | President | | Inception | | President of Versus Capital Advisors. Mr. Fuhs is a member of the Versus Investment Committee. He has served as the President since joining the Adviser in 2010. |
| Dave Truex, CFA | | Deputy
Chief
Investment
Officer | | August 2017 | | Deputy Chief Investment Officer of Versus Capital Advisors. Mr. Truex is a member of the Versus Investment Committee. He has served as the Deputy CIO since joining the Adviser in 2017. Prior to joining the Adviser, Mr. Truex was a Portfolio Manager for Colorado’s Public Employees Retirement Association. |
Sub-Advisers
Principal Real Estate Investors
The Adviser has engaged Principal Real Estate Investors, LLC (“PrinREI”) a registered adviser under the Advisers Act, to act as an independent sub-adviser to the Fund. The key decision makers for the portion of the Fund’s portfolio managed by PrinREI include:
| | | | | | |
| Name | | Title | | Since | | Recent Experience |
| Kelly Rush | | Chief Investment Officer | | 1987 | | Mr. Rush is the CIO and a Global Portfolio Manager for PrinREI. Mr. Rush has been with the firm since 1987. |
| Anthony Kenkel | | Portfolio Manager | | 2001 | | Mr. Kenkel is a Global Portfolio Manager for PrinREI. Mr. Kenkel has been with the firm since 2001. |
| Simon Hedger | | Portfolio Manager | | 2003 | | Mr. Hedger is a Global Portfolio Manager for PrinREI. Mr. Hedger has been with the firm since 2003. |
| Marc Peterson | | Portfolio Manager | | 1992 | | Mr. Peterson is the CIO-CMBS for PrinREI. Mr. Peterson has been with the firm since 1992. |
| Scott Carson | | Portfolio Manager | | 2003 | | Mr. Carson is a Global Portfolio Manager for PrinREI. Mr. Carson has been with the firm since 2003 |
Security Capital Research & Management
The Adviser has engaged Security Capital Research & Management Incorporated (“Security Capital”) a registered adviser under the Advisers Act, to act as an independent sub-adviser to the Fund. The key decision makers for the portion of the Fund’s portfolio managed by Security Capital include:
| | | | | | |
| Name | | Title | | Since | | Recent Experience |
| Anthony Manno | | CEO & CIO | | 1994 | | Mr. Manno is the CEO and CIO of Security Capital. Mr. Manno has been with the firm since 1994. |
| Ken Statz | | Chief Market Strategist | | 1995 | | Mr. Statz is the Chief Market Strategist of Security Capital. Mr. Statz has been with the firm since 1995. |
| | | | | | |
| Kevin Bedell | | Head of Investment Research | | 1996 | | Mr. Bedell is the Head of Investment Research of Security Capital. Mr. Bedell has been with the firm since 1996. |
| Nathan J. Gear | | Executive Director | | 2006 | | Mr. Gear is senior member of the Investment Research Team, he leads the fundamental analysis and pricing of REIT fixed income senior securities. |
| (a)(2) | Other Accounts Managed by Portfolio Manager(s) or Management Team Member and Potential Conflicts of Interest |
As of March 31, 2022, the Portfolio Managers listed above are also responsible for the day-to-day management of the following (not including the registrant):
Versus Capital Advisors LLC
| | | | | | | | | | | | | | |
| Portfolio Manager | | Other Registered
Investment Companies | | | Other Pooled Investment
Vehicles | | Other Accounts |
| | Number | | Total Assets
of Other
Registered
Investment
Companies | | | Number | | Total Assets | | Number | | Total Assets
of Other
Accounts |
Casey Frazier, CFA | | 1 | | | $2.66 billion | | | 4 | | $1.5 million | | 0 | | N/A |
William Fuhs | | 1 | | | $2.66 billion | | | 4 | | $1.5 million | | 0 | | N/A |
Dave Truex, CFA | | 1 | | | $2.66 billion | | | 4 | | $1.5 million | | 0 | | N/A |
Performance Fee Based Accounts (The number of accounts and the total assets in the accounts managed by each portfolio manager with respect to which the
advisory fee is based on the performance of the account) |
Casey Frazier, CFA | | 0 | | | N/A | | | 0 | | N/A | | 0 | | N/A |
William Fuhs | | 0 | | | N/A | | | 0 | | N/A | | 0 | | N/A |
Dave Truex, CFA | | 0 | | | N/A | | | 0 | | N/A | | 0 | | N/A |
Conflicts of Interest
In addition to the Fund, the Adviser provides investment advisory services to the Versus Capital Real Assets Fund LLC, a continuously offered registered closed-end management investment company that has elected to be treated as an interval fund, as well as four charitable pooled income funds, as defined under section 642(c)(5) of the Internal Revenue Code of 1986, as amended (the “Code”) (collectively with the Fund, “Client Accounts”). Because there are different fee structures for each Client Account and because the Adviser’s portfolio managers may have investments in one Client Account but not another (or they may invest different amounts in each Client Account), the Adviser’s portfolio managers may have an incentive to dedicate more time and resources or to otherwise favor one Client Account over another. Given the significant differences in the investment objectives of the other Client Accounts, the Adviser expects it to be very rare that the Fund and another Client Account will have overlapping portfolio
holdings or that an investment opportunity will be appropriate for both portfolios. The Adviser therefore does not believe that it has material conflicts of interest in allocating investment opportunities to the Fund. Nevertheless, the Adviser has policies and procedures designed to allocate investment opportunities among the Client Accounts on a fair and equitable basis over time. Additional controls are in place to monitor the investment decisions and performance of Client Accounts and to address these and other conflicts of interest. See “Conflicts of Interest – The Adviser, the Sub-Advisers, and the Private Fund Managers” below for an additional discussion of the Adviser’s conflicts of interest.
Sub-Advisers
Principal Real Estate Securities
As of March 31, 2022, in addition to the Fund, PrinREI’s portfolio managers were responsible for the day-to-day management of certain other accounts, as follows:
| | | | | | | | | | | | |
Portfolio Manager | | Other Registered Investment
Companies | | Other Pooled
Investment Vehicles | | Other Accounts |
| | Number | | Total Assets of
Other
Registered
Investment
Companies | | Number | | Total Assets | | Number | | Total Assets of
Other Accounts |
| | | | | | | |
Anthony Kenkel | | 11 | | $12,525 MM | | 5 | | $2,721 MM | | 75 | | $11,802 MM |
| | | | | | | |
Kelly Rush | | 11 | | $12,525 MM | | 5 | | $2,942 MM | | 76 | | $11,870 MM |
| | | | | | | |
Simon Hedger | | 7 | | $4,386 MM | | 4 | | $1,651 MM | | 35 | | $7,769 MM |
| | | | | | | |
Scott Carson | | 6 | | $708 MM | | 2 | | $192 MM | | 8 | | $1,899 MM |
| | | | | | | |
Marc Peterson | | 6 | | $708MM | | 3 | | $192 MM | | 12 | | $3,438 MM |
| |
Performance Fee-Based Accounts (The number of accounts and the total assets in the accounts managed by each portfolio manager with respect to which the
advisory fee is based on the performance of the account) |
Anthony Kenkel | | 0 | | $0 | | 0 | | $0 | | 6 | | $865 MM |
Kelly Rush | | 0 | | $0 | | 0 | | $0 | | 6 | | $865 MM |
Simon Hedger | | 0 | | $0 | | 0 | | $0 | | 5 | | $742 MM |
Scott Carson | | 0 | | $0 | | 0 | | $0 | | 0 | | $0 |
Marc Peterson | | 0 | | $0 | | 0 | | $0 | | 0 | | $0 |
Conflicts of Interest
In addition to sub-advising the Fund, PrinREI provides investment advisory services to numerous other client accounts. The investment objectives and policies of these accounts may differ from those of the Fund. Based on these differing circumstances, potential conflicts of interest may arise because PrinREI may be required to pursue different investment strategies on behalf of the Fund and other client
accounts. For example, where PrinREI is managing an account for an individual, it may be required to consider the individual client’s existing positions, personal tax situation, suitability, personal biases, and investment time horizon, considerations that do not necessarily impact its investment decisions on behalf of the Fund. This means that research on securities to determine the merits of including them in the Fund’s portfolio are similar, but not identical, to those employed in building private client portfolios. As a result, there may be instances in which PrinREI purchases or sells an investment for one or more private accounts and not for the Fund, or vice versa. To the extent the Fund and other clients seek to acquire the same security at about the same time, the Fund may not be able to acquire as large a position in such security as it desires or it may have to pay a higher price for the security. Similarly, the Fund may not be able to obtain as large an execution of an order to sell or as high a price for any particular security if the portfolio managers desire to sell the same portfolio security at the same time on behalf of other clients. On the other hand, if the same securities are bought or sold at the same time by more than one client, the resulting participation in volume transactions could produce better executions for the Fund.
Security Capital Research & Management
As of March 31, 2022, in addition to the Fund, Security Capital’s portfolio managers were responsible for the day-to-day management of certain other accounts, as follows:
| | | | | | | | | | | | | | | | |
| Portfolio Manager | | Registered Investment
Companies | | | Other Pooled Investment
Vehicles | | | Other Accounts |
| | Number | | Assets
Managed | | | Number | | Assets
Managed | | | Number | | Assets
Managed |
Anthony R. Manno Jr. | | 1 | | | $0.5 billion | | | 2 | | | $0.9 billion | | | 91 | | $3.5 billion |
Kenneth D. Statz | | 1 | | | $0.5 billion | | | 2 | | | $0.9 billion | | | 91 | | $3.5 billion |
Kevin W. Bedell | | 1 | | | $0.5 billion | | | 2 | | | $0.9 billion | | | 91 | | $3.5 billion |
Nathan J. Gear | | 1 | | | $0.5 billion | | | 2 | | | $0.9 billion | | | 91 | | $3.5 billion |
Performance Fee Based Accounts (The number of accounts and the total assets in the accounts managed by each portfolio manager with respect to which the
advisory fee is based on the performance of the account) |
Anthony R. Manno Jr. | | 0 | | | $0 | | | 0 | | | $0 | | | 5 | | $0.8 billion |
Kenneth D. Statz | | 0 | | | $0 | | | 0 | | | $0 | | | 5 | | $0.8 billion |
Kevin W. Bedell | | 0 | | | $0 | | | 0 | | | $0 | | | 5 | | $0.8 billion |
Nathan J. Gear | | 0 | | | $0 | | | 0 | | | $0 | | | 5 | | $0.8 billion |
Conflicts of Interest
The Security Capital portfolio managers’ management of other accounts may give rise to potential conflicts of interest in connection with their management of the Fund’s investments, on the one hand, and the investments of the other accounts, on the other. The other accounts managed by Security Capital’s portfolio managers include other registered mutual funds and separately managed accounts. The other accounts might have similar investment objectives as the Fund or hold, purchase, or sell securities that are eligible to be held, purchased, or sold by the Fund. While the portfolio managers’ management of other accounts may give rise to the following potential conflicts of interest, Security Capital does not believe that the conflicts, if any, are material or, to the extent any such conflicts are material, Security
Capital believes that it has designed policies and procedures to manage those conflicts in an appropriate way.
A potential conflict of interest may arise as a result of the portfolio managers’ day-to-day management of the Fund. Because of their positions with the Fund, the portfolio managers know the size, timing, and possible market impact of Fund trades. It is theoretically possible that the portfolio managers could use this information to the advantage of other accounts they manage and to the possible detriment of the Fund. However, Security Capital has adopted policies and procedures reasonably designed to allocate investment opportunities on a fair and equitable basis over time.
A potential conflict of interest may arise as a result of the portfolio managers’ management of the Fund and other accounts, which, in theory, may allow them to allocate investment opportunities in a way that favors other accounts over the Fund. This conflict of interest may be exacerbated to the extent that Security Capital or the portfolio managers receive, or expect to receive, greater compensation from their management of the other accounts than from the Fund. Notwithstanding this theoretical conflict of interest, it is Security Capital’s policy to manage each account based on its investment objectives and related restrictions and, as discussed above, Security Capital has adopted policies and procedures reasonably designed to allocate investment opportunities on a fair and equitable basis over time and in a manner consistent with each account’s investment objectives and related restrictions. For example, while the portfolio managers may buy for other accounts securities that differ in identity or quantity from securities bought for the Fund, such securities might not be suitable for the Fund given the investment objectives and related restrictions.
(a)(3) Compensation Structure of Portfolio Manager(s) or Management Team Members
Versus Capital Advisors LLC
A team approach is used by the Adviser to manage the Fund. The Investment Committee of the Adviser is chaired by Casey Frazier, and includes William Fuhs and David Truex. Mr. Frazier and Mr. Fuhs are founding members of the Adviser and are paid a base salary and a share of the profits, if any, earned in their ownership of the Adviser. Mr. Truex is paid a base salary and a discretionary bonus.
Sub-Advisers
Principal Real Estate Securities
The Fund pays PrinREI a sub-advisory fee based on the net assets of the Fund managed by PrinREI, as set forth in an investment sub-advisory agreement between PrinREI and Versus Capital. PrinREI pays its investment professionals out of its total revenues and other resources, including the sub-advisory fees earned with respect to the Fund. The following information relates to the period ended March 31, 2022.
Principal Real Estate Investors offers investment professionals a competitive compensation structure that is evaluated annually relative to other global asset management firms to help ensure its continued competitiveness and alignment with industry best practices. The objective of the structure is to align individual and team contributions with client performance objectives in a manner that is consistent with industry standards and business results. To help ensure we are aligned with the external market and are competitive in comparison to other leading global asset management firms with which we compete for
talent, compensation programming, and positioning are reviewed on an annual basis. To accomplish this, internal compensation professionals partner closely with a leading third-party asset management compensation consulting firm to assist in the evaluation and design of our programming and to obtain and understand the underlying market data used to benchmark our team’s roles. We primarily use McLagan (an Aon Hewitt company), a leading provider of compensation consulting and pay and performance data for asset management firms. We use local country data for the positions within that country.
Compensation for real estate investment professionals at all levels is comprised of base salary and variable incentive components. As team members advance in their careers, the variable incentive opportunity increases in its proportion commensurate with responsibility levels. The variable component is designed to provide line-of-sight to team members while reinforcing delivery of investment performance, long-term business growth, team collaboration, regulatory compliance, operational excellence, client retention, and client satisfaction. Investment performance is the largest determinant, with relative performance metrics measured over multiple rolling time periods. For approximately 20% of the most senior level real estate employees incentive funding is based on a portion of Principal Real Estate Investors’ profits. From that pool, individual awards are determined based on similar factors as noted above.
Awards from the variable incentive plan are delivered in the form of cash or a combination of cash, Principal Financial Group (“PFG”) restricted stock units (“RSUs”) and deferred cash. The amount of incentive delivered in the form of RSUs and deferred cash awards depends on the size of an individual’s incentive award as it relates to a tiered deferral schedule, with all senior team members receiving deferred compensation. RSU and deferred cash awards are subject to a three-year vesting schedule. Incentive compensation awards are recommended by employee leaders and ultimately approved by the chief executive officer of Principal Real Estate Investors, the Private Real Estate Management Committee, and the senior management team of Principal Global Investors.
The overall measurement framework and deferred components are well aligned with our focus on clients’ objectives (e.g. long-term investment performance), alignment with Principal shareholders (e.g. RSUs), and talent retention.
Promotions are based on need for a higher-level role and individual readiness. Readiness for a promotion involves an evaluation of the individual’s demonstrated competencies, proficiencies and behavior.
Security Capital Research & Management
The Fund pays Security Capital a sub-advisory fee based on the net assets of the Fund managed by Security Capital, as set forth in an investment sub-advisory agreement between Security Capital and Versus Capital. Security Capital pays its investment professionals out of its total revenues and other resources, including the sub-advisory fees earned with respect to the Fund. The following information relates to the period ended March 31, 2022.
The principal form of compensation of Security Capital’s professionals is a base salary and annual bonus. Base salaries are fixed for each portfolio manager. Each professional is paid a cash salary and, in addition, a year-end bonus based on achievement of specific objectives that the professional’s manager and the professional agree upon at the commencement of the year. The annual bonus is paid partially in cash and partially in either: (i) restricted stock of Security Capital’s parent company,
JPMorgan Chase & Co., and/or (ii) in self-directed parent company mutual funds, all vesting over a three-year period (50% each after the second and third years). The annual bonus is a function of Security Capital achieving its financial, operating and investment performance goals, as well as the individual achieving measurable objectives specific to that professional’s role within the firm. The annual incentive program is linked directly to the profitability of each business unit, to JPMorgan Asset Management as a whole, and to the performance of the firm generally. None of the portfolio managers’ compensation is based on the performance of, or the value of assets held in, the Fund.
(a)(4) Disclosure of Securities Ownership
Versus Capital Advisors LLC
The following table discloses the dollar range of equity securities beneficially owned by the portfolio managers of the Fund as of March 31, 2022.
| | |
| Name of Portfolio Manager | | Dollar Range of Equity
Securities in the Fund |
William R. Fuhs, Jr. | | $500,001-$1,000,000 |
Casey Frazier | | $500,001-$1,000,000 |
David Truex | | $10,001-$50,000 |
Sub-Advisers
Principal Real Estate Securities
As of March 31, 2022, PrinREI’s portfolio managers did not beneficially own any shares of the Fund.
Security Capital Research & Management
As of March 31, 2022, Security Capital’s portfolio managers did not beneficially own any shares of the Fund.
(b) Not applicable
| Item 9. | Purchases of Equity Securities by Closed-End Management Investment Company and Affiliated Purchasers. |
Not applicable.
| Item 10. | Submission of Matters to a Vote of Security Holders. |
There have been no material changes to the procedures by which the shareholders may recommend nominees to the registrant’s board of directors, where those changes were implemented after the registrant last provided disclosure in response to the requirements of Item 407(c)(2)(iv) of Regulation S-K (17 CFR 229.407) (as required by Item 22(b)(15) of Schedule 14A (17 CFR 240.14a-101)), or this Item.
| Item 11. | Controls and Procedures. |
| | (a) | The registrant’s principal executive and principal financial officers, or persons performing similar functions, have concluded that the registrant’s disclosure controls and procedures (as defined in Rule 30a-3(c) under the Investment Company Act of 1940, as amended (the “1940 Act”) (17 CFR 270.30a-3(c))) are effective, as of a date within 90 days of the filing date of the report that includes the disclosure required by this paragraph, based on their evaluation of these controls and procedures required by Rule 30a-3(b) under the 1940 Act (17 CFR 270.30a-3(b)) and Rules 13a-15(b) or 15d-15(b) under the Securities Exchange Act of 1934, as amended (17 CFR 240.13a-15(b) or 240.15d-15(b)). |
| | (b) | There were no changes in the registrant’s internal control over financial reporting (as defined in Rule 30a-3(d) under the 1940 Act (17 CFR 270.30a-3(d))) that occurred during the period covered by this report that has materially affected, or is reasonably likely to materially affect, the registrant’s internal control over financial reporting. |
| Item 12. | Disclosure of Securities Lending Activities for Closed-End Management Investment Companies. |
Not applicable.
Item 13. Exhibits.
(a)(2)(1) Not applicable.
(a)(2)(2) Not applicable.
SIGNATURES
Pursuant to the requirements of the Securities Exchange Act of 1934 and the Investment Company Act of 1940, the registrant has duly caused this report to be signed on its behalf by the undersigned, thereunto duly authorized.
| | |
(Registrant) | | Versus Capital Multi-Manager Real Estate Income Fund LLC |
| | |
By (Signature and Title)* | | /s/ Mark D. Quam |
| | Mark D. Quam, Chief Executive Officer |
| | (principal executive officer) |
Pursuant to the requirements of the Securities Exchange Act of 1934 and the Investment Company Act of 1940, this report has been signed below by the following persons on behalf of the registrant and in the capacities and on the dates indicated.
| | |
By (Signature and Title)* | | /s/ Mark D. Quam |
| | Mark D. Quam, Chief Executive Officer |
| | (principal executive officer) |
| | |
By (Signature and Title)* | | /s/ Brian Petersen |
| | Brian Petersen, Chief Financial Officer |
| | (principal financial officer) |
* Print the name and title of each signing officer under his or her signature.