UNITED STATES
SECURITIES AND EXCHANGE COMMISSION
Washington, D.C. 20549
FORM N-CSR
CERTIFIED SHAREHOLDER REPORT OF REGISTERED
MANAGEMENT INVESTMENT COMPANIES
Investment Company Act file number 811-22533
Duff & Phelps Global Utility Income Fund Inc.
(Exact name of registrant as specified in charter)
200 South Wacker Drive, Suite 500
Chicago, Illinois 60606
(Address of principal executive offices) (Zip code)
| | |
Alan M. Meder Duff & Phelps Global Utility Income Fund Inc. 200 South Wacker Drive, Suite 500 Chicago, Illinois 60606 | | Lawrence R. Hamilton, Esq. Mayer Brown LLP 71 South Wacker Drive Chicago, Illinois 60606 |
(Name and address of agent for service)
Registrant’s telephone number, including area code: 312-368-5510
Date of fiscal year end: October 31
Date of reporting period: April 30, 2017
| Item 1. | Reports to Stockholders. |
The Semi-Annual Report to Stockholders follows.

Semi-Annual Report
April 30, 2017
Fund Distributions and Managed Distribution Plan: Duff & Phelps Global Utility Income Fund Inc. (the “Fund”) has been paying a regular 35.0 cent per share quarterly distribution on its common stock since September 2011. In June 2015, the Fund’s Board of Directors (the “Board”) adopted a Managed Distribution Plan (the “Plan”), which provides for the Fund to continue to make a quarterly distribution on its common stock of 35.0 cents per share. Under the Plan, the Fund will distribute all available investment income to shareholders, consistent with the Fund’s investment objective. If and when sufficient investment income is not available on a quarterly basis, the Fund will distribute long-term capital gains and/or return capital to its shareholders in order to maintain the steady distribution rate that has been approved by the Board.
If the Fund estimates that it has distributed more than its income and capital gains in a particular period, a portion of your distribution may be a return of capital. A return of capital may occur, for example, when some or all of the money that you invested in the Fund is paid back to you. A return of capital distribution does not necessarily reflect the Fund’s investment performance and should not be confused with “yield” or “income.”
To the extent that the Fund uses capital gains and/or return of capital to supplement its investment income, you should not draw any conclusions about the Fund’s investment performance from the amount of the Fund’s distributions or from the terms of the Fund’s Managed Distribution Plan.
Whenever a quarterly distribution includes a capital gain or return of capital component, the Fund will provide you with a written statement indicating the sources of the distribution and the amount derived from each source. As the most recent quarterly statement from the Fund indicated, the cumulative distributions paid this fiscal year to date through April 30, 2017 were estimated to be composed of net investment income, capital gains and return of capital.
The amounts and sources of distributions reported in written statements from the Fund are only estimates and are not provided for tax reporting purposes. The actual amounts and sources of the amounts for tax reporting purposes will depend upon the Fund’s investment experience during the remainder of its fiscal year and may be subject to changes based on tax regulations. The Fund will send you a Form 1099-DIV for the calendar year that will tell you how to report these distributions for federal income tax purposes.
The Board may amend, suspend, or terminate the Managed Distribution Plan without prior notice to shareholders if it deems such action to be in the best interests of the Fund and its shareholders. For example, the Board might take such action if the Plan had the effect of shrinking the Fund’s assets to a level that was determined to be detrimental to Fund shareholders. The suspension or termination of the Plan could have the effect of creating a trading discount (if the Fund’s stock is trading at or above net asset value) or widening an existing trading discount.
The Managed Distribution Plan is described in a Question and Answer format on your Fund’s website, www.dpgfund.com under the “Dividend and Distributions” tab. The tax characterization of the Fund’s historical distributions can also be found on the website under the “Tax Information” tab.
LETTER TO SHAREHOLDERS
June 15, 2017
Dear Fellow Shareholders:
Consistent with its primary objective of current income and long-term growth of income, and with its Managed Distribution Plan, the Fund declared two quarterly distributions in the first half of the 2017 fiscal year. The 35 cent quarterly dividend, without compounding, equates to a $1.40 annual rate, which is equal to 8.29% of the April 30, 2017 closing price of $16.88 per share. Please refer to the inside front cover of this report and the portion of this letter captioned “About Your Fund” for important information about the Fund and its Managed Distribution Plan.
Update on Industry Fundamentals: Annually, the investment professionals at the Fund’s investment adviser, Duff & Phelps Investment Management Co., make “state-of-the-industry” presentations to the Fund’s Board. Below are selected points from these presentations:
Electric Utilities
Electric utilities continue to demonstrate good rate base and earnings growth as they make needed investments in their networks across transmission, distribution, and generation. In addition, dividend growth has been tied to earnings growth, providing the Fund with attractive investment opportunities in the electric utility industry.
The nation’s electric generation mix has been changing over the years with the contribution from coal continuing to decline. From almost fifty percent, a decade ago, coal comprised less than a third of the kilowatt hours generated in 2016. Originally, this decline was driven by federal regulation of pollutants and greenhouse gases. Increasingly, the decline is due to cheap natural gas prices and state-level renewable energy mandates. For example, California has targeted a renewable portfolio standard of 50% by 2030 while Hawaii’s target for that date is 40%.
In 2016, additions to renewable energy generation were led by solar for the first time, but future additions are increasingly focused on wind. Utility-installed wind capacity stood at about 83 gigawatts (GW) at the end of 2016, compared to about 35 GW of utility solar capacity and announced capacity additions in 2016 were led by wind (17 GW) over solar (13 GW). Production tax credits (PTCs) cut the current cost of a kilowatt hour generated by wind roughly in half and utilities have hurried to take advantage of PTCs before the credits begin to step down in 2017. Capital costs for typical wind towers have stayed roughly flat, while higher towers and bigger blades have increased wind tower utilization factors from the 30 percent range to a current 50 percent range. Wind suppliers are hopeful that utilization factors can increase even more and that costs can be lowered such that wind will eventually become economic on a standalone basis compared to other forms of generation. By investing in new wind generation, many utilities are able to lower overall power costs to customers via reductions in fuel and operating costs, while investing in the regulated asset base that generates returns for shareholders.
The increase in renewable energy generation is one factor that has led to new investment in the transmission grid. Even more transmission investment will be needed to create the “smart grid” of the future. Among other benefits, the smart grid allows for remote metering and the remote provisioning of service. In addition, automatic outage detection and the “self-healing” capabilities of smart grids can minimize disruption from outages.
1
Gas Utilities
Gas utilities are continuing their efforts to replace aging cast iron, bare steel, and older-generation plastic pipes with modern pipes in order to enhance the safety of their distribution systems. These activities enjoy strong support from regulators and, as many of the plans stretch over decades, they give good visibility to long-term growth of the regulated asset base. The capital expenditure to replace pipes has been partly offset in recent years by the decreasing cost of the natural gas commodity, which has helped reduce “rate shock” to customers. The long-term growth in revenues, earnings, and dividends for gas utility companies has led to numerous acquisitions in the past few years, benefiting many of the holdings in the Fund. However, future acquisition activity may slow as valuations now largely reflect the current positive earnings and dividend profile of gas utility companies.
Midstream Energy
With persistently lower oil and natural gas prices in the U.S., midstream companies have looked for ways to reduce costs. Many master limited partnerships (MLPs) have moved to lower capital costs via restructuring or simplification of their corporate structures. This can take several forms. MLPs can issue additional limited partner units to their general partner in exchange for decreased payments. Incentive payments from MLPs to general partners can be bought out to cut their future cost. Alternatively, MLPs and their general partners can be combined. The key is for MLP unit holders to be treated fairly while lowering the cost of capital in order to better compete for future growth projects.
Lower natural gas prices are benefiting U.S. companies with regards to the market for liquefied natural gas (LNG). In addition, LNG markets are experiencing strong growth worldwide. LNG demand is forecast to grow 50% over the 2015-2022 timeframe, with China and India accounting for a large portion of growth. On the supply side, Australia has ramped up production quite significantly—to the point where existing natural gas production is at capacity and strains on natural gas fired electric generation have led to “brown outs.” In the U.S., the first new LNG export facilities (Sabine Pass) have come on line, with more projects planned. LNG exports are expected to boost growth across the midstream infrastructure, benefiting owners of pipelines, liquefaction facilities, and LNG ships. (Due to ample infrastructure and supply, LNG exports are not expected to strain the U.S. natural gas system.)
Telecommunications
The developing wireless standard of 5G will drive the next leg of investment in the telecom industry. 5G will require new network architecture incorporating small cells, distributed antenna systems, cloud radio access networks, and lots of fiber access. 5G promises much higher data speeds (at least 10-100 times faster) and lower latency (maybe 100 times less). The initial commercial deployment of 5G, currently being implemented on a trial basis by companies like Verizon and AT&T, will be fixed broadband replacement. Mobile 5G is expected to be rolled out beginning in the 2019-2020 timeframe and will help power the Internet of Things (IoT). IoT broadly means any object with embedded sensors and a data connection to the internet. IoT is already used by industry to control plants and machinery, track inventory, and predict maintenance. Driverless cars and “connected cities” will be the next opportunity for IoT. IoT is a small, but fast growing, part of telecom company revenues. The ability to earn revenues from IoT developments will be key to help offset price pressures in the telecom companies’ existing businesses.
2
Performance Review: On a net asset value (“NAV”) basis, the Fund’s five- year annualized total return (income plus change in the NAV of the portfolio) was 6.3% through April 30, 2017, compared to the Composite Index, which had a 5.7% annualized total return for that same period. The Composite Index is composed of the MSCI U.S. Utilities Index, the MSCI World ex U.S. Utilities Index, the MSCI World Telecom Services Index, and the Alerian MLP Index, weighted to reflect the stock sector allocation of the Fund. On a market value basis, the Fund had a five-year annualized total return of 5.9% through April 30, 2017. For the six months ended April 30, 2017, the Fund’s NAV total return was 5.2% and its market value total return was 11.6%, compared to the Composite Index’s 6.1% total return.
The table below compares the performance of the Fund to various market indices. It is important to note that the composite and index returns referred to in this letter include no fees or expenses, whereas the Fund’s returns are net of expenses.
| | | | | | | | | | | | | | | | |
Total Return1 For the period indicated through April 30, 2017 | |
| | | Six Months | | | One Year | | | Three Years (annualized) | | | Five Years (annualized) | |
Duff & Phelps Global Utility Income Fund Inc. | | | | | | | | | | | | | | | | |
Market Value2 | | | 11.6 | % | | | 10.6 | % | | | 1.6 | % | | | 5.9 | % |
Net Asset Value3 | | | 5.2 | % | | | 6.6 | % | | | -0.6 | % | | | 6.3 | % |
Composite Index4 | | | 6.1 | % | | | 5.6 | % | | | -0.5 | % | | | 5.7 | % |
Alerian MLP Index4 | | | 9.6 | % | | | 14.1 | % | | | -6.9 | % | | | 1.9 | % |
MSCI World Telecom Services Index4 | | | 2.8 | % | | | -1.3 | % | | | 1.9 | % | | | 7.9 | % |
MSCI U.S. Utilities Index4 | | | 5.5 | % | | | 8.9 | % | | | 8.1 | % | | | 10.2 | % |
MSCI World ex U.S. Utilities Index4 | | | 4.1 | % | | | 0.0 | % | | | -2.1 | % | | | 3.0 | % |
| | ¹ | Past performance is not indicative of future results. Current performance may be lower or higher than performance in historical periods. |
| | ² | Total return on market value assumes a purchase of common stock at the opening market price on the first business day and a sale at the closing market price on the last business day of each period shown in the table and assumes reinvestment of dividends at the actual reinvestment prices obtained under the terms of the Fund’s dividend reinvestment plan. In addition, when buying or selling stock, you would ordinarily pay brokerage expenses. Because brokerage expenses are not reflected in the above calculations, your total return net of brokerage expenses would be lower than the total return on market value shown in the table. Source: Administrator of the Fund. |
| | ³ | Total return on NAV uses the same methodology as is described in note 2, but with use of NAV for beginning, ending and reinvestment values. Because the Fund’s expenses (ratios detailed on page 13 of this report) reduce the Fund’s NAV, they are already reflected in the Fund’s total return on NAV shown in the table. NAV represents the underlying value of the Fund’s net assets, but the market price per share may be higher or lower than the NAV. Source: Administrator of the Fund. |
| | 4 | The Composite Index is a composite of the returns of the MSCI U.S. Utilities Index, the MSCI World ex U.S. Utilities Index, the MSCI World Telecom Services Index, and the Alerian MLP Index, weighted monthly to reflect the stock sector allocation of the Fund based on beginning of quarter market values. The indices are calculated on a total return basis, net of foreign withholding taxes, with dividends reinvested. Indices are unmanaged; their returns do not reflect any fees, expenses, or sales charges; and they are not available for direct investment. Source: Index returns were obtained from MSCI and Morningstar Direct. |
3
The Federal Reserve and Fund Leverage: The Federal Open Market Committee (FOMC), the committee within the Federal Reserve that sets domestic monetary policy, has begun to reverse the highly accommodative policy of the previous eight years. Statements by FOMC members indicate that the committee would like to raise rates an additional one or two times this year, if conditions allow. While rising interest rates generally have a negative impact on income-oriented investments, if improved growth accompanies the rising rates, the impact can be mitigated. In addition to the impact of interest rates on Fund holdings, rising interest rates increase the cost of the Fund’s leverage. The Fund’s borrowings and preferred shares pay interest and dividends based on one and three month LIBOR (London Interbank Offered Rate) rates, as outlined in Note 7 and Note 8 to the Fund’s financial statements.
The use of leverage enables the Fund to borrow at short-term rates and invest at higher yields on equity holdings. As of April 2017, the Fund’s leverage consisted of $100 million of floating rate preferred stock and $160 million of floating rate debt. On that date, the total amount of leverage represented approximately 26.3% of the Fund’s total assets. The amount and type of leverage used by the Fund is reviewed by the Board of Directors based on the Fund’s expected earnings relative to the anticipated costs (including fees and expenses) associated with the leverage. In addition, the long-term expected benefits of leverage are weighed against the potential effect of increasing the volatility of both the Fund’s NAV and the market value of its common stock. If the use of leverage were to cease being beneficial, the amount and type of leverage employed by the Fund could potentially be modified or eliminated.
Board of Directors Meeting: At the regular June 2017 Board meeting, the Board declared a quarterly distribution of 35 cents per share to holders of record of common stock on September 15, 2017, with the distribution to be payable on September 30, 2017.
As previously reported in the annual report for the year ended October 31, 2015, in June 2015, the Board adopted a Managed Distribution Plan (the “Plan”). The Plan provides for the continuation of the 35.0 cent per share quarterly distribution. While the adoption of the Plan does not in any way constitute a guarantee that the Fund will maintain at least a 35.0 cent per share quarterly distribution, it does indicate that the Fund currently intends to use long-term capital gains and/or return of capital, if necessary, to maintain that distribution rate. The Board may amend, suspend or terminate the Plan without prior notice to shareholders if it deems such action to be in the best interests of the Fund and its shareholders.
About the Fund: The Fund’s investment objective is to seek total return, resulting primarily from (i) a high level of current income, with an emphasis on providing tax-advantaged dividend income and (ii) growth in current income, and secondarily from capital appreciation. Under normal market conditions, the Fund will invest at least 80% of its total assets in dividend-paying equity securities of companies in the utility industry. The utility industry is defined to include the following sectors: electric, gas, water, telecommunications and midstream energy.
Visit us on the Web—You can obtain more information about the Fund, including the most recent shareholder financial reports and distribution information, at our website, www.dpgfund.com. We appreciate your interest in Duff & Phelps Global Utility Income Fund Inc., and we will continue to do our best to be of service to you.
| | |
Eric Elvekrog, CFA, CPA | | Nathan I. Partain, CFA |
Vice President & Chief Investment Officer | | President and Chief Executive Officer |
4
Certain statements in this report are forward-looking statements. Discussions of specific investments are for illustration only and are not intended as recommendations of individual investments. The forward-looking statements and other views expressed herein are those of the portfolio managers as of the date of this report. Actual future results or occurrences may differ significantly from those anticipated in any forward looking statements, and the views expressed herein are subject to change at any time, due to numerous market and other factors. The Fund disclaims any obligation to update publicly or revise any forward looking statements or views expressed herein.
5
DUFF & PHELPS GLOBAL UTILITY INCOME FUND INC.
SCHEDULE OF INVESTMENTS
April 30, 2017
(Unaudited)
| | | | | | | | |
| Shares | | | Description | | Value | |
| | COMMON STOCKS & MLP INTERESTS—132.4% | |
| |
| | | | ⬛ ELECTRIC, GAS AND WATER—40.6% | |
| | 1,670,000 | | | CenterPoint Energy, Inc. | | | $47,645,100 | |
| | 1,000,000 | | | Emera, Inc. (Canada) | | | 34,614,117 | |
| | 866,000 | | | innogy SE (Germany) | | | 31,837,541 | |
| | 3,851,000 | | | National Grid plc (United Kingdom) | | | 49,878,251 | |
| | 218,000 | | | NextEra Energy, Inc. | | | 29,116,080 | |
| | 470,000 | | | PG&E Corp. | | | 31,513,500 | |
| | 731,700 | | | Southern Co. (The) | | | 36,438,660 | |
| | 449,292 | | | WEC Energy Group, Inc. | | | 27,191,152 | |
| | | | | | | | |
| | | | | | | 288,234,401 | |
| | | | | | | | |
| |
| | | | ⬛ OIL & GAS STORAGE, TRANSPORTATION AND PRODUCTION—60.1% | |
| | 5,757,455 | | | APA Group (Australia) | | | 39,490,432 | |
| | 480,184 | | | DCP Midstream LP | | | 18,194,172 | |
| | 1,514,519 | | | Energy Transfer Equity LP | | | 36,257,585 | |
| | 802,800 | | | Enterprise Products Partners LP | | | 21,932,496 | |
| | 500,000 | | | GasLog Partners LP (Marshall Islands) | | | 11,925,000 | |
| | 355,500 | | | Genesis Energy LP | | | 11,141,370 | |
| | 1,431,854 | | | Kinder Morgan, Inc. | | | 29,539,148 | |
| | 484,223 | | | KNOT Offshore Partners LP (Marshall Islands) | | | 11,597,141 | |
| | 400,575 | | | MPLX LP | | | 14,112,257 | |
| | 710,000 | | | NGL Energy Partners LP | | | 11,360,000 | |
| | 285,716 | | | NuStar Energy LP | | | 13,762,940 | |
| | 856,000 | | | Pembina Pipeline Corp. (Canada) | | | 27,278,122 | |
| | 756,000 | | | Plains All American Pipeline LP | | | 22,113,000 | |
| | 500,000 | | | Sunoco LP | | | 15,195,000 | |
| | 343,298 | | | Tallgrass Energy Partners LP | | | 17,611,187 | |
| | 446,528 | | | Targa Resources Corp. | | | 24,617,089 | |
| | 278,834 | | | TC Pipelines LP | | | 16,877,822 | |
| | 1,080,000 | | | TransCanada Corp. (Canada) | | | 50,144,976 | |
| | | | | | | | |
| Shares | | | Description | | Value | |
| | |
| | 814,270 | | | Williams Partners LP | | $ | 33,328,071 | |
| | | | | | | | |
| | | | | | | 426,477,808 | |
| | | | | | | | |
| |
| | | | ⬛ TELECOMMUNICATIONS—31.7% | |
| | 810,000 | | | BCE Inc. (Canada) | | | 36,911,700 | |
| | 225,000 | | | Crown Castle International Corp. | | | 21,285,000 | |
| | 2,974,000 | | | Frontier Communications Corp. | | | 5,591,120 | |
| | 11,510,000 | | | Koninklijke KPN N.V. (Netherlands) | | | 33,288,000 | |
| | 1,468,000 | | | Orange SA (France) | | | 22,707,131 | |
| | 15,565,000 | | | Spark New Zealand Ltd. (New Zealand) | | | 39,488,259 | |
| | 500,000 | | | Telia Company AB (Sweden) | | | 2,037,867 | |
| | 6,860,000 | | | Telstra Corp., Ltd. (Australia) | | | 21,677,162 | |
| | 1,119,440 | | | Uniti Group, Inc. | | | 30,739,823 | |
| | 1,978,200 | | | Windstream Holdings, Inc. | | | 10,919,664 | |
| | | | | | | | |
| | | | | | | 224,645,726 | |
| | | | | | | | |
| | | | Total Common Stocks & MLP Interests
(Cost $876,310,732) | | | 939,357,935 | |
| | | | | | | | |
| | SHORT-TERM INVESTMENT—6.4% | | | | |
| |
| | | | ⬛ MONEY MARKET MUTUAL FUND—6.4% | |
| | 45,402,453 | | | BlackRock Liquidity Funds FedFund Portfolio Institutional Shares (seven-day effective yield 0.653%)(2) | | | 45,402,453 | |
| | | | | | | | |
| | | | Total Short-term Investment
(Cost $45,402,453) | | | 45,402,453 | |
| | | | | | | | |
The accompanying notes are an integral part of these financial statements.
6
DUFF & PHELPS GLOBAL UTILITY INCOME FUND INC.
SCHEDULE OF INVESTMENTS—(Continued)
April 30, 2017
(Unaudited)
| | | | | | |
Description | | Value | |
TOTAL INVESTMENTS—138.8%
(Cost $921,713,185) | | | $984,760,388 | (1) |
| | | | | | |
Secured borrowings—(22.6)% | | | (160,000,000 | ) |
Mandatory Redeemable Preferred Shares at liquidation value—(14.1)% | | | (100,000,000 | ) |
Other assets less other liabilities—(2.1)% | | | (15,327,570 | ) |
| | | | | | |
NET ASSETS APPLICABLE TO COMMON STOCK—100.0% | | | $709,432,818 | |
| | | | | | |
(1) All or a portion of the total investments have been pledged as collateral for borrowings.
(2) Shares of this fund are publicly offered and its prospectus and annual report are publicly available.
The percentage shown for each investment category is the total value of that category as a percentage of the net assets applicable to common stock of the Fund.
The Fund’s investments are carried at fair value which is defined as the price that the Fund would receive upon selling an investment in a timely transaction to an independent buyer in the principal or most advantageous market of the investment. The three-tier hierarchy of inputs established to classify fair value measurements for disclosure purposes is summarized in the three broad levels listed below.
Level 1—quoted prices in active markets for identical securities
Level 2—other significant observable inputs (including quoted prices for similar securities, interest rates, prepayment speeds, credit risks, etc.)
Level 3—significant unobservable inputs (including the Fund’s own assumptions in determining fair value of investments)
The inputs or methodology used for valuing securities are not necessarily an indication of the risk associated with investing in these securities. The following is a summary of the inputs used to value each of the Fund’s investments at April 30, 2017:
| | | | |
| | | Level 1 | |
Common stocks & MLP interests | | $ | 939,357,935 | |
Money market mutual fund | | | 45,402,453 | |
| | | | |
Total | | $ | 984,760,388 | |
| | | | |
There were no Level 2 or Level 3 priced securities held and there were no transfers between Level 1 and Level 2 related to securities held at April 30, 2017.
The accompanying notes are an integral part of these financial statements.
7
DUFF & PHELPS GLOBAL UTILITY INCOME FUND INC.
April 30, 2017
(Unaudited)
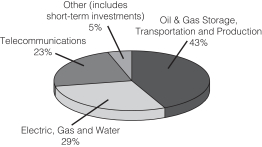
SECTOR ALLOCATION*
| | |
| COUNTRY WEIGHTING* | | CURRENCY EXPOSURE* |
| |
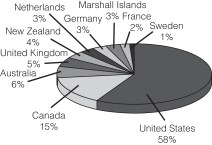 | | 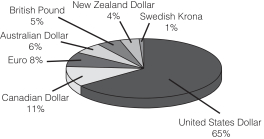 |
| * | Percentages are based on total investments rather than net assets applicable to common stock. |
The accompanying notes are an integral part of these financial statements.
8
DUFF & PHELPS GLOBAL UTILITY INCOME FUND INC.
STATEMENT OF ASSETS AND LIABILITIES
April 30, 2017
(Unaudited)
| | | | |
ASSETS: | | | | |
Investments at value (cost $921,713,185) | | | $984,760,388 | |
Foreign currency at value (cost $1,929,486) | | | 1,929,486 | |
Receivables: | | | | |
Dividends | | | 2,560,671 | |
Reclaims | | | 507,762 | |
Prepaid expenses | | | 47,825 | |
| | | | |
Total assets | | | 989,806,132 | |
| | | | |
LIABILITIES: | | | | |
Secured borrowings (Note 8) | | | 160,000,000 | |
Payable for securities purchased | | | 20,171,662 | |
Investment advisory fee (Note 3) | | | 760,108 | |
Administrative fee (Note 3) | | | 58,641 | |
Interest payable on secured borrowings | | | 24,200 | |
Accrued expenses | | | 126,216 | |
Interest payable on floating rate mandatory redeemable preferred shares (Note 7) | | | 254,801 | |
Floating rate mandatory redeemable preferred shares (liquidation preference $100,000,000, net of deferred offering costs of $1,022,314) (Note 7) | | | 98,977,686 | |
| | | | |
Total liabilities | | | 280,373,314 | |
| | | | |
NET ASSETS APPLICABLE TO COMMON STOCK | | | $709,432,818 | |
| | | | |
CAPITAL | | | | |
Common stock ($0.001 par value; 596,000,000 shares authorized and 37,929,806 shares issued and outstanding) | | | $37,930 | |
Additional paid-in capital | | | 652,490,961 | |
Distributions in excess of net investment income | | | (21,762,817 | ) |
Accumulated net realized gain on investments | | | 15,668,969 | |
Net unrealized appreciation on investments and foreign currency translation | | | 62,997,775 | |
| | | | |
Net assets applicable to common stock | | | $709,432,818 | |
| | | | |
NET ASSET VALUE PER SHARE OF COMMON STOCK | | | $18.70 | |
| | | | |
The accompanying notes are an integral part of these financial statements.
9
DUFF & PHELPS GLOBAL UTILITY INCOME FUND INC.
STATEMENT OF OPERATIONS
For the six months ended April 30, 2017
(Unaudited)
| | | | |
INVESTMENT INCOME: | | | | |
Dividends (less foreign withholding tax of $1,203,478) | | | $28,988,273 | |
Less return of capital distributions (Note 2) | | | (15,831,412 | ) |
| | | | |
Total investment income | | | 13,156,861 | |
| | | | |
EXPENSES: | | | | |
Investment advisory fees (Note 3) | | | 4,775,026 | |
Administrative fees (Note 3) | | | 348,569 | |
Interest expense and amortization of deferred offering costs on preferred shares (Note 7) | | | 1,538,627 | |
Interest expense and fees on secured borrowings (Note 8) | | | 1,262,511 | |
Accounting agent fees | | | 102,053 | |
Reports to shareholders | | | 85,594 | |
Directors’ fees (Note 3) | | | 80,024 | |
Professional fees | | | 74,481 | |
Custodian fees | | | 35,572 | |
Transfer agent fees | | | 6,364 | |
Other expenses | | | 61,455 | |
| | | | |
Total expenses | | | 8,370,276 | |
Less expenses reimbursed by investment adviser (Note 3) | | | (238,751 | ) |
| | | | |
Net expenses | | | 8,131,525 | |
| | | | |
Net investment income | | | 5,025,336 | |
| | | | |
REALIZED AND UNREALIZED GAIN (LOSS): | | | | |
Net realized gain (loss) on investments | | | 19,506,945 | |
Net realized gain (loss) on foreign currency transactions | | | 52,101 | |
Net change in unrealized appreciation (depreciation) on investments and foreign currency translations | | | 11,449,663 | |
| | | | |
Net realized and unrealized gain (loss) | | | 31,008,709 | |
| | | | |
NET INCREASE IN NET ASSETS APPLICABLE TO COMMON STOCK RESULTING FROM OPERATIONS | | | $36,034,045 | |
| | | | |
The accompanying notes are an integral part of these financial statements.
10
DUFF & PHELPS GLOBAL UTILITY INCOME FUND INC.
STATEMENTS OF CHANGES IN NET ASSETS
| | | | | | | | |
| | | For the
six months
ended
April 30, 2017
(Unaudited) | | | For the
year ended
October 31, 2016 | |
OPERATIONS: | | | | | | | | |
Net investment income | | | $5,025,336 | | | | $25,501,166 | |
Net realized gain (loss) | | | 19,559,046 | | | | 5,858,630 | |
Net change in unrealized appreciation (depreciation) | | | 11,449,663 | | | | (8,812,646 | ) |
| | | | | | | | |
Net increase (decrease) in net assets applicable to common stock resulting from operations | | | 36,034,045 | | | | 22,547,150 | |
| | | | | | | | |
| | |
DISTRIBUTIONS TO COMMON STOCKHOLDERS: | | | | | | | | |
Net investment income | | | (5,025,336 | )* | | | (18,788,477 | ) |
In excess of net investment income | | | (21,525,528 | )* | | | — | |
Net realized gain | | | — | * | | | (19,248,224 | ) |
Return of capital | | | — | * | | | (15,065,027 | ) |
| | | | | | | | |
Decrease in net assets from distributions to stockholders (Note 6) | | | (26,550,864 | ) | | | (53,101,728 | ) |
| | | | | | | | |
Total increase (decrease) in net assets | | | 9,483,181 | | | | (30,554,578 | ) |
| | |
TOTAL NET ASSETS APPLICABLE TO COMMON STOCK | | | | | | | | |
Beginning of period | | | 699,949,637 | | | | 730,504,215 | |
| | | | | | | | |
End of period (including distributions in excess of net investment income of $(21,762,817) and $(237,289), respectively) | | | $709,432,818 | | | | $699,949,637 | |
| | | | | | | | |
| * | Allocations to net investment income, net realized gain and/or return of capital will be determined at fiscal year end. |
The accompanying notes are an integral part of these financial statements.
11
DUFF & PHELPS GLOBAL UTILITY INCOME FUND INC.
STATEMENT OF CASH FLOWS
For the six months ended April 30, 2017
(Unaudited)
| | | | | | | | |
INCREASE (DECREASE) IN CASH | | | | | | | | |
Cash flows provided by (used in) operating activities: | | | | | | | | |
Income dividends received | | | $13,048,841 | | | | | |
Interest paid on secured borrowings | | | (1,244,333 | ) | | | | |
Expenses paid | | | (5,324,189 | ) | | | | |
Purchase of long-term investment securities | | | (144,525,784 | ) | | | | |
Proceeds from sale of long-term investment securities | | | 191,805,312 | | | | | |
Net change in short-term investments | | | (41,402,151 | ) | | | | |
Return of capital distributions on investments | | | 15,831,412 | | | | | |
Proceeds from written options | | | 335,953 | | | | | |
Interest paid on floating rate mandatory redeemable preferred shares | | | (1,521,115 | ) | | | | |
Net realized gain from foreign currency transactions | | | 52,101 | | | | | |
| | | | | | | | |
Net cash provided by operating activities | | | | | | | $27,056,047 | |
Cash flows provided by (used in) financing activities: | | | | | | | | |
Distributions paid | | | (26,550,864 | ) | | | | |
| | | | | | | | |
Net cash used in financing activities | | | | | | | (26,550,864 | ) |
| | | | | | | | |
Net increase in cash and cash equivalents | | | | | | | 505,183 | |
Cash and cash equivalents—beginning of period | | | | | | | 1,424,303 | |
| | | | | | | | |
Cash and cash equivalents—end of period | | | | | | | $1,929,486 | |
| | | | | | | | |
Reconciliation of net increase (decrease) in net assets resulting from operations to net cash provided by operating activities: | | | | | | | | |
Net increase in net assets resulting from operations | | | | | | | $36,034,045 | |
Purchase of long-term investment securities | | | (144,525,784 | ) | | | | |
Proceeds from sale of long-term investment securities | | | 191,805,312 | | | | | |
Proceeds from options written | | | 335,953 | | | | | |
Net change in short-term investments | | | (41,402,151 | ) | | | | |
Net realized gain on investments | | | (19,506,945 | ) | | | | |
Return of capital distributions on investments | | | 15,831,412 | | | | | |
Amortization of deferred offering costs | | | 89,931 | | | | | |
Net change in unrealized (appreciation) depreciation on investments and foreign currency translations | | | (11,449,663 | ) | | | | |
Net change in unrealized (appreciation) depreciation on foreign currency | | | (3,671 | ) | | | | |
Increase in dividends receivable | | | (107,582 | ) | | | | |
Decrease in reclaims receivable | | | 3,233 | | | | | |
Increase in interest payable on borrowings | | | 18,178 | | | | | |
Decrease in expenses payable | | | (83,733 | ) | | | | |
Increase in interest payable on floating rate mandatory redeemable preferred shares | | | 17,512 | | | | | |
| | | | | | | | |
Total adjustments | | | | | | | (8,977,998 | ) |
| | | | | | | | |
Net cash provided by operating activities | | | | | | | $27,056,047 | |
| | | | | | | | |
The accompanying notes are an integral part of these financial statements.
12
DUFF & PHELPS GLOBAL UTILITY INCOME FUND INC.
FINANCIAL HIGHLIGHTS—SELECTED PER SHARE DATA AND RATIOS
The table below provides information about income and capital changes for a share of common stock outstanding throughout the periods indicated (excluding supplemental data provided below):
| | | | | | | | | | | | | | | | | | | | | | | | |
| | | For the
six months ended
April 30, 2017
(Unaudited) | | | For the year ended October 31, | |
| | | | 2016 | | | 2015 | | | 2014 | | | 2013 | | | 2012 | |
PER SHARE DATA: | | | | | | | | | | | | | | | | | | | | | | | | |
Net asset value, beginning of period | | | $18.45 | | | | $19.26 | | | | $24.36 | | | | $21.81 | | | | $19.46 | | | | $19.59 | |
| | | | | | | | | | | | | | | | | | | | | | | | |
Net investment income | | | 0.17 | | | | 0.67 | | | | 0.70 | | | | 0.92 | | | | 0.82 | | | | 0.96 | |
Net realized and unrealized gain (loss) | | | 0.78 | | | | (0.08 | ) | | | (4.40 | ) | | | 3.03 | | | | 2.93 | | | | 0.31 | |
| | | | | | | | | | | | | | | | | | | | | | | | |
Net increase (decrease) from investment operations applicable to common stock | | | 0.95 | | | | 0.59 | | | | (3.70 | ) | | | 3.95 | | | | 3.75 | | | | 1.27 | |
| | | | | | | | | | | | | | | | | | | | | | | | |
Distributions on common stock: | | | | | | | | | | | | | | | | | | | | | | | | |
Net investment income | | | (0.13 | ) | | | (0.49 | ) | | | (0.79 | ) | | | (1.03 | ) | | | (0.87 | ) | | | (0.93 | ) |
In excess of net investment income | | | (0.57 | ) | | | — | | | | — | | | | — | | | | — | | | | — | |
Net realized gain | | | — | | | | (0.51 | ) | | | (0.61 | ) | | | — | | | | — | | | | — | |
Return of capital | | | — | | | | (0.40 | ) | | | — | | | | (0.37 | ) | | | (0.53 | ) | | | (0.47 | ) |
| | | | | | | | | | | | | | | | | | | | | | | | |
Total distributions | | | (0.70 | ) | | | (1.40 | ) | | | (1.40 | ) | | | (1.40 | ) | | | (1.40 | ) | | | (1.40 | ) |
| | | | | | | | | | | | | | | | | | | | | | | | |
Net asset value, end of period | | | $18.70 | | | | $18.45 | | | | $19.26 | | | | $24.36 | | | | $21.81 | | | | $19.46 | |
| | | | | | | | | | | | | | | | | | | | | | | | |
Per share market value, end of period | | | $16.88 | | | | $15.78 | | | | $16.23 | | | | $21.92 | | | | $19.38 | | | | $18.35 | |
| | | | | | | | | | | | | | | | | | | | | | | | |
RATIOS TO AVERAGE NET ASSETS APPLICABLE TO COMMON STOCK: | | | | | | | | | | | | | | | | | | | | | | | | |
Net operating expenses(1) | | | 2.32 | %* | | | 2.16 | % | | | 1.68 | % | | | 1.55 | % | | | 1.60 | % | | | 1.69 | % |
Net operating expenses, without leverage(1) | | | 1.52 | %* | | | 1.49 | % | | | 1.35 | % | | | 1.26 | % | | | 1.23 | % | | | 1.25 | % |
Gross operating expenses(1) | | | 2.39 | %* | | | 2.28 | % | | | 1.86 | % | | | 1.79 | % | | | 1.92 | % | | | 2.03 | % |
Net investment income | | | 1.43 | %* | | | 3.67 | % | | | 3.18 | % | | | 4.02 | % | | | 4.04 | % | | | 4.99 | % |
| | | | | | |
SUPPLEMENTAL DATA: | | | | | | | | | | | | | | | | | | | | | | | | |
Total return on market value(2) | | | 11.62 | % | | | 6.26 | % | | | (20.19 | )% | | | 21.14 | % | | | 13.69 | % | | | 2.22 | % |
Total return on net asset value(2) | | | 5.22 | % | | | 3.19 | % | | | (15.50 | )% | | | 18.61 | % | | | 20.14 | % | | | 6.77 | % |
Portfolio turnover rate | | | 17 | % | | | 53 | % | | | 30 | % | | | 29 | % | | | 20 | % | | | 21 | % |
Asset coverage ratio on borrowings, end of period | | | 543 | % | | | 537 | % | | | 557 | % | | | 455 | % | | | 412 | % | | | 384 | % |
Asset coverage ratio on preferred stock, end of period | | | 373 | % | | | 369 | % | | | 381 | % | | | — | | | | — | | | | — | |
Net assets applicable to common stock, end of period (000’s omitted) | | | $709,433 | | | | $699,950 | | | | $730,504 | | | | $924,126 | | | | $827,071 | | | | $738,117 | |
| (1) | Net operating expenses reflect the operating expenses of the Fund after giving effect to the reimbursement that the Fund’s investment adviser has contractually agreed to provide, as further detailed in Note 3 to the financial statements. Gross operating expenses reflect the operating expenses of the Fund without giving effect to such reimbursement. |
| (2) | Total return on market value assumes a purchase of common stock at the opening market price on the first business day and a sale at the closing market price on the last business day of each period shown in the table and assumes reinvestment of dividends at the actual reinvestment prices obtained under the terms of the Fund’s Automatic Reinvestment and Cash Purchase Plan. Total return on net asset value uses the same methodology, but with use of net asset value for beginning, ending and reinvestment values. |
The accompanying notes are an integral part of these financial statements.
13
DUFF & PHELPS GLOBAL UTILITY INCOME FUND INC.
NOTES TO FINANCIAL STATEMENTS
April 30, 2017
(Unaudited)
Note 1. Organization
Duff & Phelps Global Utility Income Fund Inc. (the “Fund”) was incorporated under the laws of the State of Maryland on March 15, 2011. The Fund commenced operations on July 29, 2011, the date on which its initial public offering shares were issued, as a non-diversified closed-end management investment company registered under the Investment Company Act of 1940, as amended (the “1940 Act”). The Fund’s investment objective is to seek total return, resulting primarily from (i) a high level of current income, with an emphasis on providing tax-advantaged dividend income, and (ii) growth in current income, and secondarily from capital appreciation.
Note 2. Significant Accounting Policies
The following are the significant accounting policies of the Fund:
A. Investment Valuation: Equity securities traded on a national or foreign securities exchange or traded over-the-counter and quoted on the NASDAQ Stock Market are valued at the last reported sale price or, if there was no sale on the valuation date, then the security is valued at the closing bid price, in each case using valuation data provided by an independent pricing service, and are generally classified as Level 1. Equity securities traded on more than one securities exchange shall be valued at the last sale price on the business day as of which such value is being determined at the close of the exchange representing the principal market for such securities and are classified as Level 1. If there was no sale on the valuation date, then the security is valued at the closing bid price of the exchange representing the principal market for such securities. Exchange traded options are valued at the last posted settlement price on the market where such option is principally traded and are classified as Level 1. If an option is not traded on the day prior to the expiration date of the option and the option is out of the money, the option will be valued at $0 and is classified as Level 2. Any securities for which it is determined that market prices are unavailable or inappropriate are valued at a fair value using a procedure determined in good faith by the Board of Directors and are classified as Level 2 or 3 based on the valuation inputs.
B. Investment Transactions and Investment Income: Security transactions are recorded on the trade date. Realized gains and losses from sales of securities are determined on the identified cost basis. Dividend income is recognized on the ex-dividend date or, in the case of certain foreign securities, as soon as the Fund is notified. Interest income and expense are recognized on the accrual basis.
The Fund invests in master limited partnerships (“MLPs”) which make distributions that are primarily attributable to return of capital. Dividend income is recorded using management’s estimate of the percentage of income included in the distributions received from the MLP investments based on their historical dividend results. Distributions received in excess of this estimated amount are recorded as a reduction of cost of investments (i.e., a return of capital). The actual amounts of income and return of capital are only determined by each MLP after its fiscal year-end and may differ from the estimated amounts. For the six months ended April 30, 2017, the Fund estimated that 90.5% of the MLP distributions received would be treated as a return of capital.
C. Federal Income Taxes: It is the Fund’s intention to comply with requirements of Subchapter M of the Internal Revenue Code applicable to regulated investment companies and to distribute substantially all of its taxable income and capital gains to its shareholders. Therefore, no provision for Federal income or excise taxes is
14
DUFF & PHELPS GLOBAL UTILITY INCOME FUND INC.
NOTES TO FINANCIAL STATEMENTS—(Continued)
April 30, 2017
(Unaudited)
required. Management of the Fund has concluded that there are no significant uncertain tax positions that would require recognition in the financial statements. Since tax authorities can examine previously filed tax returns, the Fund’s tax returns for the tax years 2013 to 2016 are subject to review.
D. Foreign Currency Translation: Investment securities and other assets and liabilities denominated in foreign currencies are translated into U.S. dollar amounts at the foreign currency exchange rate effective at the end of the reporting period. Purchases and sales of investment securities and income and expense items denominated in foreign currencies are translated into U.S. dollar amounts at the rate of exchange prevailing on the respective dates of such transactions. The Fund does not isolate that portion of the results of operations resulting from changes in foreign exchange rates on investments from the fluctuations arising from changes in market prices of securities held. Such fluctuations are included with the net realized and unrealized gain or loss on investments.
E. Derivative Financial Instruments: Disclosures on derivative instruments and hedging activities are intended to improve financial reporting for derivative instruments by enhanced disclosure that enables the investors to understand how and why a fund uses derivatives, how derivatives are accounted for, and how derivative instruments affect a fund’s results of operations and financial position. Summarized below is a specific type of derivative instrument used by the Fund.
Options Transactions
The Fund is subject to equity price risk in the normal course of pursuing its investment objectives and is authorized to write (sell) covered call options, in an attempt to manage such risk and with the purpose of generating realized gains. A call option on a security is a contract that gives the holder of such call option the right to buy the security underlying the call option from the writer of such call option at a specified price (strike price) at any time during the term of the option. A covered call option is an option written on a security held by the Fund.
When a call option is written (sold), the Fund receives a premium (or call premium) from the buyer of such call option and records a liability to reflect its obligation to deliver the underlying security upon the exercise of the call option at the strike price.
Changes in the value of the written options are included in “Net change in unrealized appreciation (depreciation) on written options” on the Statement of Operations. “Net realized gain (loss) on written options” on the Statement of Operations will include the following: (a) premiums received from holders on options that have expired, and (b) the difference between the premium received and the amount paid to repurchase an open option, including any commission. Premiums from options exercised are added to the proceeds from the sale of the underlying security in order to determine the net realized gain or loss on the security.
F. Use of Estimates: The preparation of financial statements in conformity with U.S. generally accepted accounting principles requires management to make estimates and assumptions that affect the amounts reported in the financial statements and accompanying notes. Actual results could differ from those estimates.
15
DUFF & PHELPS GLOBAL UTILITY INCOME FUND INC.
NOTES TO FINANCIAL STATEMENTS—(Continued)
April 30, 2017
(Unaudited)
Note 3. Agreements and Management Arrangements
A. Adviser: The Fund has an Advisory Agreement with Duff & Phelps Investment Management Co. (the “Adviser” or “DPIM”), an indirect, wholly owned subsidiary of Virtus Investment Partners, Inc. (“Virtus”). The Adviser receives a monthly fee at an annual rate of 1.00% of Average Weekly Managed Assets, which is defined as the average weekly value of the total assets of the Fund minus the sum of all accrued liabilities of the Fund (other than the aggregate amount of any outstanding borrowings or other indebtedness constituting financial leverage).
The Adviser has contractually agreed to reimburse the Fund for certain expenses for a specified percentage of the Average Weekly Managed Assets as follows:
| | | | |
Period | | Rate | |
Year 1 | | | 0.25% | |
Year 2 | | | 0.25% | |
Year 3 | | | 0.20% | |
Year 4 | | | 0.15% | |
Year 5 | | | 0.10% | |
Year 6 | | | 0.05% | |
The reimbursement waiver period began upon completion of the Fund’s initial public offering on July 29, 2011, and the waiver percentage is adjusted on each anniversary of that date. The reimbursement period ends on July 29, 2017.
B. Administrator: The Fund has an Administration Agreement with Virtus Fund Services, LLC, an indirect, wholly owned subsidiary of Virtus (the “Administrator”). The Administrator receives a monthly fee at an annual rate of 0.10% of the average weekly net assets of the Fund.
C. Directors: The Fund pays each director not affiliated with the Adviser an annual fee. Total fees paid to directors for the six months ended April 30, 2017 were $80,024.
D. Affiliated Shareholder: At April 30, 2017, Virtus Partners, Inc. (a wholly owned subsidiary of Virtus) held 7,785 shares of the Fund, which represent 0.02% of shares of common stock outstanding. These shares may be sold at any time.
Note 4. Investment Transactions
Purchases and sales of investment securities (excluding short-term investments) for the six months ended April 30, 2017 were $164,697,446 and $192,090,042, respectively.
Note 5. Derivatives Transactions
The Fund’s investments in derivatives may represent economic hedges; however, they are not considered to be hedge transactions for financial reporting purposes. For additional information on the derivative instruments in
16
DUFF & PHELPS GLOBAL UTILITY INCOME FUND INC.
NOTES TO FINANCIAL STATEMENTS—(Continued)
April 30, 2017
(Unaudited)
which the Fund was invested during the reporting period, refer to the Schedule of Investments and Note 2E above. During the six months ended April 30, 2017, the Fund wrote call options on individual stocks held in its portfolio of investments to enhance returns while forgoing some upside potential. The risk in writing call options is that the Fund gives up the opportunity for profit if the market price of the referenced security increases and the option is exercised. The Fund may also be exposed to counterparty credit risk with respect to options written to the extent that the Fund deposits collateral with its counterparty to a written option. All written options have a primary risk exposure of equity price associated with them.
The Fund had transactions in options written during the six months ended April 30, 2017 as follows:
| | | | | | | | |
| | | Number of
Contracts | | | Premium | |
Options outstanding at October 31, 2016 | | | — | | | | $— | |
Options written | | | 5,640 | | | | 335,953 | |
Options closed | | | — | | | | — | |
Options expired | | | — | | | | — | |
Options exercised | | | (5,640 | ) | | | (335,953 | ) |
| | | | | | | | |
Options outstanding at April 30, 2017 | | | — | | | | $— | |
| | | | | | | | |
The average premiums received for call options written during the six months ended April 30, 2017 were $321,828. The average premiums received amount is calculated based on the average daily premiums received for the six months ended April 30, 2017.
The following is a summary of the derivative activity reflected in the financial statements at April 30, 2017 and for the six months then ended:
| | | | | | | | | | |
| Statement of Assets and Liabilities | | | Statement of Operations | |
Assets: None | | | $— | | | Net realized gain (loss) on written options | | | $— | |
| | | | |
Liabilities: Written call options at value | | | — | | | Net change in unrealized appreciation
(depreciation) on written options | | | — | |
| | | | |
Net asset (liability) balance | | | $— | | | Total net realized and unrealized gain (loss) | | | $— | |
Note 6. Distributions and Tax Information
At October 31, 2016, the federal tax cost and aggregate gross unrealized appreciation (depreciation) were as follows:
| | | | | | | | | | | | | | | | |
| | | Federal
Tax Cost | | | Unrealized
Appreciation | | | Unrealized
Depreciation | | | Net Unrealized
Appreciation | |
Investments | | | $862,532,332 | | | | $159,321,971 | | | | $(66,181,114 | ) | | | $93,140,857 | |
17
DUFF & PHELPS GLOBAL UTILITY INCOME FUND INC.
NOTES TO FINANCIAL STATEMENTS—(Continued)
April 30, 2017
(Unaudited)
The difference between the book basis and tax basis of unrealized appreciation (depreciation) and cost of investments is primarily attributable to investments in MLPs.
The Fund declares and pays quarterly distributions on its common shares of a stated amount per share. Subject to approval and oversight by the Fund’s Board of Directors, the Fund seeks to maintain a stable distribution level (a Managed Distribution Plan) consistent with the Fund’s primary investment objective. If and when sufficient investment income is not available on a quarterly basis, the Fund will distribute long-term capital gains and/or return capital in order to maintain the $0.35 per common share distribution level. The amount and timing of distributions are determined in accordance with federal tax regulations, which may differ from U.S. generally accepted accounting principles.
The tax character of distributions paid to common shareholders during the year ended October 31, 2016 was as follows:
| | | | |
| | | 2016 | |
| Distributions paid from: | | | | |
Ordinary income | | $ | 18,788,477 | |
Long term capital gains | | | 19,248,224 | |
Return of capital | | | 15,065,027 | |
| | | | |
Total distributions | | $ | 53,101,728 | |
| | | | |
The tax character of distributions paid in 2017 will be determined at the Fund’s fiscal year end October 31, 2017.
Note 7. Floating Rate Mandatory Redeemable Preferred Shares:
In 2015, the Fund issued 4,000,000 Floating Rate Mandatory Redeemable Preferred Shares (“MRP Shares”) in three series each with a liquidation preference of $25.00 per share. Proceeds from the issuances were used to reduce the size of the Fund’s credit facility.
Key terms of each series of MRP Shares at April 30, 2017 are as follows:
| | | | | | | | | | | | | | | | | | | | |
Series | | Shares
Outstanding | | | Liquidation
Preference | | Quarterly Rate
Reset | | Rate | | | Six Month
Weighted Daily
Average Rate | | | Mandatory
Redemption
Date | |
A | | | 800,000 | | | $20,000,000 | | 3M LIBOR + 1.85% | | | 3.00 | % | | | 2.82 | % | | | 8/24/2020 | |
B | | | 1,600,000 | | | 40,000,000 | | 3M LIBOR + 1.90% | | | 3.05 | % | | | 2.87 | % | | | 8/24/2022 | |
C | | | 1,600,000 | | | 40,000,000 | | 3M LIBOR + 1.95% | | | 3.10 | % | | | 2.92 | % | | | 8/24/2025 | |
| | | | | | | | | | | | | | | | | | | | |
Total | | | 4,000,000 | | | $100,000,000 | | | | | | | | | | | | | | |
| | | | | | | | | | | | | | | | | | | | |
18
DUFF & PHELPS GLOBAL UTILITY INCOME FUND INC.
NOTES TO FINANCIAL STATEMENTS—(Continued)
April 30, 2017
(Unaudited)
The Fund incurred costs in connection with the issuance of the MRP Shares. These costs were recorded as a deferred charge and are being amortized over the respective life of each series of MRP Shares. Amortization of these deferred offering costs of $89,931 is included under the caption “Interest expense and amortization of deferred offering costs on preferred shares” on the Statement of Operations and the unamortized balance is deducted from the carrying amount of the MRP Shares under the caption “Floating rate mandatory redeemable preferred shares” on the Statement of Assets and Liabilities.
Holders of the MRP Shares are entitled to receive quarterly cumulative cash dividend payments on the first business day following each quarterly dividend date which is the last day of each of March, June, September and December.
MRP Shares are subject to optional and mandatory redemption by the Fund in certain circumstances. The redemption price per share is equal to the sum of the liquidation preference per share plus any accumulated but unpaid dividends plus, in some cases, an early redemption premium (which varies based on the date of redemption). The MRPS are not listed on any exchange or automated quotation system. The fair value of the MRP Shares is estimated to be their liquidation preference. The MRPS are categorized as Level 2 within the fair value hierarchy. The Fund is subject to certain restrictions relating to the MRP Shares such as maintaining certain asset coverage, effective leverage ratio and overcollateralization ratio requirements. Failure to comply with these restrictions could preclude the Fund from declaring any distributions to common shareholders and could trigger the mandatory redemption of the MRP Shares at liquidation value.
In general, the holders of the MRP Shares and of the Common Stock have equal voting rights of one vote per share. The holders of the MRP Shares are entitled to elect two members of the Board of Directors, and separate class votes are required on certain matters that affect the respective interests of the MRP Shares and the Common Stock.
Note 8. Secured Borrowings
The Fund has a Credit Agreement (the “Agreement”) with a commercial bank (the “Bank”) that allows the Fund to borrow cash from the Bank, up to a limit of $210,000,000. Borrowings under the Agreement are collateralized by investments of the Fund. Interest is charged at LIBOR (London Interbank Offered Rate) plus an additional percentage rate on the amount borrowed and on the undrawn balance if the amount borrowed falls below 75% of the limit (the commitment fee). There were no commitment fees paid for the six months ended April 30, 2017. The Agreement is renewable and can also be converted to a 1-year fixed term facility. The Bank has the ability to require repayment of outstanding borrowings under the Agreement upon certain circumstances such as an event of default. For the six months ended April 30, 2017, average daily borrowings under the Agreement and the weighted daily average interest rate were $160,000,000 and 1.57%, respectively. At April 30, 2017, the Fund had outstanding borrowings of $160,000,000 at a rate of 1.82% for a one-month term.
19
DUFF & PHELPS GLOBAL UTILITY INCOME FUND INC.
NOTES TO FINANCIAL STATEMENTS—(Continued)
April 30, 2017
(Unaudited)
Note 9. Indemnifications
Under the Fund’s organizational documents, its officers and directors are indemnified against certain liabilities arising out of the performance of their duties to the Fund. In addition, in the normal course of business, the Fund enters into contracts that provide general indemnifications to other parties. The Fund’s maximum exposure under these arrangements is unknown as this would involve future claims that may be made against the Fund that have not occurred. However, the Fund has not had prior claims or losses pursuant to these arrangements and expects the risk of loss to be remote.
Note 10. Recent Accounting Pronouncement
On October 13, 2016, the Securities and Exchange Commission amended existing rules intended to modernize reporting and disclosure of certain information for regulated investment companies. Certain of these amendments relate to Regulation S-X which sets forth the requisite form and content of financial statements of the Fund. At this time, management is evaluating the implications of adopting these amendments and their impact on the financial statements and accompanying notes.
Note 11. Subsequent Events
Management has evaluated the impact of all subsequent events on the Fund through the date the financial statements were issued, and has determined that there were no subsequent events requiring recognition or disclosure in these financial statements.
20
RENEWAL OF INVESTMENT ADVISORY AGREEMENT
Under Section 15(c) of the Investment Company Act of 1940 (the “1940 Act”), the terms of the Fund’s investment advisory agreement must be reviewed and approved at least annually by the Board of Directors of the Fund (the “Board”), including a majority of the directors who are not “interested persons” of the Fund, as defined in section 2(a)(19) of the 1940 Act (the “Independent Directors”). Section 15(c) of the 1940 Act also requires the Fund’s directors to request and evaluate, and the Fund’s investment adviser to furnish, such information as may reasonably be necessary to evaluate the terms of the investment advisory agreement. To assist the Board with this responsibility, the Board has appointed a Contracts Committee, which is composed of the Independent Directors of the Fund and acts under a written charter that was most recently amended on December 17, 2015. A copy of the charter is available on the Fund’s website at www.dpgfund.com and in print to any shareholder, upon request.
The Contracts Committee, assisted by the advice of independent legal counsel, conducted an annual review of the terms of the Fund’s contractual arrangements, including the investment advisory agreement with Duff & Phelps Investment Management Co. (the “Adviser”). Set forth below is a description of the Contracts Committee’s annual review of the Fund’s investment advisory agreement, which provided the material basis for the Board’s decision to continue the investment advisory agreement.
In the course of the Contracts Committee’s review, the members of the Contracts Committee considered all of the information they deemed appropriate, including informational materials furnished by the Adviser in response to a request made by independent counsel on behalf of the Contracts Committee. In arriving at its recommendation that continuation of the investment advisory agreement was in the best interests of the Fund and its shareholders, the Contracts Committee took into account all factors that it deemed relevant, without identifying any single factor or group of factors as all-important or controlling. Among the factors considered by the Contracts Committee, and the conclusion reached with respect to each, were the following:
Nature, extent, and quality of services. The Contracts Committee considered the nature, extent and quality of the services provided to the Fund by the Adviser. Among other materials, the Adviser furnished the Contracts Committee with a copy of its most recent investment adviser registration form (Form ADV). In evaluating the quality of the Adviser’s services, the Contracts Committee noted the various complexities involved in the operations of the Fund, such as the use of multiple forms of leverage (preferred stock and borrowings under a credit facility), and concluded that the Adviser is consistently providing high-quality services to the Fund in an increasingly complex environment. The Contracts Committee also considered the length of service of the individual professional employees of the Adviser who provide services to the Fund. In the Contracts Committee’s view, the long-term service of capable and conscientious professionals provides a significant benefit to the Fund and its shareholders. The Contracts Committee also considered the Fund’s investment performance as discussed below. The Contracts Committee also took into account its evaluation of the quality of the Adviser’s code of ethics and compliance program. In light of the foregoing, the Contracts Committee concluded that it was generally satisfied with the nature, extent and quality of the services provided to the Fund by the Adviser.
Investment performance of the Fund and the Adviser. The Contracts Committee reviewed the Fund’s investment performance over time and compared that performance to other funds in its peer group. In making its comparisons, the Contracts Committee utilized data provided by the Adviser and a report from Broadridge (“Broadridge”), an independent provider of investment company data. The Adviser provided the Contracts Committee with performance information for the Fund since the Fund’s inception in 2011 and for the 1- and 3-year periods ended June 30, 2016, measured against two benchmarks: the Broadridge Sector Peer Group Average (leveraged closed-end equity funds selected by Broadridge) and a composite of the MSCI U.S. Utilities
21
Index, the MSCI World ex U.S. Utilities Index, the MSCI World Telecom Services Index, and the Alerian MLP Index, weighted to reflect the Fund’s investments in the relevant sectors covered by those indices (the “Composite Benchmark”). The Contracts Committee noted that, for the 1- and 3-year periods ended June 30, 2016, and since the Fund’s inception, the Fund’s net asset value (“NAV”) total return and its market value total return each underperformed the Broadridge Sector Peer Group Average. The Contracts Committee also noted that, for the same periods, the Fund’s NAV total return outperformed the Composite Benchmark, and that the Fund’s market value total return outperformed the Composite Benchmark for the 1- and 3-year periods but underperformed it for the period since inception.
The Contracts Committee further considered that because current income is one of the components of Fund’s investment objective of total return, it was relevant to consider the Fund’s distribution rate as compared to the Composite Benchmark and its component indices. The Contracts Committee noted that, based on data provided by the Adviser, as of June 30, 2016, the Fund’s distribution rate, calculated on both an NAV and market value basis, exceeded the yield of the Composite Benchmark and each component of the Composite Benchmark (except that the Fund’s NAV distribution rate trailed the Alerian MLP Index), and also exceeded the yield of the broader markets, as represented by the S&P 500 Index and the Dow Jones Industrial Average. The Contracts Committee noted that the Fund’s managed distribution plan, adopted in 2015, provides for the Fund to distribute all available investment income to shareholders and, if sufficient investment income is not available on a quarterly basis, to distribute long-term capital gains and/or return capital to its shareholders in order to maintain the 35 cent per share quarterly distribution level.
Costs of services and profits realized. The Contracts Committee considered the reasonableness of the compensation paid to the Adviser, in both absolute and comparative terms, and also the profits realized by the Adviser and its affiliates from its relationship with the Fund. To facilitate this analysis, the Contracts Committee retained Broadridge to furnish a report comparing the Fund’s management fee (defined as the sum of the advisory fee and administration fee) and other expenses to the similar expenses of other utility funds selected by Broadridge (the “Broadridge expense group”). The Contracts Committee reviewed, among other things, information provided by Broadridge comparing the Fund’s contractual management fee rate (at common asset levels) and actual management fee rate (reflecting fee waivers, if any) as a percentage of total assets and as a percentage of assets attributable to common stock to other funds in its Broadridge expense group. Based on the data provided on management fee rates, the Contracts Committee noted that: (i) the Fund’s contractual management fee rate at a common asset level was higher than the median of its Broadridge expense group; (ii) the actual total expense rate was lower than the median of its Broadridge expense group both on the basis of assets attributable to common stock and on a total assets basis; and (iii) the actual management fee rate was lower than the median of its Broadridge expense group on the basis of assets attributable to common stock, but higher than the median on a total asset basis. The Committee also considered the Adviser’s willingness to agree to contractually to reimburse the Fund for certain expenses—in effect offsetting a portion of the advisory fee—during the first six years of the Fund’s operations (see Note 3 to Financial Statements above).
The Adviser also furnished the Contracts Committee with copies of its financial statements, and the financial statements of its parent company, Virtus Investment Partners, Inc. The Adviser also provided information regarding the revenue and expenses related to its management of the Fund, and the methodology used by the Adviser in allocating such revenue and expenses among its various clients. In reviewing those financial statements and other materials, the Contracts Committee examined the profitability of the investment advisory agreement to the Adviser and determined that the profitability of that contract was reasonable in light of the services rendered to the Fund. The Contracts Committee considered that the Adviser must be able to compensate its employees at
22
competitive levels in order to attract and retain high-quality personnel to provide high-quality service to the Fund. The Contracts Committee concluded that the investment advisory fee was the product of arm’s length bargaining and that it was fair and reasonable to the Fund.
Economies of scale. The Contracts Committee considered whether the Fund has appropriately benefited from any economies of scale. The Contracts Committee noted that the Fund was currently benefiting from a fee waiver. The Contracts Committee encouraged the Adviser to continue to work towards reducing costs by leveraging relationships with service providers across the complex of funds advised by the Adviser.
Comparison with other advisory contracts. The Contracts Committee also received comparative information from the Adviser with respect to its standard fee schedules for investment advisory clients other than the Fund. The Contracts Committee noted that, among all accounts managed by the Adviser, the Fund’s advisory fee rate is higher than the Adviser’s standard fee schedule. However, the Contracts Committee noted that the services provided by the Adviser to the Fund are significantly more extensive and demanding than the services provided by the Adviser to its non-investment company, institutional accounts. Specifically, in providing services to the Fund, the Contracts Committee considered that the Adviser needs to: (1) comply with the 1940 Act, the Sarbanes-Oxley Act and other federal securities laws and New York Stock Exchange requirements, (2) provide for external reporting (including quarterly and semi-annual reports to shareholders, annual audited financial statements and disclosure of proxy voting), tax compliance and reporting (which are particularly complex for investment companies), requirements of Section 19 of the 1940 Act relating to the source of distributions, (3) prepare for and attend meetings of the Board and its committees, (4) communicate with Board and committee members between meetings, (5) communicate with a retail shareholder base consisting of thousands of investors, (6) manage the use of financial leverage and respond to changes in the financial markets and regulatory environment that could affect the amount and type of the Fund’s leverage and (7) respond to unanticipated issues in the financial markets or regulatory environment that can impact the Fund. Based on the fact that the Adviser only provides the foregoing services to its investment company clients and not to its institutional account clients, the Contracts Committee concluded that the management fees charged to the Fund are reasonable compared to those charged to other clients of the Adviser, when the nature and scope of the services provided to the Funds are taken into account. Furthermore, the Contracts Committee noted that many of the Adviser’s other clients would not be considered “like accounts” of the Fund because these accounts are not of similar size and do not have the same investment objectives as, or possess other characteristics similar to, the Fund.
Indirect benefits. The Contracts Committee considered possible sources of indirect benefits to the Adviser from its relationship to the Fund, including brokerage and soft dollar arrangements. In this regard, the Contracts Committee noted that the Fund does not utilize affiliates of the Adviser for brokerage purposes, that the Adviser does not use third-party soft dollar arrangements and that the Adviser has continued to seek opportunities to reduce brokerage costs borne by the Fund.
Conclusion. Based upon its evaluation of all material factors, including the foregoing, and assisted by the advice of independent legal counsel, the Contracts Committee concluded that the continued retention of the Adviser as investment adviser to the Fund was in the best interests of the Fund and its shareholders. Accordingly, the Contracts Committee recommended to the full Board that the investment advisory agreement with the Adviser be continued for a one-year term ending March 1, 2018. On December 15, 2016, the Contracts Committee presented its recommendations, and the criteria on which they were based, to the full Board, whereupon the Board, including all of the Independent Directors voting separately, accepted the Contracts Committee’s recommendations and unanimously approved the continuation of the current investment advisory agreement with the Adviser for a one-year term ending March 1, 2018.
23
INFORMATION ABOUT PROXY VOTING BY THE FUND (Unaudited)
The Fund’s Board of Directors has adopted proxy voting policies and procedures. These proxy voting policies and procedures may be changed at any time by the Fund’s Board of Directors. A description of the policies and procedures that the Fund uses to determine how to vote proxies relating to portfolio securities is available without charge, upon request, by calling Fund Services toll-free at (866) 270-7598 or is available on the Fund’s website at www.dpgfund.com or on the SEC’s website at www.sec.gov.
Information regarding how the Fund voted proxies relating to portfolio securities during the most recent 12 month period ended June 30 is available without charge, upon request, by calling Fund Services toll-free at (866) 270-7598 or is available on the Fund’s website at www.dpgfund.com or on the SEC’s website at www.sec.gov.
INFORMATION ABOUT THE FUND’S PORTFOLIO HOLDINGS (Unaudited)
The Fund files its complete schedule of portfolio holdings with the SEC for the first and third fiscal quarters of each fiscal year (quarters ended January 31 and July 31) on Form N-Q. The Fund’s Form N-Q is available on the SEC’s website at www.sec.gov and may be reviewed and copied at the SEC’s Public Reference Room in Washington D.C. Information on the operation of the SEC’s Public Reference Room may be obtained by calling (800) 732-0330. In addition, the Fund’s Form N-Q is available without charge, upon request, by calling Fund Services toll-free at (866) 270-7598 or is available on the Fund’s website at www.dpgfund.com.
ADDITIONAL INFORMATION (Unaudited)
Notice is hereby given in accordance with Section 23(c) of the 1940 Act that the Fund may from time to time purchase its shares of common stock in the open market.
REPORT ON ANNUAL MEETING OF SHAREHOLDERS (Unaudited)
The Annual Meeting of Shareholders of the Fund was held on March 14, 2017. The following is a description
of each matter voted upon at the meeting and the number of votes cast on each matter:
| | | | | | | | |
| | | Shares
Voted For | | | Shares
Withheld | |
1. Election of directors* | | | | | | | | |
| Director elected by the holders of the Fund’s common and preferred stock to serve until the Annual Meeting in the year 2020 or until their successor is duly elected and qualified: | | | | | | | | |
David J. Vitale | | | 37,379,805 | | | | 506,443 | |
| | |
| Director elected by the holders of the Fund’s preferred stock to serve until the Annual Meeting in the year 2020 or until their successor is duly elected and qualified: | | | | | | | | |
Geraldine M. McNamara | | | 4,000,000 | | | | — | |
| * | Directors whose term of office continued beyond this meeting are as follows: Donald C. Burke, Robert J. Genetski, Clifford W. Hoffman, Philip R. McLoughlin, Eileen A. Moran and Nathan I. Partain. |
24
Board of Directors
DAVID J. VITALE
Chairman
DONALD C. BURKE
ROBERT J. GENETSKI
CLIFFORD W. HOFFMAN
PHILIP R. MCLOUGHLIN
GERALDINE M. MCNAMARA
EILEEN A. MORAN
NATHAN I. PARTAIN, CFA
Officers
NATHAN I. PARTAIN, CFA
President and Chief Executive Officer
DANIEL J. PETRISKO, CFA
Senior Vice President and Assistant Secretary
ERIC ELVEKROG, CFA, CPA
Vice President and Chief Investment Officer
ALAN M. MEDER, CFA, CPA
Treasurer and Assistant Secretary
JOYCE B. RIEGEL
Chief Compliance Officer
WILLIAM J. RENAHAN
Vice President and Secretary
W. PATRICK BRADLEY, CPA
Vice President and Assistant Treasurer
JACQUELINE M. PORTER
Vice President and Assistant Treasurer
Duff & Phelps Global Utility Income Fund Inc.
Common stock listed on the New York Stock Exchange under the symbol DPG
Shareholder inquiries please contact:
Fund Services at (866) 270-7598 or
Email at Duff@virtus.com
Investment Adviser
Duff & Phelps Investment Management Co.
200 South Wacker Drive, Suite 500
Chicago, IL 60606
(312) 368-5510
Administrator
Virtus Fund Services, LLC
100 Pearl Street
Hartford, CT 06103-4506
Transfer Agent and Dividend Disbursing Agent
Computershare Trust Company, N.A.
P.O. Box 43078
Providence, RI 02940-3078
Custodian
The Bank of New York Mellon
Legal Counsel
Mayer Brown LLP
Independent Registered Public Accounting Firm
Ernst & Young LLP
Not applicable.
| Item 3. | Audit Committee Financial Expert. |
Not applicable.
| Item 4. | Principal Accountant Fees and Services. |
Not applicable.
| Item 5. | Audit Committee of Listed Registrants. |
Not applicable.
Included as part of the report to stockholders filed under Item 1 of this report.
| Item 7. | Disclosure of Proxy Voting Policies and Procedures for Closed-End Management Investment Companies. |
Not applicable.
| Item 8. | Portfolio Managers of Closed-End Management Investment Companies. |
Not applicable.
| Item 9. | Purchases of Equity Securities by Closed-End Management Investment Company and Affiliated Purchasers. |
During the period covered by this report, no purchases were made by or on behalf of the registrant or any “affiliated purchaser” (as defined in Rule 10b-18(a)(3) under the Exchange Act of 1934 (“the “Exchange Act”)) of shares or other units of any class of the registrant’s equity securities that is registered by the registrant pursuant to Section 12 of the Exchange Act.
| Item 10. | Submission of Matters to a Vote of Security Holders. |
No changes to the procedures by which shareholders may recommend nominees to the registrant’s board of directors have been implemented after the registrant last provided disclosure in response to the requirements of Item 22(b)(15) of Schedule 14A (i.e., in the registrant’s proxy statement dated January 30, 2017 or this Item.
| Item 11. | Controls and Procedures. |
| | (a) | The registrant’s principal executive officer and principal financial officer have concluded that the registrant’s disclosure controls and procedures (as defined in Rule 30a-3(c) under the Investment Company Act of 1940 (the “1940 Act”)) are effective, based on an evaluation of those controls and procedures made as of a date within 90 days of the filing date of this report as required by Rule 30a-3(b) under the 1940 Act and Rule 13a-15(b) under the Exchange Act. |
| | (b) | There has been no change in the registrant’s internal control over financial reporting (as defined in Rule 30a-3(d) under the 1940 Act) that occurred during the second fiscal quarter of the period covered by this report that has materially affected, or is reasonably likely to materially affect, the registrant’s internal control over financial reporting. |
| | | | | | |
| (a) | | Exhibit 99.CERT | | Certifications pursuant to Section 302 of the Sarbanes-Oxley Act of 2002 | | |
| | | |
| (b) | | Exhibit 99.906CERT | | Certifications pursuant to Section 906 of the Sarbanes-Oxley Act of 2002 | | |
| | | |
| (c) | | Exhibit 99(c) | | Copies of the Registrant’s notices to shareholders pursuant to Rule 19a-1 under the 1940 Act which accompanied distributions paid during the period ended April 30, 2017 pursuant to the Registrant’s Managed Distribution Plan are filed herewith as required by the terms of the Registrant’s exemptive order issued on August 26, 2008. | | |
SIGNATURES
Pursuant to the requirements of the Securities Exchange Act of 1934 and the Investment Company Act of 1940, the registrant has duly caused this report to be signed on its behalf by the undersigned, thereunto duly authorized.
| | |
| (Registrant) | | Duff & Phelps Global Utility Income Fund Inc. |
| | |
| |
| By (Signature and Title) | | /s/ Nathan I. Partain |
| | Nathan I. Partain, President and Chief Executive Officer |
| | (Principal Executive Officer) |
Pursuant to the requirements of the Securities Exchange Act of 1934 and the Investment Company Act of 1940, this report has been signed below by the following persons on behalf of the registrant and in the capacities and on the dates indicated.
| | |
| By (Signature and Title) | | /s/ Nathan I. Partain |
| | Nathan I. Partain, President and Chief Executive Officer |
| | (Principal Executive Officer) |
| | |
| |
| By (Signature and Title) | | /s/ Alan M. Meder |
| | Alan M. Meder, Treasurer and Assistant Secretary |
| | (Principal Financial Officer) |