POSTMEDIA NETWORK CANADA CORP.
INTERIM MANAGEMENT’S DISCUSSION AND ANALYSIS
FOR THE THREE MONTHS ENDED NOVEMBER 30, 2012 AND 2011
Issued: January 10, 2013
MANAGEMENT’S DISCUSSION AND ANALYSIS
This management’s discussion and analysis of financial condition and results of operations of Postmedia Network Canada Corp. and its subsidiary Postmedia Network Inc. (collectively, “we”, “our”, “us”, or “Postmedia”) should be read in conjunction with the interim condensed consolidated financial statements and related notes of Postmedia for the three months ended November 30, 2012 and 2011 and the annual audited consolidated financial statements and related notes of Postmedia for the years ended August 31, 2012 and 2011. The interim condensed consolidated financial statements of Postmedia for the three months ended November 30, 2012 and 2011 and the annual audited consolidated financial statements of Postmedia for the years ended August 31, 2012 and 2011 are available on SEDAR at www.sedar.com and on the EDGAR system maintained by the U.S. Securities and Exchange Commission at www.sec.gov.
This discussion contains statements that are not historical facts and are forward-looking statements. These statements are subject to a number of risks described in the section entitled “Risk Factors” contained in our annual management’s discussion and analysis for the years ended August 31, 2012 and 2011. Risks and uncertainties may cause actual results to differ materially from those contained in such forward-looking statements. Such statements reflect management’s current views and are based on certain assumptions. They are only estimates of future developments, and actual developments may differ materially from these statements due to a number of factors. Investors are cautioned not to place undue reliance on such forward-looking statements. No forward-looking statement is a guarantee of future results. We have tried, where possible, to identify such statements by using words such as “believe”, “expect”, “estimate”, “anticipate”, “will”, “could” and similar expressions in connection with any discussion of future operating or financial performance. Except as required by law, we undertake no obligation to publicly update or revise any forward-looking statements or information, whether written or oral, that may be as a result of new information, future events or otherwise.
All amounts are expressed in Canadian dollars unless otherwise noted. The interim condensed consolidated financial statements of Postmedia for the three months ended November 30, 2012 and 2011 have been prepared in accordance with International Financial Reporting Standards (“IFRS”) and International Accounting Standard (“IAS”) 34 – Interim Financial Reporting. In certain aspects US Generally Accepted Accounting Principles as applied in the United States (“US GAAP”) differ from IFRS. See “Differences between IFRS and US GAAP”.
This management’s discussion and analysis is dated January 10, 2013 and does not reflect changes or information subsequent to this date. Additional information in respect of Postmedia is available on SEDAR at www.sedar.com and EDGAR at www.sec.gov.
Additional IFRS Measures
We use operating income before depreciation, amortization and restructuring, as presented in the interim condensed consolidated statement of operations for the three months ended November 30, 2012 and 2011 and described in note 3 thereto, to assist in assessing our financial performance. Management and the Board of Directors of Postmedia use this measure to evaluate consolidated operating results as well as the results of its segments and to assess Postmedia’s ability to incur and service debt. In addition, this measure is used to make operating decisions as it is an indicator of how much cash is being generated by Postmedia and assists in determining the need for additional cost reductions, evaluation of personnel and resource allocation decisions. Operating income before depreciation, amortization and restructuring is referred to as an additional IFRS measure and may not be comparable to similar measures presented by other companies.
Overview and Background
We are the largest publisher of paid daily newspapers by circulation in Canada, according to the Newspapers Canada 2011 Circulation Data Report. Our English-language paid daily newspapers have, in total, the highest weekly print readership when compared to the total weekly print readership of English-language paid dailies belonging to each of the other media organizations in Canada, based on the NADbank 2011 survey data. Our business consists of news and information gathering and dissemination operations, with products offered in major Canadian markets and a number of regional and local markets in Canada through a variety of print, web, tablet and smartphone platforms. The combination of these distribution platforms provides readers with a variety of mediums through which to access and interact with our content. The breadth of our reach and the diversity of our content enable advertisers to reach their target audiences on a local, regional or national scale through the convenience of a single provider.
We have one reportable segment for financial reporting purposes, the Newspaper segment. The Newspaper segment publishes daily and non-daily newspapers and operates the related newspaper websites. Its revenue is primarily from advertising and circulation. Postmedia has other business activities and an operating segment which is not separately reportable and are referred to collectively as the All other category. Revenue in the All other category primarily consists of subscription revenue from Infomart and advertising revenue from the website canada.com.
Recent developments
On June 26, 2012, we entered into an agreement of purchase and sale to sell the land and building located at 1450 Don Mills Road in Don Mills, Ontario for gross proceeds of $24 million. The sale closed on October 12, 2012. On November 12, 2012, the net proceeds from the sale were used for a mandatory redemption of $23.2 million aggregate principal amount of 8.25% Senior Secured Notes due 2017 (“First-Lien Notes”) at par in accordance with the terms and conditions of the First-Lien Notes indenture.
The issuance of the First-Lien Notes in August 2012 and subsequent repayment of the then outstanding Senior Secured Term Loan Credit Facility (“Term Loan Facility”), gave rise to a potential termination event under our existing foreign currency interest rate swap associated with the 12.5% Senior Secured Notes due 2017 (“Second-Lien Notes”). As a result, in September 2012, we settled a notional amount of US$97.5 million of the foreign currency interest rate swap for a cash payment of $9.6 million.
Key Factors Affecting Operating Results
Revenue is earned primarily from advertising, circulation and digital sources. Print advertising revenue is a function of the volume, or linage, of advertising sold and rates charged. Print circulation revenue is derived from home-delivery subscriptions for newspapers, single copy sales at retail outlets and vending machines and is a function of the number of newspapers sold and the price per copy. Digital revenue is comprised of revenue from national and local display advertising on our newspaper and other websites, including canada.com, revenue from e-Papers and digital access subscriptions and subscription revenue generated through Infomart, our media monitoring website.
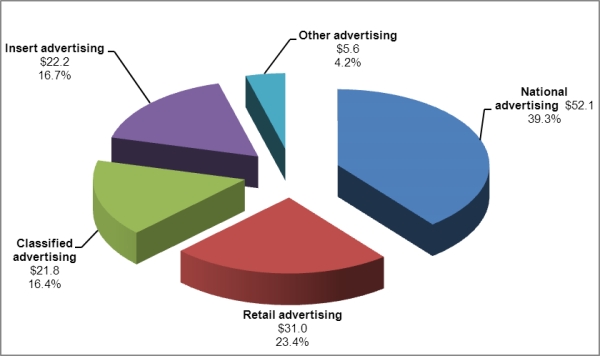
Print advertising revenue was $132.7 million for the three months ended November 30, 2012, representing 62.7% of total revenue. The following chart summarizes our print advertising revenue by category for the three months ended November 30, 2012 ($ in millions):
Print advertising is influenced by the overall strength of the economy. In recent years and continuing to date, the economic uncertainty and structural changes in the industry have resulted in significant declines in print advertising as well as a continuing shift in advertising dollars from print advertising to advertising in other formats, particularly online and other digital platforms such as search and social media websites. This shift may continue and may be permanent. We expect the print advertising market to remain challenging in fiscal 2013. As a result we are in the process of implementing a three year business transformation project that is expected to significantly reduce operating costs and focus on the development of our digital products. During the three months ended November 30, 2012, we experienced print advertising revenue declines of 11.1%, as compared to the same period in the prior year. The decline in print advertising revenue in the three months ended November 30, 2012 primarily relates to weakness in the classified and national advertising categories which decreased 19.8% and 11.0%, respectively, as compared to the same period in the prior year.
Print circulation revenue was $49.3 million for the three months ended November 30, 2012, representing 23.3% of total revenue. Declines in circulation volumes have been experienced over the last few years and this trend continued in the three months ended November 30, 2012. Circulation volume decreases have been partially offset by price increases. We expect these trends to continue throughout the remainder of fiscal 2013. A portion of the print circulation volume decrease relates to the implementation of initiatives which include the elimination of publishing days and unprofitable circulation.
Digital revenue was $24.8 million for the three months ended November 30, 2012, representing 11.7% of total revenue. Digital revenues increased 9.7% in the three months ended November 30, 2012 as compared to the same period in the prior year. Increases in digital revenue are primarily a result of increases in local digital advertising revenue and digital revenue associated with Infomart, partially offset by declines in digital classified revenue. We continue to believe digital revenue represents a future growth opportunity for Postmedia and as a result are focused on various new products and initiatives in this area.
Our principal expenses consist of compensation, newsprint, and distribution. These comprised 51.0%, 7.4% and 17.3%, respectively, of total expenses for the three months ended November 30, 2012. We experienced declines in compensation, newsprint and distribution expenses of 4.8%, 17.3% and 13.8%, respectively, for the three months ended November 30, 2012, as compared to the same period in the prior year.
Restructuring and other items expense was $4.8 million for the three months ended November 30, 2012 and consists primarily of an expense related to changes made to an employee benefit plan as a result of an arbitrators ruling (the “Ruling”). Our estimate of the expenses related to the Ruling consist of a $3.5 million increase to the employee benefit plan liability and cash expenses of $0.4 million which are expected to be paid in fiscal 2013. As a result of the Ruling, we expect future cash contributions to this employee benefit plan to increase by approximately $0.2 million per year. Additionally, included in restructuring and other items are $0.9 million of severance costs, which include both involuntary terminations and voluntary buyouts. During the third quarter of fiscal 2012, we began implementing the initial phase of a three year business transformation project aimed at significantly reducing legacy newspaper infrastructure costs. As of November 30, 2012 we have implemented initiatives which will result in net annualized cost savings of approximately $42 million. Initiatives include the shutdown of Postmedia News, our former breaking news service, the centralization of editorial production services through Postmedia Editorial Services in Hamilton, Ontario, the streamlining of advertiser flyer insert operations, the cancellation of unprofitable Sunday editions, general staff reductions through voluntary and involuntary buyouts and the elimination of unprofitable circulation. These cost savings represent the initial phase of a three year business transformation program that, in total, is expected to result in net operating cost savings of 15% to 20%.
Our operating results are impacted by variations in the cost and availability of newsprint. Newsprint is the principal raw material used in the production of our daily newspapers and other print publications. It is a commodity that is generally subject to price volatility. We take advantage of the purchasing power that comes with the large volume of newsprint we purchase, as well as our proximity to paper mills across Canada, to minimize our total newsprint expense. Changes in newsprint prices can significantly affect our operating results. A $50 per tonne increase or decrease in the price of newsprint would be expected to affect our newsprint expense by approximately $4.0 million on an annualized basis. We don’t expect a material change in newsprint prices throughout the first half of fiscal 2013.
Our distribution is primarily outsourced to third party suppliers. The key drivers of our distribution costs are fuel costs and circulation and insert volumes. Our distribution costs have decreased during the three months ended November 30, 2012 as a result of decreased circulation and insert volumes.
Other Factors
Seasonality
Revenue has experienced, and is expected to continue to experience, significant seasonality due to seasonal advertising patterns and seasonal influences on media consumption habits. Typically, our advertising revenue is highest in the first and third fiscal quarters, while expenses are relatively constant throughout the fiscal year. These seasonal variations may lead to increased borrowing needs at certain points within the fiscal year.
Critical accounting estimates
The preparation of financial statements in accordance with IFRS requires our management to make estimates and assumptions that affect the reported amounts of our assets, liabilities, revenues and expenses, as well as the disclosure of contingent assets and liabilities. Our management bases its estimates and judgements on historical experience and other factors that are believed to be reasonable under the circumstances. Actual results could differ from those estimates under different assumptions or conditions. There are no significant changes in our accounting estimates since August 31, 2012 as described in our annual management’s discussion and analysis and annual audited consolidated financial statements for the years ended August 31, 2012 and 2011.
Operating Results
Postmedia’s operating results for the three months ended November 30, 2012 as compared to the three months ended November 30, 2011
| | | | | | | |
| | | 2012 | | | 2011 | |
| | | | | | | |
| Revenues | | | | | | |
| Print advertising | | | 132,741 | | | | 149,368 | |
| Print circulation | | | 49,276 | | | | 54,269 | |
| Digital | | | 24,813 | | | | 22,622 | |
| Other | | | 4,842 | | | | 4,831 | |
| Total revenues | | | 211,672 | | | | 231,090 | |
| Expenses | | | | | | | | |
| Compensation | | | 82,948 | | | | 87,121 | |
| Newsprint | | | 12,108 | | | | 14,634 | |
| Distribution | | | 28,192 | | | | 32,705 | |
| Other operating | | | 39,318 | | | | 41,983 | |
| Operating income before depreciation, amortization, and restructuring | | | 49,106 | | | | 54,647 | |
| Depreciation | | | 6,890 | | | | 6,462 | |
| Amortization | | | 10,734 | | | | 11,021 | |
| Restructuring and other items | | | 4,797 | | | | 2,982 | |
| Operating income | | | 26,685 | | | | 34,182 | |
| Interest expense | | | 16,167 | | | | 16,837 | |
| Net financing expense relating to employee benefit plans | | | 383 | | | | 975 | |
| Loss on disposal of property and equipment | | | 268 | | | | - | |
| (Gain) loss on derivative financial instruments | | | 697 | | | | (10,040 | ) |
| Foreign currency exchange losses | | | 866 | | | | 12,132 | |
| Earnings before income taxes | | | 8,304 | | | | 14,278 | |
| Provision for income taxes | | | - | | | | - | |
| Net earnings from continuing operations | | | 8,304 | | | | 14,278 | |
| Net earnings from discontinued operations, net of tax of nil | | | - | | | | 14,053 | |
| Net earnings attributable to equity holders of the Company | | | 8,304 | | | | 28,331 | |
Revenue
Print advertising
Print advertising revenue decreased $16.6 million, or 11.1%, to $132.7 million for the three months ended November 30, 2012, as compared to the same period in the prior year. This decrease relates to most of our major categories of print advertising revenue, including decreases from national advertising of 11.0%, retail advertising of 7.7%, classified advertising of 19.8%, and insert advertising of 6.9%. The total print advertising linage and average line rate related to national, retail and classified advertising decreased 8.0% and 4.5% during the three months ended November 30, 2012, respectively, as compared to the same period in the prior year. Insert revenue decreases are primarily related to volume decreases of 5.9% during the three months ended November 30, 2012, as compared to the same period in the prior year.
Print circulation
Print circulation revenue decreased $5.0 million, or 9.2%, to $49.3 million for the three months ended November 30, 2012, as compared to the same period in the prior year. Net paid circulation decreased 10.5% for the three months ended November 30, 2012, as compared to the same period in the prior year and was partially offset by price increases. A portion of the print circulation revenue decrease relates to the implementation of initiatives which include the elimination of publishing days and unprofitable circulation.
Digital
Digital revenue increased $2.2 million, or 9.7%, to $24.8 million for the three months ended November 30, 2012, as compared to the same period in the prior year. Growth in digital revenue is primarily a result of increases in local digital advertising revenue of $2.4 million and digital revenue associated with Infomart of $0.5 million, partially offset by declines of $0.9 million in digital classified revenue.
Other
Other revenue increased nominally for the three months ended November 30, 2012, as compared to the same period in the prior year.
Expenses
Compensation
Compensation expenses decreased $4.2 million, or 4.8%, to $82.9 million for the three months ended November 30, 2012, as compared to the same period in the prior year. The decrease is primarily due to lower salary costs of $6.7 million, partially offset by increased share-based and other long-term incentive plans compensation expense of $2.1 million primarily as a result of an increase in the share price of our Class C voting shares which are used to compute the fair value of our other long-term incentive plan.
Newsprint
Newsprint expenses decreased $2.5 million, or 17.3%, to $12.1 million for the three months ended November 30, 2012, as compared to the same period in the prior year. Newsprint expense decreases are primarily a result of consumption decreases of 15.6% due to continued usage reduction efforts and lower newspaper circulation volumes, combined with a decrease in newsprint cost per tonne of 1.9%.
Distribution
Distribution expenses decreased $4.5 million, or 13.8%, to $28.2 million for the three months ended November 30, 2012, as compared to the same period in the prior year. Decreases in distribution expenses are primarily a result of a reduction in newspaper circulation volumes and the elimination of publishing days and unprofitable circulation.
Other operating
Other operating expenses decreased $2.7 million, or 6.3%, to $39.3 million for the three months ended November 30, 2012, as compared to the same period in the prior year. Decreases in other operating expenses are primarily a result of ongoing cost savings initiatives and include decreases in marketing and promotion costs, travel and entertainment costs and legal and audit related fees. Partially offsetting these decreases are increased news service costs as a result of the shutdown of Postmedia News and increases in rent and occupancy costs associated with new property operating leases.
Operating income before depreciation, amortization and restructuring
Operating income before depreciation, amortization and restructuring decreased $5.5 million, or 10.1%, to $49.1 million for the three months ended November 30, 2012, as compared to the same period in the prior year. The decrease relates primarily to decreases in revenue, partially offset by decreases in expenses as discussed above.
Depreciation
Depreciation increased $0.4 million, or 6.6%, to $6.9 million for the three months ended November 30, 2012, as compared to the same period in the prior year.
Amortization
Amortization decreased $0.3 million, or 2.6%, to $10.7 million for the three months ended November 30, 2012, as compared to the same period in the prior year.
Restructuring and other items
Restructuring and other items expense for the three months ended November 30, 2012 increased $1.8 million to $4.8 million as compared to the same period in the prior year. Restructuring and other items expense for the three months ended November 30, 2012 consists primarily of an expense related to changes made to an employee benefit plan as a result of a recent Ruling. Our estimate of the expenses related to the Ruling consist of a $3.5 million increase to the employee benefit plan liability and cash expenses of $0.4 million which are expected to be paid in fiscal 2013. As a result of the Ruling, we expect future cash contributions to this employee benefit plan to increase by approximately $0.2 million per year. Additionally, included in restructuring and other items are $0.9 million of severance costs, which include both involuntary terminations and voluntary buyouts. Restructuring and other items expense for the three months ended November 30, 2011 included $3.0 million related to severance costs, which include both involuntary terminations and voluntary buyouts.
Operating income
Operating income was $26.7 million for the three months ended November 30, 2012, compared to operating income of $34.2 million for the same period in the prior year, as a result of the factors described above.
Interest expense
Interest expense decreased $0.7 million, or 4.0%, to $16.2 million for the three months ended November 30, 2012, as compared to same period in the prior year. The decrease relates to an overall reduction in long-term debt as well as an acceleration of non-cash interest expense in the three months ended November 30, 2011 related to unamortized debt issuance costs due to a revised estimate of the expected future cash flows on the Term Loan Facility. Partially offsetting these decreases was an increase in interest expense due to an increase in the effective interest rate as a result of the refinancing on August 16, 2012.
Net financing expense relating to employee benefit plans
Net financing expense relating to employee benefit plans decreased $0.6 million to $0.4 million for the three months ended November 30, 2012, as compared to the same period in the prior year.
Loss on disposal of property and equipment
During the three months ended November 30, 2012, we disposed of property and equipment and realized a loss of $0.3 million.
(Gain) loss on derivative financial instruments
Loss on derivative financial instruments for the three months ended November 30, 2012 was $0.7 million as compared to a gain of $10.0 million during the same period in the prior year. The loss for the three months ended November 30, 2012 relates to the change in fair value of our variable prepayment option embedded derivatives on the First-Lien Notes and Second-Lien Notes. The gain for the three months ended November 30, 2011 included a gain of $3.3 million related to the change in fair value of our variable prepayment option embedded derivative on the Second-Lien Notes and a gain of $6.7 million related to the change in fair value of a fair value swap not designated as a hedge. There was no expense related to this fair value swap not designated as a hedge during the three months ended November 30, 2012 as it was settled in conjunction with the refinancing on August 16, 2012 described previously.
Foreign currency exchange losses
Foreign currency exchange losses for the three months ended November 30, 2012 were $0.9 million as compared to foreign exchange losses of $12.1 million during the same period in the prior year. On August 16, 2012 we repaid our Term Loan Facility in its entirety, which was denominated in US dollars, and replaced it with the First-Lien Notes which are denominated in Canadian dollars, thereby permanently reducing our exposure to foreign currency changes on approximately half of our long-term debt. For the three months ended November 30, 2012 foreign currency exchange losses consist primarily of unrealized losses of $0.8 million related to the outstanding principal amount of the Second-Lien Notes which is not subject to hedge accounting. For the three months ended November 30, 2011 foreign currency exchange losses consisted primarily of net realized losses of $3.8 million related to repayments of the Term Loan Facility as well as unrealized losses of $8.4 million related to the outstanding principal amount of the Term Loan Facility which was not subject to hedge accounting and realized losses of $0.2 million on a contractual principal settlement on the foreign currency interest rate swap not designated as a hedge.
Earnings before income taxes
Earnings before income taxes was $8.3 million for the three months ended November 30, 2012, as compared to $14.3 million for the same period in the prior year. The decrease in earnings before income taxes is primarily the result of decreased operating income and increased losses on derivative financial instruments partially offset by decreased foreign currency exchange losses, all as discussed above.
Provision for income taxes
We have not recorded a current or deferred tax expense or recovery for the three months ended November 30, 2012 and 2011. Current taxes payable result in a decrease to our tax loss carryforward balances. The cumulative tax loss carryforward balances have not been recognized as a net deferred tax asset on the statement of financial position.
Net earnings from continuing operations
Net earnings from continuing operations was $8.3 million for the three months ended November 30, 2012, as compared to $14.3 million for the same period in the prior year, as a result of the factors described above in earnings before income taxes.
Net earnings from discontinued operations
We completed the sale of substantially all of the assets and liabilities of the Lower Mainland Publishing Group, the Victoria Times Colonist and the Vancouver Island Newspaper Group on November 30, 2011, as a result there were no discontinued operations for the three months ended November 30, 2012. Net earnings from discontinued operations for the three months ended November 30, 2011 was $14.1 million and included a $17.1 million gain on sale of discontinued operations and an allocation of $6.4 million of interest expense representing an acceleration of debt issuance costs related to the debt repayment made with the net proceeds from the sale. Additional information on this transaction is available in note 13 of the interim condensed consolidated financial statements for the three months ended November 30, 2012 and 2011.
Net earnings attributable to equity holders of the Company
Net earnings for the three months ended November 30, 2012 was $8.3 million as compared to $28.3 million for the same period in the prior year. The decrease is due to a decrease in net earnings from continuing operations and a decrease in net earnings from discontinued operations, both as discussed above.
Postmedia’s segment operations for the three months ended November 30, 2012 as compared to the three months ended November 30, 2011
| | | 2012 | | | 2011 | |
| | | | | | | |
| Revenues | | | | | | |
| Newspaper | | | 204,058 | | | | 223,075 | |
| All other | | | 8,921 | | | | 8,994 | |
| Intersegment elimination | | | (1,307 | ) | | | (979 | ) |
| | | | 211,672 | | | | 231,090 | |
| Expenses | | | | | | | | |
| Newspaper | | | 151,925 | | | | 168,283 | |
| All other | | | 5,143 | | | | 5,494 | |
| Corporate | | | 6,805 | | | | 3,646 | |
| Intersegment elimination | | | (1,307 | ) | | | (979 | ) |
| | | | 162,566 | | | | 176,444 | |
| Operating income before depreciation, amortization, and restructuring | | | | | | | | |
| Newspaper | | | 52,133 | | | | 54,793 | |
| All other | | | 3,778 | | | | 3,500 | |
| Corporate | | | (6,805 | ) | | | (3,646 | ) |
| | | | 49,106 | | | | 54,647 | |
Newspaper
Revenue for the Newspaper segment decreased $19.0 million, or 8.5%, during the three months ended November 30, 2012, as compared to the same period in the prior year. The decrease in revenue is due to decreases in print advertising revenue of $16.6 million and print circulation revenue of $5.0 million for the three months ended November 30, 2012, as compared to the same period in the prior year, both as discussed previously, partially offset by an increase in digital revenue which was primarily a result of increased newspaper digital advertising revenue. Newspaper digital advertising revenue increased $2.4 million, or 16.9%, during the three months ended November 30, 2012, as compared to the same period in the prior year, due to an increase in local digital advertising revenue partially offset by a decrease in digital classified revenue.
Expenses for the Newspaper segment decreased $16.4 million, or 9.7%, during the three months ended November 30, 2012, as compared to the same period in the prior year. The $16.4 million decrease in expenses is primarily due to the impact of restructuring and cost reduction initiatives implemented during the year ended August 31, 2012. In particular, compensation expense decreased $8.0 million, newsprint expense decreased $2.5 million, distribution expense decreased $4.5 million and marketing and promotion expenses decreased $1.4 million.
Operating income before depreciation, amortization and restructuring for the Newspaper segment decreased $2.7 million, or 4.9%, to $52.1 million for the three months ended November 30, 2012, as compared to the same period in the prior year. The decrease is due to the decrease in revenue, partially offset by reduced expenses, both as described above.
All other
Operating income before depreciation, amortization and restructuring for the All other category increased $0.3 million, or 7.9%, to $3.8 million for the three months ended November 30, 2012, as compared to the same period in the prior year.
Corporate
Corporate expenses increased $3.2 million to $6.8 million for the three months ended November 30, 2012, as compared to the same period in the prior year. The increase is primarily due to increased share-based and other long-term incentive plans compensation expense of $2.1 million primarily as a result of an increase in the share price of our Class C voting shares which are used to compute the fair value of our other long-term incentive plan.
Consolidated quarterly financial information
| | | | | | | | | | | | | | | | | | | | | | | | | |
| | | | | | | | | | | | | | | | | | | | | | | | | |
| ($ in thousands of Canadian dollars, except per share information) | | Fiscal 2013 | | | Fiscal 2012 | | | Fiscal 2011 | |
| | | Q1 | | | | Q4 | | | | Q3 | | | | Q2 | | | | Q1 | | | | Q4 | | | | Q3 | | | | Q2 | |
| Revenue | | | 211,672 | | | | 190,124 | | | | 212,021 | | | | 198,642 | | | | 231,090 | | | | 202,151 | | | | 227,628 | | | | 215,010 | |
| | | | | | | | | | | | | | | | | | | | | | | | | | | | | | | | | |
| Net earnings (loss) from continuing operations | | | 8,304 | | | | (28,351 | ) | | | (12,137 | ) | | | (11,065 | ) | | | 14,278 | | | | (838 | ) | | | (5,162 | ) | | | (10,728 | ) |
| Net earnings (loss) per share from continuing operations | | | | | | | | | | | | | | | | | | | | | | | | | | | | | | | | |
| Basic | | $ | 0.21 | | | $ | (0.70 | ) | | $ | (0.30 | ) | | $ | (0.27 | ) | | $ | 0.35 | | | $ | (0.02 | ) | | $ | (0.13 | ) | | $ | (0.27 | ) |
| Diluted | | $ | 0.20 | | | $ | (0.70 | ) | | $ | (0.30 | ) | | $ | (0.27 | ) | | $ | 0.35 | | | $ | (0.02 | ) | | $ | (0.13 | ) | | $ | (0.27 | ) |
| | | | | | | | | | | | | | | | | | | | | | | | | | | | | | | | | |
| Net earnings (loss) attributible to equity holders of the Company | | | 8,304 | | | | (28,351 | ) | | | (12,137 | ) | | | (11,065 | ) | | | 28,331 | | | | (351 | ) | | | (2,725 | ) | | | (12,518 | ) |
| Net earnings (loss) per share attributible to equity holders of the Company | | | | | | | | | | | | | | | | | | | | | | | | | | | | | |
| Basic | | $ | 0.21 | | | $ | (0.70 | ) | | $ | (0.30 | ) | | $ | (0.27 | ) | | $ | 0.70 | | | $ | (0.01 | ) | | $ | (0.07 | ) | | $ | (0.31 | ) |
| Diluted | | $ | 0.20 | | | $ | (0.70 | ) | | $ | (0.30 | ) | | $ | (0.27 | ) | | $ | 0.70 | | | $ | (0.01 | ) | | $ | (0.07 | ) | | $ | (0.31 | ) |
| | | | | | | | | | | | | | | | | | | | | | | | | | | | | | | | | |
| Cash flows from operating activities | | | 13,228 | | | | (7,472 | ) | | | 24,046 | | | | 16,045 | | | | 9,922 | | | | (5,187 | ) | | | 39,236 | | | | 9,185 | |
| | | | | | | | | | | | | | | | | | | | | | | | | | | | | | | | | |
Liquidity and capital resources
Our principal uses of funds are for working capital requirements, debt servicing and capital expenditures. Based on our current and anticipated level of operations, we believe that our cash on hand, cash flows from operations and available borrowings under our asset-based revolving credit facility (“ABL Facility”) will enable us to meet our working capital, capital expenditure, debt servicing and other funding requirements for the foreseeable future. However, our ability to fund our working capital needs, debt servicing and other obligations depends on our future operating performance and cash flows. There are a number of factors which may adversely affect our operating performance and our ability to meet these obligations. See “Key Factors Affecting Operating Results”. Our cash flows from operating activities may be impacted by, among other things, the overall strength of the economy, competition from other newspapers and alternative forms of media and competition from alternative emerging technologies. In addition, in recent years there has been a growing shift in advertising dollars from newspaper advertising to other advertising formats, particularly online and other digital platforms such as search and social media websites. Although we expect to fund our capital needs with our available cash, cash generated from operations and available borrowings under the ABL Facility, our indebtedness could adversely affect our financial condition and prevent us from fulfilling our obligations under our debt agreements. As at November 30, 2012, no amounts were drawn under the ABL Facility.
Sources of Cash
Cash flows from operating activities
Our principal sources of liquidity are cash flows from operating activities. For the three months ended November 30, 2012, our cash flows from operating activities were inflows of $13.2 million (2011 – $9.9 million). Cash flows from operating activities increased $3.3 million for the three months ended November 30, 2012, as compared to the same period in the prior year, due to a decrease in non-cash working capital and lower funding obligations on our employee benefit plans, partially offset by declines in operating income before depreciation, amortization and restructuring and the settlement of the foreign currency interest rate swap designated as a cash flow hedge.
As at November 30, 2012 we had cash of $33.2 million (August 31, 2012 - $22.2 million) and our ABL facility was undrawn (August 31, 2012 – nil). Availability under the ABL facility as at November 30, 2012 was $45.0 million (August 31, 2012 - $23.3 million).
Cash flows from investing activities
For the three months ended November 30, 2012, our cash flows from investing activities were inflows of $21.1 million (2011 – $82.9 million). The net cash inflows from investing activities during the three months ended November 30, 2012 include the net proceeds received on the sale of property and equipment and an asset held-for-sale of $24.7 million, offset by outflows on capital expenditures related to property and equipment of $2.6 million and intangible assets of $1.0 million. The net cash inflows from investing activities during the three months ended November 30, 2011 included the net proceeds from the sale of discontinued operations of $85.9 million, offset by outflows on capital expenditures related to property and equipment of $1.5 million and intangible assets of $1.5 million.
Uses of Cash
Cash flows from financing activities
Cash flows from financing activities for the three months ended November 30, 2012, were outflows of $23.3 million (2011 – $90.9 million), and were related to our indebtedness as discussed below.
Indebtedness
As of November 30, 2012, we have $226.8 million First-Lien Notes and US$268.6 million Second-Lien Notes outstanding (August 31, 2012 - $250.0 million and US$268.6 million, respectively).
During the three months ended November 30, 2012, we redeemed $23.2 million aggregate principal amount of First-Lien Notes at par in accordance with the terms and conditions of the First-Lien Notes indenture. During the three months ended November 30, 2011, we made mandatory principal repayments on the Term Loan Facility of $90.8 million (US$88.9 million), which included the required repayment due to the sale of discontinued operations, as discussed previously.
The following tables set out the principal and carrying amount of our long-term debt outstanding as at November 30, 2012 and August 31, 2012. The first column of the table translates, where applicable, our US dollar debt to the Canadian equivalent based on foreign exchange rates specified in our foreign currency swap agreements for swapped debt and at the closing foreign exchange rate on November 30, 2012 and August 31, 2012, respectively, for our non-swapped debt.
| | | | | | | | | | | | | |
| | | November 30, 2012 | |
| ($ in thousands of Canadian dollars) | | Principal Outstanding (US$ Debt translated at swapped or period end rates) | | | Principal Outstanding (US$ Debt translated at period end exchange rates) | | | Financing fees, discounts and other | | | Carrying Value | |
| | | | | | | | | | | | | |
| First-Lien Notes (CDN$226.8M) | | | 226,813 | | | | 226,813 | | | | 5,525 | | | | 221,288 | |
| Second-Lien Notes (swapped) (US$167.5M) | | | 173,362 | | | | 166,428 | | | | 5,469 | | | | 160,959 | |
| Second-Lien Notes (non-swapped) (US$101.1M) | | | 100,488 | | | | 100,488 | | | | 3,302 | | | | 97,186 | |
| | | | 500,663 | | | | 493,729 | | | | 14,296 | | | | 479,433 | |
| | | | | | | | | | | | | | | | | |
| | | | |
| | | August 31, 2012 | |
($ in thousands of Canadian dollars) | | Principal Outstanding (US$ Debt translated at swapped or period end rates) | | | Principal Outstanding (US$ Debt translated at period end exchange rates) | | | Financing fees, discounts and other | | | Carrying Value | |
| | | | | | | | | | | | | |
| First-Lien Notes (CDN$250.0M) | | | 250,000 | | | | 250,000 | | | | 5,866 | | | | 244,134 | |
| Second-Lien Notes (swapped) (US$265.0M) | | | 274,275 | | | | 261,211 | | | | 8,904 | | | | 252,307 | |
| Second-Lien Notes (non-swapped) (US$3.6M) | | | 3,583 | | | | 3,583 | | | | 122 | | | | 3,461 | |
| | | | 527,858 | | | | 514,794 | | | | 14,892 | | | | 499,902 | |
Financial position as at November 30, 2012 compared to August 31, 2012
| | | | | | | |
| ($ in thousands of Canadian dollars) | | November 30, 2012 | | | August 31, 2012 | |
| | | | | | | |
| Current assets | | | 159,144 | | | | 127,199 | |
| Total assets | | | 1,036,901 | | | | 1,044,848 | |
| Current liabilities | | | 149,995 | | | | 159,293 | |
| Total liabilities | | | 804,106 | | | | 811,093 | |
| Equity | | | 232,795 | | | | 233,755 | |
The increase in our current assets at November 30, 2012 as compared to August 31, 2012 is due to an increase in cash as well as an increase in accounts receivable primarily due to the seasonality of our business. Total assets at November 30, 2012 decreased compared to August 31, 2012, due to the decrease in the carrying value of property and equipment and asset held-for-sale as a result of disposals and depreciation as well as a decrease in the carrying value of intangible assets as a result of amortization in the three months ended November 30, 2012, partially offset by the increase in current assets previously described. Current liabilities have decreased due to decreased provisions as a result of payments made to the restructuring provision during the three months ended November 30, 2012 and decreased current portion of long term-debt due to the mandatory redemption of First-Lien Notes, partially offset by increased accrued interest payable on long-term debt. The decrease in total liabilities is due to the decrease in current liabilities previously described, a reduction in the carrying value of long-term debt, the settlement of and decreases in the fair value of derivative financial instruments liabilities, partially offset by increases in other non-current liabilities due to an increase in the carrying value of our employee benefit plans.
Financial Instruments and Financial Instruments Risk Management
The financial instruments and financial risk management policies are the same as disclosed in the audited consolidated financial statements for the years ended August 31, 2012 and 2011, except as disclosed below.
Derivative financial instruments
During the three months ended November 30, 2012 we settled a notional amount of US$97.5 million of the foreign currency interest rate swap designated as a cash flow hedge for a cash payment of $9.6 million, including accrued interest of $0.6 million, and as a result have a notional amount of US$167.5 million outstanding as of November 30, 2012 (August 31, 2012 – US$265.0 million).
Foreign currency risk
As at November 30, 2012, approximately 54% of the outstanding principal and related interest payable on our long-term debt is payable in US dollars (August 31, 2012 – 51%). We have entered into transactions to reduce foreign currency risk exposure on our US dollar denominated long-term debt. As at November 30, 2012, through our foreign currency interest rate swap we had hedged foreign currency risk on 62% of our US dollar denominated debt, (August 31, 2012 - 99%). As at November 30, 2012, we were exposed to foreign currency risk on the non-swapped portion of the Second-Lien Notes of US$101.1 million (August 31, 2012 - US$3.6 million). As at November 30, 2012, a $0.01 change in the period end exchange rate of a Canadian dollar per one US dollar, holding all other variables constant, would have resulted in a $1.0 million increase or decrease to foreign currency exchange losses in the statement of operations.
Guarantees and Off-Balance Sheet Arrangements
We do not have any significant guarantees or off-balance sheet arrangements.
Contractual obligations and commitments
Our obligations under firm contractual arrangements, including commitments for future payments under finance lease arrangements, operating lease arrangements, debt agreements and swap agreements, are not materially different from those discussed in our annual management’s discussion and analysis for the years ended August 31, 2012 and 2011, other than the effects of foreign exchange on our US dollar debt and swap agreements. Our obligations under firm contractual arrangements related to minimum required employee benefit plan funding has been decreased due to solvency relief provided to all Ontario registered pension plans by the Ontario government. After taking into account the solvency relief, we expect to contribute $12.4 million to our defined benefit pension plans for the year ended August 31, 2013.
Future Accounting Standards
Future accounting standards that are issued but not yet effective are described in our annual management’s discussion and analysis and annual consolidated financial statements for the years ended August 31, 2012 and 2011. We have not yet assessed the impact of the standards or determined whether we will adopt any of the standards earlier than their current effective date, but it is possible that some of these standards could have a material impact on our consolidated financial statements.
Differences between IFRS and US GAAP
The preceding discussion and analysis has been based upon financial statements prepared in accordance with IFRS, which differs in certain respects from US GAAP. The significant differences are discussed in detail in note 14 of our interim condensed consolidated financial statements for the three months ended November 30, 2012 and 2011.
Risk Factors
The risks relating to our business are described in the section entitled “Risk Factors” included in our annual management’s discussion and analysis for the years ended August 31, 2012 and 2011, which section is incorporated by reference herein.
Internal Controls
Disclosure controls and procedures within Postmedia have been designed to provide reasonable assurance that all relevant information is identified to its management, including the President and Chief Executive Officer (“CEO”) and the Executive Vice President and Chief Financial Officer (“CFO”), as appropriate, to allow required disclosures to be made in a timely fashion.
Internal controls over financial reporting have been designed by management, under the supervision of and with the participation of the CEO and CFO, to provide reasonable assurance regarding the reliability of Postmedia’s financial reporting and the preparation of financial statements for external purposes in accordance with IFRS.
The CEO and CFO have evaluated whether there were changes to Postmedia's internal control over financial reporting during the three months ended November 30, 2012 that have materially affected, or are reasonably likely to materially affect, internal control over financial reporting. There were no changes identified during their evaluation.
Share Capital
As at January 7, 2013 we had the following number of shares and options outstanding:
Class C voting shares | | | 1,204,959 | |
Class NC variable voting shares | | | 39,004,660 | |
Total shares outstanding | | | 40,209,619 | |
| | | | | |
Total options and restricted share units outstanding (1) | | | 2,080,000 | |
(1) The total options and restricted share units outstanding are convertible into 2.0 million Class C voting shares and 0.1 million Class NC variable voting shares. The total options and restricted share units outstanding include 1.1 million options that are vested and 1.0 million options that are unvested.
17