| Introduction | | |
| Executive Summary | | 2 |
| Management, Board of Directors, Investor Relations, and Equity Coverage | | 2 |
| Portfolio Statistics | | 3 |
| Acquisition Activity | | 3 |
| Select Recent Acquisitions | | 4 |
| Value Creation | | 5 |
| Replacement Cost Analysis | | 5 |
| Rent Collections and Deferrals | | 6 |
| Guidance | | 7 |
| Financial Information | | |
| Same Store Net Operating Income (NOI) | | 8 |
| Consolidated Statements of Operations | | 9 |
| Consolidated NOI | | 10 |
| Earnings Before Interest, Taxes, Depreciation and Amortization for Real Estate (EBITDAre) | | 10 |
| Funds from Operations (FFO), Core FFO & Adjusted Funds from Operations (AFFO) | | 10 |
| Consolidated Balance Sheets | | 11 |
| Capital Structure and Debt Summary | | 12 |
| Capital Markets Activity | | 12 |
| Unconsolidated Joint Venture | | 13 |
| Net Asset Value Components | | 14 |
| Operational & Portfolio Information | | |
| Leasing Activity | | 15 |
| Lease Expiration Schedule | | 15 |
| Leased Square Feet and Annualized Base Rent by Tenant Industry | | 16 |
| Leased Square Feet and Annualized Base Rent by Type | | 17 |
| Top 10 Tenants by Annualized Base Rent | | 18 |
| Lease Segmentation by Size | | 18 |
| Rentable Square Feet and Annualized Base Rent by Market | | 19 |
| Total Acquisition Cost by Market | | 19 |
| Appendix | | |
| Glossary | | 20 |
| | | | |
| | | | |
| Forward-Looking Statements: This Supplemental Information contains forward-looking statements within the meaning of the U.S. federal securities laws. We make statements in this Supplemental Information that are forward-looking statements, which are usually identified by the use of words such as “anticipates,” “believes,” “estimates,” “expects,” “intends,” “may,” “plans” “projects,” “seeks,” “should,” “will,” and variations of such words or similar expressions. Our forward-looking statements reflect our current views about our plans, intentions, expectations, strategies and prospects, which are based on the information currently available to us and on assumptions we have made. Although we believe that our plans, intentions, expectations, strategies and prospects as reflected in or suggested by our forward-looking statements are reasonable, we can give no assurance that our plans, intentions, expectations, strategies or prospects will be attained or achieved and you should not place undue reliance on these forward-looking statements. Additionally, unforeseen factors emerge from time to time, and we cannot predict which factors will arise or their ultimate impact on our business or the extent to which any such factor, or combination of factors, may cause actual results to differ materially from those contained in any forward-looking statements. One of these factors is the outbreak of the novel coronavirus (COVID-19), the impact of which is difficult to fully assess at this time due to, among other factors, uncertainty regarding the severity and duration of the outbreak domestically and internationally and the effectiveness of efforts to contain the spread of the virus and its resulting direct and indirect impact on the U.S. economy and economic activity. Furthermore, actual results may differ materially from those described in the forward-looking statements and may be affected by a variety of risks and factors. Any forward-looking statement speaks only as of the date on which it is made. New risks and uncertainties arise over time, and it is not possible for us to predict those events or how they may affect us. Except as required by law, we are not obligated to, and do not intend to, update or revise any forward-looking statements, whether as a result of new information, future events or otherwise. | |
| | |
| Definitions and Reconciliations: For definitions of certain terms used throughout this Supplemental Information, including certain non-GAAP financial measures, refer to the Glossary on pages 20-21. For reconciliations of the non-GAAP financial measures to the most directly comparable U.S. GAAP measures, refer to page 10. | |
| |
| |
| Plymouth Industrial REIT, Inc. |
| Executive Summary |
| |
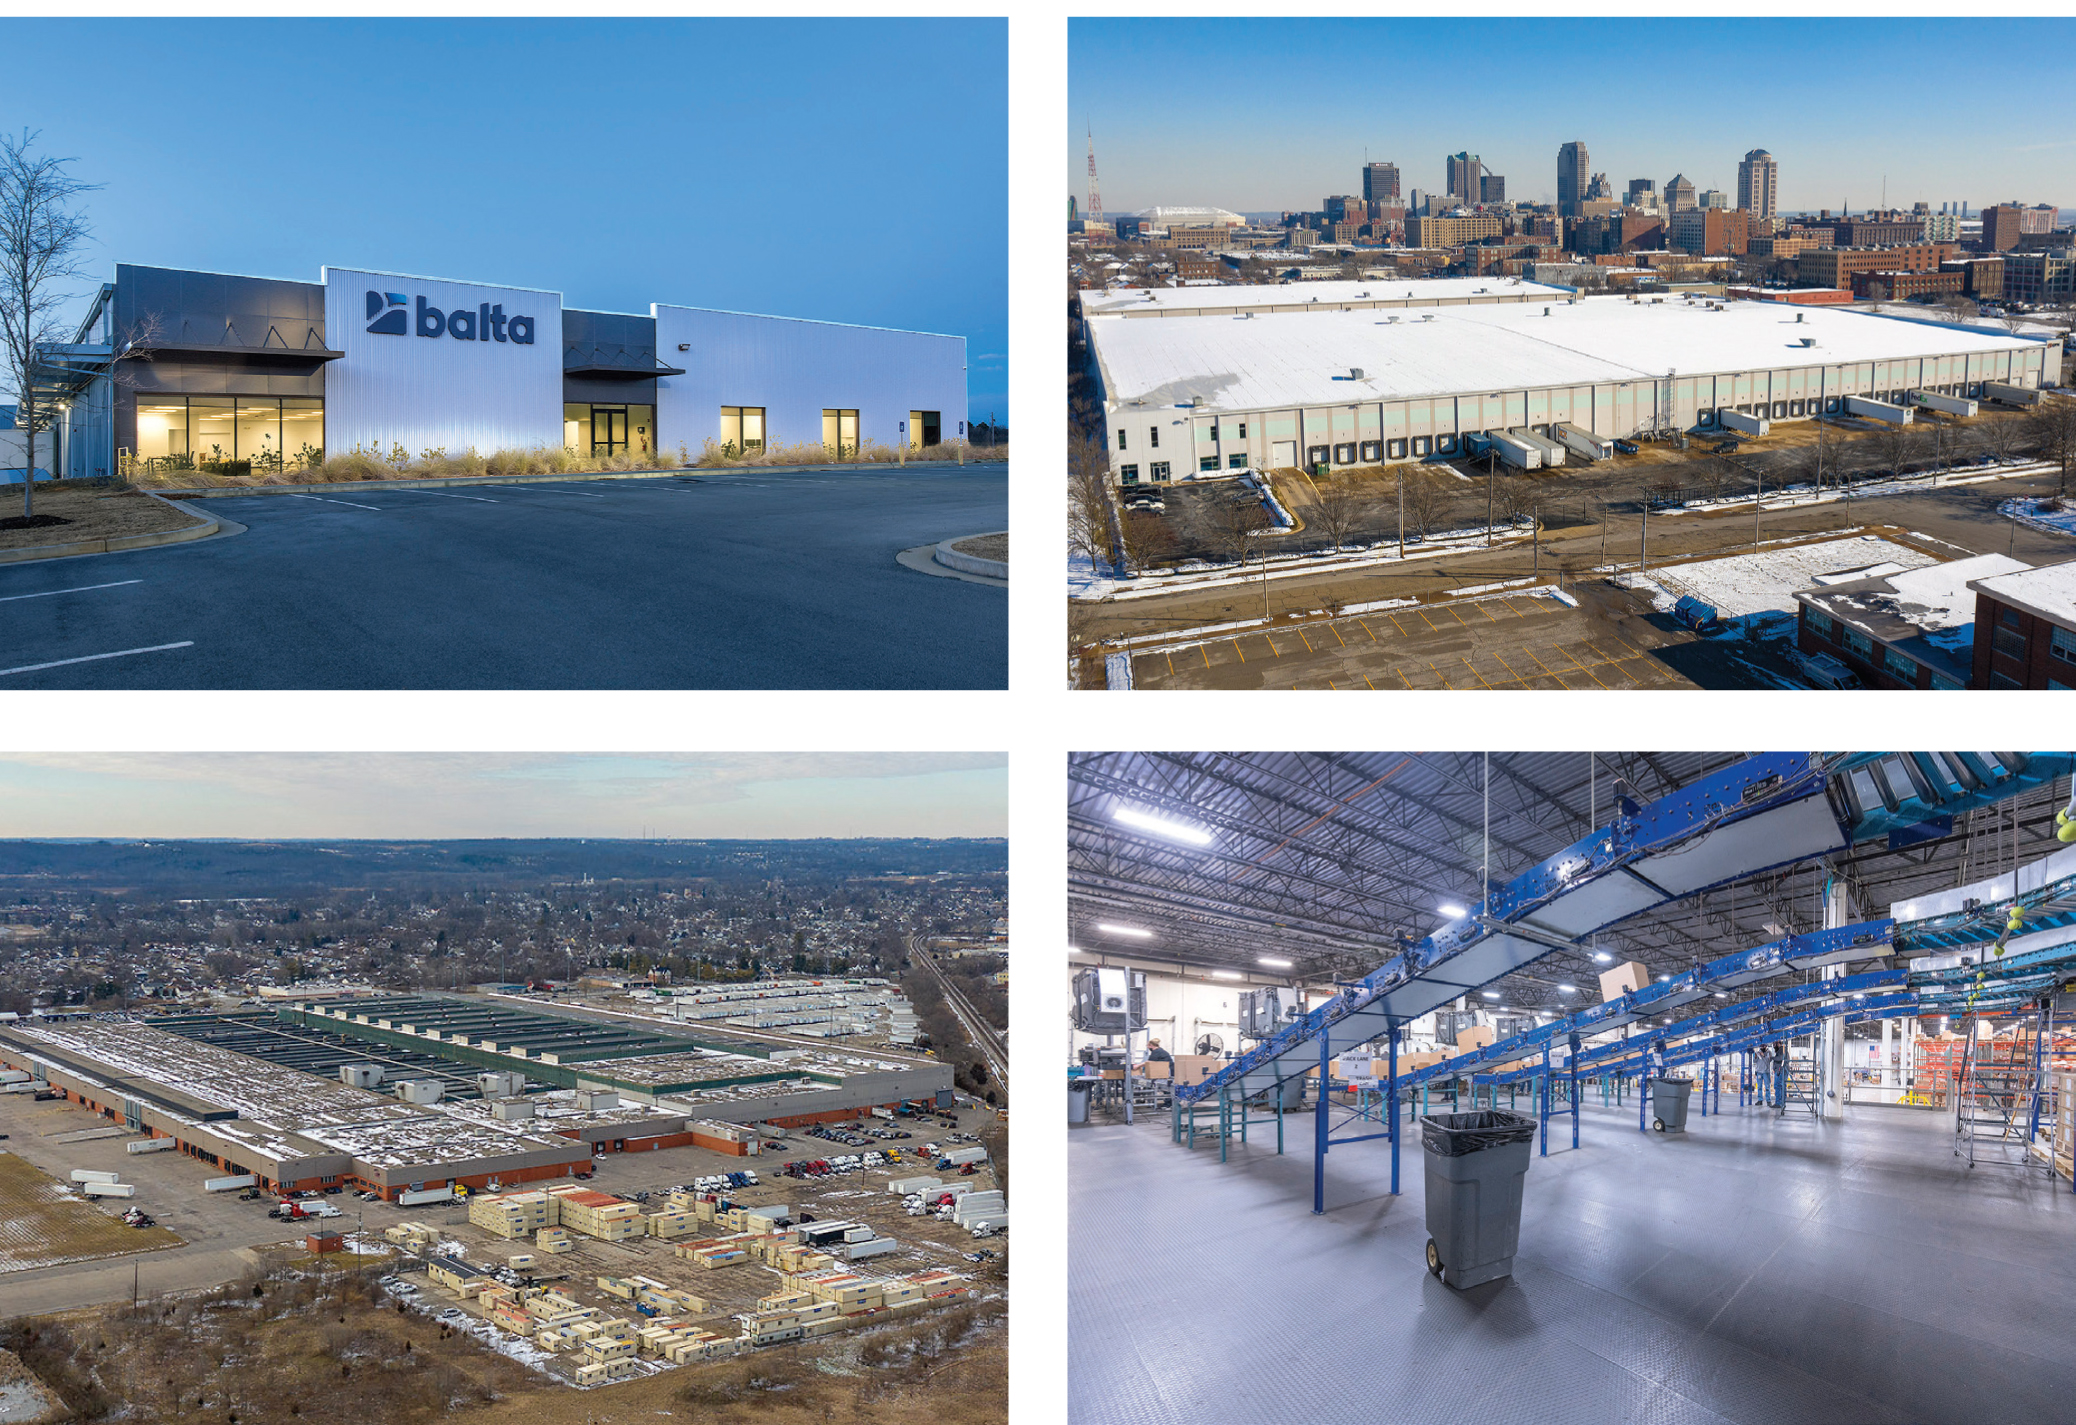
| Company overview: Plymouth Industrial REIT, Inc. (NYSE: PLYM) is a real estate investment trust focused on the acquisition, ownership, and management of single and multi-tenant industrial properties, including distribution centers, warehouses, light industrial and small bay industrial properties, located in primary and secondary markets within the main industrial, distribution and logistics corridors of the United States. |
| |
| Management, Board of Directors, Investor Relations, and Equity Coverage |
| Corporate | | Investor Relations | | Transfer Agent | | | |
| | | | | | | | | |
| 20 Custom House Street, 11th Floor | | Tripp Sullivan | | Continental Stock Transfer & Trust Company |
| Boston, Massachusetts 02110 | | | SCR Partners | | 1 State Street, 30th Floor | | | |
| 617.340.3814 | | | 615.942.7077 | | New York, NY 10004 | | | |
| www.plymouthreit.com | | | IR@plymouthreit.com | | 212.509.4000 | | | |
| | | | | | | | | |
| Executive Management |
| | | | | | | | | |
| Jeffrey E. Witherell | | | Pendleton P. White, Jr. | | Daniel C. Wright | | James M. Connolly | |
| Chief Executive Officer | | | President and | | Executive Vice President | | Executive Vice President | |
| and Chairman | | | Chief Investment Officer | | and Chief Financial Officer | | Asset Management | |
| | | | | | | | | |
| Board of Directors |
| | | | | | | | | |
| Martin Barber | | Philip S. Cottone | | Richard J. DeAgazio | | David G. Gaw | |
| Independent Director | | Independent Director | | Independent Director | | Independent Director | |
| | | | | | | | | |
| John W. Guinee | | Caitlin Murphy | | Pendleton P. White, Jr. | | Jeffrey E. Witherell | |
| Independent Director | | | Independent Director | | President and | | Chief Executive Officer | |
| | | | | | Chief Investment Officer | | and Chairman | |
| | | | | | | | | |
| Equity Research Coverage1 |
| | | | | | | | | |
| Baird | | JMP Securities | | Wedbush Securities | | | |
| Dave Rodgers | | | Aaron Hecht | | Henry Coffey | | | |
| 216.737.7341 | | | 415.835.3963 | | 212.833.1382 | | | |
| | | | | | | | | |
| Berenberg Capital Markets | | | KeyBanc Capital Markets | | | | | |
| Connor Siversky | | | Craig Mailman | | | | | |
| 646.949.9037 | | | 917.368.2316 | | | | | |
| | | | | | | | | |
| Colliers Securities | | National Securities Corp. | | | | | |
| Barry Oxford | | | Guarav Mehta | | | | | |
| 203.961.6573 | | | 212.417.8008 | | | | | |
| Transaction Summary (YTD Q2 2021) | | | | Investment Highlights |
| | | |
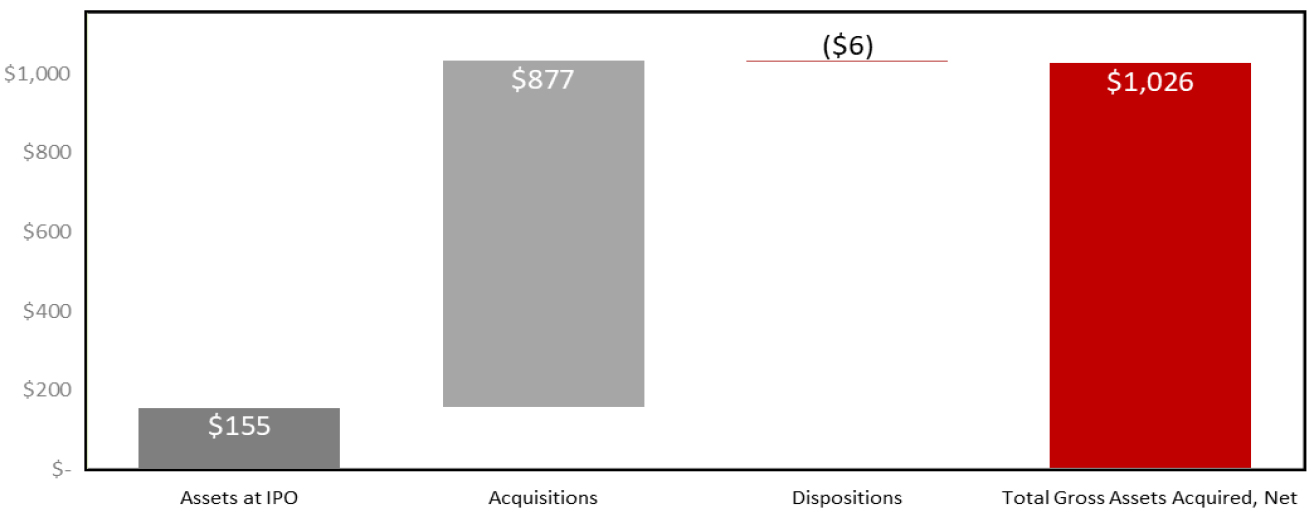
| Purchase Price4 | | $ 75,050 | ● | Since the Company's initial public offering in June 2017, the Company has acquired $876.6 million of wholly owned warehouse, distribution, light manufacturing, and small bay industrial properties totaling approximately 21.0 million square feet |
| Cost Per Square Foot | | $ 49.65 | |
| Replacement Cost/SF3 - YTD 2021 | | $ 83.17 | |
| Square Footage Acquired | | 1,616,448 | ● | YTD Q2 2021, the Company has acquired industrial properties in the markets of Columbus, Cleveland, St. Louis, Kansas City, Memphis, and Chicago at a significant discount to replacement cost |
| WA Occupancy at Acquisition | | 100.0% | |
| WA Lease Term Remaining (yrs.) | | 3.9 | |
Portfolio statistics and acquisitions include wholly owned properties only.
| Lease Extension / Redevelopment | | Lease Extension | | New Development |
 | |  | | 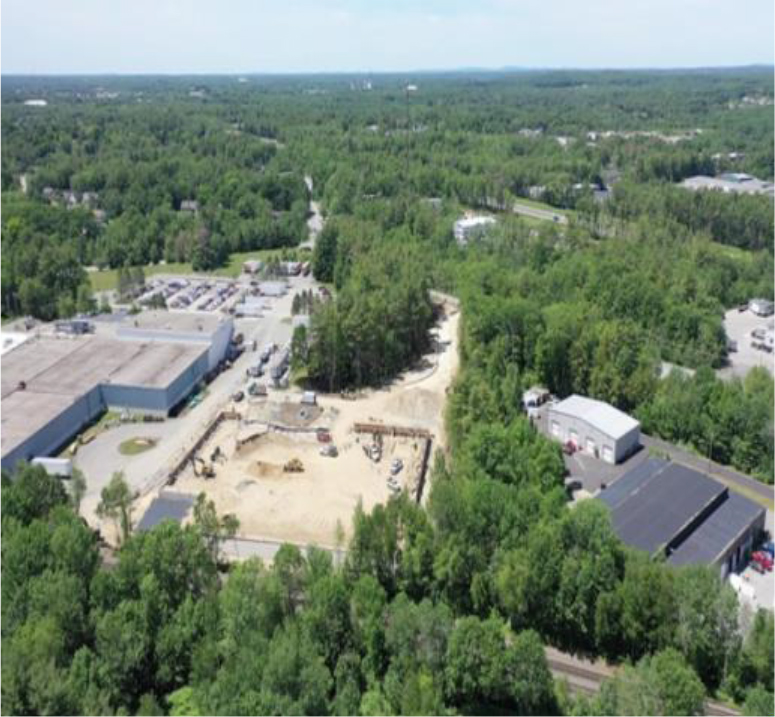 |
| Cincinnati, OH | | Atlanta, GA | | Portland, ME |
| Acquired multi-tenant industrial building in October 2018 with over 1.1 million SF of rentable square feet and 30+ acres available for future development | | Acquired in December 2017 with two years remaining on single-tenant lease term | | Acquired multi-tenant industrial building in November 2014 with ~ 8 acres of developable land |
| Renewed nearly 0.5 million SF at higher rental rents with average annual rent escalations of 3.3% and terms greater than 4 years | | Negotiated early 5-year lease extension at higher rental rate with annual rent escalations of 3.0% | | Broke ground on new ~70,000 square foot industrial building during Q2 2021 with an estimated shell completion in December 2021 at a cost of ~$7.2 million |
| Reconfigured tenant layouts to maximize efficiency leading to ~40,000 SF of marketable space previously unleasable | | Exit capitalization rate ~200bps below acquisition capitalization rate1 | | Flexible design features will allow the building to be efficiently utilized for both single- and multi-tenant occupancy |
| Currently installing floors over open crane pit areas to create an additional ~150,000 SF of new leasable space generating a projected cash yield of ~14.0% | | | | |
| 1) | Based on acquisition yield and third-party real estate market estimate of current exit capitalization rate. |
| 2) | Primary markets means the following two metropolitan areas in the U.S., each generally consisting of more than 300 million square feet of industrial space: Chicago and Atlanta. Secondary markets means non-primary markets, each generally consisting of between 100 million and 300 million square feet of industrial space, including the following metropolitan areas in the U.S.: Boston, Cincinnati, Cleveland, Columbus, Indianapolis, Jacksonville, Kansas City, Memphis, Milwaukee, Philadelphia, South Florida, and St. Louis. Our definitions of primary and secondary markets may vary from the definitions of these terms used by investors, analysts, or other industrial REITs. |
| 3) | Represents total direct consideration paid rather than GAAP cost basis. |
| 4) | Replacement cost is based on the Marshall & Swift valuation methodology for the determination of building costs. Replacement cost includes land reflected at the allocated cost in accordance with GAAP. |
| | | | Full Year 2021 Range1 |
| | | | Low | | High |
| Net loss | | $ (0.30) | | $ (0.26) |
| | | | | | |
| Depreciation and amortization | | 2.18 | | 2.18 |
| Depreciation and amortization from unconsolidated joint venture | | 0.05 | | 0.05 |
| Gain on sale of real estate | | (0.02) | | (0.02) |
| Unrealized appreciation of warrants | | 0.01 | | 0.01 |
| Preferred stock dividend | | (0.22) | | (0.22) |
| Core FFO | | $ 1.70 | | $ 1.74 |
| | | | | | |
| Amortization of debt related costs | | 0.05 | | 0.05 |
| Stock compensation | | 0.05 | | 0.05 |
| Straight-line rent | | (0.08) | | (0.08) |
| Above/below market lease rents | | (0.06) | | (0.06) |
| Recurring capital expenditures | | (0.23) | | (0.22) |
| AFFO attributable to common stockholders and unit holders | | $ 1.43 | | $ 1.48 |
| | | | | | |
| Weighted-average common shares and units outstanding | | 30,748 | | 30,748 |
| | | | | | |
| | | | | | |
| 2021 Guidance Assumptions | | Low | | High |
| | | | | | |
| Total Revenue | | $ 136,100 | | $ 136,800 |
| NOI | | $ 90,400 | | $ 91,200 |
| EBITDAre | | $ 77,650 | | $ 78,150 |
| General & Administrative2 | | $ 12,600 | | $ 12,300 |
| Recurring Capital Expenditures | | $ 6,950 | | $ 6,650 |
| Same Store Cash NOI3 | | $ 58,300 | | $ 58,850 |
| Same Store Occupancy3 | | 95.5% | | 97.0% |
| | | | | | |
| | | | | | |
| | | For the Three Months Ended June 30, | | For the Six Months Ended June 30, |
| | | 2021 | | 2020 | | 2021 | | 2020 |
| | | | | | | | | |
| Revenues: | | | | | | | | |
| Rental revenue | | $ 25,627 | | $ 20,364 | | $ 50,181 | | $ 40,725 |
| Tenant recoveries | | 7,131 | | 5,773 | | 14,410 | | 11,641 |
| Management fee revenue1 | | 97 | | - | | 180 | | - |
| Total revenues | | $ 32,855 | | $ 26,137 | | $ 64,771 | | $ 52,366 |
| | | | | | | | | |
| Operating expenses: | | | | | | | | |
| Property | | 10,940 | | 9,026 | | 22,366 | | 18,037 |
| Depreciation and amortization | | 16,902 | | 13,520 | | 32,679 | | 27,617 |
| General and administrative | | 3,309 | | 2,576 | | 6,318 | | 5,098 |
| Total operating expenses | | $ 31,151 | | $ 25,122 | | $ 61,363 | | $ 50,752 |
| | | | | | | | | |
| Other income (expense): | | | | | | | | |
| Interest expense | | (4,825) | | (4,900) | | (9,583) | | (9,771) |
| Earnings (loss) in investment of unconsolidated joint venture2 | | (224) | | - | | (497) | | - |
| Unrealized (appreciation) depreciation of warrants3 | | (636) | | - | | (883) | | - |
| Gain on sale of real estate4 | | - | | - | | 590 | | - |
| Total other income (expense) | | $ (5,685) | | $ (4,900) | | $ (10,373) | | $ (9,771) |
| | | | | | | | | |
| Net loss | | $ (3,981) | | $ (3,885) | | $ (6,965) | | $ (8,157) |
| | | | | | | | | |
| Less: Loss attributable to non-controlling interest | | (71) | | (209) | | (136) | | (454) |
| | | | | | | | | |
| Net loss attributable to Plymouth Industrial REIT, Inc. | | $ (3,910) | | $ (3,676) | | $ (6,829) | | $ (7,703) |
| | | | | | | | | |
| Less: Preferred stock dividends | | 1,652 | | 1,613 | | 3,304 | | 3,226 |
| Less: Series B Preferred Stock accretion to redemption value | | 1,807 | | 1,854 | | 3,614 | | 3,708 |
| Less: Amount allocated to participating securities | | 48 | | 30 | | 105 | | 106 |
| | | | | | | | | |
| Net loss attributable to common stockholders | | $ (7,417) | | $ �� (7,173) | | $ (13,852) | | $ (14,743) |
| | | | | | | | | |
| Net loss basic and diluted per share attributable to common stockholders | | $ (0.25) | | $ (0.49) | | $ (0.49) | | $ (1.02) |
| | | | | | | | | |
| Weighted-average common shares outstanding basic & diluted | | 29,349 | | 14,649 | | 28,283 | | 14,514 |
| | | | | | | | | |
| Net loss | | $ (3,981) | | $ (3,885) | | $ (6,965) | | $ (8,157) |
| Gain on sale of real estate | | - | | - | | (590) | | - |
| Depreciation and amortization | | 16,902 | | 13,520 | | 32,679 | | 27,617 |
| Depreciation and amortization from unconsolidated joint venture | | 408 | | - | | 801 | | - |
| FFO | | $ 13,329 | | $ 9,635 | | $ 25,925 | | $ 19,460 |
| Preferred stock dividends | | (1,652) | | (1,613) | | (3,304) | | (3,226) |
| Unrealized appreciation (depreciation) of warrants1 | | 636 | | - | | 883 | | - |
| Core FFO | | $ 12,313 | | $ 8,022 | | $ 23,504 | | $ 16,234 |
| Amortization of debt related costs | | 369 | | 366 | | 739 | | 665 |
| Non-cash interest expense | | (29) | | (174) | | (72) | | 90 |
| Stock compensation | | 461 | | 383 | | 879 | | 732 |
| Straight line rent | | (1,146) | | (443) | | (1,760) | | (961) |
| Above/below market lease rents | | (616) | | (438) | | (1,109) | | (986) |
| Recurring capital expenditures6 | | (1,555) | | (719) | | (3,415) | | (1,755) |
| AFFO | | $ 9,797 | | $ 6,997 | | $ 18,766 | | $ 14,019 |
| | | | | | | | | |
| Weighted-average common shares and units outstanding | | 30,156 | | 15,675 | | 29,109 | | 15,564 |
| | | | | | | | | |
| Core FFO attributable to common stockholders and unit holders per share | | $ 0.41 | | $ 0.51 | | $ 0.81 | | $ 1.04 |
| AFFO attributable to common stockholders and unit holders per share | | $ 0.32 | | $ 0.45 | | $ 0.64 | | $ 0.90 |
| | | | | | | | | |
| | | | | | | | | |
| 1) | Represents the change in the fair market value of our common stock warrants. |
| 2) | Represents our share of (earnings) losses related to our investment in an unconsolidated joint venture. Refer to Unconsolidated Joint Venture in this Supplemental Information for additional details. |
| 3) | Represents management fee revenue earned from the unconsolidated joint venture. |
| 4) | Represents the estimated impact of wholly owned and joint venture acquisitions as if they had been acquired on the first day of each respective quarter in which the acquisitions occurred. We have made a number of assumptions in such estimates and there can be no assurance that we would have generated the projected levels of EBITDA had we owned the acquired properties as of the beginning of the respective periods. |
| 5) | Represents depreciation and amortization, and interest expense from the Company's unconsolidated joint venture. |
| 6) | Excludes non-recurring capital expenditures of $6,350 and $401 for the three months ended June 30, 2021 and 2020, respectively, and $7,584 and $2,151 for the six months ended June 30, 2021 and 2020, respectively. |
| | | | June 30, 2021 | | December 31, 2020 |
| ASSETS | | | | |
| Real estate properties: | | | | |
| Land | | $ 170,245 | | $ 159,681 |
| Building and improvements | | 790,375 | | 727,000 |
| Less accumulated depreciation | | (118,523) | | (98,283) |
| Total real estate properties, net | | $ 842,097 | | $ 788,398 |
| | | | | | |
| Cash, cash held in escrow and restricted cash | | 29,314 | | 32,054 |
| Deferred lease intangibles, net | | 64,510 | | 66,116 |
| Investment in unconsolidated joint venture1 | | 6,186 | | 6,683 |
| Other assets | | 27,721 | | 27,019 |
| Total assets | | $ 969,828 | | $ 920,270 |
| | | | | | |
| LIABILITIES, PREFERRED STOCK AND EQUITY | | | | |
| Secured debt, net | | $ 326,585 | | $ 328,908 |
| Unsecured debt, net2 | | 167,333 | | 189,254 |
| Accounts payable, accrued expenses and other liabilities | | 55,284 | | 49,335 |
| Deferred lease intangibles, net | | 9,925 | | 11,350 |
| Financing lease liability3 | | 2,216 | | 2,207 |
| | | | | | |
| Total liabilities | | $ 561,343 | | $ 581,054 |
| | | | | | |
| Preferred stock - Series A | | $ 48,473 | | $ 48,485 |
| Preferred stock - Series B4 | | $ 90,823 | | $ 87,209 |
| | | | | | |
| Equity: | | | | |
| Common stock | | $ 310 | | $ 253 |
| Additional paid in capital | | 434,161 | | 360,752 |
| Accumulated deficit | | (169,079) | | (162,250) |
| Total stockholders' equity | | 265,392 | | 198,755 |
| Non-controlling interest | | 3,797 | | 4,767 |
| Total equity | | $ 269,189 | | $ 203,522 |
| | | | | | |
| Total liabilities, preferred stock and equity | | $ 969,828 | | $ 920,270 |
| | | | | | |
| | | | | | |
| | | June 30, | March 31, | December 31, |
| | | 2021 | 2021 | 2020 |
| Common Shares and Units Outstanding4 | | 31,596 | 28,945 | 25,951 |
| Closing Price (as of period end) | | $ 19.90 | $ 16.85 | $ 15.00 |
| Market Value of Common Shares5 | | $ 628,760 | $ 487,723 | $ 389,265 |
| Preferred Stock - Series A6 | | 50,589 | 50,589 | 50,600 |
| Preferred Stock - Series B6 | | 97,277 | 97,277 | 97,230 |
| Total Market Capitalization5,7 | | $ 1,285,170 | $ 1,175,472 | $ 1,070,306 |
| | | | | |
| Dividend / Share (annualized) | | $ 0.84 | $ 0.80 | $ 0.80 |
| Dividend Yield (annualized) | | 4.2% | 4.7% | 5.3% |
| Total Debt-to-Total Market Capitalization | | 39.6% | 45.9% | 49.8% |
| Secured Debt as a % of Total Debt | | 67.0% | 63.3% | 62.3% |
| Unsecured Debt as a % of Total Debt | | 33.0% | 36.7% | 37.7% |
| Net Debt-to-Annualized Adjusted EBITDA (quarter annualized) | | 6.2x | 6.7x | 6.7x |
| Net Debt plus Preferred-to-Annualized Adjusted EBITDA (quarter annualized)6 | | 8.1x | 8.6x | 8.7x |
| Weighted Average Maturity of Total Debt (years) | | 4.3 | 4.7 | 4.9 |
| 1) | Debt assumed at acquisition. |
| 2) | The 1-month LIBOR rate as of June 30, 2021 was 0.10%. The spread over the applicable rate for the KeyBank Term Loan and the revolving line of credit with KeyBank is based on the Company’s total leverage ratio. |
| 3) | Total Debt is not adjusted for the amortization of debt issuance costs or fair market premiums or discounts. Total Debt includes the Company's pro rata share of unconsolidated joint venture debt. |
| 4) | Common shares and units outstanding were 31,089 and 507 as of June 30, 2021, respectively, and 25,344 and 607 for the year ended 2020, respectively. |
| 5) | Based on closing price as of last trading day of the quarter and common shares and units as of the period ended. |
| 6) | Preferred Stock is calculated at its liquidation preference as of the end of the period. |
| 7) | Market value of shares and units plus total debt and preferred stock as of period end. |
| | | | Three Months Ended June 30, | | | Acquisition | # of | Square | Purchase | Projected |
| | | | 2021 | | Market | Date | Buildings | Footage | Price | Initial Yield |
| | Pro Forma Net Operating Income (NOI) | | | | Kansas City | 2/12/2021 | 1 | 221,911 | $ 8,600 | 8.8% |
| | Total Operating NOI | | $ 21,818 | | St. Louis | 3/23/2021 | 1 | 142,364 | 7,800 | 7.6% |
| | Share of Joint Venture NOI | | $ 283 | | Chicago | 3/25/2021 | 1 | 149,474 | 7,900 | 7.3% |
| | Pro Forma Effect of New Lease Activity1 | | $ 264 | | Cleveland | 3/29/2021 | 1 | 100,150 | 7,700 | 7.6% |
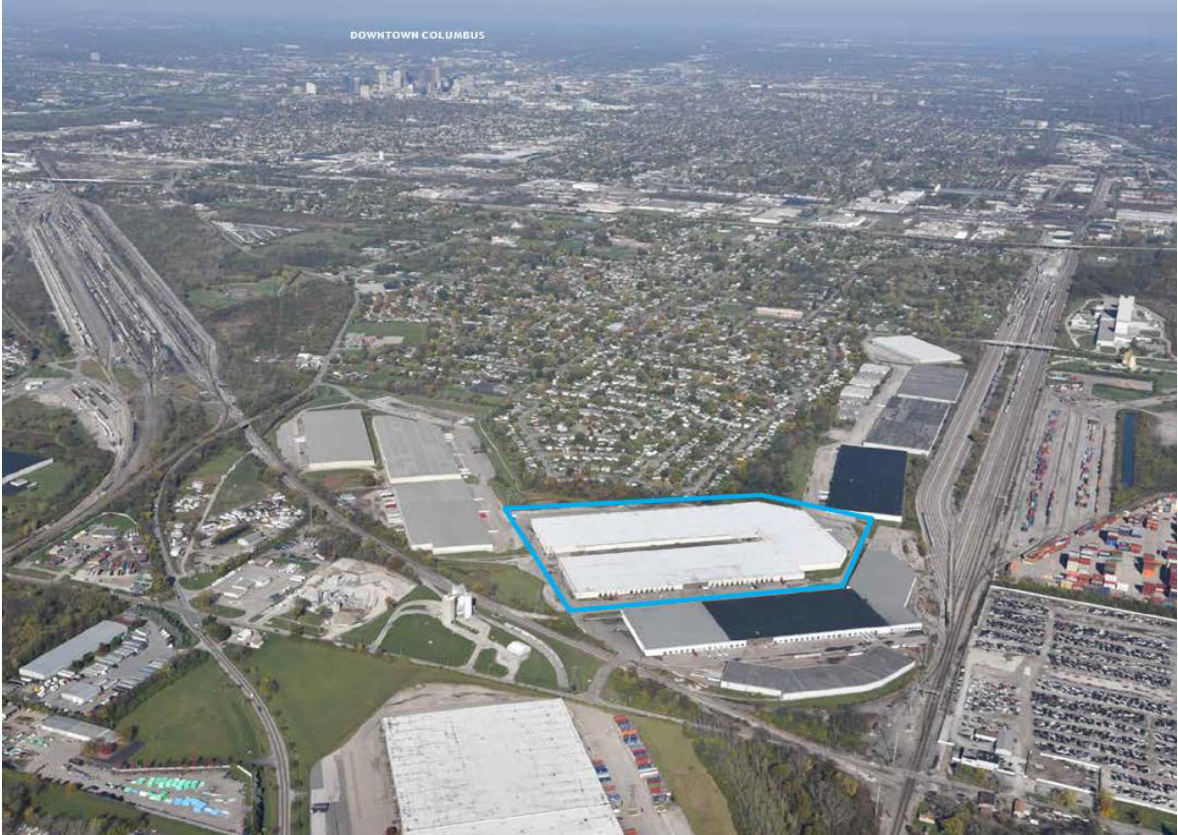
| | Pro Forma Effect of Acquisitions2 | | $ 234 | | Columbus | 3/29/2021 | 1 | 772,450 | 29,000 | 7.5% |
| | Pro Forma Effect of Repositioning / Development3 | | $ 915 | | Memphis | 6/29/2021 | 1 | 74,665 | 5,250 | 7.0% |
| | Pro Forma NOI | | $ 23,514 | | St. Louis | 6/30/2021 | 1 | 155,434 | 8,800 | 6.7% |
| | | | | | Memphis | 7/9/2021 | 1 | 233,000 | 9,900 | 7.7% |
| | Amortization of above / below market lease intangibles, net | | (625) | | Memphis | 7/30/2021 | 1 | 316,935 | 6,277 | 8.0% |
| | Straight-line rental revenue adjustment | | (1,151) | | | | 9 | 2,166,383 | $ 91,227 | 7.6% |
| | Pro Forma Cash NOI | | $ 21,738 | | | | | | | |
| 1) | Represents the estimated incremental base rents from uncommented new leases as if rent commencement had occurred as of the beginning of the period. |
| 2) | Represents the estimated impact of acquisitions as if they had been acquired at the beginning of the period. |
| 3) | Represents the estimated impact of properties that are undergoing repositioning or lease-up as if the properties were fully stabilized and rents had commenced as of the beginning of the period. |
| 4) | Developable land represents acreage currently owned by us and identified for potential development. The developable gross leasable area (GLA) is based on the developable land area and a land to building ratio. Developable land and GLA are estimated and can change periodically due to changes in site design, road and storm water requirements, parking requirements and other factors. We have made a number of assumptions in such estimates and there can be no assurance that we will develop land that we own. |
| 5) | Under construction represents projects for which vertical construction has commenced. Under development represents projects in the pre-construction phase. |
| 6) | Our ownership interest is 20%. |
| 7) | Preferred Stock is calculated at its liquidation preference as of the end of the period. |
| 8) | Common shares and units outstanding were 31,089 and 507 as of June 30, 2021. |
| Tenant | Market | Industry | | # of Leases | Total Leased Square Feet | Expiration | ABR Per Square Foot | ABR1 | % Total ABR |
| Archway Marketing Holdings, Inc. | Chicago | Logistics & Transportation | | 3 | 503,000 | 3/31/2026 | $ 4.30 | $ 2,164,500 | 2.2% |
| ODW Logistics, Inc. | Columbus | Logistics & Transportation | | 1 | 772,450 | 6/30/2025 | 2.80 | 2,162,860 | 2.2% |
| Balta US, Inc. | Jacksonville | Home & Garden | | 2 | 629,084 | 12/31/2028 | 3.02 | 1,898,956 | 1.9% |
| Communications Test Design, Inc. | Memphis | Logistics & Transportation | | 2 | 566,281 | 12/31/2024 | 3.21 | 1,819,461 | 1.8% |
| Pactiv Corporation | Chicago | Food & Beverage | | 3 | 439,631 | 8/31/2023 | 3.86 | 1,696,552 | 1.7% |
| ASC Manufacturing, Ltd. | Cleveland | Light Manufacturing | | 1 | 274,464 | 6/30/2022 | 6.08 | 1,667,508 | 1.7% |
| ASW Supply Chain Services, LLC | Cleveland | Logistics & Transportation | | 4 | 532,437 | 11/30/2027 | 3.10 | 1,650,555 | 1.7% |
| First Logistics | Chicago | Logistics & Transportation | | 1 | 327,194 | 10/31/2024 | 4.95 | 1,619,610 | 1.6% |
| JobsOhio Beverage System | Cleveland | Food & Beverage | | 1 | 350,000 | 3/31/2024 | 4.26 | 1,491,000 | 1.5% |
| American Plastics, LLC | Cleveland | Plastics | | 1 | 405,000 | 12/31/2028 | 3.67 | 1,485,342 | 1.5% |
| Total Largest Tenants by Annualized Rent | | | 19 | 4,799,541 | | $ 3.68 | $ 17,656,344 | 17.8% |
| All Other Tenants | | | | 382 | 19,029,839 | | $ 4.31 | $ 82,016,558 | 82.2% |
| Total Company Portfolio | | | | 401 | 23,829,380 | | $ 4.18 | $ 99,672,902 | 100.0% |
| 1) | Annualized base rent is calculated as monthly contracted base rent as of June 30, 2021, multiplied by 12. Excludes rent abatements. | | | |
| 2) | Total Leased % Excluding Repositioning excludes vacant square footage being refurbished or repositioned. | | | | |
| 3) | In-Place + Uncommenced ABR calculated as in-place current annualized base rent as of June 30, 2021 plus annualized base rent for leases signed but not commenced as of June 30, 2021. |
| 4) | In-Place + Uncommenced ABR per SF is calculated as in-place current rent annualized base rent as of June 30, 2021 plus annualized base rent for leases signed but not commenced as of June 30, 2021, divided by leased square feet plus uncommenced leased square feet. |
| | | | | | |
| 1) | Primary markets means the following two metropolitan areas in the U.S., each generally consisting of more than 300 million square feet of industrial space: Chicago and Atlanta. Secondary markets means non-primary markets, each generally consisting of between 100 million and 300 million square feet of industrial space, including the following metropolitan areas in the U.S.: Boston, Cincinnati, Cleveland, Columbus, Indianapolis, Jacksonville, Kansas City, Memphis, Milwaukee, Philadelphia, South Florida, and St. Louis. Our definitions of primary and secondary markets may vary from the definitions of these terms used by investors, analysts, or other industrial REITs. |
| 2) | Annualized base rent is calculated as monthly contracted base rent as of June 30, 2021, multiplied by 12. Excludes rent abatements. |
| 3) | Represents total direct consideration paid prior to the allocations per U.S. GAAP. |
| 4) | The gross book value of real estate assets as of June 30, 2021 excluding $7,473 in leasehold improvements and assets related to Corporate activities and the finance lease right-of-use asset of $911 related to the ground sublease at 2100 International Parkway. Gross book value of real estate assets excludes depreciation and the allocation of the acquisition cost related to intangible assets and liabilities required by U.S. GAAP. |
| Net Operating Income (NOI): We consider net operating income, or NOI, to be an appropriate supplemental measure to net income in that it helps both investors and management understand the core operations of our properties. We define NOI as total revenue (including rental revenue and tenant reimbursements) less property-level operating expenses. NOI excludes depreciation and amortization, general and administrative expenses, impairments, gain/loss on sale of real estate, interest expense, and other non-operating items. |
| |
| Cash Net Operating Income - (Cash NOI): We define Cash NOI as NOI excluding straight-line rent adjustments and amortization of above and below market leases. |
| |
| EBITDAre and Adjusted EBITDA: We define earnings before interest, taxes, depreciation and amortization for real estate in accordance with the standards established by the National Association of Real Estate Investment Trusts (“NAREIT”). EBITDAre represents net income (loss), computed in accordance with GAAP, before interest expense, tax, depreciation and amortization, gains or losses on the sale of rental property, and loss on impairments. We calculate Adjusted EBITDA by adding or subtracting from EBITDAre the following items: (i) non-cash stock compensation, (ii) gain (loss) on extinguishment of debt, (iii) acquisition expenses (iv) the proforma impacts of acquisition and dispositions and (v) non-cash impairments on real estate lease. We believe that EBITDAre and Adjusted EBITDA are helpful to investors as supplemental measures of our operating performance as a real estate company as they are direct measures of the actual operating results of our industrial properties. EBITDAre and Adjusted EBITDA should not be used as measures of our liquidity and may not be comparable to how other REITs' calculate EBITDAre and Adjusted EBITDA. |
| |
Funds From Operations ("FFO"): Funds from operations, or FFO, is a non-GAAP financial measure that is widely recognized as a measure of REIT operating performance. We consider FFO to be an appropriate supplemental measure of our operating performance as it is based on a net income analysis of property portfolio performance that excludes non-cash items such as depreciation. The historical accounting convention used for real estate assets requires straight-line depreciation of buildings and improvements, which implies that the value of real estate assets diminishes predictably over time. Since real estate values rise and fall with market conditions, presentations of operating results for a REIT using historical accounting for depreciation could be less informative. In December 2018, NAREIT issued a white paper restating the definition of FFO. The purpose of the restatement was not to change the fundamental definition of FFO, but to clarify existing NAREIT guidance. The restated definition of FFO is as follows: Net Income (calculated in accordance with GAAP), excluding: (i) Depreciation and amortization related to real estate, (ii) Gains and losses from the sale of certain real estate assets, (iii) Gain and losses from change in control, and (iv) Impairment write-downs of certain real estate assets and investments in entities when the impairment is directly attributable to decreases in the value of depreciable real estate held by the entity.
We define FFO consistent with the NAREIT definition. Adjustments for unconsolidated partnerships and joint ventures will be calculated to reflect FFO on the same basis. Other equity REITs may not calculate FFO as we do, and accordingly, our FFO may not be comparable to such other REITs’ FFO. FFO should not be used as a measure of our liquidity, and is not indicative of funds available for our cash needs, including our ability to pay dividends. |
| |
| Core Funds from Operations (“Core FFO”): Core FFO represents FFO reduced by dividends paid (or declared) to holders of our preferred stock and excludes certain non-cash operating expenses such as impairment on real estate lease, unrealized appreciation/(depreciation) of warrants and loss on extinguishment of debt. As with FFO, our reported Core FFO may not be comparable to other REITs’ Core FFO, should not be used as a measure of our liquidity, and is not indicative of our funds available for our cash needs, including our ability to pay dividends. |
| |
Adjusted Funds from Operations attributable to common stockholders (“AFFO”): Adjusted funds from operations, or AFFO, is presented in addition to Core FFO. AFFO is defined as Core FFO, excluding certain non-cash operating revenues and expenses, acquisition and transaction related costs for transactions not completed and recurring capitalized expenditures. Recurring capitalized expenditures include expenditures required to maintain and re-tenant our properties, tenant improvements and leasing commissions. AFFO further adjusts Core FFO for certain other non-cash items, including the amortization or accretion of above or below market rents included in revenues, straight line rent adjustments, non-cash equity compensation and non-cash interest expense.
We believe AFFO provides a useful supplemental measure of our operating performance because it provides a consistent comparison of our operating performance across time periods that is comparable for each type of real estate investment and is consistent with management’s analysis of the operating performance of our properties. As a result, we believe that the use of AFFO, together with the required GAAP presentations, provide a more complete understanding of our operating performance. As a result, we believe that the use of AFFO, together with the required GAAP presentations, provide a more complete understanding of our operating performance.
As with Core FFO, our reported AFFO may not be comparable to other REITs’ AFFO, should not be used as a measure of our liquidity, and is not indicative of our funds available for our cash needs, including our ability to pay dividends. |
| |
| Net Debt and Preferred stock to Adjusted EBITDA: Net debt and preferred stock to Adjusted EBITDA is a non-GAAP financial measure that we believe is useful to investors as a supplemental measure in evaluating balance sheet leverage. Net debt and preferred stock is equal to the sum of total consolidated and our pro rata share of unconsolidated joint venture debt less cash, cash equivalents, and restricted cash, plus preferred stock calculated at its liquidation preference as of the end of the period. |
| |
| |
| Joint Venture Financial Information: We present components of balance sheet and operating results information related to our real estate joint venture, which are not presented, or intended to be presented, in accordance with GAAP. We present the proportionate share of certain financial line items by applying our noncontrolling economic interest ownership percentage to each financial item to arrive at the amount of such cumulative noncontrolling interest share of each component presented. In addition, we present components of balance sheet and portfolio information at 100% of the joint venture. We believe this information can help investors estimate the balance sheet and operating results information related to our unconsolidated joint venture. Presenting this information provides a perspective not immediately available from consolidated financial statements and one that can supplement an understanding of the joint venture assets, liabilities, revenues, and expenses included in our consolidated results. Joint venture financial information should not be considered an alternative to our consolidated financial statements, which are prepared in accordance with GAAP. |
| |
| Lease Type: We define our triple net leases in that the tenant is responsible for all aspects of and costs related to the property and its operation during the lease term. We define our modified net leases in that the landlord is responsible for some property related expenses during the lease term, but the cost of most of the expenses is passed through to the tenant. We define our gross leases in that the landlord is responsible for all aspects of and costs related to the property and its operation during the lease term. |
| |
| Non-Recurring Capital Expenditures: Non-recurring capital expenditures include capital expenditures of long lived improvements required to upgrade/replace existing systems or items that previously did not exist. Non-recurring capital expenditures also include costs associated with repositioning a property, redevelopment/development and capital improvements known at the time of acquisition. |
| |
| Occupancy: We define occupancy as the percentage of total leasable square footage as the earlier of lease term commencement or revenue recognition in accordance to GAAP as of the close of the reporting period. |
| |
| Preferred Stock - Series B: On December 14, 2018, we completed the offering of 4,411,764 shares of the Company’s Series B Convertible Redeemable Preferred Stock at a purchase price of $17.00 per share for an aggregate consideration of $75,000 or $71,800, net of issuance costs. The relevant features of the Series B Preferred Stock ("Series B") are as follows ($ in thousands): |
| Year | | Cash Pay Rate | | Annual
Cash
Dividend | | Liquidation
Preference1 | | Conversion and Redemption Options2 |
| 1 - 2019 | | 3.25% | | $ �� 2,438 | | $ 97,230 | | No conversion or redemption options |
| 2 - 2020 | | 3.50% | | $ 2,625 | | $ 97,230 | | No conversion or redemption options |
| 3 - 2021 | | 3.75% | | $ 2,813 | | $ 97,230 | | No conversion or redemption options |
| 4 - 2022 | | 4.00% | | $ 3,000 | | $ 97,230 | | - Commencing 1/1/2022, holders of the Series B have the right to convert at the liquidation preference;
- Commencing 1/1/2022, Plymouth can elect to convert up to 100% of Series B upon the 20-day VWAP per share of Plymouth's common stock being greater than $26.35;
- Neither option expires |
| 5 - 2023 | | 6.50% | | $ 4,875 | | $ 105,971 | | Commencing 1/1/2023, Plymouth can redeem up to 50% of the Series B at the liquidation preference |
| 6 - 20243 | | 12.00% | | $ 9,000 | | $ 114,028 | | - Commencing 1/1/2024, Plymouth can redeem up to 100% of the Series B at the liquidation preference;
- Commencing 12/31/2024, any outstanding shares of Series B will automatically covert into common stock, subject to the 19.99% threshold4 |
| 1) | Liquidation Preference is defined as the greater of (a) the amount necessary for the holder to achieve a 12% internal rate of return, taking into account cash dividends paid and (b) $21.89, plus accrued and unpaid dividends. |
| 2) | Conversion and Redemption Options grant Plymouth the right to settle the conversion/redemption via: I) Physical Settlement with each share of Series B being converted to a number of common shares equal to the greater of (i) one share of common stock or (ii) the quotient of the liquidation preference divided by the 20-Day VWAP, subject to the 19.99% threshold, or II) Cash Settlement whereby we pay for each share of Series B being converted in cash in an amount equal to the greater of (i) the liquidation preference or (ii) the 20-Day VWAP, or III) Combination Settlement whereby Plymouth shall pay, or deliver, in respect to each share of Series B being converted, a settlement amount equal to either (i) cash equal to the Cash Settlement amount or (ii) number of shares of common stock equal to the Physical Settlement. |
| 3) | Effective 1/1/2025, in the event the Series B Preferred Stock has not been settled, the holders obtain certain governance rights, including the option to elect an additional two members to Plymouth's Board of Directors. |
| 4) | The 19.99% Threshold requires approval from the shareholders of Plymouth's common stock to approve the conversion of any Series B Preferred Stock into common shares that exceeds 19.99% of the outstanding common shares as of December 14, 2018. |
| Recurring Capital Expenditures: Recurring capitalized expenditures includes capital expenditures required to maintain and re-tenant our buildings, tenant improvements and leasing commissions. |
| |
| Replacement Cost: is based on the Marshall & Swift valuation methodology for the determination of building costs. The Marshall & Swift building cost data and analysis is widely recognized within the U.S. legal system and has been written into in law in over 30 U.S. states and recognized in the U.S. Treasury Department Internal Revenue Service Publication. Replacement cost includes land reflected at the allocated cost in accordance with Financial Accounting Standards Board ("FASB") ASC 805. |
| |
| Same Store Portfolio: The Same Store Portfolio is a subset of the consolidated portfolio and includes properties that are wholly owned by the Company as of December 31, 2019. The Same Store Portfolio is evaluated and defined on an annual basis based on the growth and size of the consolidated portfolio. The Same Store Portfolio excludes properties that were or will be classified as repositioning or lease-up during 2020 and 2021. For 2021, the Same Store Portfolio consists of 81 properties aggregating 17,093,547 rentable square feet. Properties that are being repositioned generally are defined as those properties where a significant amount of space is held vacant in order to implement capital improvements that enhance the functionality, rental cash flows, and value of that property. We define a significant amount of space at a property using both the size of the space and its proportion to the properties total square footage as a determinate. Our computation of same store NOI may not be comparable to other REITs. |
| |
| VWAP: The volume weighted average price of a trading security. |
| |
| Weighted Average Lease Term Remaining: The average contractual lease term remaining as of the close of the reporting period (in years) weighted by square footage. |
| |