| Introduction | | |
| Executive Summary | | 2 |
| Management, Board of Directors, Investor Relations, and Equity Coverage | | 2 |
| Portfolio Statistics | | 3 |
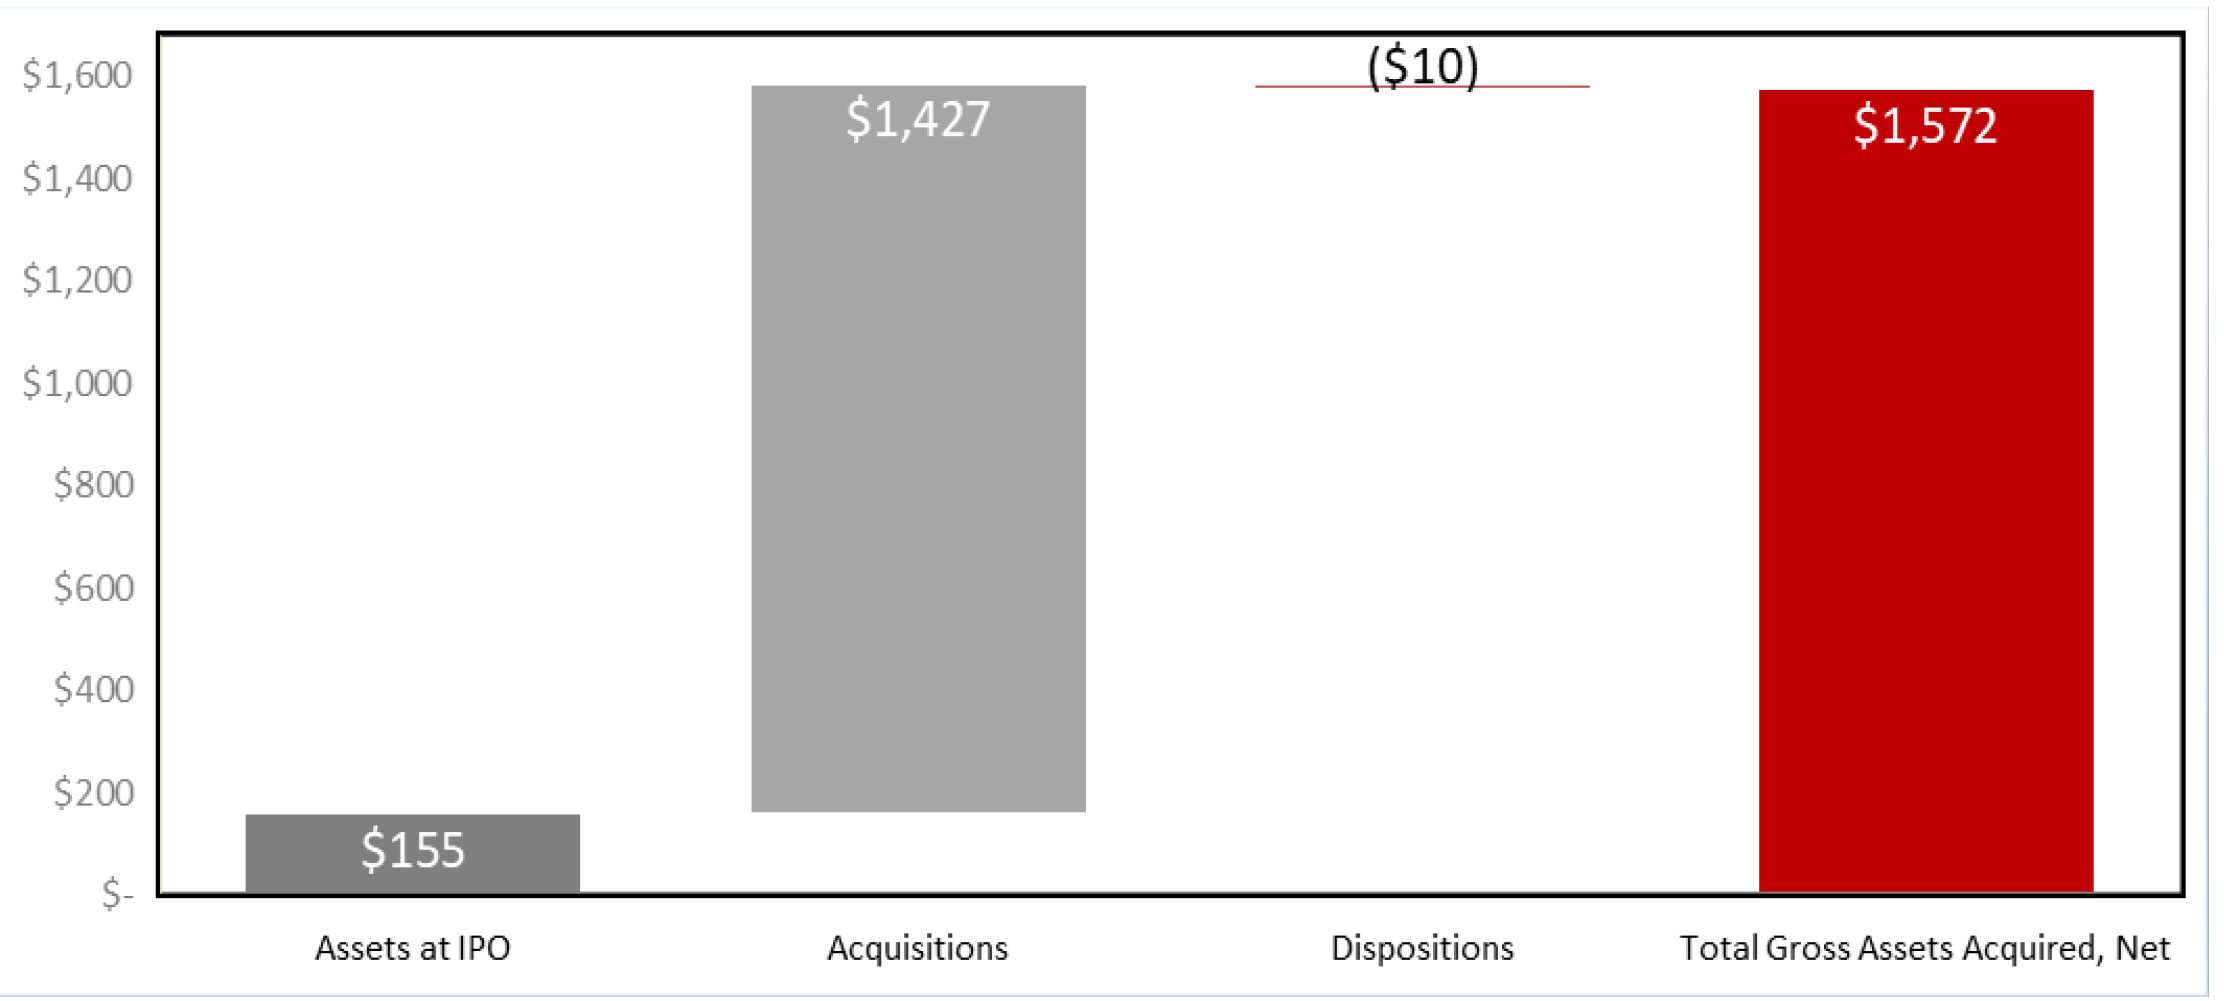
| Acquisition Activity | | 3 |
| Select Recent Acquisitions | | 4 |
| Value Creation | | 5 |
| Development Projects | | 5 |
| Guidance | | 6 |
| Financial Information | | |
| Same Store Net Operating Income (NOI) | | 7 |
| Consolidated Statements of Operations | | 8 |
| Consolidated NOI | | 9 |
| Earnings Before Interest, Taxes, Depreciation and Amortization for Real Estate (EBITDAre) | | 9 |
| Funds from Operations (FFO), Core FFO & Adjusted Funds from Operations (AFFO) | | 9 |
| Consolidated Balance Sheets | | 10 |
| Capital Structure and Debt Summary | | 11 |
| Capital Markets Activity | | 11 |
| Net Asset Value Components | | 12 |
| Operational & Portfolio Information | | |
| Leasing Activity | | 13 |
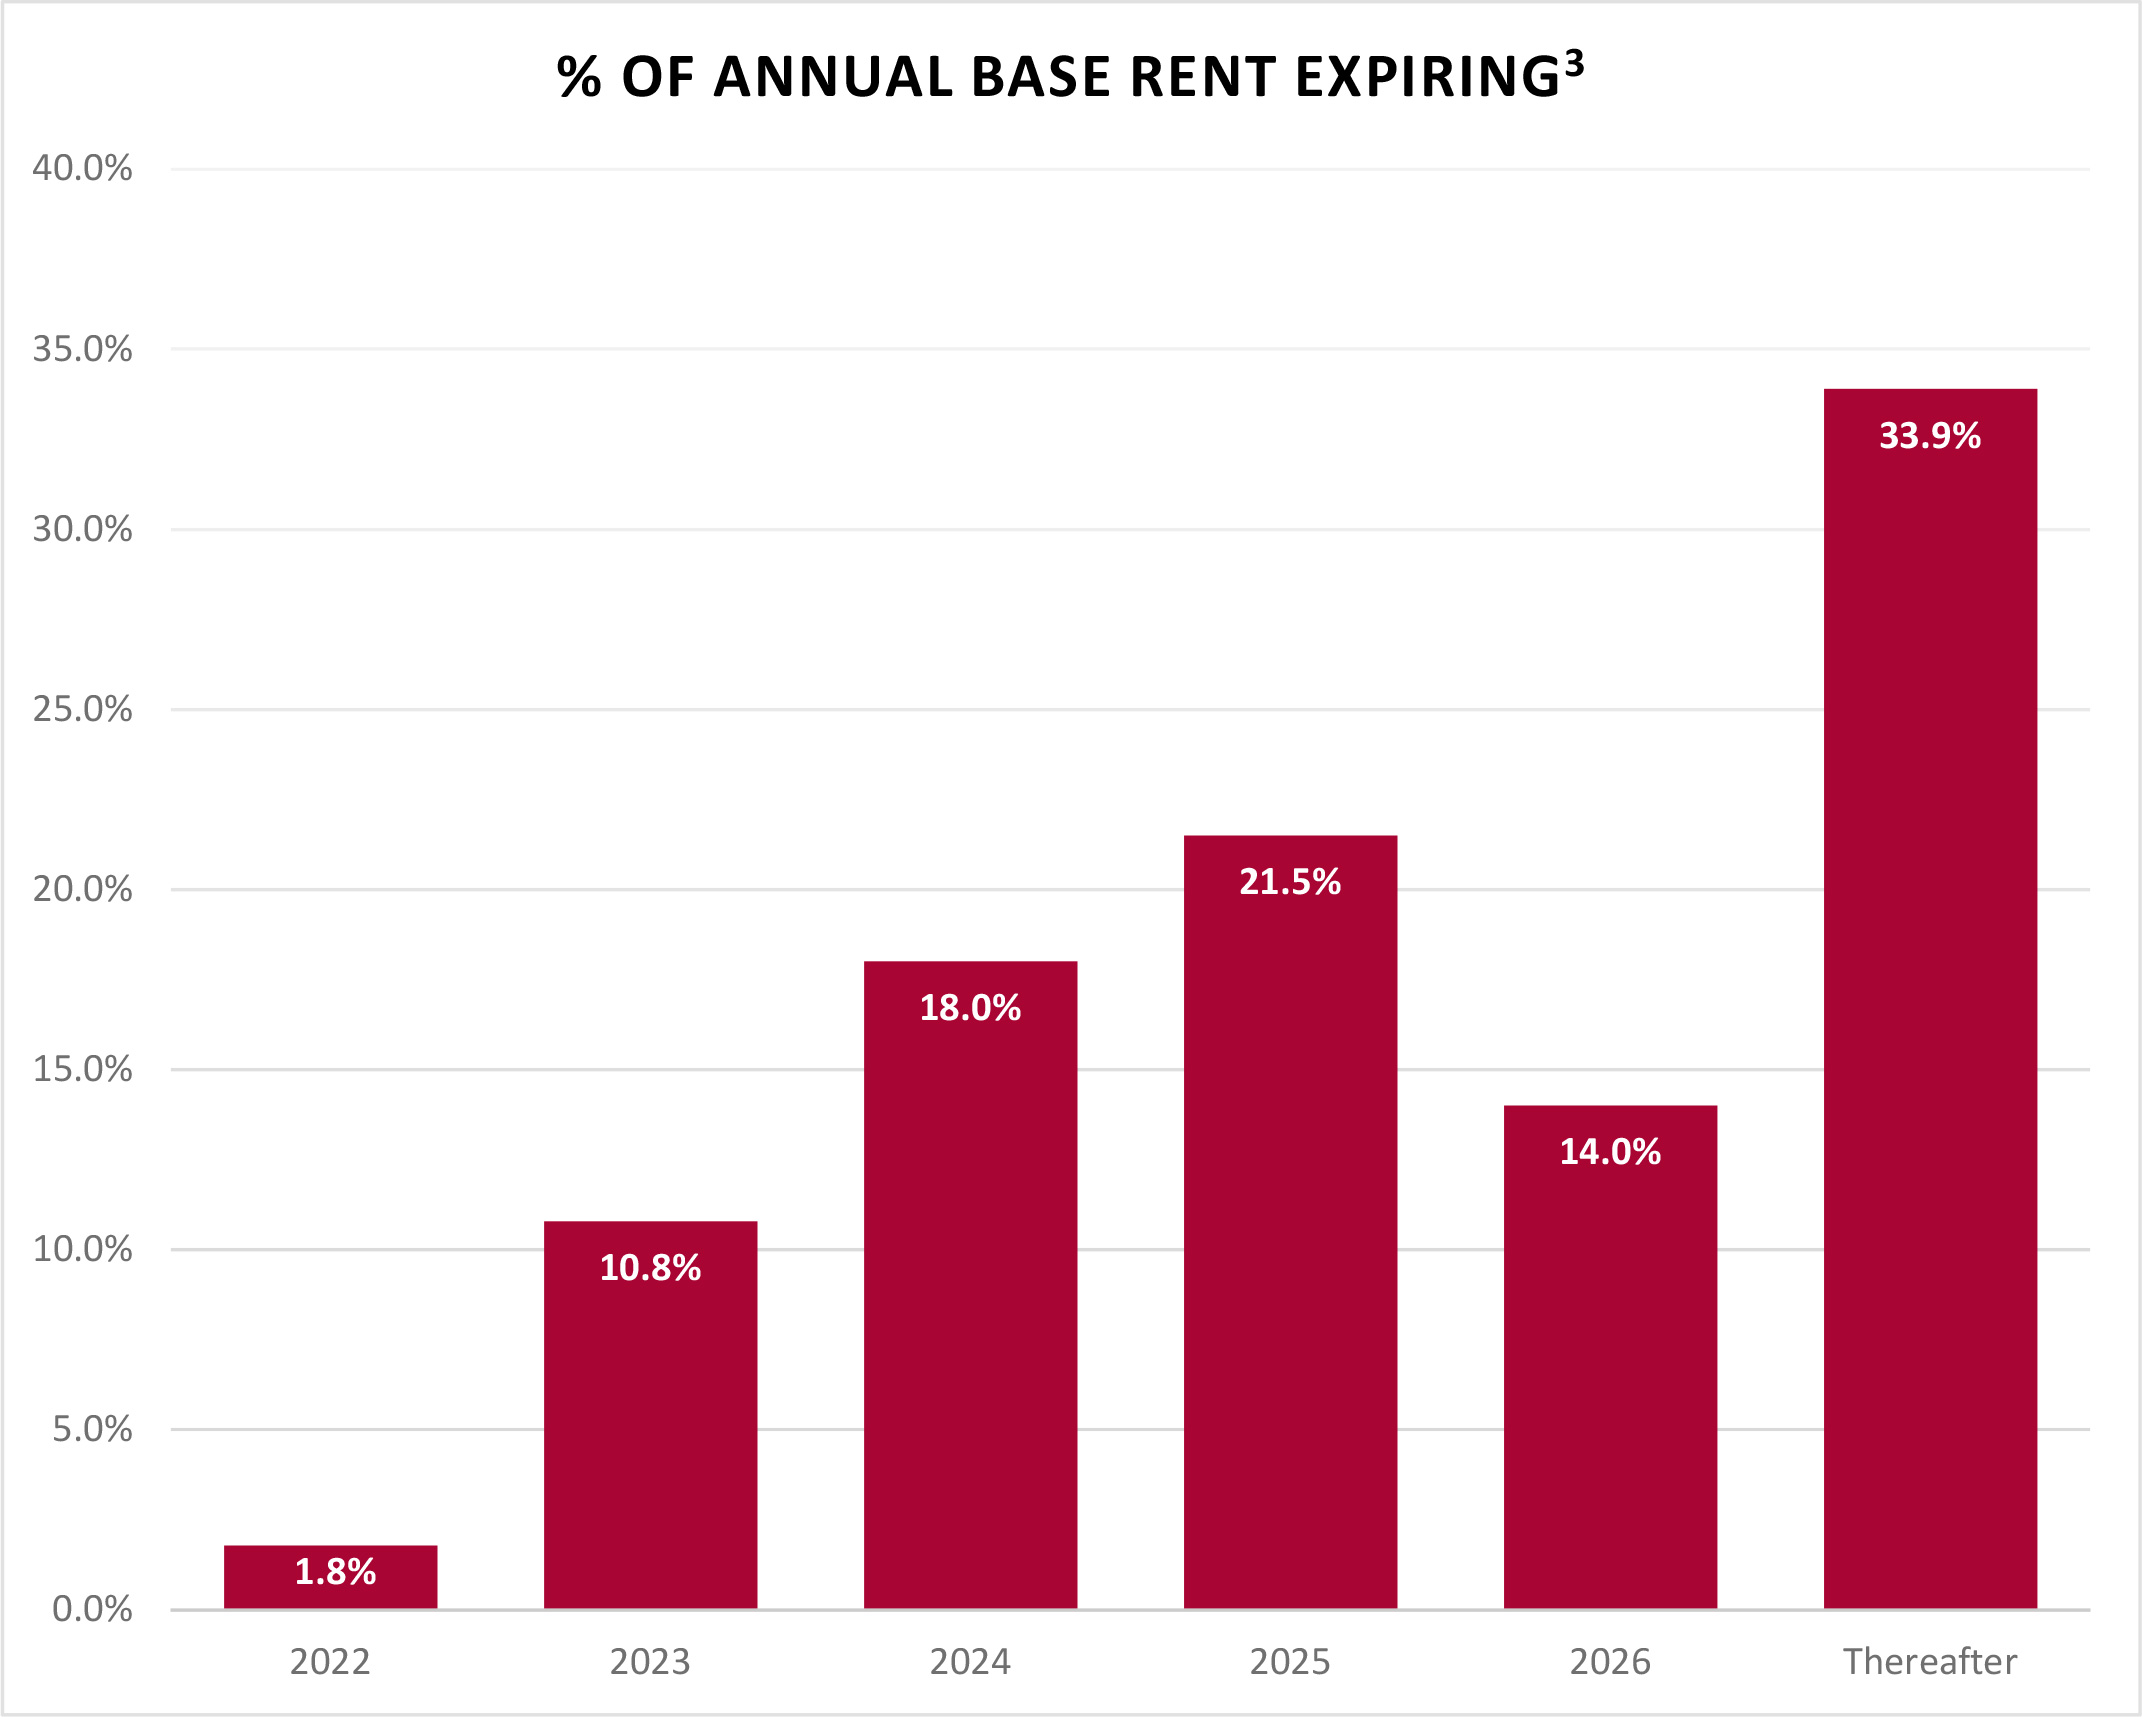
| Lease Expiration Schedule | | 13 |
| Leased Square Feet and Annualized Base Rent by Tenant Industry | | 14 |
| Leased Square Feet and Annualized Base Rent by Type | | 15 |
| Top 10 Tenants by Annualized Base Rent | | 16 |
| Lease Segmentation by Size | | 16 |
| Rentable Square Feet and Annualized Base Rent by Market | | 17 |
| Total Acquisition and Replacement Cost by Market | | 17 |
| Appendix | | |
| Glossary | | 18 |
| | | |
| Forward-Looking Statements: This Supplemental Information contains forward-looking statements within the meaning of the U.S. federal securities laws. We make statements in this Supplemental Information that are forward-looking statements, which are usually identified by the use of words such as “anticipates,” “believes,” “estimates,” “expects,” “intends,” “may,” “plans” “projects,” “seeks,” “should,” “will,” and variations of such words or similar expressions. Our forward-looking statements reflect our current views about our plans, intentions, expectations, strategies and prospects, which are based on the information currently available to us and on assumptions we have made. Although we believe that our plans, intentions, expectations, strategies and prospects as reflected in or suggested by our forward-looking statements are reasonable, we can give no assurance that our plans, intentions, expectations, strategies or prospects will be attained or achieved and you should not place undue reliance on these forward-looking statements. Additionally, unforeseen factors emerge from time to time, and we cannot predict which factors will arise or their ultimate impact on our business or the extent to which any such factor, or combination of factors, may cause actual results to differ materially from those contained in any forward-looking statements. One of these factors is the outbreak of the novel coronavirus (COVID-19), the impact of which is difficult to fully assess at this time due to, among other factors, uncertainty regarding the severity and duration of the outbreak domestically and internationally and the effectiveness of efforts to contain the spread of the virus and its resulting direct and indirect impact on the U.S. economy and economic activity. Furthermore, actual results may differ materially from those described in the forward-looking statements and may be affected by a variety of risks and factors. Any forward-looking statement speaks only as of the date on which it is made. New risks and uncertainties arise over time, and it is not possible for us to predict those events or how they may affect us. Except as required by law, we are not obligated to, and do not intend to, update or revise any forward-looking statements, whether as a result of new information, future events or otherwise. | |
| | |
| Definitions and Reconciliations: For definitions of certain terms used throughout this Supplemental Information, including certain non-GAAP financial measures, refer to the Glossary on pages 18-19. For reconciliations of the non-GAAP financial measures to the most directly comparable U.S. GAAP measures, refer to page 9. | |
| |
| |
| Corporate | | Investor Relations | | Transfer Agent | | | |
| | | | | | | | | |
| 20 Custom House Street, 11th Floor | | Tripp Sullivan | | Continental Stock Transfer & Trust Company | | | |
| Boston, Massachusetts 02110 | | | SCR Partners | | 1 State Street, 30th Floor | | | |
| 617.340.3814 | | | 615.942.7077 | | New York, NY 10004 | | | |
| www.plymouthreit.com | | | tsullivan@scr-ir.com | | 212.509.4000 | | | |
| | | | | | | | | |
| Executive Management |
| | | | | | | | | |
| Jeffrey E. Witherell | | | Pendleton P. White, Jr. | | Anthony J. Saladino | | James M. Connolly | |
| Chief Executive Officer | | | President and Chief Investment | | Executive Vice President | | Executive Vice President | |
| and Chairman | | | Officer | | and Chief Financial Officer | | Asset Management | |
| | | | | | | | | |
| Anne A. Hayward | | | | | | | | |
| Senior Vice President | | | | | | | | |
| and General Counsel | | | | | | | | |
| | | | | | | | | |
| Board of Directors |
| | | | | | | | | |
| Martin Barber | | Philip S. Cottone | | Richard J. DeAgazio | | David G. Gaw | |
| Independent Director | | Independent Director | | Independent Director | | Lead Independent Director | |
| | | | | | | | | |
| John W. Guinee | | Caitlin Murphy | | Pendleton P. White, Jr. | | Jeffrey E. Witherell | |
| Independent Director | | | Independent Director | | President and Chief Investment | | Chief Executive Officer | |
| | | | | | Officer | | and Chairman | |
| | | | | | | | | |
| Equity Research Coverage1 |
| | | | | | | | | |
| Baird | | B Riley Securities | | JMP Securities | | Truist Securities | |
| Dave Rodgers | | | Bryan Maher | | Mitch Germain | | Anthony Hau | |
| 216.737.7341 | | | 646.885.5423 | | 212.906.3537 | | 212.303.4176 | |
| | | | | | | | | |
| BMO Capital Markets | | | Colliers Securities | | KeyBanc Capital Markets | | | |
| John Kim | | | Barry Oxford | | Todd Thomas | | | |
| 212.885.4115 | | | 203.961.6573 | | 917.368.2375 | | | |
Portfolio statistics and acquisitions include wholly owned industrial properties only; excludes our property management office located in Columbus, Ohio.
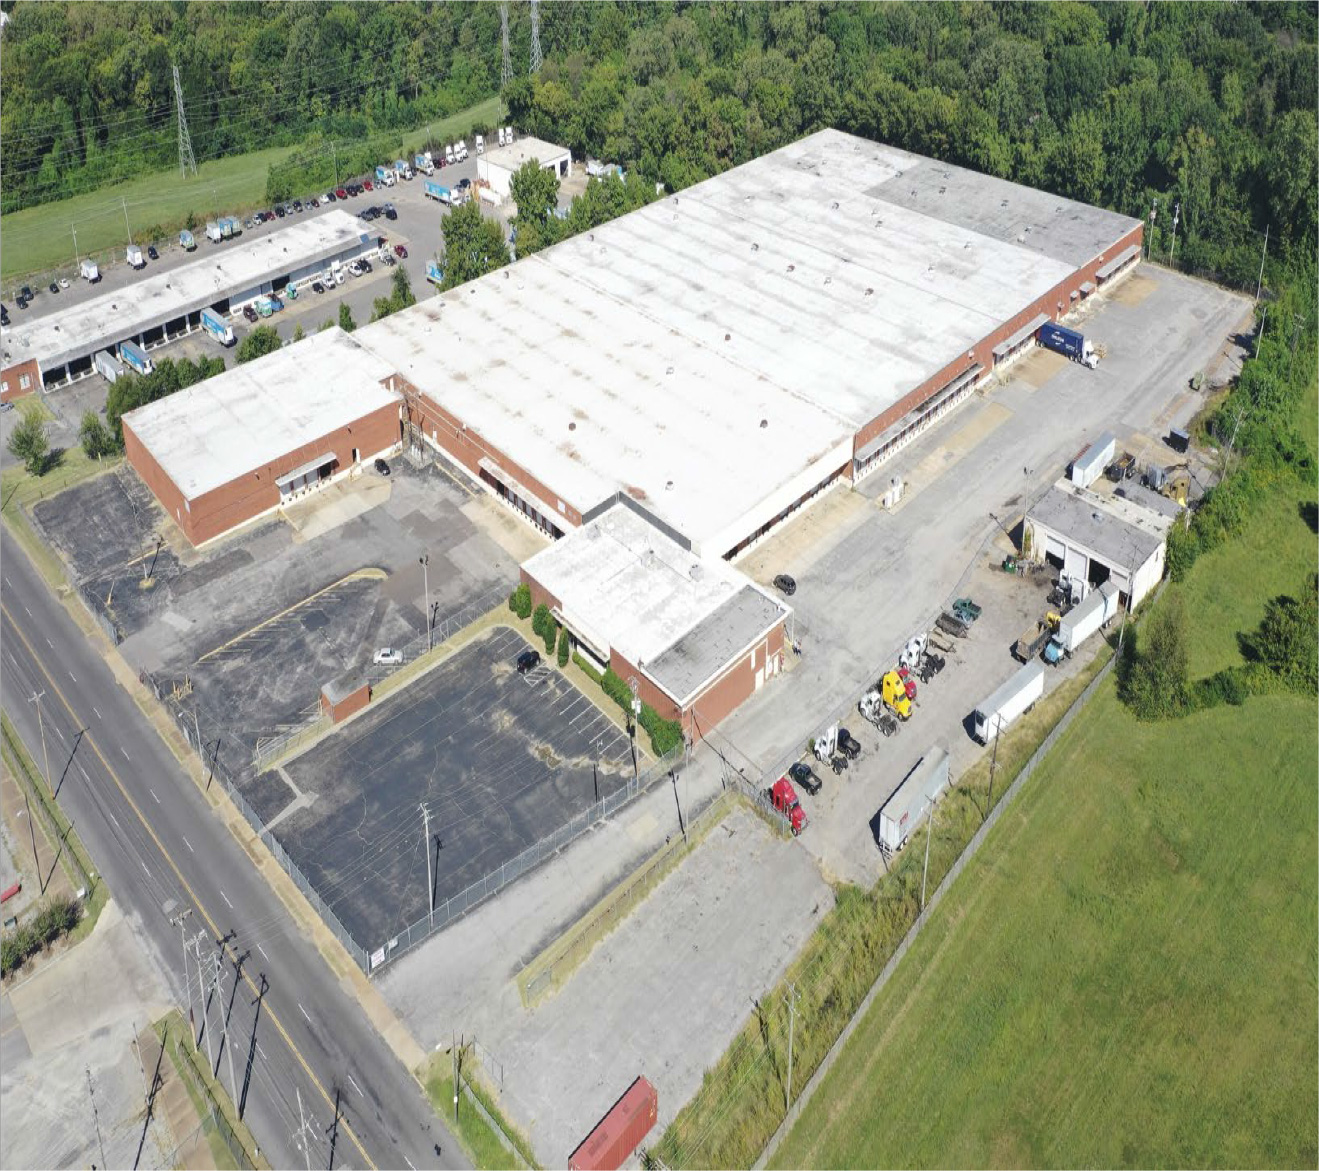
| Memphis Industrial Portfolio | | | | |
 | | | | |
| | Location | Memphis | |
| | Acquisition Date | March-22 | |
| | # of Buildings | 28 | |
| | Purchase Price1 | $102,355 | |
| | Square Footage | 2,320,773 | |
| | Occupancy | 91.0% | |
| | WA Lease Term Remaining | 3.0 years | |
| | Projected Initial Yield | 6.6% | |
| | Purchase Price/SF2 | $44.10 | |
| | Replacement Cost/SF2 | $78.02 | |
| | Multi-Tenant % | 36% | |
| | Single-Tenant % | 64% | |
| | | | |
| | Location Characteristics: Memphis experienced 11.9 million SF of positive absorption in 2021 and an influx of Fortune 500 Co's in recent years. Ford is building an electric vehicle manufacturing facility that will provide 6,000 new jobs by 2025, and FedEx's global headquarters is based here, making the international airport one of the busiest cargo airports in the country | |
| | | | |
| | Market Insight: Employment has increased 12% since 2011 and there has been an uptick in spec development in recent years, showing signs of economic growth in the area, however, availability rate and vacancy rate are at all-time lows, allowing for projected rent growth to be at 5% per year over the next 5 years (source: CBRE) | |
| | | | |
| | Portfolio Fit: Brings Company's scale in the Memphis market to greater than 4.7 million square feet | |
| | | | | | | |
| | | | | | | | |
| Re-leasing / No downtime | | Lease-up / Building Refurbishment | | New Industrial Development |
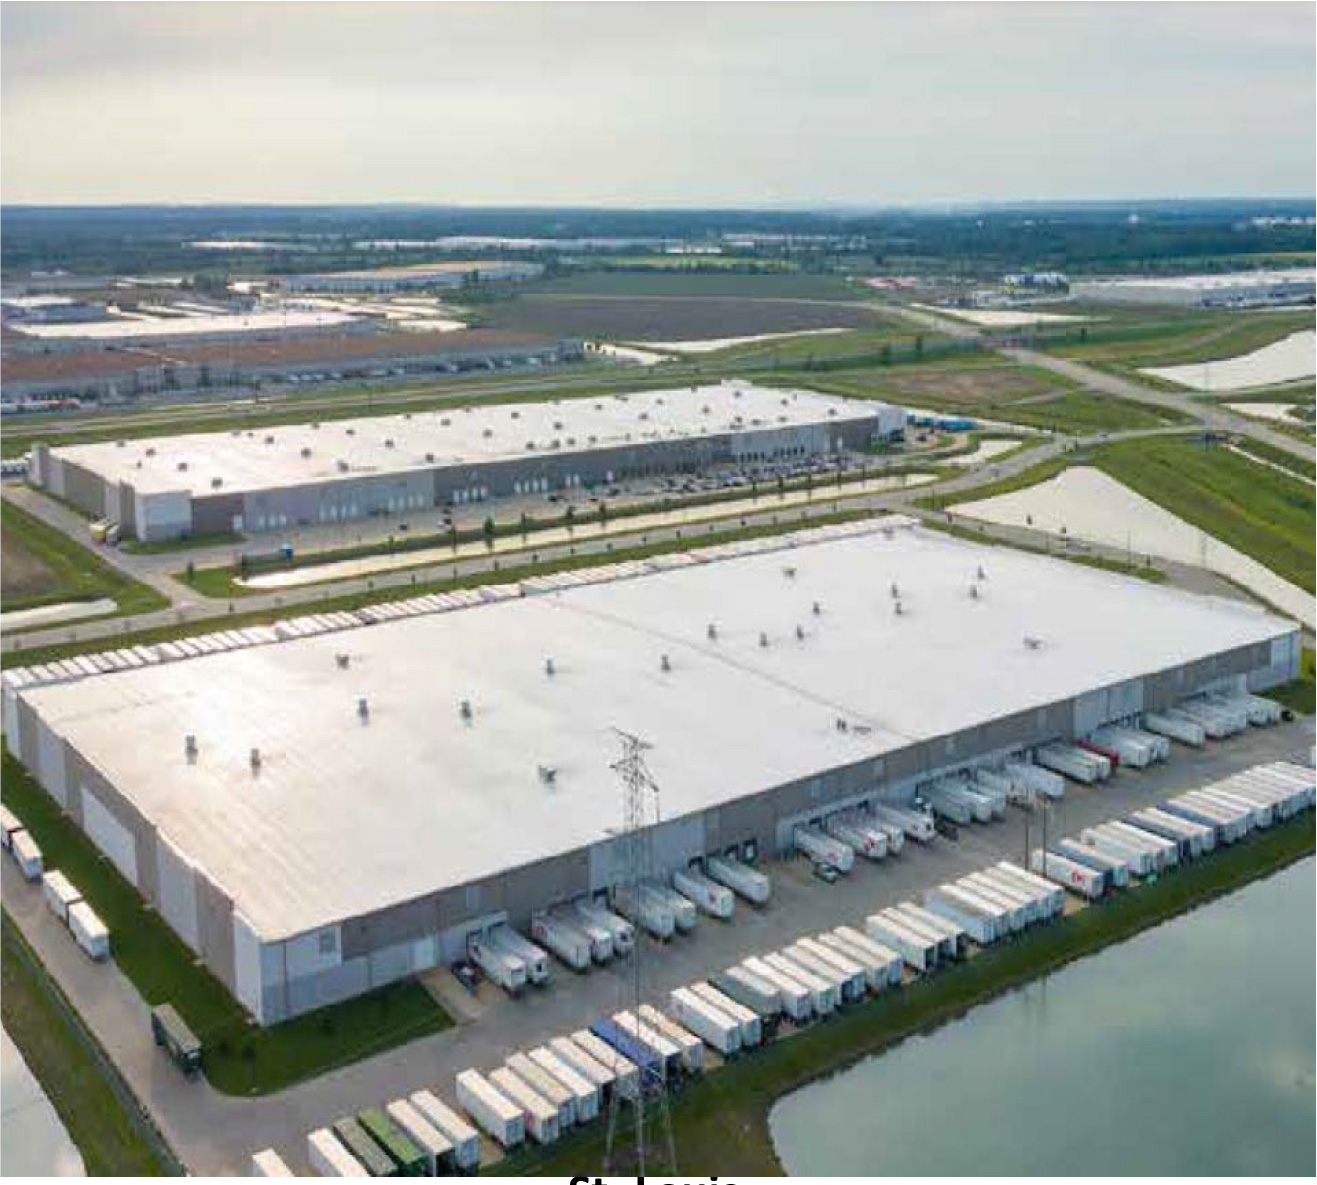 | |  | | 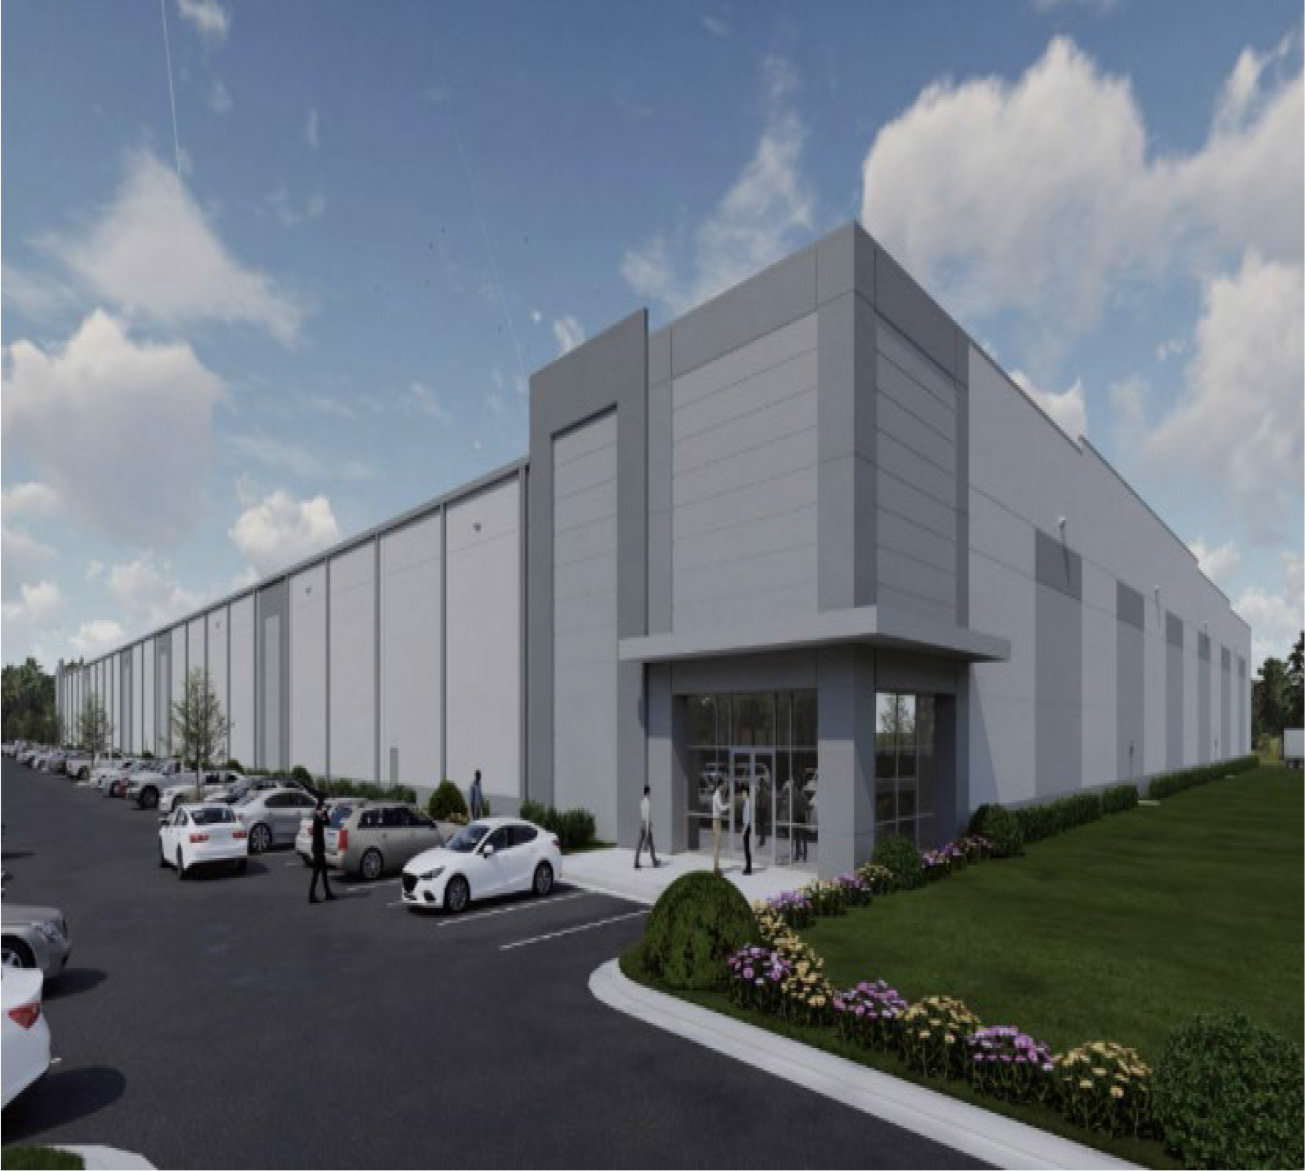 |
| St. Louis | | Memphis | | Atlanta |
| Executed two 3-year lease renewals with two Top-10 tenants by ABR encompassing approximately 1.2 million square feet across neighboring buildings | | Executed a 312,000 SF 5-year lease with annual escalators of 3.0% at a rental rate increase of 56% over prior rents | | Acquired single-tenant industrial building in January 2020 with ~ 65 acres of developable land |
| The starting rental rates for the renewal leases average a 20% increase over the expiring rents with a 2.75% annual escalators | | Tenant move-out was addressed expeditiously. The building will undergo roof and fire suppression upgrades as a part of the new lease transaction | | Broke ground on new 237,000 SF building during Q2 2021 with an estimated turnkey in Q4 2022 at a cost of ~$13.6M, an add'l 180,000 SF building is projected for Q4 2022 at a cost of $12.2M |
| The properties were acquired at a going-in yield of 5.75%, which now has improved by approximately 125 bps upon stabilization | | The property was acquired at a going-in yield of 8.0%, which now has increased to a stabilized yield of over 11.0% | | Flexible design planned for both buildings to allow for demising. There is strong prospective tenant interest for multi- and single-tenant occupancy |
| | | For the Three Months Ended September 30, | | For the Nine Months Ended September 30, |
| | | 2022 | | 2021 | | 2022 | | 2021 |
| | | | | | | | | |
| Revenues: | | | | | | | | |
| Rental revenue | | $ 36,746 | | $ 27,454 | | $ 104,509 | | $ 77,635 |
| Tenant recoveries | | 11,042 | | 8,423 | | 31,611 | | 22,833 |
| Management fee revenue and other income1 | | 2 | | 85 | | 90 | | 265 |
| Total revenues | | $ 47,790 | | $ 35,962 | | $ 136,210 | | $ 100,733 |
| | | | | | | | | |
| Operating expenses: | | | | | | | | |
| Property | | 14,495 | | 12,032 | | 42,369 | | 34,398 |
| Depreciation and amortization | | 24,860 | | 18,305 | | 71,759 | | 50,984 |
| General and administrative | | 4,078 | | 3,264 | | 11,776 | | 9,582 |
| Total operating expenses | | $ 43,433 | | $ 33,601 | | $ 125,904 | | $ 94,964 |
| | | | | | | | | |
| Other income (expense): | | | | | | | | |
| Interest expense | | (8,983) | | (4,906) | | (23,303) | | (14,489) |
| Earnings (loss) in investment of unconsolidated joint venture2 | | - | | (178) | | (147) | | (675) |
| Loss on extinguishment of debt | | - | | - | | (2,176) | | - |
| Gain on sale of real estate3 | | - | | - | | - | | 590 |
| Unrealized (appreciation) depreciation of warrants4 | | - | | (926) | | 1,760 | | (1,809) |
| Total other income (expense) | | $ (8,983) | | $ (6,010) | | $ (23,866) | | $ (16,383) |
| | | | | | | | | |
| Net loss | | $ (4,626) | | $ (3,649) | | $ (13,560) | | $ (10,614) |
| | | | | | | | | |
| Less: Net loss attributable to non-controlling interest | | (55) | | (57) | | (170) | | (193) |
| | | | | | | | | |
| Net loss attributable to Plymouth Industrial REIT, Inc. | | $ (4,571) | | $ (3,592) | | $ (13,390) | | $ (10,421) |
| | | | | | | | | |
| Less: Preferred stock dividends | | 930 | | 1,652 | | 3,949 | | 4,956 |
| Less: Series B preferred stock accretion to redemption value | | 2,371 | | 1,807 | | 4,621 | | 5,421 |
| Less: Loss on extinguishment of Series A Preferred Stock | | 56 | | - | | 80 | | - |
| Less: Amount allocated to participating securities | | 62 | | 48 | | 194 | | 153 |
| | | | | | | | | |
| Net loss attributable to common stockholders | | $ (7,990) | | $ (7,099) | | $ (22,234) | | $ (20,951) |
| | | | | | | | | |
| Net loss basic and diluted per share attributable to common stockholders | | $ (0.19) | | $ (0.22) | | $ (0.57) | | $ (0.71) |
| | | | | | | | | |
| Weighted-average common shares outstanding basic and diluted | | 41,128 | | 32,302 | | 38,839 | | 29,637 |
| | | | | | | | | |
| | | | | | | | | |
| | | For the Three Months Ended September 30, | | For the Nine Months Ended September 30, |
| | | 2022 | | 2021 | | 2022 | | 2021 |
| | | | | | | | | |
| Net loss | | $ (4,626) | | $ (3,649) | | $ (13,560) | | $ (10,614) |
| General and administrative | | 4,078 | | 3,264 | | 11,776 | | 9,582 |
| Depreciation and amortization | | 24,860 | | 18,305 | | 71,759 | | 50,984 |
| Interest expense | | 8,983 | | 4,906 | | 23,303 | | 14,489 |
| (Earnings) loss in investment of unconsolidated joint venture1 | | - | | 178 | | 147 | | 675 |
| Loss on extinguishment of debt | | - | | - | | 2,176 | | - |
| Gain on sale of real estate | | - | | - | | - | | (590) |
| Unrealized appreciation (depreciation) of warrants2 | | - | | 926 | | (1,760) | | 1,809 |
| Management fee revenue and other Income3 | | (2) | | (85) | | (90) | | (265) |
| Net Operating Income | | $ 33,293 | | $ 23,845 | | $ 93,751 | | $ 66,070 |
| Net loss | | $ (4,626) | | $ (3,649) | | $ (13,560) | | $ (10,614) |
| Gain on sale of real estate | | - | | - | | - | | (590) |
| Depreciation and amortization | | 24,860 | | 18,305 | | 71,759 | | 50,984 |
| Depreciation and amortization from unconsolidated joint venture | | - | | 374 | | 268 | | 1,176 |
| FFO | | $ 20,234 | | $ 15,030 | | $ 58,467 | | $ 40,956 |
| Preferred stock dividends | | (930) | | (1,652) | | (3,949) | | (4,956) |
| Acquisition expenses | | 51 | | - | | 201 | | - |
| Unrealized appreciation (depreciation) of warrants2 | | - | | 926 | | (1,760) | | 1,809 |
| Loss on extinguishment of debt | | - | | - | | 2,176 | | - |
| Core FFO | | $ 19,355 | | $ 14,304 | | $ 55,135 | | $ 37,809 |
| Amortization of debt related costs | | 565 | | 424 | | 1,597 | | 1,163 |
| Non-cash interest expense | | 676 | | 41 | | 1,582 | | (31) |
| Stock compensation | | 518 | | 340 | | 1,498 | | 1,219 |
| Capitalized interest | | (315) | | - | | (521) | | - |
| Straight line rent | | (1,319) | | (966) | | (3,045) | | (2,726) |
| Above/below market lease rents | | (541) | | (480) | | (2,632) | | (1,589) |
| Recurring capital expenditures6 | | (1,985) | | (3,312) | | (5,440) | | (6,727) |
| AFFO | | $ 16,954 | | $ 10,351 | | $ 48,174 | | $ 29,118 |
| | | | | | | | | |
| Weighted-average common shares and units outstanding | | 41,906 | | 33,046 | | 39,614 | | 30,436 |
| | | | | | | | | |
| Core FFO attributable to common stockholders and unit holders per share | | $ 0.46 | | $ 0.43 | | $ 1.39 | | $ 1.24 |
| AFFO attributable to common stockholders and unit holders per share | | $ 0.40 | | $ 0.31 | | $ 1.22 | | $ 0.96 |
| | | | | | | | | |
| | | September 30, 2022 | | December 31, 2021 |
| ASSETS | | | |
| Real estate properties: | | | | |
| Land | | $ 231,829 | | $ 201,164 |
| Building and improvements | | 1,306,587 | | 1,052,843 |
| Less accumulated depreciation | | (189,170) | | (142,192) |
| Total real estate properties, net | | $ 1,349,246 | | $ 1,111,815 |
| | | | | | |
| Cash, cash held in escrow and restricted cash | | 36,253 | | 43,374 |
| Deferred lease intangibles, net | | 76,674 | | 75,864 |
| Investment in unconsolidated joint venture1 | | - | | 5,833 |
| Interest rate swaps2 | | 32,404 | | - |
| Other assets | | 36,566 | | 33,919 |
| Total assets | | $ 1,531,143 | | $ 1,270,805 |
| | | | | |
| LIABILITIES, PREFERRED STOCK AND EQUITY | | | |
| Secured debt, net | | $ 390,944 | | $ 352,075 |
| Unsecured debt, net3 | | 514,682 | | 335,840 |
| Accounts payable, accrued expenses and other liabilities | | 74,701 | | 66,880 |
| Deferred lease intangibles, net | | 9,612 | | 10,273 |
| Financing lease liability4 | | 2,243 | | 2,227 |
| | | | | |
| Total liabilities | | $ 992,182 | | $ 767,295 |
| | | | | |
| Preferred stock - Series A | | $ 47,249 | | $ 48,473 |
| Preferred stock - Series B5 | | $ - | | $ 94,437 |
| | | | | |
| Equity: | | | | |
| Common stock | | $ 428 | | $ 361 |
| Additional paid in capital | | 644,447 | | 532,666 |
| Accumulated deficit | | (190,728) | | (177,258) |
| Accumulated other comprehensive income | | 32,002 | | - |
| Total stockholders' equity | | 486,149 | | 355,769 |
| Non-controlling interest | | 5,563 | | 4,831 |
| Total equity | | $ 491,712 | | $ 360,600 |
| | | | | |
| Total liabilities, preferred stock and equity | | $ 1,531,143 | | $ 1,270,805 |
| | | | | |
| | | | | |
| | | | | | |
| | | | September 30, | June 30, | March 31, | December 31, |
| | | | 2022 | 2022 | 2022 | 2021 |
| | Common Shares and Units Outstanding5 | | 43,339 | 40,623 | 37,476 | 36,601 |
| | Closing Price (as of period end) | | $ 16.81 | $ 17.54 | $ 27.10 | $ 32.00 |
| | Market Value of Common Shares6 | | $ 728,529 | $ 712,527 | $ 1,015,600 | $ 1,171,232 |
| | Preferred Stock - Series A (at liquidation preference) | | 49,311 | 50,179 | 50,589 | 50,589 |
| | Preferred Stock - Series B (at liquidation preference)8 | | - | 50,765 | 99,463 | 97,277 |
| | Total Market Capitalization6,7 | | $ 1,688,133 | $ 1,698,312 | $ 2,030,435 | $ 2,022,537 |
| | | | | | | |
| | Dividend / Share (annualized) | | $ 0.88 | $ 0.88 | $ 0.88 | $ 0.84 |
| | Dividend Yield (annualized) | | 5.2% | 5.0% | 3.2% | 2.6% |
| | Total Debt-to-Total Market Capitalization | | 53.9% | 52.1% | 42.6% | 34.8% |
| | Secured Debt as a % of Total Debt | | 43.2% | 44.6% | 45.8% | 52.0% |
| | Unsecured Debt as a % of Total Debt | | 56.8% | 55.4% | 54.2% | 48.0% |
| | Net Debt-to-Annualized Adjusted EBITDA (quarter annualized) | | 7.3x | 7.4x | 7.5x | 6.6x |
| | Net Debt plus Preferred-to-Annualized Adjusted EBITDA (quarter annualized) | | 7.7x | 8.3x | 8.8x | 8.1x |
| | Weighted Average Maturity of Total Debt (years) | | 4.0 | 4.2 | 4.2 | 4.5 |
We have made a number of assumptions with respect to the pro forma effects and there can be no assurance that we would have generated the projected levels of NOI had we actually owned the acquired properties and / or fully stabilized the repositioning / development properties as of the beginning of the period. Refer to Glossary in this Supplemental Information for a definition and discussion of non-GAAP financial measures.
| Tenant | Market | Industry | # of Leases | Total Leased
Square Feet | Expiration | ABR Per
Square Foot | ABR1 | % Total ABR |
| FedEx Supply Chain, Inc. | St. Louis | Logistics & Transportation | 1 | 769,500 | 7/31/2024 | $ 4.50 | $ 3,461,981 | 2.4% |
| Geodis Logistics, LLC | St. Louis | Logistics & Transportation | 1 | 624,159 | 8/31/2025 | 4.25 | 2,652,676 | 1.9% |
| Houghton Mifflin Harcourt Company | Chicago | Education | 1 | 513,512 | 3/31/2026 | 4.49 | 2,305,669 | 1.6% |
| ODW Logistics, Inc. | Columbus | Logistics & Transportation | 1 | 772,450 | 6/30/2025 | 2.93 | 2,261,284 | 1.6% |
| Archway Marketing Holdings, Inc. | Chicago | Logistics & Transportation | 3 | 503,000 | 3/31/2026 | 4.40 | 2,213,260 | 1.5% |
| Royal Canin U.S.A, Inc. | St. Louis | Wholesale/Retail | 1 | 521,171 | 5/31/2025 | 3.95 | 2,058,625 | 1.4% |
| Balta US, Inc. | Jacksonville | Home & Garden | 2 | 629,084 | 12/31/2028 | 3.07 | 1,933,607 | 1.4% |
| Communications Test Design, Inc. | Memphis | Logistics & Transportation | 2 | 566,281 | 12/31/2024 | 3.28 | 1,855,850 | 1.3% |
| Winston Products, LLC | Cleveland | Automotive | 2 | 266,803 | 4/30/2032 | 6.81 | 1,816,650 | 1.3% |
| ASW Supply Chain Services, LLC | Cleveland | Logistics & Transportation | 4 | 532,437 | 11/30/2027 | 3.40 | 1,810,285 | 1.3% |
| Total Largest Tenants by Annualized Rent | | | 18 | 5,698,397 | | $ 3.93 | $ 22,369,887 | 15.7% |
| All Other Tenants | | | 503 | 27,652,788 | | $ 4.36 | $ 120,445,435 | 84.3% |
| Total Company Portfolio | | | 521 | 33,351,185 | | $ 4.28 | $ 142,815,322 | 100.0% |
| 1) | Primary markets means the following two metropolitan areas in the U.S., each generally consisting of more than 300 million square feet of industrial space: Chicago and Atlanta. Secondary markets means non-primary markets, each generally consisting of between 100 million and 300 million square feet of industrial space, including the following metropolitan areas in the U.S.: Boston, Charlotte, Cincinnati, Cleveland, Columbus, Indianapolis, Jacksonville, Kansas City, Memphis, Milwaukee, Philadelphia, South Florida, and St. Louis. Our definitions of primary and secondary markets may vary from the definitions of these terms used by investors, analysts, or other industrial REITs. |
| This glossary contains additional details for sections throughout this Supplemental Information, including explanations and reconciliations of certain non-GAAP financial measures, and the reasons why we use these supplemental measures of performance and believe they provide useful information to investors. Additional detail can be found in our most recent annual report on Form 10-K and subsequent quarterly reports on Form 10-Q, as well as other documents filed with or furnished to the SEC from time to time. | |
| |
| |
| | | | | |
| | | | | |
| Non-GAAP Financial Measures Definitions: | | | |
| | | | | |
| Net Operating Income (NOI): We consider net operating income, or NOI, to be an appropriate supplemental measure to net income in that it helps both investors and management understand the core operations of our properties. We define NOI as total revenue (including rental revenue and tenant reimbursements) less property-level operating expenses. NOI excludes depreciation and amortization, general and administrative expenses, impairments, gain/loss on sale of real estate, interest expense, and other non-operating items. | |
| | | | | |
| Cash Net Operating Income - (Cash NOI): We define Cash NOI as NOI excluding straight-line rent adjustments and amortization of above and below market leases. | |
| | | | | |
| EBITDAre and Adjusted EBITDA: We define earnings before interest, taxes, depreciation and amortization for real estate in accordance with the standards established by the National Association of Real Estate Investment Trusts (“NAREIT”). EBITDAre represents net income (loss), computed in accordance with GAAP, before interest expense, tax, depreciation and amortization, gains or losses on the sale of rental property, unrealized appreciation/(depreciation) of warrants, loss on impairments, and loss on extinguishment of debt. We calculate Adjusted EBITDA by adding or subtracting from EBITDAre the following items: (i) non-cash stock compensation, (ii) gain (loss) on extinguishment of debt, (iii) acquisition expenses (iv) the proforma impacts of acquisition and dispositions and (v) non-cash impairments on real estate lease. We believe that EBITDAre and Adjusted EBITDA are helpful to investors as supplemental measures of our operating performance as a real estate company as they are direct measures of the actual operating results of our industrial properties. EBITDAre and Adjusted EBITDA should not be used as measures of our liquidity and may not be comparable to how other REITs' calculate EBITDAre and Adjusted EBITDA. | |
| | | | | |
Funds From Operations ("FFO"): Funds from operations, or FFO, is a non-GAAP financial measure that is widely recognized as a measure of REIT operating performance. We consider FFO to be an appropriate supplemental measure of our operating performance as it is based on a net income analysis of property portfolio performance that excludes non-cash items such as depreciation. The historical accounting convention used for real estate assets requires straight-line depreciation of buildings and improvements, which implies that the value of real estate assets diminishes predictably over time. Since real estate values rise and fall with market conditions, presentations of operating results for a REIT using historical accounting for depreciation could be less informative. In December 2018, NAREIT issued a white paper restating the definition of FFO. The purpose of the restatement was not to change the fundamental definition of FFO, but to clarify existing NAREIT guidance. The restated definition of FFO is as follows: Net Income (calculated in accordance with GAAP), excluding: (i) Depreciation and amortization related to real estate, (ii) Gains and losses from the sale of certain real estate assets, (iii) Gain and losses from change in control, and (iv) Impairment write-downs of certain real estate assets and investments in entities when the impairment is directly attributable to decreases in the value of depreciable real estate held by the entity.
We define FFO consistent with the NAREIT definition. Adjustments for unconsolidated partnerships and joint ventures will be calculated to reflect FFO on the same basis. Other equity REITs may not calculate FFO as we do, and accordingly, our FFO may not be comparable to such other REITs’ FFO. FFO should not be used as a measure of our liquidity, and is not indicative of funds available for our cash needs, including our ability to pay dividends. | |
| | | | | |
| Core Funds from Operations (“Core FFO”): Core FFO represents FFO reduced by dividends paid (or declared) to holders of our preferred stock, acquisition and transaction related costs for transactions not completed, and excludes certain non-cash operating expenses such as impairment on real estate lease, unrealized appreciation/(depreciation) of warrants and loss on extinguishment of debt. As with FFO, our reported Core FFO may not be comparable to other REITs’ Core FFO, should not be used as a measure of our liquidity, and is not indicative of our funds available for our cash needs, including our ability to pay dividends. | |
| | | | | |
Adjusted Funds from Operations attributable to common stockholders (“AFFO”): Adjusted funds from operations, or AFFO, is presented in addition to Core FFO. AFFO is defined as Core FFO, excluding certain non-cash operating revenues and expenses, capitalized interest, and recurring capitalized expenditures. Recurring capitalized expenditures include expenditures required to maintain and re-tenant our properties, tenant improvements and leasing commissions. AFFO further adjusts Core FFO for certain other non-cash items, including the amortization or accretion of above or below market rents included in revenues, straight line rent adjustments, non-cash equity compensation and non-cash interest expense.
We believe AFFO provides a useful supplemental measure of our operating performance because it provides a consistent comparison of our operating performance across time periods that is comparable for each type of real estate investment and is consistent with management’s analysis of the operating performance of our properties. As a result, we believe that the use of AFFO, together with the required GAAP presentations, provide a more complete understanding of our operating performance. As a result, we believe that the use of AFFO, together with the required GAAP presentations, provide a more complete understanding of our operating performance.
As with Core FFO, our reported AFFO may not be comparable to other REITs’ AFFO, should not be used as a measure of our liquidity, and is not indicative of our funds available for our cash needs, including our ability to pay dividends. | |
| | | | | |
| Net Debt and Preferred stock to Adjusted EBITDA: Net debt and preferred stock to Adjusted EBITDA is a non-GAAP financial measure that we believe is useful to investors as a supplemental measure in evaluating balance sheet leverage. Net debt and preferred stock is equal to the sum of total consolidated and our pro rata share of unconsolidated joint venture debt less cash, cash equivalents, and restricted cash, plus preferred stock calculated at its liquidation preference as of the end of the period. | |
| | | | | |
| | | | | |
| Plymouth Industrial REIT, Inc. |
| Glossary |
| | | | | | | | | | | | | | |
| This glossary contains additional details for sections throughout this Supplemental Information, including explanations and reconciliations of certain non-GAAP financial measures, and the reasons why we use these supplemental measures of performance and believe they provide useful information to investors. Additional detail can be found in our most recent annual report on Form 10-K and subsequent quarterly reports on Form 10-Q, as well as other documents filed with or furnished to the SEC from time to time. |
| |
| |
| | | | | | | | | | | | | | |
| | | | | | | | | | | | | | |
| Other Definitions: | | | | | | | | | |
| | | | | | | | | | | | | | |
| GAAP: U.S. generally accepted accounting principles. | | | | | | | | | |
| | | | | | | | | | | | | | |
| Lease Type: We define our triple net leases in that the tenant is responsible for all aspects of and costs related to the property and its operation during the lease term. We define our modified net leases in that the landlord is responsible for some property related expenses during the lease term, but the cost of most of the expenses is passed through to the tenant. We define our gross leases in that the landlord is responsible for all aspects of and costs related to the property and its operation during the lease term. |
| | | | | | | | | | | | | | |
| Non-Recurring Capital Expenditures: Non-recurring capital expenditures include capital expenditures of long lived improvements required to upgrade/replace existing systems or items that previously did not exist. Non-recurring capital expenditures also include costs associated with repositioning a property, redevelopment/development and capital improvements known at the time of acquisition. |
| | | | | | | | | | | | | | |
| Occupancy: We define occupancy as the percentage of total leasable square footage as the earlier of lease term commencement or revenue recognition in accordance to GAAP as of the close of the reporting period. |
| |
| Recurring Capital Expenditures: Recurring capitalized expenditures includes capital expenditures required to maintain and re-tenant our buildings, tenant improvements and leasing commissions. |
| | | | | | | | | | | | | | |
| Replacement Cost: is based on the Marshall & Swift valuation methodology for the determination of building costs. The Marshall & Swift building cost data and analysis is widely recognized within the U.S. legal system and has been written into in law in over 30 U.S. states and recognized in the U.S. Treasury Department Internal Revenue Service Publication. Replacement cost includes land reflected at the allocated cost in accordance with Financial Accounting Standards Board ("FASB") ASC 805. |
| | | | | | | | | | | | | | |
| Same Store Portfolio: The Same Store Portfolio is a subset of the consolidated portfolio and includes properties that are wholly owned by the Company as of December 31, 2020. The Same Store Portfolio is evaluated and defined on an annual basis based on the growth and size of the consolidated portfolio. The Same Store Portfolio excludes properties that were or will be classified as repositioning or lease-up during 2021 and 2022. For 2022, the Same Store Portfolio consists of 99 properties aggregating 21,962 million rentable square feet. Properties that are being repositioned generally are defined as those properties where a significant amount of space is held vacant in order to implement capital improvements that enhance the functionality, rental cash flows, and value of that property. We define a significant amount of space at a property using both the size of the space and its proportion to the properties total square footage as a determinate. Our computation of same store NOI may not be comparable to other REITs. |
| |
| Weighted Average Lease Term Remaining: The average contractual lease term remaining as of the close of the reporting period (in years) weighted by square footage. |
| | | | | | | | | | | | | | |
| | | | | | | | | | | | | | |