Exhibit 99.3
![]()
FOURTH QUARTER 2024 PREPARED COMMENTARY
FEBRUARY 25, 2025
This prepared commentary should be read in conjunction with the earnings press release, quarterly supplemental financial information and the Form 10-K when filed. All this information can be found on our Investor Relations page at ir.plymouthreit.com.
Before we get into the relevant detail from each area of the company, we’d like to call out some of the important takeaways from the quarter and the year:
| · | The results were in line with our expectations for the quarter and within the full year range for both Core FFO and net income at $0.46 per share and unit and $3.25 per weighted average common share, respectively. Additionally, AFFO was $0.40 per share and unit. |
| · | SS NOI decreased 0.5% on a cash basis excluding early termination income for the quarter, while for the full year 2024, SS NOI increased 4.1% on a cash basis excluding early termination income compared with the same period in 2023. |
| · | As disclosed in our January activity release, we made progress on our 2024 leasing opportunities, finishing with a 17.1% increase in rental rates on a cash basis - slightly below our expected mark-to-market of 18% to 20%. |
| · | Our phase 1 development program consisting of 772,622 square feet across seven buildings was completed in 2024 and is 100% leased. The initial cash NOI yields on development projects completed is 7.5%. |
| · | We completed the previously announced contribution of 34 properties located in and around the Chicago MSA totaling 5.8 million square feet to a joint venture with Sixth Street Partners, LLC for a total purchase price of $356.6 million. |
| · | Our balance sheet improved with the JV proceeds along with a $600 million amended and restated unsecured credit facility that provides expanded borrowing capacity, extended maturities and enhanced our ability to pursue other unsecured debt. |
| · | We acquired a 258,082-square-foot portfolio of industrial properties in Cincinnati, OH for $20.1 million, which equates to an initial NOI yield of 6.8%. The second tranche of this portfolio is under contract for $17.9 million, which equates to an initial NOI yield of 7.3%, and is expected to close in March 2025. In addition, we closed on another 263,000-square-foot industrial building in Cincinnati for $23.3 million on February 20, 2025, which equates to an initial NOI yield of 6.7%. |
| · | Net debt to Adjusted EBITDA decreased sequentially for the eighth quarter in a row. We ended the year at 5.4x, which is half a turn less than we had originally anticipated for 2024. Until we are fully deployed with the JV proceeds this year, we would expect to stay in the 6 times range in 2025. |
Plymouth Market Commentary
According to the latest Cushman & Wakefield, Moody’s Analytics CRE, and CBRE EA data, Plymouth’s markets experienced better trends than the broader national story on the industrial market in Q4 2024 and in what is projected for 2025. Cushman & Wakefield noted the following in their U.S National Industrial Q4 2024 Marketbeat and Midwest Industrial Insiders reports:
| · | Net absorption totaled 36.8 million square feet (msf) in the fourth quarter, up 10.5% quarter-over-quarter (QOQ). For 2024, 135 msf of industrial space was absorbed, on par with Cushman & Wakefield forecasts. |
| · | The national average asking rent for industrial space rose by 0.9% QOQ to $10.13 per square foot (psf). Annual rent growth ticked marginally higher in the fourth quarter to 4.5%. In the Midwest at year-end 2024, the average net asking rental rates increased 8.0% to $6.59 per square foot psf with an additional 2.5% projected increase to $7.01 psf by year-end 2026. |
| · | Driven by vacant, speculative supply, overall vacancy rose by 150 bps in 2024, to 6.7%. The pace of increase slowed significantly in the fourth quarter, suggesting vacancy may approach peak levels in the first half of 2025 amid softer completion totals and a moderation in space dispositions. Overall vacancy remained 30 bps below pre-pandemic levels, with half of the markets tracked by Cushman & Wakefield Research recording rates below 6.0% at year-end. |
| · | Some markets with high speculative development or modest demand totals, such as Austin, Phoenix, Greenville and Las Vegas, posted double-digit vacancy rates. Vacancy rates continued to be nuanced by size segment with smaller industrial product (under 100,000 sf) remaining tight at 3.9%, which is the leasing segment that Plymouth mostly deals in with average tenant size at 58,340 sf. Big-box product (300,000+ sf) recorded a 10.7% vacancy rate, driven by 51% of YTD speculative deliveries in this segment. The rate at which vacant sublease space entered the market slowed in the fourth quarter as availabilities increased by just 5.0 msf. Only a few markets registered notable increases in sublet space in the fourth quarter. |
| · | The Midwest industrial market is poised for an active 2025 and beyond as market fundamentals are forecasted to improve. The overall vacancy rate in the Midwest will reach 5.3% by year-end 2024, which is 210 basis points (bps) less than the average vacancy rate across all other regions. Additionally, the region’s vacancy rate is expected to decrease 50 bps by 2026 to 4.8%, the largest decrease amongst all other regions. |
-2-

The data from CBRE shows in the chart above that the vacancy rate for larger Class A buildings is more than 2.5 times more than smaller Class B properties, which supports the thesis that the increase in vacancy is largely due to big box speculative development coming online. According to Cushman & Wakefield, over 425 million sf was delivered in 2024 with 78% of new deliveries speculative, and only one-fourth of that space ended up being preleased before completion. The completion numbers dropped below 500 million sf mark for the first time since mid-year 2021 and 2025 numbers are projected to continue this trend.
-3-
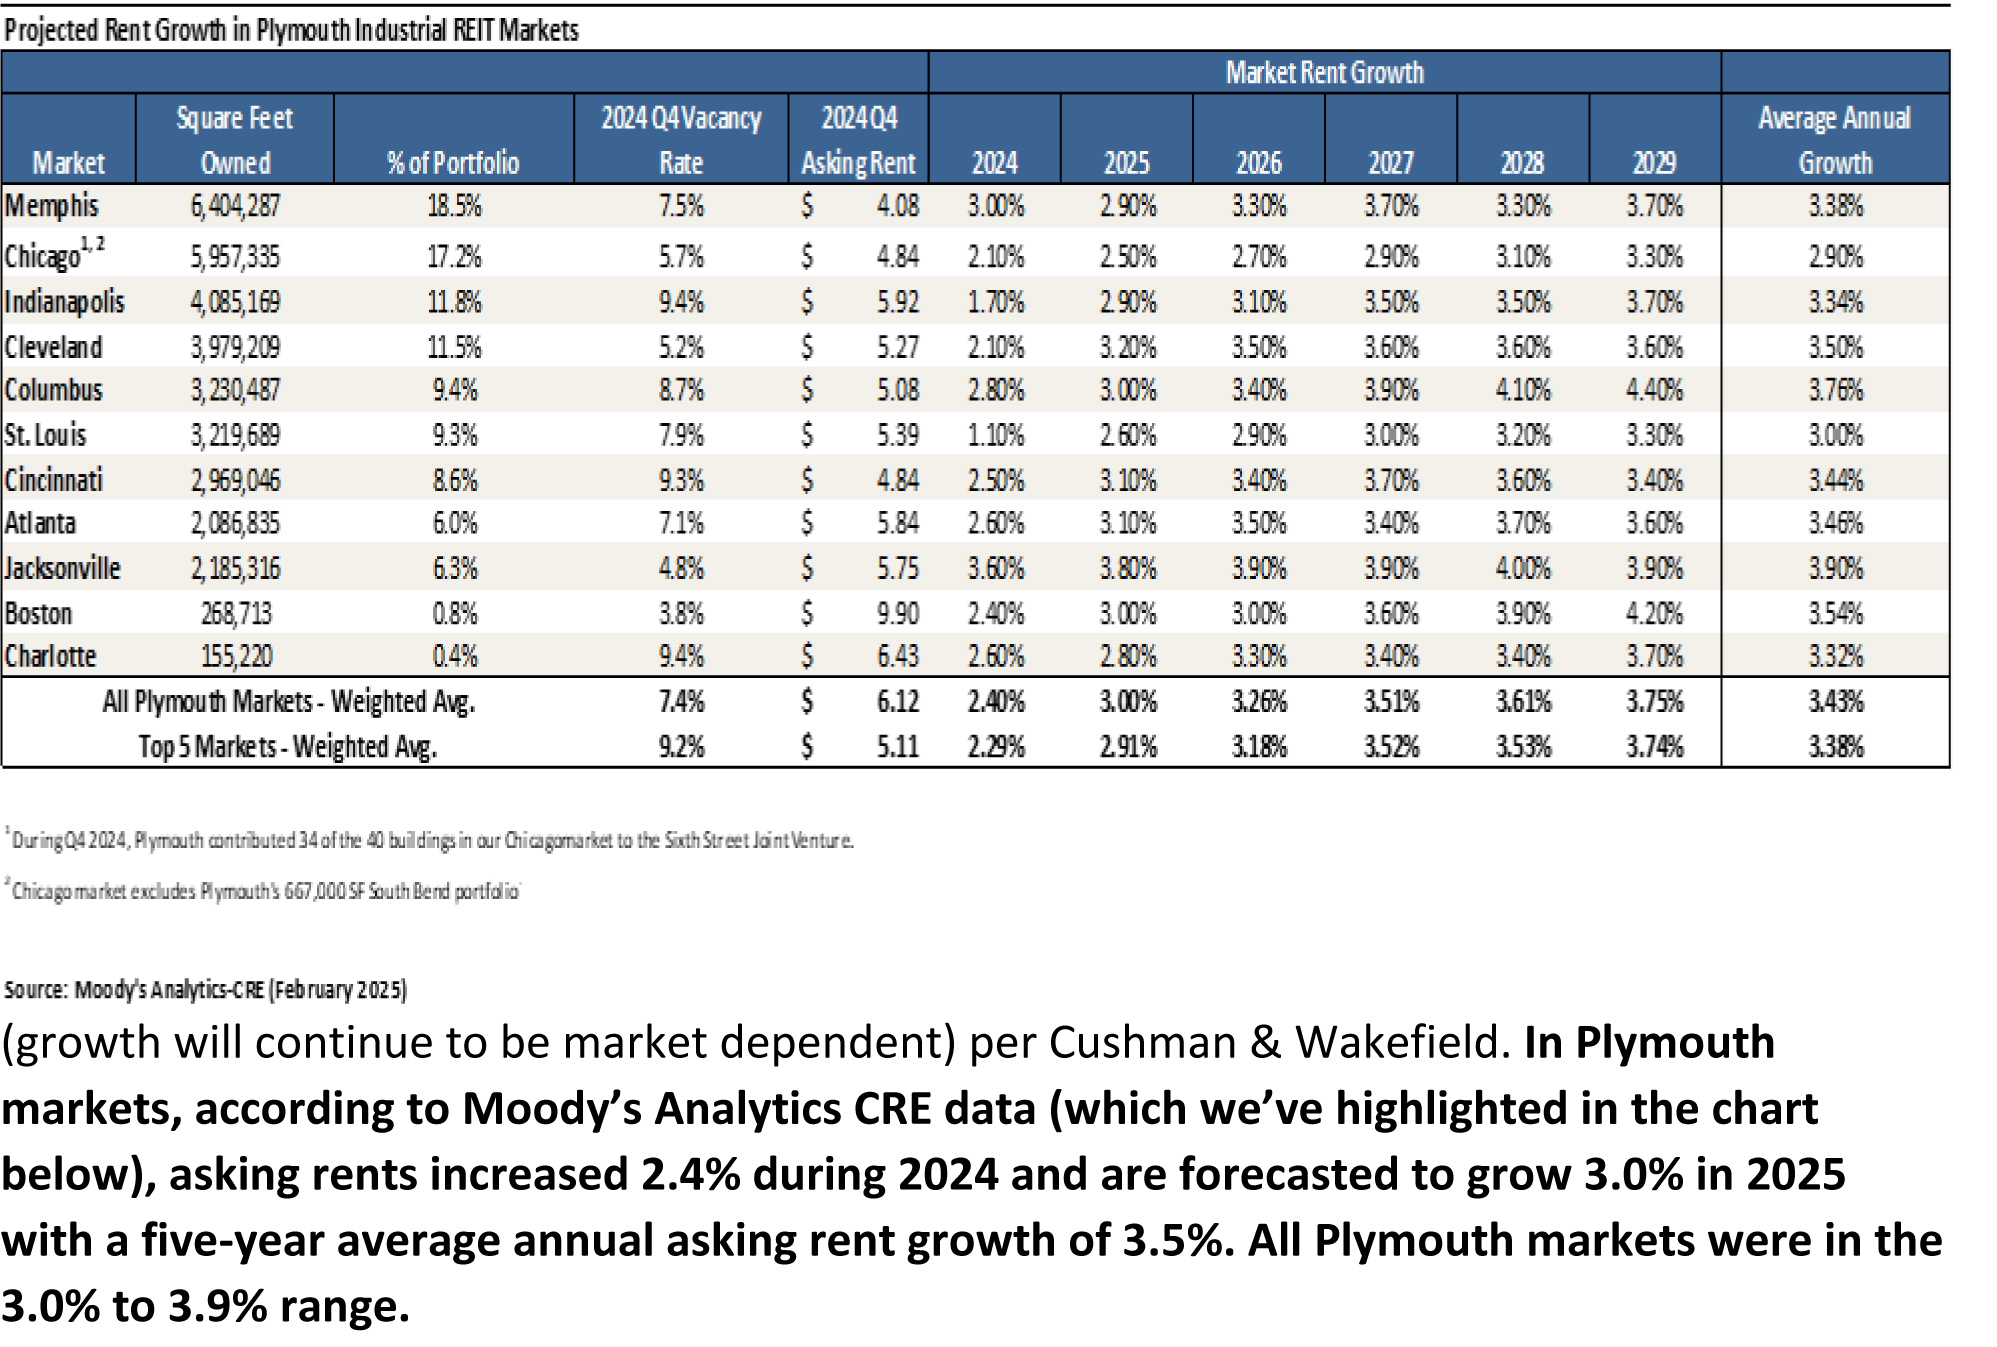
Nationally annual rent growth ticked marginally higher in the fourth quarter to 4.5%, fueled by the South region’s 6.0% YOY increase. Some rent increases were tied to deliveries of vacant, speculative industrial product, priced at a premium over market averages. However, 30% of U.S. markets saw annual declines, with notable drops along the West Coast. Asking rent growth is anticipated to slow to just over 2% in 2025 and 2026 before rising back to the 3% range (growth will continue to be market dependent) per Cushman & Wakefield. In Plymouth markets, according to Moody’s Analytics CRE data (which we’ve highlighted in the chart below), asking rents increased 2.4% during 2024 and are forecasted to grow 3.0% in 2025 with a five-year average annual asking rent growth of 3.5%. All Plymouth markets were in the 3.0% to 3.9% range.
Development Program Update
The total investment in completed developments is approximately $70 million. The initial cash NOI yields on development projects completed is 7.5%.
The last project in the first phase of our 772,622-square-foot development program, the 52,920-square-foot fully leased industrial building in Jacksonville, was delivered on October 31, 2024, with cash rents commencing on December 1, 2024. Having completed a 10-year lease for 53,352 square feet during the fourth quarter for our last remaining space at Fisher Industrial Park in Cincinnati, we are now 100% leased in this phase of our development program.
-4-
Plymouth is in the early stages of constructing a spec-tenant development building on the last remaining site in our Liberty Business Park in Jacksonville, Florida. This new 42,000-square-foot building is projected to yield between 8% to 9% on a $5.7 million investment.
Beyond the Jacksonville project, Plymouth has 1.6 million square feet across six markets (see page 19 of the Supplemental), with approximately 400,000 square feet in Memphis and Cincinnati at various stages of pre-development. These sites could be ready for vertical construction in the short term.
Plymouth is partnering with the Green Building Initiative to align our environmental objectives with the execution of all new development and portfolio enhancement activities. Thus far, Plymouth has achieved a Three Green Globe certification on our Cincinnati development and a Two Green Globe certification on our completed developments in Boston, Jacksonville and Atlanta.
Leasing Update
2024 leasing activity finished with a strong fourth quarter, with our blended rental rates increasing 19.4% on a cash basis, compared to a third quarter blended rental rate of 12.2%. We believe this momentum will continue throughout 2025, where 14.0% of our total ABR is expiring.
The leasing results for Q4 and full year 2024 are broken down as follows for leases commencing during these periods (calculated on a cash basis):
| · | Fourth quarter |
| o | 1,042,732 SF of renewal leases signed at a 12.6% increase |
| o | Renewal rate was 68.1% |
| o | 3.1% of these renewals were contractual |
| o | 489,373 SF of new leases signed at a 30.2% increase |
| o | Blended increase of 19.4% (Q1: 17.1%; Q2: 18.8%; Q3: 12.2%) |
| · | Full year 2024 |
| o | 4,180,593 SF of renewal leases signed at a 12.9% increase |
| o | Renewal rate was 71.7% |
| o | 21.1% of these renewals were contractual |
| o | 1,646,543 SF of new leases signed at a 28.2% increase |
| o | Blended increase of 17.1% (2023: 21.0%; 2022: 18.5%; 2021: 11.1%) |
-5-
Leases commencing during the fourth quarter ended December 31, 2024, all of which have terms of at least six months, totaled an aggregate of 1,532,105 square feet. These leases include 1,042,732 square feet of renewal leases and 489,373 square feet of new leases. Rental rates under these leases reflect a 19.4% increase on a cash basis, with renewal leases reflecting a 12.6% increase on a cash basis and new leases reflecting a 30.2% increase on a cash basis. Same store occupancy at December 31, 2024, was 95.2%. Total portfolio occupancy at December 31, 2024 was 92.5% and reflects a 110-basis-point negative impact from previously disclosed tenancy issues in Cleveland, a 10-basis-point positive impact from the inclusion of the recently acquired Cincinnati portfolio, and a 70-basis-point negative impact from net leasing activity in the fourth quarter of 2024. These figures include the Sixth Street Joint Venture’s Chicago portfolio, which saw a 14.1% cash rental rate increase and had an occupancy of 93.1% at December 31, 2024.
Excluding the Chicago portfolio leasing, the wholly-owned portfolio had 957,076 square feet commence during the quarter with 501,660 square feet renewed and 455,416 square feet leased to new tenants. The renewal rate was 52.4% with a 12.9% rental rate increase on renewals and 29.2% on new leases, resulting in an overall 21.7% cash rental rate increase. The fourth quarter occupancy rate, excluding the Chicago Portfolio, was 92.3%.
Executed leases commencing during 2024, all of which had terms of at least six months, totaled an aggregate of 5,827,136 square feet. These leases, which represent 71.4% of total 2024 expirations, include 4,180,593 square feet of renewal leases (21.1% of these renewal leases were associated with contractual renewals; there are no remaining 2024 contractual renewals) and 1,646,543 square feet of new leases, of which 138,924 square feet was vacant at the start of 2024. The total square footage of new leases commenced excludes 160,292 square feet of development leasing completed in 2024. Rental rates under these leases reflect a 17.1% increase on a cash basis, with renewal leases reflecting a 12.9% increase in rental rates on a cash basis and new leases reflecting a 28.2% increase on a cash basis. These figures include the Chicago joint venture portfolio, which saw a 17.0% cash rental rate increase. Excluding the Chicago portfolio leasing, the wholly-owned portfolio had 5,039,886 square feet commence during the year with 3,482,812 square feet renewed and 1,557,074 square feet leased to new tenants. The renewal rate was 69.1% with a 12.5% rental rate increase on renewals and 27.9% on new leases, resulting in an overall 17.4% cash rental rate increase.
Plymouth executed a two-year lease at its 769,500-square-foot Class A industrial building in the Metro East submarket of St. Louis, Missouri that commenced on January 15, 2025. The lease is for 600,000 square feet during the first year and 450,000 square feet during the second year with a major international logistics service provider. This deal was done on an “as is” basis with no abatements making it very attractive from a net effective rent perspective. While we continue to actively market the balance of the building, we are also working with our new tenant on expansion options.
The remaining 2025 expirations include 624,159 square feet in St. Louis, which we are expecting to renew in July, and 772,450 square feet in Columbus, which is expected to downsize or vacate. A 300,000-square-foot replacement tenant has been identified in Columbus, which we expect to have executed shortly. In total for 2025, we have 3,683,898 square feet of lease expirations.
-6-
Through February 24, 2025, the Company has addressed 52% of its total 2025 expirations. These leases included 3,369,622 square feet of renewal leases and 740,487 square feet of new leases from vacant space at the start of 2025. In total, we have already executed 4,276,832 square feet of leases that will commence during 2025. Plymouth will experience a 12.7% increase in rental rates on a cash basis with renewal leases experiencing a 16.2% increase (7.7% of these renewals were contractual) and new leases experience a 0.9% increase on a cash basis. The new St. Louis lease was lower on a face rent basis than the prior lease but higher on a net lease rate basis. Excluding that lease, overall rental rates would have increased 16.7% and new leases would have increased 20.6%. As a result of this leasing activity, overall occupancy is up to 94.3%.
Disposition Update
We began the year having identified a number of potential dispositions that we could explore in 2024 and 2025. Our biggest deal was our transaction with Sixth Street Partners, where we completed the previously announced contribution of 100% of our equity interests in directly and indirectly wholly-owned subsidiaries owning 34 properties located in and around the Chicago MSA to Isosceles JV, LLC, an affiliate of Sixth Street Partners, for a total purchase price of $356.6 million. The JV portfolio consists of 34 buildings with 5,957,335 square feet and a portfolio occupancy of 93.1% with a blended mix of 59.1% multi-tenant and 40.9% single tenant. Upon the derecognition of the Chicago Properties, the Company recognized a net gain of $136.8 million. This transaction is a good example of our goal for any potential dispositions – to provide accretive sources of capital to fund additional growth opportunities or, at a minimum, to pay down debt.
During 2024, we also completed one disposition with the sale of the 527,127-square-foot industrial property in Columbus, Ohio, to the tenant for approximately $21.1 million in net proceeds and recognized a net gain of $7.8 million. As we have previously stated, our preference is to redeploy to acquisitions where we could earn the spread over and above the exit cap rate on the sale to drive expansion in our key markets where we perform property management services in-house and create incremental value.
Sixth Street Update
With the closing of the joint venture, the Chicago properties have been deconsolidated and our initial investment in the unconsolidated joint venture is recorded on the balance sheet and our share of net income or loss from the joint venture will be included within the statement of operations. We will include our 35% share of the results of the unconsolidated joint venture for the purpose of calculating the non-GAAP measures of EBITDAre, FFO, AFFO, Adjusted EBITDA, and Net Debt metrics.
-7-
As of December 31, 2024, the Company has drawn approximately $60.9 million of the $140.0 million Preferred. The remaining draw on the Preferred is represented on the balance sheets as a forward contract asset. This asset represents the fair market value (FMV) of the Company’s contractual obligation to draw the remaining approximately $79.1 million of the Preferred. The warrants are reflected at FMV in liabilities on the balance sheets and will be marked to market each reporting period. The warrants, upon exercise, can be net settled in cash or shares of the Company’s common stock at the Company’s sole election.
Acquisitions
With the turning of the calendar into 2025, we have been pleased with the uptick in new acquisition opportunities. During the first two months of the year, 28 deals totaling 16.8 million square feet and $1.8 billion of target value (5.8% seller target cap rate) have been reviewed/underwritten across our key markets.
Our active pipeline is currently comprised of 15 opportunities, containing an aggregate of 8.5 million square feet and a target value of over $1 billion. The average seller asking price across the active pipeline would equate to a going-in yield in the low 6 range.
We continue to see pockets of very aggressive capital across our markets, particularly for larger deals, which are commanding capitalization rates in the low- to mid-5% range. However, pricing in certain Midwest and Southeast markets has been more attractive recently, as demonstrated by our success with our latest acquisitions in Cincinnati, totaling $61.3 million at a blended going-in capitalization rate of 6.88%.
Earlier in the year, we acquired a 1,621,241-square-foot portfolio of industrial properties located across the Southeast and Northeast submarkets of Memphis, Tennessee. The purchase price of $100.5 million equates to an initial NOI yield of 8.0%. The portfolio consists of 14 buildings that are currently 94.0% leased to 46 tenants with a weighted average remaining lease term of approximately 3.4 years. Existing contract rents are below market consistent with the Company’s targeted mark-to-market range of 18% to 20%. This most recent acquisition in Memphis reinforces our confidence in the market’s strong fundamentals and strategic importance. The city's world-class transportation infrastructure and central location continue to make it a key hub for industrial growth and long-term value creation.
-8-
Balance Sheet Update
We believe an already strong balance sheet was made stronger when we entered into a $600 million amended and restated unsecured credit facility that provided expanded borrowing capacity, extended maturities and enhanced ability to pursue other unsecured debt.
The new unsecured credit facility is comprised of:
- A revolving credit facility that expanded from $350 million to $500 million, matures in November 2028 (compared with August 2025 previously) and has one, one-year extension option, subject to certain conditions; and
- A $100 million term loan that that now matures in November 2028 (compared with August 2026 previously) and has one, one-year extension option, subject to certain conditions.
The facility complements the Company’s existing $200 million term loan that matures in February 2027 and has a fixed rate swap of SOFR at 1.527% and an existing $150 million term loan that matures in May 2027 and has a fixed rate swap of SOFR at 2.904%.
Some of the balance sheet highlights as of December 31, 2024, are as follows (see page 17 and 18 of the supplemental):
| · | Net debt to Adjusted EBITDA of 5.4x |
| · | 72.7% of our total debt is unsecured |
| · | 84.5% of our debt is fixed, including with the use of interest rate swaps with a total weighted average cost of 3.58% |
| · | $480.0 million of availability on our unsecured credit facility |
Discussion of Fourth Quarter of 2024
The fourth quarter saw Core FFO at $0.46 per share driven primarily by sequential improvement in leasing spreads, a full quarter contribution from the 1,621,241-square foot Memphis portfolio acquired in the third quarter, along with lower interest expense, partially offset by contribution and derecognition of the 34 property Chicago portfolio (the “Chicago Portfolio”) that seeded the joint venture with Sixth Street.
Same store NOI, including full quarter results of the Chicago Portfolio, and excluding early termination fees, experienced a 0.5% decrease on a cash basis during the quarter. While for the year, Same Store NOI saw an increase of 4.1%. Same store performance reflects the persistent transitory vacancy in Cleveland as disclosed in the prior quarter, along with planned lease-up of approximately 190,000 square feet in Cincinnati that has pushed to the first half of 2025.
-9-
G&A for both the quarter and full year was lower, compared to last year’s period, respectively, bringing total G&A in at 10.9% of cash NOI for FY 2024, a 30-basis-point improvement compared with FY 2023.
Interest expense during the fourth quarter was down, compared to the same period in 2023 primarily due to two factors: 1) the payoff of the line of credit ($202.4 million) and the Midland National Life Insurance Mortgage ($10.5 million); and 2) the assignment of the Transamerica Loan to the Sixth Street Joint Venture ($56.7 million). Secured debt outstanding declined by approximately $68.2 million sequentially.
During the quarter, we entered into a $600 million amended and restated unsecured credit facility that provides expanded borrowing capacity, extended maturities and enhanced ability to pursue other unsecured debt.
Discussion of 2025 Guidance and Assumptions
Our FY 2025 outlook (see page 9 of the supplemental) reflects the benefit of the lease up of the vacancies in Cleveland and St. Louis, incremental NOI from 2024 and 2025 acquisitions, partially offset by higher preferred dividends. At the midpoint of guidance of $1.87 per share, we assume the following roll forward from FY 2024 Core FFO of $1.83 per share:
| · | Proportionate share of FFO from the Chicago Portfolio - $0.09 |
| · | Lease up of the two Cleveland buildings and the 769,500-square-foot Class A industrial building in St. Louis - $0.07 |
| · | Decreased interest expense resulting from the payoff of the line of credit and Midland National Life Insurance Mortgage and the assignment of the Transamerica Loan during Q4 2024, partially offset by interest expense associated with utilizing the line of credit for 2025 acquisitions - $0.07 |
| · | Increase in Series C Preferred Unit dividends (cash + PIK) - ($0.15) |
| · | Increase in G&A in-line with quarterly run rate as experienced during Q4 2024 - ($0.03) |
| · | Net impact from the loss of consolidated NOI from the Chicago Portfolio ($0.42), offset by the full realization of NOI contribution of 2024 acquisitions and incremental NOI contribution from forecasted 2025 acquisitions of $0.41, resulting in a net impact of ($0.01). |
-10-
Our FY 2025 guidance ranges for net loss and Core FFO per weighted average common share and units are noted below:

| 1 | Our 2025 guidance refers to the Company's in-place portfolio as of February 26, 2025, and includes prospective acquisition volumes as outlined above. Our 2025 guidance does not include the impact of any prospective dispositions or capitalization activities. |
| 2 | The Same Store Portfolio consists of 168 buildings aggregating 26,107,300 rentable square feet, representing approximately 89.3% of the total in-place portfolio square footage as of February 26, 2025. The Same Store projected performance reflects an annual NOI on a cash basis, excluding termination income. The Same Store Portfolio is a subset of the consolidated portfolio and includes properties that are wholly-owned by the Company as of December 31, 2023. |
| 3 | Includes non-cash stock compensation of $5.1 million for 2025. |
| 4 | As of February 26, 2025, the Company has 46,041,197 common shares and units outstanding. |
| 5 | Series C Preferred dividend includes cash and accrued (PIK) dividends at an annualized rate of 7.0%. |
| 6 | Proportionate share of Core FFO from unconsolidated joint ventures adjusts for the Hypothetical Liquidation of Book Value (“HLBV”) calculation and resulting net loss on investment of unconsolidated joint ventures recognized within the Statements of Operations and adds back the Company's proportionate share of Core FFO from the unconsolidated joint venture. |
Conclusion
2024 brought both challenges and opportunities. Historically low vacancy and record-high leasing activity have moderated to what we see as a more "normal" market. In Cleveland, a couple of tenants faced issues that led to forced bankruptcies. Despite this, Cleveland remains one of our tightest industrial markets, and our experienced Ohio team is actively working to backfill the space.
-11-
Across our portfolio, supply and demand fundamentals remain strong, reinforcing the resilience of our markets. The strategic Sixth Street transaction has positioned us to be net acquirers in 2025—an opportunity that the public equity markets did not provide for most of 2023 and 2024. Our current trading price remains at a significant discount to a conservative NAV, but our focus for 2025 remains unchanged: to work closely with our tenants, providing cost-effective industrial space that is functional, flexible, and safe, while continuing to drive long-term shareholder value.
Thank you for your continued interest and investment in Plymouth.
Jeff Witherell, Chairman and CEO
Forward-Looking Statements
This commentary includes “forward-looking statements” that are made pursuant to the safe harbor provisions of Section 27A of the Securities Act of 1933 and of Section 21E of the Securities Exchange Act of 1934. The forward-looking statements in this release do not constitute guarantees of future performance. Investors are cautioned that statements in this commentary, which are not strictly historical statements, including, without limitation, statements regarding management's plans, objectives and strategies, constitute forward-looking statements. Such forward-looking statements are subject to a number of known and unknown risks and uncertainties that could cause actual results to differ materially from those anticipated by the forward-looking statement, many of which may be beyond our control, including, without limitation, those factors described under the captions “Cautionary Note Regarding Forward-Looking Statements” and “Risk Factors” in the Company’s Annual Report on Form 10-K and Quarterly Reports on Form 10-Q filed with the Securities and Exchange Commission. Forward-looking statements generally can be identified by the use of forward-looking terminology such as “may,” “plan,” “seek,” “will,” “expect,” “intend,” “estimate,” “anticipate,” “believe” or “continue” or the negative thereof or variations thereon or similar terminology. Any forward-looking information presented herein is made only as of the date of this commentary, and we do not undertake any obligation to update or revise any forward-looking information to reflect changes in assumptions, the occurrence of unanticipated events, or otherwise.