| O L S H A N | PARK AVENUE TOWER ● 65 EAST 55TH STREET ● NEW YORK, NEW YORK 10022 TELEPHONE: 212.451.2300 ● FACSIMILE: 212.451.2222 |
EMAIL: AFREEDMAN@OLSHANLAW.COM
DIRECT DIAL: 212.451.2250
April 15, 2014
VIA EDGAR, FACSIMILE AND ELECTRONIC MAIL
Mellissa Campbell Duru
Special Counsel
United States Securities and Exchange Commission
Office of Mergers and Acquisitions
100 F Street, N.E.
Washington, D.C. 20549
| Re: | Darden Restaurants, Inc. |
| Definitive Additional Soliciting Materials |
| Filed on Schedule 14A by Starboard Value LP, Starboard Value and Opportunity Master Fund Ltd., Starboard Value and Opportunity S LLC, Starboard Value and Opportunity C LP, Starboard Leaders Delta LLC, Starboard Leaders Fund LP, Starboard Value GP LLC, Starboard Principal Co LP, Starboard Principal Co GP LLC, Starboard Value A LP, Starboard Value A GP LLC, Starboard Value R LP , Starboard Value R GP LLC, Jeffrey C. Smith, Mark R. Mitchell, Peter A. Feld, Bradley D. Blum, Charles M. Stonsteby, Robert Mock and Craig S. Miller (collectively, “Starboard”) |
| Filed April 1, 2014 |
| File No. 1-13666 |
Dear Ms. Duru:
We acknowledge receipt of the comment letter of the Staff (the “Staff”) of the U.S. Securities and Exchange Commission (the “Commission”) dated April 4, 2014 (the “Staff Letter”) with regard to the above-referenced matter. We have reviewed the Staff Letter with Starboard and provide the following responses on its behalf. For ease of reference, the comments in the Staff Letter are reproduced in italicized form below. Terms that are not otherwise defined have the meanings ascribed to them in the Primer on Darden’s Real Estate (the “Real Estate Primer”) and Investor Presentation (collectively, the “Presentations”).
General
| 1. | Refer generally to conclusory statements that are made on the slides included in “A Primer on Darden’s Real Estate” and the investor presentation. We remind you of prior comment 14 of our initial letter dated March 5, 2014. If expressing a reasonably supported opinion, then please clearly distinguish your opinion from assertions of fact. For example, the following non-exclusive list of assertions should be recharacterized in future filings as your opinion: |
| O L S H A N F R O M E W O L O S K Y L L P | WWW.OLSHANLAW.COM |
April 15, 2014
Page 2
| · | “even at a significant discount...a real estate separation still creates meaningful value...”; |
| · | “[m]anagement has misled shareholders regarding potential debt breakage costs...”; • “[s]ubstantial value could be created by spinning off Darden’s properties into a new REIT...” |
| · | “...we see no reason why the OpCo could not retain its investment grade rating...”; and, |
| · | “...both the OpCo and the REIT could maintain investment grade ratings...” |
We acknowledge the Staff’s comment and hereby confirm that in future filings, if expressing reasonably supported opinions, we will clearly distinguish such opinions from assertions of fact. In addition, we hereby confirm that in any future filings that reference and/or include information from the Presentations, if expressing reasonably supported opinions, we will clearly distinguish opinions from assertions of fact.
| 2. | Please refer to Part III of the Primer presentation. The inclusion of asset valuations in proxy materials is only appropriate and consonant with Rule 14a-9 when made in good faith and on a reasonable basis. Discussion of asset valuations should therefore be accompanied by disclosure which facilitates security holders’ understanding of the basis for and limitations on the projected realizable values. Although you have set forth what you believe to be the appropriate basis for the valuations, there is a lack of disclosure highlighting the limitations inherent in projected and implied values. Further, given that each slide and projected valuation builds upon or is related to the next, the limitations of each data set should be consistently highlighted. Please file materials that clarify the limitations of all the valuations referenced in your presentations. Refer generally to Rule 14a-9. |
We acknowledge the Staff’s comment and hereby confirm that in future filings we will clarify the limitations of the valuations referenced in Starboard’s presentations. In addition, we hereby confirm that in any future filings that reference the Real Estate Primer and/or information referenced therein, we will include a disclaimer and/or footnote addressing such inherent limitations.
| 3. | Further, to our comment above, each time approximate valuations are disclosed, please prominently highlight that there can be no assurance that the estimates are reflective of actual realizable value. Disclosure throughout Part III should be accompanied with such qualifications. Refer generally to Rule 14a-9. |
We acknowledge the Staff’s comment and hereby confirm that in future filings, including those that reference and/or include information from the Real Estate Primer, we will prominently highlight that there can be no assurance that the estimates are reflective of actual realizable value.
April 15, 2014
Page 3
| 4. | Please refer to our prior comment and disclosure in Section VI, page 62 where the participants state that a Darden REIT “would still likely trade at a substantial premium to where Darden currently trades...” Please qualify this statement as your opinion and include disclosure that there can be no assurance of any future projected trading value for a Darden REIT. Please also be mindful of the prohibition in Rule 14a-9, note A. |
We acknowledge the Staff’s comment and hereby confirm that in future filings if we reference the statement in Section VI, page 62 of the Real Estate Primer that a Darden REIT “would still likely trade at a substantial premium to where Darden currently trades...”, we will qualify such statement as Starboard’s opinion and include disclosure that there can be no assurance of any future projected trading value for a Darden REIT.
| 5. | Please disclose that the analysis provided by Green Street may not be consistent with the analysis of other financial advisors and accordingly, shareholders should understand that different analysis may yield different results. |
We acknowledge the Staff’s comment and hereby confirm that in any future filings that reference the Green Street analysis, we will provide disclosure that such analysis may not be consistent with the analysis of other financial advisors and accordingly, that different analyses may yield different results.
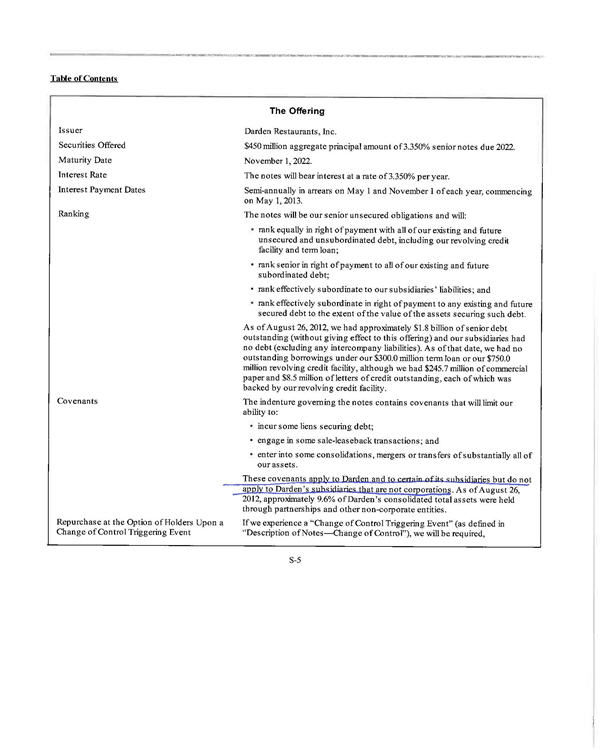
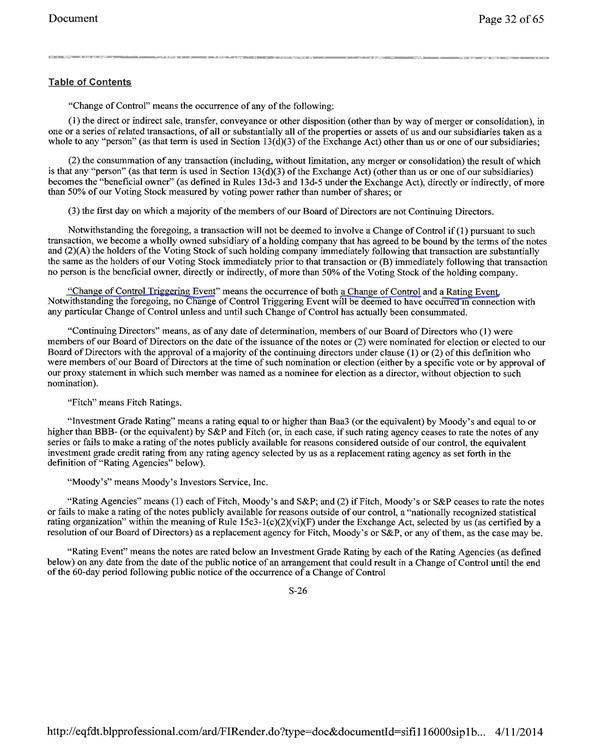
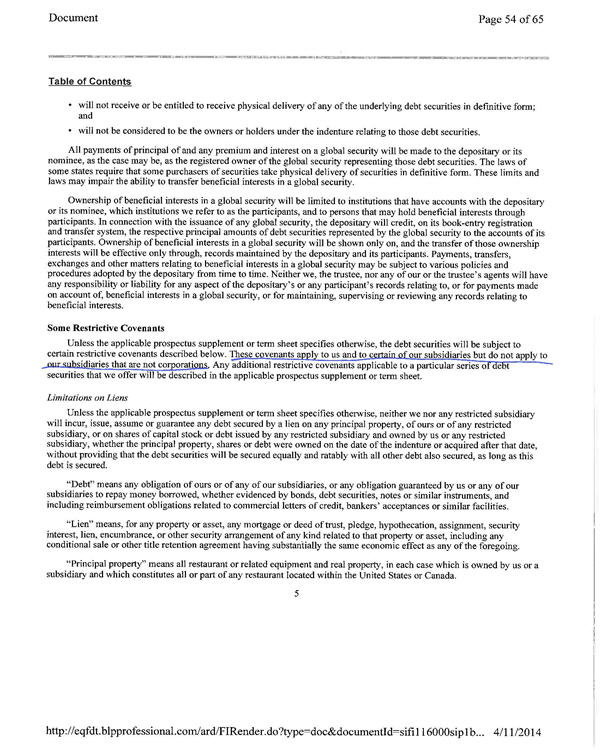
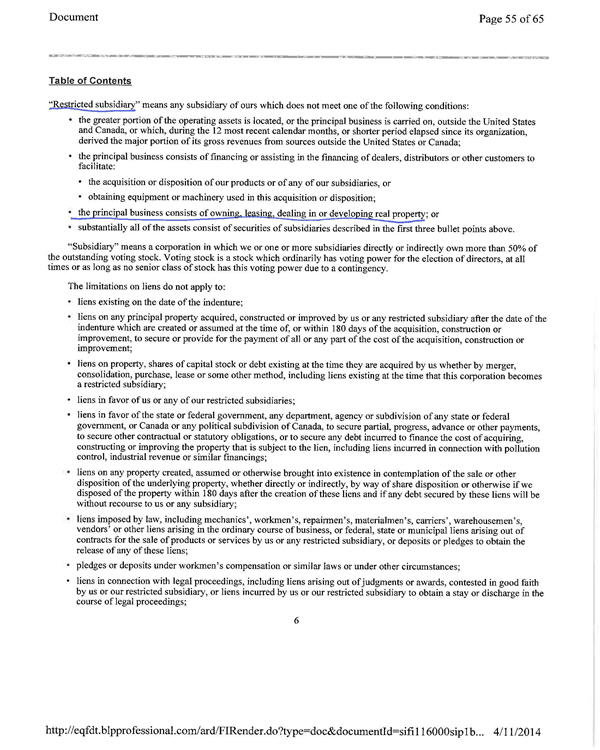
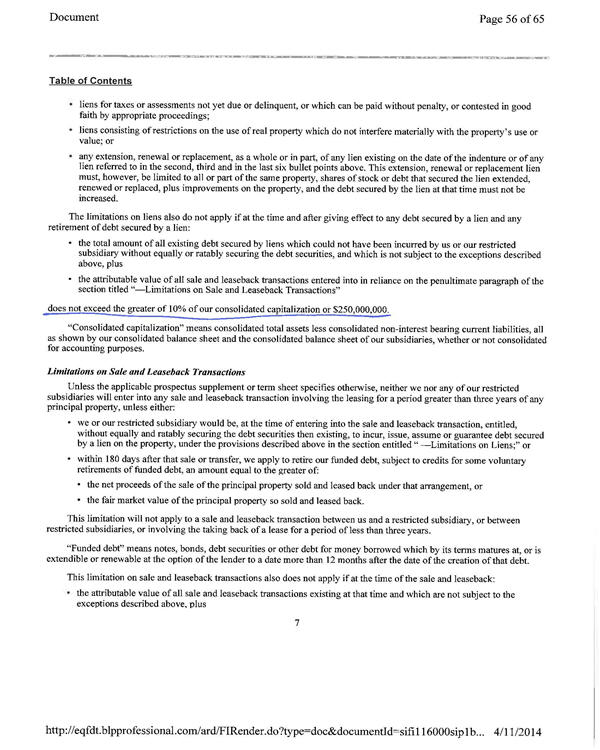
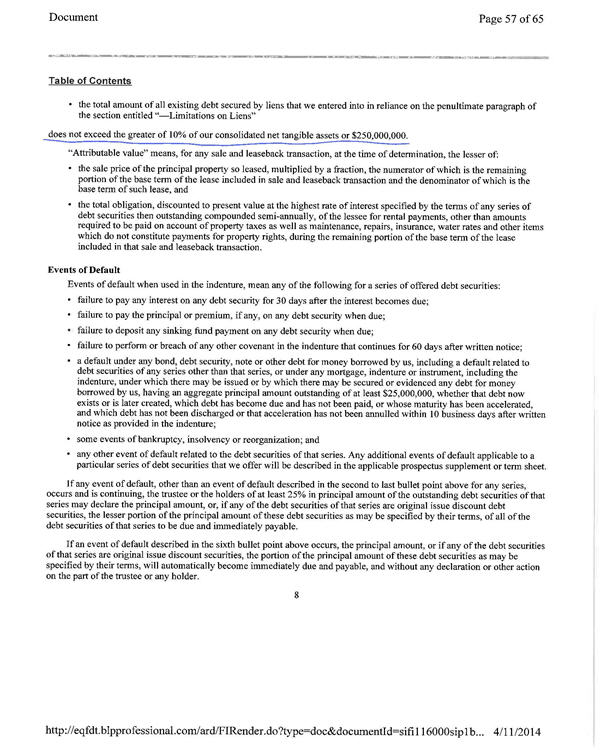
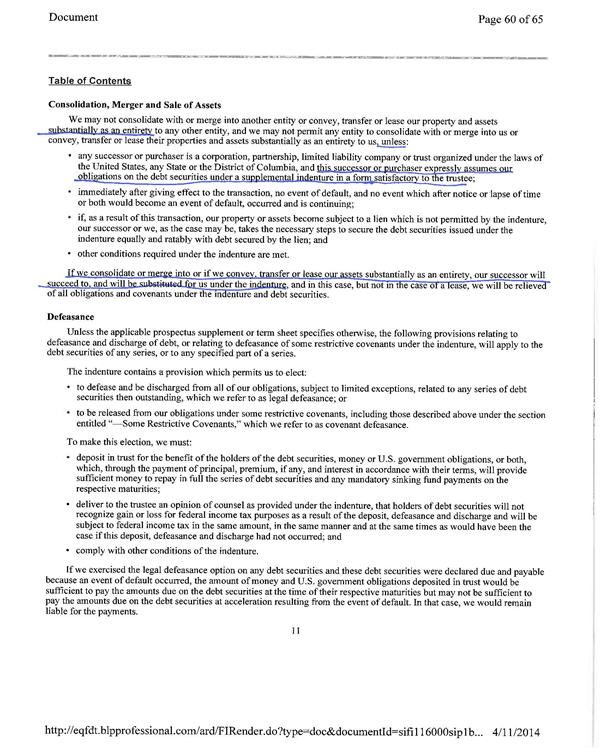
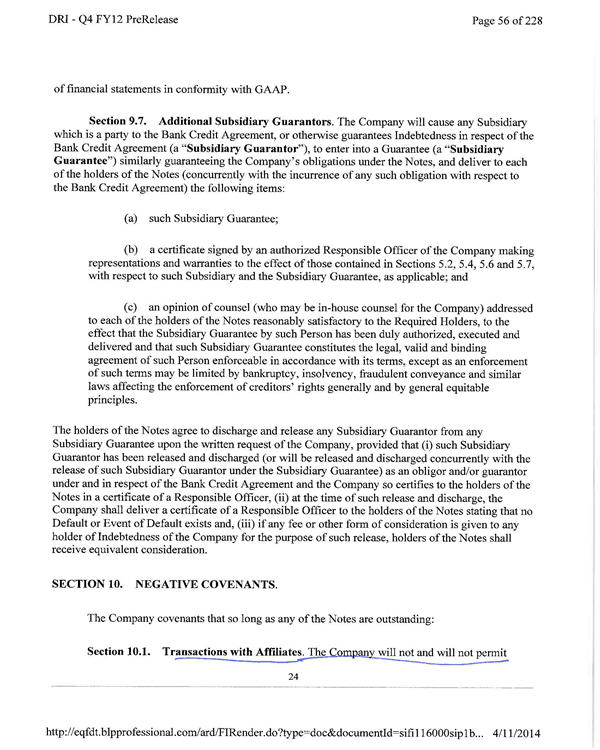
| 6. | Please supplementally provide us with the materials used by the financial advisor and Starboard, marked to show the relevant data that has been extrapolated to produce the information on page 30 of the Primer. Similarly, please also provide appropriately marked pages of the relevant debt instruments you have reviewed in support of the assertions you make in Section V. |
We acknowledge the Staff’s comment and have supplementally provided the requested materials regarding page 30 and section V of the Real Estate Primer, which are attached hereto as Annex A.
* * * * *
The Staff is invited to contact the undersigned with any comments or questions it may have. We would appreciate your prompt advice as to whether the Staff has any further comments. Thank you for your assistance.
| Sincerely, |
| /s/ Andrew Freedman |
| Andrew Freedman |
Enclosure
cc: Jeffrey C. Smith
ANNEX A
Real Estate Primer Supplemental Materials
| 1. | Slide 17: The Cap Rate and Rent per Square Foot values for each of the regions is an average that was calculated by Green Street based on store-by-store assumptions for each of Darden’s stores. The store-by-store figures used by Green Street are based on its proprietary models regarding rental rates and cap rates in each specific market area, as well as their examination of precedent transactions and discussions with market participants. |
It is important to note that the figures presented on this slide are averages, and are not necessarily reflective of the Rent per Square Foot or Cap Rate that any individual store would obtain in any particular transaction.
| 2. | Slides 19 & 21: For the Fee Simple properties, the $27.10 Rent per Square Foot and 7.1% cap rate are the average values obtained via the store-by-store analysis discussed above. For the Ground Leased properties, the $10.65 Rent per Square Foot and 8.8% cap rate are the average values for a Second Lease position obtained by Green Street through a store-by-store analysis. The analysis, as further discussed on Slide 21, first looked at the average Rent per Square Foot on a Fee Simple property, then subtracted the Rent per Square Foot for a Ground Lease (a lease of only the land by a company that already owns the building) – the difference between these two figures being the Rent that Darden could collect on a “Second Lease” of the building only. The analysis then incorporated the fact that a Ground Lease would generally sell for a lower Cap Rate than a Fee Simple property in order to determine the implied Cap Rate on a Second Lease (since the weighted-average of the Ground Lease Cap Rate and the Second Lease Cap Rate should equal the Fee Simple Cap Rate). Green Street then assumed that the Ground Leases have an average remaining term of 27 years, including all renewal options, 1.9% annual rent increases, and 0.8% annual maintenance capital expenditure requirements, which are all consistent with its proprietary data for casual dining restaurants generally, and factored those assumptions into a discounted cash flow model to derive a Ground Lease discount rate of 10.3% |
It is important to note that the figures presented on this slide are averages, and are not necessarily reflective of the Rent per Square Foot or Cap Rate that any individual store would obtain in any particular transaction.
| 3. | Slides 20, 22, and 23 summarize the results of the valuation based on the assumptions discussed above. |
| 4. | Slides 24 & 25: The Supportable Rent analysis is based on the Rent, Square Footage and Cap Rate assumptions discussed on the prior slides, which we also explain above. |
As we note on this slide, it is important to note that although we believe that with cost reductions Darden could support rent substantially in excess of even the highest end of the rents that we have assumed in any of our valuations, the maximum supportable rent may be higher than market rent in some instances. Further, the Rent per Square Foot and Cap Rate used are averages, and are not necessarily reflective of the Rent per Square Foot or Cap Rate that any individual store would obtain in any particular transaction.
| 5. | Slides 26 & 27: The Precedent Transactions used here were identified by Green Street as those being most comparable to Darden’s properties. We believe that they are comparable because the restaurants featured here are in similar markets to Darden’s properties and have, on average, similar customer demographics, store sizes, price points, and menu focuses to Darden’s restaurants. |
It is important to note that this analysis is based on a sample of recent transactions, and that a different sample of transactions could yield different results.
| 6. | Slides 28 & 29: The comparable publicly traded REITs used are those identified by Green Street as being most comparable to a potential Darden REIT. We believe they are most comparable because of their focus on triple-net-leases (a Darden REIT would be structured with triple-net-leases), and because of their focus on retail properties similar to Darden’s restaurants in size and credit quality. |
It is important to note that this analysis is based on a sample of comparable companies, and that a different sample of companies could yield different results. Further, there is no guarantee that a Darden REIT would trade in the multiple range used herein.
| 7. | Slide 30: This slide summarizes the 4 valuations discussed above. All of the figures here are derived in more detail on slides 17-29. |
It is important to note that these valuations are based on estimates, and that there is no guarantee that any specific transaction would be completed at the valuations shown.
| 8. | Slide 31: This slide shows how the results of our valuation would change if alternate assumptions are used. |
| 9. | Slide 32: This slide shows what the potential value creation would be in a real estate separation. It is based on the real estate valuations discussed above, less the value that we believe Darden currently receives in its stock price from the “rent subsidy” that it currently enjoys. The value of the “rent subsidy” was calculated based on of the total rent assumptions discussed in the prior pages and the multiple at which Darden currently trades. |
| 10. | Slide 32: This slide shows how the potential value creation would change if alternate assumptions are used. |
Debt Document Supplemental Materials
(See attached)