UNITED STATES
SECURITIES AND EXCHANGE COMMISSION
Washington, D.C. 20549
FORM N-CSR
CERTIFIED SHAREHOLDER REPORT OF REGISTERED
MANAGEMENT INVESTMENT COMPANIES
Investment Company Act file number: 811-22545
CENTRE FUNDS
(Exact name of registrant as specified in charter)
48 Wall Street, Suite 1100, New York, New York 10005
(Address of principal executive offices) (Zip code)
James A. Abate
48 Wall Street, Suite 1100
New York, New York 10005
(Name and address of agent for service)
Registrant’s telephone number, including area code: (212) 918-4705
Date of fiscal year end: September 30
Date of reporting period: October 1, 2019 – September 30, 2020
Item 1. Reports to Stockholders.
TABLE OF CONTENTS
| | PAGE |
| SHAREHOLDER LETTER | 1 |
| MANAGER COMMENTARY | 2 |
| Centre American Select Equity Fund | 2 |
| Centre Global Infrastructure Fund | 8 |
| DISCLOSURE OF FUND EXPENSES | 12 |
| SCHEDULE OF INVESTMENTS | 13 |
| Centre American Select Equity Fund | 13 |
| Centre Global Infrastructure Fund | 15 |
| STATEMENTS OF ASSETS AND LIABILITIES | 18 |
| STATEMENTS OF OPERATIONS | 19 |
| STATEMENTS OF CHANGES IN NET ASSETS | 20 |
| Centre American Select Equity Fund | 20 |
| Centre Global Infrastructure Fund | 21 |
| FINANCIAL HIGHLIGHTS | 22 |
| Centre American Select Equity Fund | 22 |
| Centre Global Infrastructure Fund | 24 |
| NOTES TO FINANCIAL STATEMENTS | 26 |
| REPORT OF INDEPENDENT REGISTERED PUBLIC ACCOUNTING FIRM | 36 |
| ADDITIONAL INFORMATION | 37 |
| TRUSTEES AND OFFICERS | 40 |
Beginning on January 1, 2021, as permitted by regulations adopted by the SEC, paper copies of annual and semi-annual shareholder reports will no longer be sent by mail, unless you specifically request paper copies of the reports. Instead, the reports will be made available on the Trust’s website at www.centrefunds.com, and you will be notified by mail each time a report is posted and provided with a website link to access the report.
You may, notwithstanding the availability of shareholder reports online, elect to receive all future shareholder reports in paper free of charge. If you invest through a financial intermediary, you can contact your financial intermediary to request that you continue to receive paper copies of your shareholder reports. If you invest directly with a Fund, you can call (855) 298-4236 to let the Fund know you wish to continue receiving paper copies of your shareholder reports.
If you already elected to receive shareholder reports electronically, you will not be affected by this change and you need not take any action. You may elect to receive shareholder reports and other communications from a Fund electronically anytime by contacting your financial intermediary or, if you are a direct investor, by enrolling at www.centrefunds.com.
| Centre Funds | Shareholder Letter |
September 30, 2020 (Unaudited)
Dear Shareholders,
It is with my pleasure that we publish the Centre Funds Annual Report covering the one-year period ended September 30, 2020. I want to thank my fellow shareholders for their continued support and confidence in Centre Funds. The Centre Funds offer a select series of fundamentally-driven, actively managed funds to choose from, each available in investor and institutional share classes. We are passionate about active management.
Centre American Select Equity Fund
The Fund is a U.S. large capitalization valuation sensitive core growth stock fund that seeks long-term growth of capital and is focused on risk adjusted returns through active and pragmatic management; the Fund may complement its equity securities with hedges and other capital preservation strategies when deemed appropriate. The Fund is intended to be a risk managed core growth fund.
Centre Global Infrastructure Fund
The Fund is for investors seeking to potentially benefit from a renewed focus on infrastructure spending but wish to have liquidity in publicly traded investments in developed global markets rather than illiquid private investments. The Fund pursues a bottom-up, active management approach and invests in what we deem the most attractive infrastructure-related companies from the United States and developed international economies. Also, the Fund seeks to balance its exposures to where the weights of the Telecommunication, Utilities, Energy, Transportation, and Social Infrastructure industries are broadly represented. The Fund focuses on higher dividend yielding assets and distributes dividend and interest income monthly.
Our aim at Centre Funds is to deliver strong, long-term performance results for investors through an exceptional focus on producing returns and managing risk and downside volatility in select investment strategies. We want investors to associate Centre Funds with high-conviction, differentiated fund strategies that may not be available elsewhere and are tactical, pragmatic, and opportunistic. Each investment strategy aims to capitalize on defined market opportunities with consistent and repeatable investment processes to achieve differentiated returns and risk profiles. We remain focused on fundamentally-driven investment approaches within truly active, high conviction, disciplined and research intensive processes. At Centre Funds, we place service excellence at the core of everything that we do and are committed to providing useful information on all of the Funds. Again, I want to thank my fellow shareholders for their continued support and confidence in the Centre Funds.
Sincerely,
James Abate
President, Centre Funds
| Annual Report | September 30, 2020 | 1 |
| Centre American Select Equity Fund | Manager Commentary |
September 30, 2020 (Unaudited)
Performance & Strategy Summary
For the one-year period ended September 30, 2020, the Centre American Select Equity Fund (the “Fund”), Investor Share Class, delivered a total return of 23.82 percent; the Institutional Share Class delivered a total return of 24.42 percent.
During the same one-year period, the key barometer of the U.S. stock market as a whole, as measured by the S&P 500 Index1, delivered a total return of 15.15 percent. Companies that were deemed able to maintain sales growth and profit margin stability during the onset of recession in the early part of 2020 as COVID-192 pandemic lockdowns were put in place globally, mainly in the traditional high and stable growth sectors such as Information Technology, Consumer, Health Care, and Communication Services, performed relatively better than the more economically sensitive sectors such as Energy, Financials, and Real Estate.
The strongest contributors to performance within the Fund over the one-year period ended September 30, 2020 included the Fund’s investments within the Technology sector, Apple, Microsoft, Maxim, and NVidia; within the Consumer sectors, Amazon, Home Depot, and Hain Celestial; within the Health Care sector, Eli Lilly and Abbott; and within the Materials sector, Barrick Gold, LyondellBasell, and Eastman Chemical. In general, both stock selection and sectoral biases, particularly our underweight postures in the Financials, Real Estate, Industrials, and certain industries within the Consumer Discretionary sector, contributed to the relative outperformance over the period. Stock investments that contributed negatively to relative underperformance over the period included AT&T, Medtronic, Molson Coors, Discovery, Treehouse Foods, Schlumberger, Twitter, and SS&C Technologies. Fund performance was impacted positively from a total return and risk perspective by the net realized gains from certain hedges and other investments that Centre Asset Management, LLC, the investment adviser to the Fund (“Centre,” the “Adviser”, “we”, or “the Fund’s portfolio manager”), viewed, as capital protective in nature. These hedges, namely put options3 on the S&P 500 Index, performed as expected during the stock market’s sharp correction beginning in February 2020 and, over the longer-term, have insulated the Fund from the same magnitude of maximum drawdown4 experienced by the overall stock market over prior volatile5 episodes, namely in August 2015, January 2016, February 2018, and December 2018. Given the continued presence of certain potentially de-stabilizing factors that we believe could negatively impact the value of underlying equity securities held in the Fund’s portfolio, the Fund will continue the strategy of tactically and opportunistically purchasing put options on the S&P 500 Index as a potential hedge against its underlying stock holdings in the event of a material stock market correction.
The process used by Centre to manage the Fund focuses on each individual portfolio company's growth outlook and capacity to create shareholder value, utilizing our bottom-up fundamental stock selection process. We utilize a disciplined, Economic Value Added (EVA)6 framework to select investments. The framework focuses on the fundamentals of wealth creation or wealth destruction similar to the way a traditional, long-term focused corporate investor looking at all aspects of the business would assess a company's value. Our experience is, in the shorter-term, markets may often undervalue or overvalue a company's ability to create or destroy wealth. The framework seeks to identify and capture these investment opportunities. The approach is designed to capture excess returns when a business is creating shareholder wealth and the market price of the stock converges toward our fundamentally-derived target price. Centre not only analyzes earnings but also strives to understand and link the capital allocation decisions being made today by each portfolio company and how they may lead to future earnings growth. In other words, we expect that the companies in which the Fund invests in will themselves invest in productive assets of the business, organically and through opportunistic purchases which, in turn, should provide the foundation for future revenue and profits growth that create shareholder value. Alternatively, if companies cannot invest in productive assets due to a cyclical downturn or existing excess capacity, we expect these companies to “wisely contract” through the restructuring of their assets and other resources to regain their footing for future shareholder value creation. The key is that we look at the company drivers that create true shareholder wealth: capital spending or alternative capital allocations such as acquisitions, stock buybacks, or dividends; company-specific risk levels of a business to determine appropriate hurdle rates7; and whether the company is generating positive or excess returns on its underlying assets vis-à-vis the cost of capital. Wealth creation from growth or from wise contraction – that’s how we believe companies create shareholder value.
| 1 | S&P 500 is an index of 500 stocks seen as a leading indicator of U.S. equities and a reflection of the performance of the large cap universe, made up of companies selected by economists. |
| 2 | In COVID-19, 'CO' stands for 'corona,' 'VI' for 'virus,' and 'D' for disease. Formerly, this disease was referred to as “2019 novel coronavirus” or “2019-nCoV”. There are many types of human coronaviruses including some that commonly cause mild upper-respiratory tract illnesses. |
| 3 | A put option is a contract giving the owner the right, but not the obligation, to sell a specified amount of an underlying security at a specified price within a specified time. |
| 4 | Maximum drawdown is the maximum loss from a peak to a trough of a portfolio, before a new peak is attained. |
| 5 | Volatility is a measure of systematic risk of a security or a portfolio in comparison to the market as a whole. |
| 6 | Economic Value Added (EVA) is an estimate of a company’s economic profit. Economic profit, which refers to the profit earned by a company, minus the cost of financing the company’s capital, is an amount that may be considered in the assessment of a company’s overall value. |
| 7 | A hurdle rate is the minimum rate of return on a project or investment required by a manager or investor. The hurdle rate denotes appropriate compensation for the level of risk present; riskier projects generally have higher hurdle rate than those that are deemed to be less risky. |
| Centre American Select Equity Fund | Manager Commentary |
September 30, 2020 (Unaudited)
To meet its objective as a risk-managed growth fund, the Fund may complement its equity securities with hedges and other capital preservation strategies when deemed tactically appropriate by Centre. While the use of hedging and certain investment techniques involve risk the Adviser may tactically employ hedges and other capital preservation strategies on up to 100 percent of the value of the Fund’s underlying securities positions when the Adviser’s assessment of market valuation indicates forward returns for the stock market, as a whole, are low relative to downside risk and the cost to upside potential from portfolio preservation tools is deemed reasonable in order to respond to adverse market, economic, political, or other conditions. The Adviser may also tactically employ hedges to reduce volatility. For example, through the tactical use of purchased put options, the Fund may have enhanced performance and more limited risk. Index put options are designed to hedge the Fund from significant market declines that may occur over short periods of time. The value of an index put option generally increases as the underlying securities in the Fund decrease in price and decreases as those securities increase in price. The Adviser may also seek to enhance returns by writing (selling) out of the money call options tailored with exercise prices generally above the current market prices of stocks held in the Fund. As the seller of the call option8, the Fund receives cash (the premium) from the purchaser. The Adviser varies its hedging strategy and defensive positions across changing market cycles but has generally employed such strategies within the Fund since late 2014.
Market Review & Outlook
At the time of writing, the Presidential election was still a couple of weeks away and the acrimony between the Trump and Biden camps was reaching a feverish pitch. To us, the outcome of the election is less important than the business cycle trajectory that the global economy is moving forward on and we don’t foresee the major policy initiatives that the respective political parties have put forward being enacted in such a way to change or take place quick enough to change the direction, nor perhaps more importantly, implement the major reforms to overcome the longer-lasting structural problems. There’s no doubt that the near and long-term challenges to the incoming President are monumental, which is why we secretly wished that the actor Morgan Freeman was nominated on one of the third party ballots as he’s in our mind the go to person to serve as President (or the Almighty) whenever there’s a major environmental, terrorist, or economic calamity, and get us through (in the movies at least) safely and unified in purpose as Americans. Unfortunately, we’re not in a movie with a happy ending, the current reality is more like a story with some coming relative pleasantness after the calamities of early 2020 but simply hasn’t ended yet, and unfortunately is likely to be very disruptive to investors.
The year 2020 was one where actively managed funds had the opportunity to truly distinguish themselves as stock markets tumbled at the fastest pace ever in February and March, followed then by one of the sharpest rallies in history. A key contributing dynamic was the exceptionally strong relative price performance of large-cap technology companies (FAANGs)9. As we articulated at the outset of the market’s correction, if the FAANGs could truly demonstrate earnings resilience during the recession, we believed that these leadership stocks would get re-rated even higher and to unprecedented valuation levels given record low interest rates and lack of growth elsewhere. Frankly, not having adequate ownership of the FAANGs within a portfolio would all but guarantee underperformance against broad market indexes; fortunately, the Fund featured such companies prominently. Furthermore, unlike nearly all previous historical periods, the stock market gains since the market trough have not been led by lower-quality, cyclical, value-oriented names as a whole but by those higher-quality, growth-oriented companies that have exhibited superior profitability, growth, and leverage characteristics such as the FAANGs and the Health Care sector. Aside from the deteriorating fundamental performance, the relative valuation of so-called more cyclical value stocks never reached the trough levels seen at other past episodes of recession. We pointed out then, rightly in hindsight, that the economy historically needs to be in recession for cyclical stocks to assume leadership away from defensives and, more importantly, only when cyclicals have suffered the double hit of an earnings collapse as well as a significant de-rating reflecting deep pessimism on any type of imminent recovery is when their relative attractiveness becomes overwhelmingly compelling. This never happened, except in very select industries such as Chemicals and Mining. Again, being highly selective and staying patient to enter these cyclical companies served the Fund well.
The backdrop moving forward is that the market’s current leadership stocks, in general, are extremely expensive when looking at traditional valuation metrics such as price to sales or price to cash flow, with implied growth rates of future earnings well in excess of even the halcyon period of the double digit growth experienced over the past five years. On the other hand, across most cyclical industries, we’ve seen stock prices of such companies move ahead sharply in anticipation of sales growth and profit margin recoveries to levels that make their upside, i.e., what’s not priced into the stocks, leaving little to no room for delay or underachievement. Furthermore, many cyclical companies, particularly those with consumer focus, have emerged from the recession weakened and left with structurally higher debt loads. The uncertainties of a COVID-19 vaccine and more individual stimulus from the government further strains business confidence. Our task is particularly challenging at this juncture as we need to be pragmatic in trimming or outright selling those leadership stocks that reach valuation levels that we can no longer fundamentally justify and, at the same time, remain very selective and patient in initiating positions in those cyclical companies that truly represent contrarian opportunities with positive inflections in fundamental performance with commensurate future return opportunities, given the cyclical risks, not yet reflected into their stock prices.
| 8 | A covered call is an options strategy whereby an investor holds a long position in an asset and writes (sells) call options on that same asset in an attempt to generate increased income from the asset. This is often employed when an investor has a short-term neutral view on the asset and for this reason holds the asset long and simultaneously has a short position via the option to generate income from the option premium. |
| 9 | “FAANG” is an acronym that refers to the stocks of five prominent American technology companies: Facebook, Amazon, Apple, Netflix, and Alphabet (formerly known as Google). |
| Annual Report | September 30, 2020 | 3 |
| Centre American Select Equity Fund | Manager Commentary |
September 30, 2020 (Unaudited)
In managing the Fund in a market-oriented and pragmatic fashion, I frequently use the story of Dave Wottle, an American middle-distance track athlete who was the gold medalist in the 800 meter run at the 1972 Summer Olympics in Munich, to explain our integration of stock selection and portfolio construction. Wottle was firstly known for wearing a golf cap while running and forgetting to remove it during the playing of the national anthem on the medals podium. More important than his headgear was his strategy. In the 800 meter final at the Olympics as well as his other events, Wottle dropped to the middle or rear of the field, and stayed there for the first 500 meters, at which point he started to pass runner after runner up in the final turn and, finally seizing the lead in the final straightaway stretch to win. The distinguishing skill to me (more appreciative now as an adult than as a kid watching the Olympics) was not so much Wottle’s relative acceleration ability in the final moments of the race but his recognition that he could only fall so far back out of the lead and needed to stay in the field for most of the race, before he could execute his unique speed advantage in the final turn; otherwise his comeback would come up short and be for naught. Our skills as a portfolio manager have historically allowed us to be disciplined in applying an analytical focus on each individual portfolio company's growth outlook and capacity to create shareholder value, utilizing our Economic Value Added (EVA) bottom-up fundamental stock selection process, across the entire large-capitalization investment universe to find companies that create true shareholder wealth, regardless of whatever accounting-driven metric style box the stock populates. We then manage the sizing of each individual securities position by merging our differentiated fundamental stock selection with structured portfolio construction in an attempt to add the most appreciation potential per unit of risk. The reason why we highlight our pragmatism within our Review & Outlook is that we believe that we may be entering a period, due to extreme implied expectations in the largest index components, and an already priced in earnings recovery for most cyclical companies, where overall stock market returns are asymmetric, meaning low index or passive upside with significant downside risks but increasing opportunity for unprecedented heterogeneity in markets that will give the best opportunity for active stock selection in quite some time after a period when being benchmark and market-oriented aware for a dedicated portion of the Fund was not only wise but essential for staying with the running field. In essence, the period to use our unique analytical advantage to be pragmatic, know when to sell on valuation grounds as well as an identified change in cyclical fundamentals, and become more rotational with an even higher active share in the final stretch to win is right now and compound on a successful past one year.
There are a number of insights and expectations that we envision gaining prominence over the next couple of years that give us a high degree of optimism despite what we feel may be a poor investment climate for passive, non-alpha seeking, strategies. The first is that the global disruption to production and consumption related to COVID-19 may take years to unfold and it’s only being appreciated in hindsight that the industrial economy was already facing declining fundamentals prior to COVID-19 and the reliance on services for growth in the U.S. left things unbalanced. Secondly, the debt multiplier10 is becoming weaker, meaning that borrowed money, at the governmental and company level, is producing less real growth per dollar so already record setting debt levels will move exponentially higher to produce diminishing levels of real growth. Thirdly, the adoption of modern monetary theory (MMT)11 or debt monetization by the Federal Reserve, up until recently only espoused by the likes of socialists Jeremy Corbyn in the U.K. and Bernie Sanders in the U.S., has become the official policy of nearly every developed country. Fourth, it is beyond ironic that the progenitor of the COID-19 virus, China, has emerged from the deepest part of the global recession in better shape than any other developed country and the risks to it from re-shoring of manufacturing and supply chains from China and its mercantilist approach to export have receded during the economic disruption, as well as giving China the window to amplify its efforts to increase domestic consumption, and changing its former wariness to now not backing down in political and strategic provocations from the West. Fifth, the same centerpieces of the 1930’s New Deal programs that were in an effort to purposely maintain high prices and wages and which prolonged the Great Depression are exactly the same drivers in the most recent fiscal stimulus packages (and the many more that we expect to follow) to offset the lockdown put in place to stem the spread of COVID-19; handouts, subsidized loans, and adverse federal actions towards businesses that disrupt the normal supply and demand equilibrium. Rather than war however, we believe the path of escape and attempt to remain solvent will be more policies geared toward stoking and being tolerant of higher inflation, a marked departure from the investment landscape since the early 1990’s. Following the deflationary demand shock from the COVID-19 lockdowns, we foresee higher inflation gaining increased traction and creating an upside down environment of winners and losers relative to the past thirty years and, frankly, one not experienced by the current generation of investors and expect a historically-aware approach such as ours to be relatively successful in appreciating the potential inflection.
The potential shift within a structural disinflationary12 environment to one where short to intermediate-term cyclical inflation is encouraged is one that we ourselves were highly skeptical about gaining traction until this year. We remain believers in our long-held thesis that demography is destiny; this holds that population trends determine the future growth rates of a country, region or even the entire world. For example, if working age populations increase too fast or too slowly, or if there are too many young or old people, then certain outcomes are likely to follow, such as economic boom or bust, inflation, or even political unrest. Low fertility and an aging population are two of our greatest concerns, and nearly all developed countries now have to depend on immigrants to make up for the decline in native populations, for without them, the U.S. and nearly every country in Europe face the prospect of a shrinking workforce and a stagnant economy akin to the Japanese experience over the recent decades. Thus, the debt crises witnessed in Greece, Puerto Rico, Italy, Spain, etc., where population declines have been most pronounced and leading but on a smaller scale, are the literal canaries in the coal mine for future experiences and are likely to occur across larger countries or even regions. Nearly all developed countries have reached the point where productivity must compensate for the decline in populations (sorry but the invention and widespread adoption of TikTok and Zoom are not going to solve the decline in productivity) or allow mass migration, which in Europe and the U.S. is one of the most argumentative and politically volatile topics and will only intensify with time. From an economic perspective, we remain convinced that lower real economic growth will be consistent with continued low or negative real interest rates and demography, more than globalization, automation, or even de-unionization. All of this said, in the absence of real growth and the unprecedented increase in debt, particularly since 2009, we see continued monetary expansion and new policies geared towards increasing monetary velocity, i.e., inflation, as the only remedying alleviate to jumpstart nominal growth that can potentially forestall another bank credit crisis and a long depression-like downturn. The amount of debt at the governmental and company level is simply too high to allow a deflationary reset of rents, wages, commodity prices, and nominal profits despite the Federal Reserve’s policies of essentially capping interest rates across the yield curve at unprecedented low levels. In other words, we expect a period of negative real interest rates to persist indefinitely and the Keynesian policies being put in place today and the next few years, regardless of who wins the Presidency, having similar unexpected inflationary results as those unforeseen by the hubristic policy makers of the early 1960’s. Simply put, structural reforms are kicked down the road, and nominal economic growth and inflation may replace real growth and productivity as the objectives of policymakers.
| 10 | The debt multiplier includes the effects of a temporary and pure change in government debt on economic activity, and depends on the level of debt-to-GDP ratio. When nominal interest rates are positive, the debt multiplier is generally small. However, the debt multiplier is much larger when the nominal interest rate is at the zero lower bound. |
| 11 | Modern monetary theory or modern money theory (MMT) is a heterodox macroeconomic theory that describes currency as a public monopoly and unemployment as evidence that a currency monopolist is overly restricting the supply of the financial assets needed to pay taxes and satisfy savings desire. MMT argues that governments create new money by using fiscal policy. According to advocates, the primary risk once the economy reaches full employment is inflation, which can be addressed by gathering taxes to reduce the spending capacity of the private sector. |
| 12 | Disinflation is a temporary slowing of the pace of price inflation. It is used to describe instances when the inflation rate has reduced marginally over the short term. It should not be confused with deflation, which can be harmful to the economy. |
| Centre American Select Equity Fund | Manager Commentary |
September 30, 2020 (Unaudited)
The shift from disinflation to inflation could be epochal given the false realization of inflation following the first implementation of quantitative easing (QE)13 after the 2008 financial crisis14, making this time wholly unexpected and catching most investors off guard. While the monetary base spiked back then, the velocity of money, the number of times one dollar is spent to buy goods and services, fell after that initial episode of QE and has now collapsed further to historically unprecedented low levels. The most recent earnings reports from the major money center banks confirm the acuteness of the problem in that deposits are significantly greater than loans outstanding with the unprecedented divergence between deposits and loans growing in proportion to the Federal Reserve’s QE programs since 2008. This partly explains the inability to reconcile the economy to the stock market as most of these excess deposits have had an impact on inflating asset prices, mainly in the capital markets. Ironically, the strength on Wall Street is now driven by weakness in the broader economy. The divergent fortunes of larger companies versus smaller enterprises during the COVID-19 lockdowns has created such an imbalance that it stimulated a change in policies. Even the slightest increase of velocity from increased loan demand, given the massive increase in excess reserves injected by the Federal Reserve, will finally result in the meaningful increase in inflation, which for the first time in generations will be tolerated as there is no other solution to the broad indebtedness and the alternative of outright deflation and prolonged depression. It may sound as the worst prescription for an already over-indebted public and private sector but the short-term focus of politicians of both major parties, most corporate CEOs, and overleveraged consumers, will be to borrow even more in an effort to service existing debt and attempt to grow or, in many cases, just remain solvent. Banks will be encouraged to relax credit standards or, as we’ve seen with the Paycheck Protection Program (PPP), the government will assume the credit risks and use banks as conduits for direct payments. Once banks increase their lending efforts, it is then that the true inflation from what the Federal Reserve’s QE programs has desired all along will finally rear its consequences. Furthermore, the ascendancy of the Chinese renminbi as a genuine alternative to the dollar is finally becoming a reality for global trade and transactions given China’s newfound assertiveness and increased economic clout aided by its impressive COVID-19 recovery and targeted aid to those countries suffering during the ordeal, and the end of the aura of American exceptionalism leading to the broad dollar index to fall and perhaps materially so; the only point at which we believe the Federal Reserve will recognize (too late though) that it has unleashed an inflation and currency debasement genie that will not easily go back into a bottle and temper its QE and debt monetization policies.
As always, it’s critical to reconcile the top-down15 viewpoints we express with the bottom-up16 financial analysis we’re undertaking. In fact, it’s usually the bottom-up informational mosaic as we call it that helps us articulate our bigger picture views. From a bottom-up perspective, the aggregate valuation levels of the market and for the average company are elevated with certain industries extremely expensive. Most companies continue to see top line sales pressure, profit margins continuing to contract (in place well before COVID-19), and high levels of capital intensity leading to negative EVA momentum as a whole. With those companies who’ve been able to remain resilient and maintain positive EVA momentum during the recession now being valued at levels that have or are becoming in some cases absurd, and the fact that we consider valuation or the price one pays at purchase as the most critical element of successful investment, we’ve concentrated new purchases since the spring on those companies who have taken the steps to reduce their capital intensity, or as we say, wisely contract through the restructuring of their assets and other resources to regain their footing for future shareholder value creation through asset efficiency gains and increased pricing. Examples of recent purchases or additions to the Fund meeting our criteria of wise contraction include food product producers such as Bunge and Archer Daniels Midland; oil & gas producers and transporters such as Exxon Mobil, Williams, Chevron, and Cimarex; power generating utilities such as AES, PPL, and Sempra Energy; chemical producers such as Olin, LyondellBasell, and Eastman Chemical; and metals and mining company Barrick Gold. Not only do each of these companies currently demonstrate positive fundamental performance inflections from their recent capital allocation decisions but they demonstrate a very low future growth reliance or implied growth well below historical levels at their current stock prices. Furthermore, most have dividend paying yields well in excess of the overall market, high relative to their unique histories, and are deemed sustainable. Lastly, the linkage back to the top-down concerns over increasing inflation and potential fall in the U.S. dollar would be a tremendous catalyst to sales, nominally, for each of these companies as they are direct beneficiaries to a reflating economy.
| 13 | Quantitative easing (QE) is a form of unconventional monetary policy in which a central bank purchases longer-term securities from the open market in order to increase the money supply and encourage lending and investment. Buying these securities adds new money to the economy, and also serves to lower interest rates by bidding up fixed-income securities. It also expands the central bank’s balance sheet. |
| 14 | The financial crisis of 2007-2008, also known as the global financial crisis, was a severe worldwide financial crisis. Excessive risk-taking by banks combined with the bursting of the United States housing bubble caused the values of securities tied to U.S. real estate to plummet, damaging financial institutions globally, culminating with the bankruptcy of Lehman Brothers on September 15, 2008, and an international banking crisis. |
| 15 | Top-down investing is an investment analysis approach that involves looking first at the macro picture of the economy and then looking sequentially at smaller factors in finer detail. These approaches prioritize macroeconomic, national, or market-level factors most. |
| 16 | Bottom-up investing is an investment approach that focuses on the analysis of individual stocks and de-emphasizes the significance of macroeconomic cycles and market cycles. In bottom-up investing, the investor focuses his attention on a specific company and its fundamentals, rather than on the industry in which that company operates or on the greater economy as a whole. |
| Annual Report | September 30, 2020 | 5 |
| Centre American Select Equity Fund | Manager Commentary |
September 30, 2020 (Unaudited)
Currently, the consensus driver to enable the stock market in aggregate to move higher is continued accommodative Federal Reserve policy whereby liquidity is being injected into the banking sector and capital markets rather than the “real” economy. Furthermore, there is unprecedented concentration and reliance upon already stratospheric valuation multiples re-rating higher still for the largest technology stocks that can somehow maintain resilience to the pressures impacting most other companies. We, however, see fragility and major stock market indexes are vulnerable to either standing still as fundamentals catch up to implied expectations or further significant dislocations. From a macro perspective, we believe that the onset of a stagflationary environment is the new emerging potential danger to the markets but currently this is a very small minority view by professional investors which makes its potential impact much more profound. The Fund currently continues to concentrate the number of positions in its portfolio in an attempt to maximize individual stock risk rather than market risk and use derivative instruments intended to hedge the risks its underlying stock holdings, namely put options on the S&P 500 Index, as a potential hedge against in the event of a material market-wide correction. We continue to emphasize a barbell of secular growth stocks, cognizant of valuation risk, with contrarian, opportunistic cyclical, and mostly commodity-related producing companies in the midst of business restructurings who should benefit tremendously from their company specific actions to reduce supply and committed capital investment, as well as what we feel will be a reflationary-driven recovery in economies. In addition, dividend yield is now the highest positive relative active risk exposure in the Fund further highlighting the focus on return opportunities and risk in the current environment. We believe that our pragmatic, large-capitalization, valuation-sensitive growth and concentrated, high-conviction approach to stock selection, with a cognizance of risk management that includes tactically implementing capital protective investments, seems positioned to perform well relative to less risk aware and less historically appreciative strategies.
The market outlook is the opinion of the author and can change at any time.
| Centre American Select Equity Fund | Manager Commentary |
September 30, 2020 (Unaudited)
SECTOR WEIGHTINGS
As a percentage of Net Assets
| Information Technology | 27.46% |
| Consumer Staples | 18.20% |
| Energy | 11.34% |
| Materials | 10.89% |
| Communication Services | 10.64% |
| Utilities | 10.49% |
| Consumer Discretionary | 8.49% |
| Health Care | 2.03% |
| Purchased Options | 0.47% |
| Cash and Cash Equivalents | -0.01% |
| Totals | 100.00% |
These allocations may not reflect the current or future positions of the portfolio.
GROWTH OF HYPOTHETICAL $10,000 INVESTMENT THROUGH SEPTEMBER 30, 2020
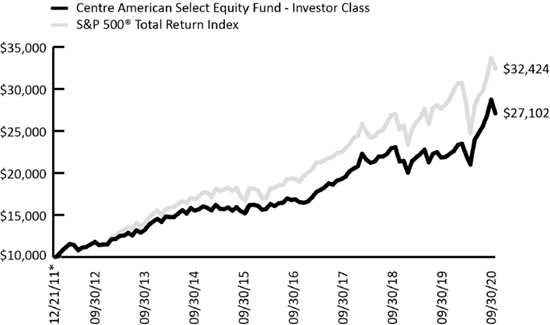
This graph assumes an initial investment of $10,000 at December 21, 2011, the inception date for Investor Class shares, which have the longest period of annual returns, and that any dividends and distributions are reinvested. This graph depicts the performance of the Fund's Investor Class versus the S&P 500® Total Return Index. Taxes on Fund distributions or when shares are redeemed, if any, are not reflected. Unlike the Fund, an index is not available for investment, is unmanaged and does not have expenses that affect the results. The comparison is shown for illustrative purposes only.
The line graph above shows the performance of Investor Class shares only, since the Investor Class has the longest period of annual returns. The performance of the Institutional Class shares will differ from the performance shown because the Institutional Class shares have different expenses than the Investor Class shares.
TOTAL RETURNS – FOR THE PERIOD ENDED SEPTEMBER 30, 2020
| | 1
Month | 3
Month | YTD | 1
Year | 3 Year
Average
Annualized | 5 Year
Average
Annualized | Since
Inception*
Average
Annualized |
| Centre American Select Equity Fund – Investor Class | -5.64% | 5.98% | 16.13% | 23.82% | 11.53% | 12.25% | 12.03% |
| S&P 500® Total Return Index | -3.80% | 8.93% | 5.57% | 15.15% | 12.28% | 14.15% | 14.34% |
| Centre American Select Equity Fund – Institutional Class | -5.56% | 6.07% | 16.52% | 24.42% | 12.05% | 12.61% | 9.93% |
| S&P 500® Total Return Index | -3.80% | 8.93% | 5.57% | 15.15% | 12.28% | 14.15% | 11.65% |
| * | Inception date of December 21, 2011 for Investor Class. Inception date of January 21, 2014 for Institutional Class. |
The performance information quoted above represents past performance, which is not a guarantee of future results, and does not reflect the deduction of taxes that a shareholder would pay on Fund distributions or the redemption of Fund shares. Investment return and principal value of an investment will fluctuate so that an investor’s shares, when redeemed, may be worth more or less than their original cost. Total return includes reinvestment of dividends and capital gains, if any. Current performance may be lower or higher than the performance data quoted. For the most current month-end performance data, please call 855-298-4236.
Per the prospectus dated January 28, 2020, the Fund had total gross annual operating expenses of 1.58% and 1.30% and net annual operating expenses of 1.45% and 0.97% for the Investor and Institutional Class, respectively.
The S&P 500® Total Return Index is a commonly recognized, market-capitalization weighted index of 500 widely held securities, designed to measure broad U.S. equity performance. You cannot invest directly in an index.
| Annual Report | September 30, 2020 | 7 |
| Centre Global Infrastructure Fund | Manager Commentary |
September 30, 2020 (Unaudited)
Performance & Strategy Summary
For the one-year period ended September 30, 2020, the Centre Global Infrastructure Fund (the “Fund”), Investor Share Class, delivered a total return of -11.49 percent; the Institutional Share Class delivered a total return of -11.30 percent.
During the same one-year period, the MSCI World Infrastructure Index1 and MSCI World Index2 delivered a total return of -5.81 percent and positive 10.41, respectively. The strongest contributors to relative performance within the Fund over the one-year period ended September 30, 2020 included investments within the Telecom sector, Bezeq Israeli Telecom, Spark New Zealand, Hellenic Telecom, NTT Docomo, and T-Mobile; and within the Utilities sector NextEra Energy and Enel Spa. Stock investments that contributed negatively to relative underperformance over the period were mainly in the Energy sector and included ONEOK, Kinder Morgan, Pembina Pipeline, Cheniere Energy, as well as Grupo Aeroportuario del Pacífico. From a sector allocation standpoint, overweight exposures to Energy and Industrials, due to the Fund’s balanced portfolio construction approach across infrastructure-related industries, detracted from the Fund’s performance during the period versus the MSCI World Infrastructure Index. The Fund is diversified across regions and developed countries as well as structurally balanced in a disciplined manner across Telecommunication Infrastructure; Utilities; and the Energy, Transportation, and Social Infrastructure sectors.
Over the past 20 years, global listed infrastructure securities as an asset class have demonstrated upside capture versus global equities of 83.8 percent while only capturing 61.7 percent of the global equity market downside3 . During the previous market sell-off during the quarter September 30, 2018 to December 31, 2018, the Fund exhibited only a 49.6 percent downside capture and then, during the 9-month period of recovery from December 31, 2018 to September 30, 2019, the Fund realized a 107.8 percent upside capture. However, and disappointingly, during the most recent market selloff that began in February 2020, Technology, Health Care and other traditional growth (non-infrastructure related) areas of the broader market performed relatively strong while more value-oriented and cyclical sectors such as Industrials and Energy, in particular, fared quite poorly. In addition, despite the traditional defensive attributes of the Utilities sector, nearly all utility industry areas fared relatively poorly during the drawdown episode in the spring of 2020 and lagged on the subsequent rebound in stock market indexes. Global listed infrastructure securities remain a compelling investment option, characterized by high dividend yields, stable cash flows and attractive long-term risk-adjusted performance while offering a potential hedge against inflation.
Despite significant funding gaps for infrastructure in developed markets, and the years of debate about replacing outdated backbone systems, infrastructure investment has declined as a share of GDP4 in more than half of the G205 economies since the global financial crisis. Years of underinvestment in critical areas such as transportation, water treatment, and power grids could erode future growth potential and productivity. Municipalities are now focusing efforts on connecting companies and private investors with projects that need their capital as well as creating an expanded role for public-private partnerships and tax and other incentives to undertake infrastructure investment. We believe the majority of the infrastructure funding gap will likely be financed by the private sector, creating significant opportunities within publicly traded global listed infrastructure assets, especially in the Telecom and other innovative areas where much intellectual capital resides.
Infrastructure is normally also a defensive asset class because of the characteristics of the underlying assets owned by many global listed infrastructure companies as a result of: 1) inelastic demand due to the essential nature of the assets used in everyday life; 2) high barriers to entry due to the critical and often irreplaceable nature of the assets; and 3) contracted revenue streams that offer inflation protection in many cases. Conventional wisdom holds that you invest in bonds for yield and equities for capital appreciation. While this might be true historically, with 10-Year Treasury yields collapsing over the past 12 months, infrastructure related stocks now offer the best of both. Currently, the 4.49% underlying yield6 of the Fund supersedes the S&P 500 Index’s dividend yield of 1.7% as well as all maturities of Treasury bond yields. From a sector perspective, Infrastructure related areas such as Telecom (4.4%), Energy (7.1%), Industrials (5.1%), and Utilities (4.1%) are all well above the market yield7 .
| 1 | MSCI World Infrastructure Index captures the global opportunity set of companies that are owners or operators of infrastructure assets. Constituents are selected from the equity universe of MSCI World, the parent index. |
| 2 | MSCI World Index is a broad global equity benchmark that represents large and mid-cap equity performance across 23 developed markets countries. |
| 3 | Data from MSCI and Bloomberg based on MSCI World Infrastructure Index. |
| 4 | Gross Domestic Product meaning: Gross Domestic Product, abbreviated as GDP, is the total value of goods and services produced in a country. |
| 5 | The Group of 20, also called the G-20, is a group of finance ministers and central bank governors from 19 of the world's largest economies, including those of many developing nations, along with the European Union. |
| 6 | Underlying yield reflects the annualized income net of expenses of the fund as a percentage of the market unit price of the fund as at the day shown. It is based on a snapshot of the fund on that day. It does not include any preliminary charge and investors may be subject to tax on distributions. As of September 30, 2020, the Centre Global Infrastructure Fund had an underlying yield of 4.49%. |
| 7 | Source: Bloomberg, based upon the Fund’s underlying holdings as of September 30, 2020. |
| Centre Global Infrastructure Fund | Manager Commentary |
September 30, 2020 (Unaudited)
The Fund offers several key differentiators from the broader global equity set of investable companies, as well as passive infrastructure universe indexes including: 1) historically, the MSCI Global Infrastructure Index has generated a dividend yield greater than the yield on conventional core equity indices like the MSCI World Index with the Fund, in turn, having a higher underlying yield than the MSCI Global Infrastructure Index8 ; 2) the Fund pays distributions of dividend and interest income monthly rather than annually; 3) hard assets like infrastructure assets tend to retain their “real” value through the long-term; 4) historically, infrastructure indices’ volatility is lower than on conventional equity indices like the MSCI World Index; 5) historically, high Economic Value Added9 (EVA) companies have outperformed low EVA ones and provides the foundation of our stock selection methodology; and 6) many infrastructure assets have concession agreements or long-term contracts that link to inflation in the long run. In identifying firms with sustainable pricing power, the Fund seeks investments that exhibit high barriers to entry in their segments and that create positive externalities in their regions. The Fund focuses on industries with lower volatility such as toll roads, power stations, hospitals and schools. Also, by targeting high EVA growth companies, the Fund narrows its focus to high quality infrastructure firms that make wise capital allocation decisions. Through our “bottoms-up” analysis, we seek to avoid names that destroy shareholder wealth by either “empire building” or under-investment of capital. Additionally, the stock-selection approach standardizes accounting across countries which facilitates cross-border comparisons between the best U.S. infrastructure companies and international firms. From a portfolio management perspective, the Fund is able take active stock selection positions based on the opportunity sets we see in the market structurally whilst balanced in a disciplined manner across Telecommunication Infrastructure; Utilities; and the Energy, Transportation, and Social Infrastructure sectors.
Market Review & Outlook
European Telecom stocks sold off significantly in February/March (SXKP10 -32% vs SXXP11 -34%); a similar sell-off in magnitude took place in 2008-09 however, at that time, Telecom stocks as a whole outperformed on a relative basis. While equity markets have generally recovered from their initial precipitous declines, US Telecom stocks continue to underperform the broader market, with industry leaders Verizon and AT&T still in negative territory year-to-date. That said, the sector today has a greater portion of revenues that are contracted than was the case in 2008 and work from home has increased the demand for connectivity for higher margin customers. Fixed line was defensive in the last recession as consumers saw broadband as essential. Unlimited mobile data is now the “new” essential for many customers, and recently reported mobile and fixed traffic growth of 60-70% could lead to the upsell of bigger bundles and faster premium priced connections (e.g., 5G). Our bottom-up expectations are optimistic for AT&T, Verizon, Telecom Italia, Deutsche Telekom, Orange, T-Mobile, and Vodafone. As an example, we believe that the current work from home environment highlights the value of AT&T's B2B connectivity solutions, and we believe that more large enterprises are leaning into digitalization and remote work trends. We find the risk/reward around AT&T favorable at these levels given the company's strong free cash flow (FCF) generation, 7% dividend yield, and attractive valuation. We believe AT&T's dividend provides support for the stock price and is well covered (we estimate a 60% dividend payout ratio on $25B in 2020 FCF), which is increasingly attractive in today's historically low interest rate environment. Should a broader theme that 'the worst is over' emerge, which we expect it might, then we would expect a significant positive re-rating of Telecom stocks.
Globally, appreciation for Telecom assets is only intensifying as deal-making has continued without pause through this pandemic. We note billions in Telecom deals globally, despite the pandemic, with Google publicly seeking to buy a stake of about 5% in Vodafone Idea, the second largest telecom operator in India. Google has also held talks with Reliance Jio Platforms, a telecom operator that has raised $10.3 billion in the last couple of months from Facebook and private equity firms Silver Lake, KKR, General Atlantic and Vista. In July, KKR purchased a minority stake in Telecom Italia's secondary grid - the last-mile, copper and fiber network linking to customers' homes. The overarching point, as it concerns telecom investment and secular demand, is that between growth in data usage and 5G rollout, Telecom will continue to be one of the global epicenters of technology investment over the next 20 years. In 2021, we believe Telecom stocks globally will demonstrate better top line growth alongside more M&A and rising recognition of infrastructure values (fiber as well as towers). In the meantime, Masmovil has been acquired, Liberty Global moved to acquire Sunrise, Altice and a UK internet service provider received firm offers to be taken private and we note press speculation (e.g., Bloomberg) of similar for KPN. The industry and private equity see value in Telecom stocks, but public markets don't. We expect that the recent Telecom stock weakness thus far in 2020 will unwind in a low interest-rate world (the incumbent Telecom stocks collectively yield 6%).
Energy stocks have underperformed the S&P 500 index for ten consecutive quarters. The XLE Energy Index12 , fell 50% so far in 2020 compared to a 3% rise in the S&P 500 index. After erasing all their summer gains in the first week of September, oil prices are rebounding, and we believe the year-end Brent forecast of $49/bbl is possible. We believe the dismal days of the second quarter in the sector and the crash in oil prices are behind us. With a return in oil prices to the current $40 level, thoughts have shifted from trying to survive to making sure operations are cash flow positive. Within energy infrastructure, we are focused on low-cost producers with good balance sheets. We continue to position the Fund’s energy exposure to companies with manageable debt and sufficient liquidity to continue to drill, low lifting costs per barrel, and a supportive ownership group with a long investment timeframe. We favor LNG exporters ONEOK (OKE) and Cheniere (LNG) longer-term as cash flows increasingly resemble utility stability, which should result in the shares re-rating higher. As the macro environment improves OKE's ability to grow cash flow, we continue to view OKE and its leading NGL footprint favorably. Additionally, OKE’s ability to flex capital expenditures down allows the company to generate incremental free cash flow in an uncertain environment, which could be used to pay down debt and fund it’s attractive 13% dividend yield.
| 9 | Economic Value Added (EVA) is an estimate of a company’s economic profit. Economic profit, which refers to the profit earned by a company, minus the cost of financing the company’s capital, is an amount that may be considered in the assessment of a company’s overall value. |
| 10 | The STOXX Europe 600 Telecommunications, also called SXKP, aims to track the performance of the European Telecommunications sector as defined by the Industry Classification Benchmark (ICB). It is a sub index of the STOXX Europe 600 Index. |
| 11 | The STOXX Europe 600, also called STOXX 600 or SXXP, is a stock index of European stocks designed by STOXX Ltd. This index has a fixed number of 600 components representing large, mid and small capitalization companies among 17 European countries, covering approximately 90% of the free-float market capitalization of the European stock market (not limited to the Eurozone). |
| 12 | The Energy Select Sector SPDR (XLE) invests in companies that primarily develop and produce crude oil and natural gas, and provide drilling and other energy-related services. |
| Annual Report | September 30, 2020 | 9 |
| Centre Global Infrastructure Fund | Manager Commentary |
September 30, 2020 (Unaudited)
Assuming OPEC+13 production remains stable next year at its 2021 quota, current Dec-21 Brent forward contracts at $46/bbl. reflect both (1) a linear full recovery of Iran production by 2 mb/d through 2021, and (2) end-2021 oil demand still 3 mb/d below pre-COVID levels - both too pessimistic in our view. At our more optimistic demand path (back to pre-COVID level by 4Q20), such a 2021 ramp-up in Iran production with OPEC+ stable at its 2021 quota would bring Dec-21 prices up to $60/bbl, still well above market forwards. The expected additional dollar weakness that would likely come alongside further fiscal stimulus and accommodative monetary policies in the U.S. will create additional upside risk to this estimate. Given the negativity on 2022 balances priced by current oil market forwards, we reiterate our long Dec-21 Brent trade recommendation, which would significantly benefit the Fund’s energy holdings. The recent gyration in oil prices, rallying on days of higher expected stimulus and weakening dollar, suggests a further bullish catalyst for oil. While natural gas would likely rally as well, we already forecast a further rapid appreciation in prices in coming months given the lack of a US gas producer response to high 2021 prices. Net, we reiterate our bullish 2021 call for both gas and oil companies, with the drivers for higher prices superseding the potential outcomes of the US election, even under a split House and Senate.
The turn in earnings cycle, increasing confidence in utilities’ investments, low bond yields and enthusiasm for ESG plays have propelled certain segments of the utility sector higher and it remains the most positive structural backdrop since the 2008-09 financial crisis. Within the utility sector there has been a sharp divergence with perceived quality being rewarded, although with much lower valuation multiples for utilities with a more mixed track record, or in some cases cyclicality. We continue to orient to high quality integrated utilities and regulated networks. The share prices of Iberdrola and Enel have risen sharply over the last eighteen months and Iberdrola is trading on a high absolute multiple. However, our analysis of Iberdrola’s long-term track record convinces us that a premium is justified. These utilities remain attractive plays on long-term renewable and electricity distribution network growth. We also view National Grid favorably even as its shares have dropped since early April in spite of an almost 20% rally in the sector, and we feel that risks around its challenging regulatory review in the UK are already priced in.
As most utilities are declared an essential service, earnings of companies in the utility sector are relatively insulated from the COVID-19 lockdown compared to other sectors. As a highly regulated business, the sector has minor exposure to demand trends (mainly in electricity transmission and gas transportation) and predictable revenues. Utilities will continue to supply power, supported by long-term power purchase agreements (PPA), however demand for power has fallen in certain areas as industrial clients and commercial consumers have temporarily reduced demand from the electrical network. Regulated utility networks remain resilient to the near-term volatility, given that their cash flows are protected by regulations and long-term contracts. This is evident in the outperformance of Duke Energy, NextEra, and Xcel Energy. Pure play regulated utilities appear well-positioned for a challenging market as companies like Consolidated Edison and Eversource have virtually no commodity exposure and sell primarily to residential customers. American Electric Power has more industrial sales, including in the oil patch, yet also boasts a strong balance sheet, diversified territories and growth potential. The Chinese utility sector has outperformed the Hang Seng Index (HSI)14 as it did during the spread of SARS15 in 2003, especially the gas distributors and independent power producers (IPP). The dent to energy retailers and waste companies' profit will likely be front-end loaded while hedging should soften the hit for power generators.
We believe the Fund will perform relatively well with exposure to favorable areas of the world’s equity markets. Also, undervalued international infrastructure-related stocks with strong balance sheets and free cash flows, solid dividend yields, and cyclically depressed profits are poised to outperform in our opinion. The Fund is positioned by targeting energy, telecom, industrials, and other undervalued areas of globally listed infrastructure industries and sub-sectors. The combination of low embedded growth and a robust stream of income payments effectively lowers the duration of the portfolio and, if interest rates rise, this will help protect against a broader based contraction in valuation multiples. Lastly, the Fund’s unique exposure to next-generation global infrastructure adjacencies, including public cloud deployments, data center monitoring, cybersecurity, and IIoT (Industrial Internet of Things) is a key differentiator against legacy managed infrastructure portfolios, which overlook these powerful trends within the industry. Despite the negative performance drag from the Energy sector in 2020, we continue to believe that our combined approach of differentiated stock selection and portfolio construction, whereby the Fund is diversified across regions and developed countries as well as balanced across Telecommunication Infrastructure; Utilities; and the Energy, Transportation, and Social Infrastructure sectors is the most favorable for investors seeking to feature listed infrastructure investments as part of an overall balanced portfolio.
The market outlook is the opinion of the author and can change at any time.
| 13 | OPEC+ is a group of 24 oil-producing nations, made up of the 14 members of the Organization of Petroleum Exporting Countries (OPEC), and 10 other non-OPEC members, including Russia. The format was born in 2017 with a deal to coordinate oil production among the countries in a bid to stabilize prices. |
| 14 | The Hang Seng Index, or HIS, is market capitalization-weighted index of the largest companies that trade on the Hong Kong Exchange. |
| 15 | SARS is a contagious and sometimes fatal respiratory illness caused by a coronavirus. SARS appeared in 2002 in China. It spread worldwide within a few months, though it was quickly contained. |
| Centre Global Infrastructure Fund | Manager Commentary |
September 30, 2020 (Unaudited)
INDUSTRY WEIGHTINGS
As a percentage of Net Assets
| Diversified Telecommunication Services | 25.46% |
| Electric Utilities | 20.16% |
| Oil, Gas & Consumable Fuels | 19.66% |
| Wireless Telecommunication Services | 9.46% |
| Multi-Utilities | 8.33% |
| Health Care Providers & Services | 5.42% |
| Transportation Infrastructure | 4.89% |
| Independent Power and Renewable Electricity Producers | 2.87% |
| Water Utilities | 0.63% |
| Cash and Cash Equivalents | 3.12% |
| Totals | 100.00% |
COUNTRY WEIGHTINGS
As a percentage of Net Assets
| United States | 50.45% |
| Canada | 10.63% |
| Japan | 7.22% |
| Australia | 6.19% |
| Italy | 3.82% |
| Spain | 3.28% |
| France | 2.40% |
| Germany | 2.38% |
| Great Britain | 2.11% |
| Israel | 1.90% |
| Greece | 1.56% |
| Hong Kong | 1.56% |
| New Zealand | 1.52% |
| China | 1.13% |
| Denmark | 0.73% |
| Cash and Cash Equivalents | 3.12% |
| Totals | 100.00% |
These allocations may not reflect the current or future positions of the portfolio.
GROWTH OF HYPOTHETICAL $10,000 INVESTMENT THROUGH SEPTEMBER 30, 2020
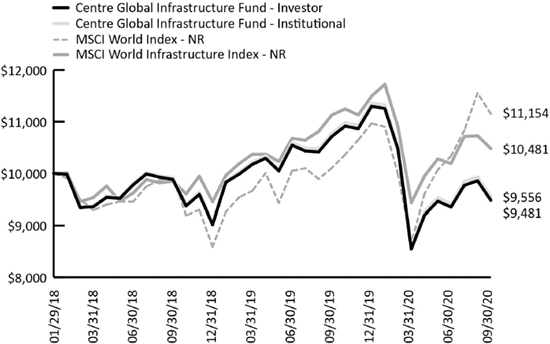
This graph assumes an initial investment of $10,000 at January 29, 2018, the Fund’s inception date, and that any dividends and distributions are reinvested. This graph depicts the performance of the Fund versus the MSCI World Index and the MSCI World Infrastructure Index. Taxes on any Fund distributions or when shares are redeemed, if any, are not reflected. Unlike the Fund, an index is not available for investment, is unmanaged and does not have expenses that affect the results. The comparison is shown for illustrative purposes only.
TOTAL RETURNS – FOR THE PERIOD ENDED SEPTEMBER 30, 2020
| | 1 Month | 3 Month | YTD | 1 Year | Since Inception
(January 29, 2018) |
| Centre Global Infrastructure Fund – Investor | -3.80% | 1.43% | -16.06% | -11.49% | -1.98% |
| Centre Global Infrastructure Fund – Institutional | -3.79% | 1.59% | -15.85% | -11.30% | -1.69% |
| MSCI World Index – NR | -3.45% | 7.93% | 1.70% | 10.41% | 4.18% |
| MSCI World Infrastructure Index – NR | -2.30% | 2.84% | -8.79% | -5.81% | 1.78% |
The performance information quoted above represents past performance, which is not a guarantee of future results, and does not reflect the deduction of taxes that a shareholder would pay on Fund distributions or the redemption of Fund shares. Investment return and principal value of an investment will fluctuate so that an investor’s shares, when redeemed, may be worth more or less than their original cost. Total return includes reinvestment of dividends and capital gains, if any. Current performance may be lower or higher than the performance data quoted. For the most current month-end performance data, please call 855-298-4236.
Per the prospectus dated January 28, 2020, as supplemented August 21, 2020, the Fund had total gross annual operating expenses of 1.83% and 1.55% and net annual operating expenses of 1.37% and 1.14% for the Investor and Institutional Class, respectively.
The MSCI World Index is a broad global equity index that represents large and mid-cap equity performance across 23 developed markets countries. It covers approximately 85% of the free float-adjusted market capitalization in each country. The MSCI World Index does not offer exposure to emerging markets.
MSCI World Infrastructure Index captures the global opportunity set of companies that are owners or operators of infrastructure assets. Constituents are selected from the equity universe of MSCI World, the parent index.
You cannot invest directly in an index.
| Annual Report | September 30, 2020 | 11 |
| Centre Funds | Disclosure of Fund Expenses |
September 30, 2020 (Unaudited)
Example. As a shareholder of a series of Centre Funds (each series, a “Fund” and together, the “Funds”), you will incur two types of costs: (1) transaction costs, including any applicable redemption fees; and (2) ongoing costs, including management fees, distribution and/or service (12b-1) fees (if applicable) and other Fund expenses. The following examples are intended to help you understand your ongoing costs (in dollars) of investing in a Fund and to compare these costs with the ongoing costs of investing in other mutual funds. The examples are based on an investment of $1,000 invested on April 1, 2020 and held through September 30, 2020.
Actual Expenses. The first line under each class of the table below provides information about actual account values and actual expenses. You may use the information in this line, together with the amount you invested, to estimate the expenses that you paid over the period. Simply divide your account value by $1,000 (for example, an $8,600 account value divided by $1,000 = 8.6), then multiply the result by the number in the first line under the heading “Expenses Paid During Period 4/01/2020 – 09/30/2020” to estimate the expenses you paid on your account during this period.
Hypothetical Example for Comparison Purposes. The second line under each class of the table below provides information about hypothetical account values and hypothetical expenses based on each Fund’s actual expense ratio and an assumed rate of return of 5% per year before expenses, which is not the Fund’s actual return. The hypothetical account values and expenses may not be used to estimate the actual ending account balance or expenses you paid for the period. You may use this information to compare the ongoing costs of investing in a Fund and to other funds. To do so, compare this 5% hypothetical example with the 5% hypothetical examples that appear in the shareholder reports of the other funds. Please note that the expenses shown in the table are meant to highlight your ongoing costs only and do not reflect any transactional costs, such as redemption fees, if any. Therefore, the second line under each class of the table below is useful in comparing ongoing costs only, and will not help you determine the relative total costs of owning different funds. In addition, if these transactional costs were included, your costs would have been higher.
| | | Beginning
Account Value
04/01/2020 | | | Ending
Account Value
09/30/2020 | | | Expense Ratio(a) | | | Expenses Paid
During Period
4/1/2020-9/30/2020(b) | |
| Centre American Select Equity Fund | | | | | | | | | | | | | | | | |
| Investor Class | | | | | | | | | | | | | | | | |
| Actual | | $ | 1,000.00 | | | $ | 1,289.90 | | | | 1.48 | % | | $ | 8.47 | |
| Hypothetical (5% return before expenses) | | $ | 1,000.00 | | | $ | 1,017.60 | | | | 1.48 | % | | $ | 7.47 | |
| Institutional Class | | | | | | | | | | | | | | | | |
| Actual | | $ | 1,000.00 | | | $ | 1,292.60 | | | | 0.99 | % | | $ | 5.67 | |
| Hypothetical (5% return before expenses) | | $ | 1,000.00 | | | $ | 1,020.05 | | | | 0.99 | % | | $ | 5.00 | |
| Centre Global Infrastructure Fund | | | | | | | | | | | | | | | | |
| Investor Class | | | | | | | | | | | | | | | | |
| Actual | | $ | 1,000.00 | | | $ | 1,109.40 | | | | 1.31 | % | | $ | 6.91 | |
| Hypothetical (5% return before expenses) | | $ | 1,000.00 | | | $ | 1,018.45 | | | | 1.31 | % | | $ | 6.61 | |
| Institutional Class | | | | | | | | | | | | | | | | |
| Actual | | $ | 1,000.00 | | | $ | 1,110.60 | | | | 1.08 | % | | $ | 5.70 | |
| Hypothetical (5% return before expenses) | | $ | 1,000.00 | | | $ | 1,019.60 | | | | 1.08 | % | | $ | 5.45 | |
| (a) | Annualized, based on the Fund's most recent fiscal half year expenses less any waivers/reimbursements. |
| (b) | Expenses are equal to the Fund's annualized expense ratio, multiplied by the average account value over the period, multiplied by the number of days in the most recent fiscal half year (183), divided by 366. |
| Centre American Select Equity Fund | Schedule of Investments |
September 30, 2020
| | | Shares | | | Value | |
| COMMON STOCKS (99.54%) | | | | | | | | |
| Communication Services (10.64%) | | | | | | | | |
| Diversified Telecommunication Services (1.74%) | | | | | | | | |
| AT&T, Inc. | | | 99,600 | | | $ | 2,839,596 | |
| | | | | | | | | |
| Entertainment (1.11%) | | | | | | | | |
| Netflix, Inc.(a) | | | 3,620 | | | | 1,810,109 | |
| | | | | | | | | |
| Interactive Media & Services (7.79%) | | | | | | | | |
| Alphabet, Inc. Class A, Class A(a) | | | 2,550 | | | | 3,737,280 | |
| Alphabet, Inc. Class C, Class C(a) | | | 2,485 | | | | 3,651,956 | |
| Facebook, Inc., Class A(a) | | | 20,260 | | | | 5,306,094 | |
| | | | | | | | 12,695,330 | |
| Total Communication Services | | | | | | | 17,345,035 | |
| | | | | | | | | |
| Consumer Discretionary (8.49%) | | | | | | | | |
| Internet & Direct Marketing Retail (7.42%) | | | | | | | | |
| Amazon.com, Inc.(a) | | | 3,840 | | | | 12,091,123 | |
| | | | | | | | | |
| Specialty Retail (1.07%) | | | | | | | | |
| The Home Depot, Inc. | | | 6,320 | | | | 1,755,127 | |
| | | | | | | | | |
| Total Consumer Discretionary | | | | | | | 13,846,250 | |
| | | | | | | | | |
| Consumer Staples (18.20%) | | | | | | | | |
| Food Products (12.37%) | | | | | | | | |
| Archer-Daniels-Midland Co. | | | 90,930 | | | | 4,227,336 | |
| Bunge, Ltd. | | | 101,150 | | | | 4,622,555 | |
| Hain Celestial Group, Inc.(a) | | | 113,510 | | | | 3,893,393 | |
| JM Smucker Co. | | | 28,540 | | | | 3,296,941 | |
| Kraft Heinz Co. | | | 137,970 | | | | 4,132,201 | |
| | | | | | | | 20,172,426 | |
| Household Products (1.07%) | | | | | | | | |
| Procter & Gamble Co. | | | 12,500 | | | | 1,737,375 | |
| | | | | | | | | |
| Tobacco (4.76%) | | | | | | | | |
| Altria Group, Inc. | | | 88,410 | | | | 3,416,163 | |
| Philip Morris International, Inc. | | | 57,860 | | | | 4,338,921 | |
| | | | | | | | 7,755,084 | |
| Total Consumer Staples | | | | | | | 29,664,885 | |
| | | | | | | | | |
| Energy (11.34%) | | | | | | | | |
| Oil, Gas & Consumable Fuels (11.34%) | | | | | | | | |
| Chevron Corp. | | | 45,800 | | | | 3,297,600 | |
| Cimarex Energy Co. | | | 121,000 | | | | 2,943,930 | |
| Exxon Mobil Corp. | | | 175,400 | | | | 6,021,482 | |
| Kinder Morgan, Inc. | | | 206,490 | | | | 2,546,022 | |
| The Williams Cos., Inc. | | | 187,530 | | | | 3,684,964 | |
| | | | | | | | 18,493,998 | |
| Total Energy | | | | | | | 18,493,998 | |
| | | | | | | | | |
| Health Care (2.03%) | | | | | | | | |
| Life Sciences Tools & Services (1.03%) | | | | | | | | |
| Thermo Fisher Scientific, Inc. | | | 3,800 | | | | 1,677,776 | |
| | | Shares | | | Value | |
| Health Care (continued) | | | | | | | | |
| Pharmaceuticals (1.00%) | | | | | | | | |
| Johnson & Johnson | | | 10,950 | | | $ | 1,630,236 | |
| | | | | | | | | |
| Total Health Care | | | | | | | 3,308,012 | |
| | | | | | | | | |
| Information Technology (27.46%) | | | | | | | | |
| IT Services (4.49%) | | | | | | | | |
| Mastercard, Inc., Class A | | | 7,400 | | | | 2,502,458 | |
| PayPal Holdings, Inc.(a) | | | 9,800 | | | | 1,930,894 | |
| Visa, Inc., Class A | | | 14,410 | | | | 2,881,568 | |
| | | | | | | | 7,314,920 | |
| Semiconductors & Semiconductor Equipment (3.27%) | | | | | | | | |
| Maxim Integrated Products, Inc. | | | 38,000 | | | | 2,569,180 | |
| NVIDIA Corp. | | | 5,110 | | | | 2,765,634 | |
| | | | | | | | 5,334,814 | |
| Software (10.32%) | | | | | | | | |
| Adobe Systems, Inc.(a) | | | 3,990 | | | | 1,956,816 | |
| Microsoft Corp. | | | 61,997 | | | | 13,039,829 | |
| salesforce.com, Inc.(a) | | | 7,300 | | | | 1,834,636 | |
| | | | | | | | 16,831,281 | |
| Technology Hardware, Storage & Peripherals (9.38%) | | | | | | | | |
| Apple, Inc. | | | 132,000 | | | | 15,286,920 | |
| | | | | | | | | |
| Total Information Technology | | | | | | | 44,767,935 | |
| | | | | | | | | |
| Materials (10.89%) | | | | | | | | |
| Chemicals (6.11%) | | | | | | | | |
| Eastman Chemical Co. | | | 42,100 | | | | 3,288,852 | |
| LyondellBasell Industries, Class A | | | 46,070 | | | | 3,247,474 | |
| Olin Corp. | | | 276,140 | | | | 3,418,613 | |
| | | | | | | | 9,954,939 | |
| Metals & Mining (4.78%) | | | | | | | | |
| Barrick Gold Corp. | | | 277,160 | | | | 7,790,968 | |
| | | | | | | | | |
| Total Materials | | | | | | | 17,745,907 | |
| | | | | | | | | |
| Utilities (10.49%) | | | | | | | | |
| Electric Utilities (5.82%) | | | | | | | | |
| Edison International | | | 57,110 | | | | 2,903,472 | |
| OGE Energy Corp. | | | 84,500 | | | | 2,534,155 | |
| PPL Corp. | | | 148,690 | | | | 4,045,855 | |
| | | | | | | | 9,483,482 | |
| Independent Power and Renewable Electricity Producers(2.60%) | | | | | | | | |
| AES Corp. | | | 233,750 | | | | 4,233,213 | |
| | | | | | | | | |
| Multi-Utilities (2.07%) | | | | | | | | |
| Sempra Energy | | | 28,600 | | | | 3,385,096 | |
| | | | | | | | | |
| Total Utilities | | | | | | | 17,101,791 | |
| | | | | | | | | |
| TOTAL COMMON STOCKS | | | | | | | | |
| (Cost $118,010,578) | | | | | | | 162,273,813 | |
See Notes to Financial Statements.
| Annual Report | September 30, 2020 | 13 |
| Centre American Select Equity Fund | Schedule of Investments |
September 30, 2020
| Expiration Date | | Exercise Price | | | Contracts | | | Notional Value | | | Value | |
| PURCHASED OPTIONS (0.47%) | | | | | | | | | | | | | | | | |
| S&P 500® Index: | | | | | | | | | | | | | | | | |
| 12/18/2020 | | $ | 2,525.00 | | | | 465 | | | $ | 156,379,500 | | | $ | 769,575 | |
| | | | | | | | | | | | | | | | | |
| TOTAL PURCHASED OPTIONS | | | | | | | | | | | | | | | | |
| (Cost $2,227,888) | | | | | | | | | | | | | | | 769,575 | |
| | | 7-Day | | | | | | | |
| | | Yield | | | Shares | | | Value | |
| SHORT TERM INVESTMENTS (0.02%) | | | | | | | | | | | | |
| Money Market Fund (0.02%) | | | | | | | | | | | | |
| Dreyfus Treasury Prime Cash Management, Institutional Class | | | 0.010 | % | | | 28,538 | | | | 28,538 | |
| | | | | | | | | | | | | |
| TOTAL SHORT TERM INVESTMENTS | | | | | | | | | | | | |
| (Cost $28,538) | | | | | | | | | | | 28,538 | |
| | | | | | | | | | | | | |
| TOTAL INVESTMENTS (100.03%) | | | | | | | | | | | | |
| (Cost $120,267,004) | | | | | | | | | | $ | 163,071,926 | |
| Liabilities in Excess of Other Assets (-0.03%) | | | | | | | | | | | (47,677 | ) |
| NET ASSETS (100.00%) | | | | | | | | | | $ | 163,024,249 | |
| (a) | Non-income producing security. |
See Notes to Financial Statements.
| Centre Global Infrastructure Fund | Schedule of Investments |
September 30, 2020
| | | Shares | | | Value | |
| COMMON STOCKS (96.88%) | | | | | | | | |
| ASIA (17.62%) | | | | | | | | |
| Australia (6.19%) | | | | | | | | |
| Diversified Telecommunication Services (1.39%) | | | | | | | | |
| Telstra Corp., Ltd. | | | 290,700 | | | $ | 578,835 | |
| | | | | | | | | |
| Health Care Providers & Services (0.79%) | | | | | | | | |
| Ramsay Health Care, Ltd. | | | 7,000 | | | | 331,309 | |
| | | | | | | | | |
| Multi-Utilities (1.36%) | | | | | | | | |
| AGL Energy, Ltd. | | | 58,200 | | | | 567,760 | |
| | | | | | | | | |
| Transportation Infrastructure (2.65%) | | | | | | | | |
| Transurban Group | | | 109,530 | | | | 1,106,942 | |
| | | | | | | | | |
| Total Australia | | | | | | | 2,584,846 | |
| | | | | | | | | |
| China (1.13%) | | | | | | | | |
| Independent Power and Renewable Electricity Producers (1.13%) | | | | | | | | |
| Datang International Power Generation Co., Ltd. | | | 3,761,000 | | | | 470,729 | |
| | | | | | | | | |
| Total China | | | | | | | 470,729 | |
| | | | | | | | | |
| Hong Kong (1.56%) | | | | | | | | |
| Electric Utilities (1.56%) | | | | | | | | |
| CLP Holdings, Ltd. | | | 70,000 | | | | 650,318 | |
| | | | | | | | | |
| Total Hong Kong | | | | | | | 650,318 | |
| | | | | | | | | |
| Japan (7.22%) | | | | | | | | |
| Diversified Telecommunication Services (0.89%) | | | | | | | | |
| Nippon Telegraph & Telephone Corp. | | | 18,200 | | | | 371,023 | |
| | | | | | | | | |
| Wireless Telecommunication Services (6.33%) | | | | | | | | |
| KDDI Corp. | | | 21,900 | | | | 551,523 | |
| NTT DOCOMO, Inc. | | | 14,000 | | | | 515,716 | |
| SoftBank Corp. | | | 25,400 | | | | 283,587 | |
| SoftBank Group Corp. | | | 21,100 | | | | 1,294,230 | |
| | | | | | | | 2,645,056 | |
| Total Japan | | | | | | | 3,016,079 | |
| | | | | | | | | |
| New Zealand (1.52%) | | | | | | | | |
| Diversified Telecommunication Services (1.52%) | | | | | | | | |
| Spark New Zealand, Ltd. | | | 205,100 | | | | 637,715 | |
| | | | | | | | | |
| Total New Zealand | | | | | | | 637,715 | |
| | | | | | | | | |
| TOTAL ASIA | | | | | | | | |
| (Cost $7,668,082) | | | | | | | 7,359,687 | |
| | | | | | | | | |
| EUROPE (16.28%) | | | | | | | | |
| Denmark (0.73%) | | | | | | | | |
| Electric Utilities (0.73%) | | | | | | | | |
| Orsted A/S(a)(b) | | | 2,200 | | | | 303,293 | |
| | | | | | | | | |
| Total Denmark | | | | | | | 303,293 | |
| | | Shares | | | Value | |
| France (2.40%) | | | | | | |
| Diversified Telecommunication Services (0.66%) | | | | | | | | |
| Orange SA | | | 26,420 | | | $ | 275,193 | |
| | | | | | | | | |
| Health Care Providers & Services (0.57%) | | | | | | | | |
| Orpea(c) | | | 2,100 | | | | 238,977 | |
| | | | | | | | | |
| Multi-Utilities (0.58%) | | | | | | | | |
| Engie SA(c) | | | 18,100 | | | | 242,349 | |
| | | | | | | | | |
| Transportation Infrastructure (0.59%) | | | | | | | | |
| Groupe Eurotunnel(c) | | | 18,050 | | | | 245,489 | |
| | | | | | | | | |
| Total France | | | | | | | 1,002,008 | |
| | | | | | | | | |
| Germany (2.38%) | | | | | | | | |
| Diversified Telecommunication Services (1.79%) | | | | | | | | |
| Deutsche Telekom AG | | | 44,660 | | | | 748,252 | |
| | | | | | | | | |
| Multi-Utilities (0.59%) | | | | | | | | |
| E.ON SE | | | 22,150 | | | | 244,844 | |
| | | | | | | | | |
| Total Germany | | | | | | | 993,096 | |
| | | | | | | | | |
| Great Britain (2.11%) | | | | | | | | |
| Multi-Utilities (0.99%) | | | | | | | | |
| National Grid PLC | | | 35,960 | | | | 412,878 | |
| | | | | | | | | |
| Wireless Telecommunication Services (1.12%) | | | | | | | | |
| Vodafone Group PLC | | | 352,240 | | | | 466,696 | |
| | | | | | | | | |
| Total Great Britain | | | | | | | 879,574 | |
| | | | | | | | | |
| Greece (1.56%) | | | | | | | | |
| Diversified Telecommunication Services (1.56%) | | | | | | | | |
| Hellenic Telecommunications Organization SA | | | 45,200 | | | | 652,369 | |
| | | | | | | | | |
| Total Greece | | | | | | | 652,369 | |
| | | | | | | | | |
| Italy (3.82%) | | | | | | | | |
| Diversified Telecommunication Services (1.33%) | | | | | | | | |
| Telecom Italia SpA | | | 1,384,600 | | | | 555,197 | |
| | | | | | | | | |
| Electric Utilities (1.73%) | | | | | | | | |
| Enel SpA | | | 83,140 | | | | 723,092 | |
| | | | | | | | | |
| Transportation Infrastructure (0.76%) | | | | | | | | |
| Atlantia SpA(c) | | | 20,230 | | | | 318,544 | |
| | | | | | | | | |
| Total Italy | | | | | | | 1,596,833 | |
| | | | | | | | | |
| Spain (3.28%) | | | | | | | | |
| Diversified Telecommunication Services (0.63%) | | | | | | | | |
| Cellnex Telecom SA(a)(b) | | | 4,300 | | | | 262,161 | |
| | | | | | | | | |
| Electric Utilities (1.76%) | | | | | | | | |
| Iberdrola SA | | | 59,910 | | | | 738,242 | |
See Notes to Financial Statements.
| Annual Report | September 30, 2020 | 15 |
| Centre Global Infrastructure Fund | Schedule of Investments |
September 30, 2020
| | | Shares | | | Value | |
| Spain (continued) | | | | | | | | |
| Transportation Infrastructure (0.89%) | | | | | | | | |
| Abertis Infraestructuras SA(c)(d) | | | 1,200 | | | $ | 25,832 | |
| Aena SME SA(a)(b)(c) | | | 2,470 | | | | 345,489 | |
| | | | | | | | 371,321 | |
| Total Spain | | | | | | | 1,371,724 | |
| | | | | | | | | |
| TOTAL EUROPE | | | | | | | | |
| (Cost $7,171,071) | | | | | | | 6,798,897 | |
| | | | | | | | | |
| MIDDLE EAST (1.90%) | | | | | | | | |
| Israel (1.90%) | | | | | | | | |
| Diversified Telecommunication Services (1.90%) | | | | | | | | |
| Bezeq The Israeli Telecommunication Corp., Ltd.(c) | | | 684,100 | | | | 794,792 | |
| | | | | | | | | |
| Total Israel | | | | | | | 794,792 | |
| | | | | | | | | |
| TOTAL MIDDLE EAST | | | | | | | | |
| (Cost $582,672) | | | | | | | 794,792 | |
| | | | | | | | | |
| NORTH AMERICA (61.08%) | | | | | | | | |
| Canada (10.63%) | | | | | | | | |
| Oil, Gas & Consumable Fuels (10.63%) | | | | | | | | |
| Enbridge, Inc. | | | 81,380 | | | | 2,377,441 | |
| Pembina Pipeline Corp. | | | 22,200 | | | | 471,159 | |
| TC Energy Corp. | | | 37,900 | | | | 1,591,086 | |
| | | | | | | | 4,439,686 | |
| Total Canada | | | | | | | 4,439,686 | |
| | | | | | | | | |
| United States (50.45%) | | | | | | | | |
| Diversified Telecommunication Services (13.79%) | | | | | | | | |
| AT&T, Inc. | | | 91,402 | | | | 2,605,871 | |
| Verizon Communications, Inc. | | | 52,998 | | | | 3,152,851 | |
| | | | | | | | 5,758,722 | |
| Electric Utilities (14.38%) | | | | | | | | |
| American Electric Power Co., Inc. | | | 5,130 | | | | 419,275 | |
| Duke Energy Corp. | | | 7,429 | | | | 657,912 | |
| Edison International | | | 12,470 | | | | 633,975 | |
| Eversource Energy | | | 3,427 | | | | 286,326 | |
| Exelon Corp. | | | 10,168 | | | | 363,608 | |
| NextEra Energy, Inc. | | | 4,946 | | | | 1,372,812 | |
| OGE Energy Corp. | | | 15,800 | | | | 473,842 | |
| PPL Corp. | | | 30,860 | | | | 839,700 | |
| The Southern Co. | | | 10,689 | | | | 579,557 | |
| Xcel Energy, Inc. | | | 5,483 | | | | 378,382 | |
| | | | | | | | 6,005,389 | |
| Health Care Providers & Services (4.05%) | | | | | | | | |
| HCA Healthcare, Inc. | | | 10,867 | | | | 1,354,898 | |
| Universal Health Services, Inc., Class B | | | 3,170 | | | | 339,253 | |
| | | | | | | | 1,694,151 | |
| Independent Power and Renewable Electricity Producers (1.74%) | | | | | | | | |
| AES Corp. | | | 40,160 | | | | 727,298 | |
| | | | | | | | | |
| Multi-Utilities (4.82%) | | | | | | | | |
| Dominion Energy, Inc. | | | 8,429 | | | | 665,301 | |
| Public Service Enterprise Group, Inc. | | | 5,129 | | | | 281,633 | |
| | | Shares | | | Value | |
| United States (continued) | | | | | | | | |
| Multi-Utilities (continued) | | | | | | | | |
| Sempra Energy | | | 6,405 | | | $ | 758,096 | |
| WEC Energy Group, Inc. | | | 3,170 | | | | 307,173 | |
| | | | | | | | 2,012,203 | |
| Oil, Gas & Consumable Fuels (9.03%) | | | | | | | | |
| Cheniere Energy, Inc.(c) | | | 9,130 | | | | 422,445 | |
| Kinder Morgan, Inc. | | | 114,556 | | | | 1,412,475 | |
| ONEOK, Inc. | | | 16,652 | | | | 432,619 | |
| The Williams Cos., Inc. | | | 76,490 | | | | 1,503,029 | |
| | | | | | | | 3,770,568 | |
| Water Utilities (0.63%) | | | | | | | | |
| American Water Works Co., Inc. | | | 1,830 | | | | 265,131 | |
| | | | | | | | | |
| Wireless Telecommunication Services (2.01%) | | | | | | | | |
| T-Mobile US, Inc.(c) | | | 7,350 | | | | 840,546 | |
| | | | | | | | | |
| Total United States | | | | | | | 21,074,008 | |
| | | | | | | | | |
| TOTAL NORTH AMERICA | | | | | | | | |
| (Cost $26,921,756) | | | | | | | 25,513,694 | |
| | | | | | | | | |
| TOTAL COMMON STOCKS | | | | | | | | |
| (Cost $42,343,581) | | | | | | | 40,467,070 | |
| | | 7-Day
Yield | | | Shares | | | Value | |
| SHORT TERM INVESTMENTS (2.56%) | | | | | | | | | | | | |
| Money Market Fund (2.56%) | | | | | | | | | | | | |
| Dreyfus Treasury Prime Cash Management, Institutional Class | | | 0.010 | % | | | 1,068,903 | | | | 1,068,903 | |
| | | | | | | | | | | | | |
| TOTAL SHORT TERM INVESTMENTS | | | | | | | | | | | | |
| (Cost $1,068,903) | | | | | | | | | | | 1,068,903 | |
| | | | | | | | | | | | | |
| | | | | | | | | | | | Value | |
| TOTAL INVESTMENTS (99.44%) | | | | | | | | | | | | |
| (Cost $43,412,484) | | | | | | | | | | $ | 41,535,973 | |
| Other Assets In Excess Of Liabilities (0.56%) | | | | | | | | | | | 233,974 | |
| NET ASSETS (100.00%) | | | | | | | | | | $ | 41,769,947 | |
| (a) | Security was purchased pursuant to Rule 144A under the Securities Act of 1933 and may be resold in transactions exempt from registration only to qualified institutional buyers. As of September 30, 2020, these securities had a total aggregate market value of $910,943, representing 2.18% of net assets. |
| (b) | Securities were purchased pursuant to Regulation S under the Securities Act of 1933, which exempts securities offered and sold outside the United States from registration. Such securities cannot be sold in the United States without either an effective registration statement filed pursuant to Securities Act of 1933, or pursuant to an exemption from registration. These securities have been deemed liquid under guidelines approved by the Fund's Board of Trustees. At period end, the aggregate market value of those securities was $910,943, representing 2.18% of net assets. |
See Notes to Financial Statements.
| Centre Global Infrastructure Fund | Schedule of Investments |
September 30, 2020
| (c) | Non-income producing security. |
| (d) | As a result of the use of significant unobservable inputs to determine fair value, these investments have been classified as Level 3 assets. (See Note 3) |
See Notes to Financial Statements.
| Annual Report | September 30, 2020 | 17 |
| Centre Funds | Statements of Assets and Liabilities |
September 30, 2020
| | | Centre American Select Equity Fund | | | Centre Global Infrastructure Fund | |
| ASSETS: | | | | | | |
| Investments, at value | | $ | 163,071,926 | | | $ | 41,535,973 | |
| Foreign currency, at value (Cost $- and $216,470, respectively) | | | – | | | | 216,191 | |
| Receivable for dividends | | | 298,341 | | | | 132,318 | |
| Deposit with broker for options | | | 33,937 | | | | – | |
| Receivable for fund shares sold | | | 31,990 | | | | – | |
| Prepaid and other assets | | | 12,740 | | | | 10,204 | |
| Total Assets | | | 163,448,934 | | | | 41,894,686 | |
| LIABILITIES: | | | | | | | | |
| Payable to investment adviser | | | 92,746 | | | | 18,479 | |
| Payable to custodian | | | 98,877 | | | | – | |
| Payable to administrator | | | 19,989 | | | | 12,109 | |
| Payable to transfer agent | | | 9,192 | | | | 11,789 | |
| Payable for fund shares redeemed | | | 78,707 | | | | 36,498 | |
| Accrued 12b-1 and service fees | | | 67,019 | | | | 10,911 | |
| Payable for custodian fees | | | 6,192 | | | | 10,627 | |
| Payable for printing | | | 11,717 | | | | 3,135 | |
| Payable for legal and audit fees | | | 20,371 | | | | 14,909 | |
| Payable to trustees | | | 13,169 | | | | 2,737 | |
| Payable under the Chief Compliance Officer Services Agreement | | | 4,641 | | | | 813 | |
| Other payables | | | 2,065 | | | | 2,732 | |
| Total Liabilities | | | 424,685 | | | | 124,739 | |
| NET ASSETS | | $ | 163,024,249 | | | $ | 41,769,947 | |
| NET ASSETS CONSIST OF: | | | | | | | | |
| Paid-in capital | | $ | 115,470,003 | | | $ | 72,210,181 | |
| Total distributable earnings/(accumulated deficit) | | | 47,554,246 | | | | (30,440,234 | ) |
| NET ASSETS | | $ | 163,024,249 | | | $ | 41,769,947 | |
| INVESTMENTS, AT COST | | $ | 120,267,004 | | | $ | 43,412,484 | |
| PRICING OF SHARES | | | | | | | | |
| Investor Class | | | | | | | | |
| Net Assets | | $ | 151,342,294 | | | $ | 35,527,389 | |
| Shares outstanding | | | 12,741,887 | | | | 4,054,414 | |
| Net Asset Value, offering and redemption price per share | | $ | 11.88 | | | $ | 8.76 | |
| Institutional Class | | | | | | | | |
| Net Assets | | $ | 11,681,955 | | | $ | 6,242,558 | |
| Shares outstanding | | | 968,618 | | | | 711,901 | |
| Net Asset Value, offering and redemption price per share | | $ | 12.06 | | | $ | 8.77 | |
See Notes to Financial Statements.
| Centre Funds | Statements of Operations |
September 30, 2020
| | | Centre American Select Equity Fund | | | Centre Global Infrastructure Fund | |
| INVESTMENT INCOME: | | | | | | |
| Dividends | | $ | 2,816,969 | | | $ | 1,472,654 | |
| Foreign taxes withheld | | | (10,243 | ) | | | (72,012 | ) |
| Total Investment Income | | | 2,806,726 | | | | 1,400,642 | |
| | | | | | | | | |
| EXPENSES: | | | | | | | | |
| Investment advisory fees | | | 871,250 | | | | 331,066 | |
| Administration fees | | | 217,793 | | | | 77,930 | |
| Transfer agent fees | | | 70,612 | | | | 45,405 | |
| Custodian fees | | | 17,503 | | | | 24,626 | |
| Legal fees | | | 30,844 | | | | 10,100 | |
| Audit and tax fees | | | 13,625 | | | | 14,173 | |
| Trustees' fees and expenses | | | 41,028 | | | | 9,985 | |
| Registration/filing fees | | | 26,903 | | | | 32,835 | |
| 12b-1 fees (Investor Class) | | | 279,413 | | | | 61,028 | |
| Shareholder service fees | | | 138,973 | | | | 25,391 | |
| Printing fees | | | 30,216 | | | | 10,623 | |
| Chief Compliance Officer services fees | | | 45,860 | | | | 13,357 | |
| Miscellaneous expenses | | | 15,493 | | | | 6,780 | |
| Total expenses before waivers | | | 1,799,513 | | | | 663,299 | |
| Fees waived/reimbursed by investment adviser (Investor Class) (Note 5) | | | (98,153 | ) | | | (147,882 | ) |
| Fees waived/reimbursed by investment adviser (Institutional Class) (Note 5) | | | (12,046 | ) | | | (77,189 | ) |
| Net Expenses | | | 1,689,314 | | | | 438,228 | |
| Net Investment Income | | | 1,117,412 | | | | 962,414 | |
| REALIZED AND UNREALIZED GAIN/(LOSS) ON INVESTMENTS: | | | | | | | | |
| Net realized gain/(loss) on investments | | | 7,634,372 | | | | (3,887,439 | ) |
| Net realized loss on foreign currencies | | | – | | | | (11,487 | ) |
| Total realized gain/(loss) | | | 7,634,372 | | | | (3,898,926 | ) |
| Net change in unrealized appreciation/(depreciation) on investments | | | 14,321,634 | | | | (3,757,851 | ) |
| Net change in unrealized depreciation on foreign currencies | | | – | | | | (148 | ) |
| Total change in unrealized appreciation/(depreciation) | | | 14,321,634 | | | | (3,757,999 | ) |
| NET REALIZED AND UNREALIZED GAIN/(LOSS) ON INVESTMENTS AND FOREIGN CURRENCIES | | | 21,956,006 | | | | (7,656,925 | ) |
| NET INCREASE/(DECREASE) IN NET ASSETS RESULTING FROM OPERATIONS | | $ | 23,073,418 | | | $ | (6,694,511 | ) |
See Notes to Financial Statements.
| Annual Report | September 30, 2020 | 19 |
| Centre American Select Equity Fund | Statements of Changes in Net Assets |
| | | For The Year Ended September 30, 2020 | | | For The Year Ended September 30, 2019 | |
| OPERATIONS: | | | | | | | | |
| Net investment income | | $ | 1,117,412 | | | $ | 382,945 | |
| Net realized gain | | | 7,634,372 | | | | 10,568,992 | |
| Net change in unrealized appreciation/(depreciation) | | | 14,321,634 | | | | (17,947,797 | ) |
| Net increase/(decrease) in net assets resulting from operations | | | 23,073,418 | | | | (6,995,860 | ) |
| DISTRIBUTIONS TO SHAREHOLDERS: | | | | | | | | |
| Investor | | | (9,646,868 | ) | | | (19,868,502 | ) |
| Institutional | | | (257,746 | ) | | | (421,061 | ) |
| Total distributions | | | (9,904,614 | ) | | | (20,289,563 | ) |
| CAPITAL SHARE TRANSACTIONS: | | | | | | | | |
| Investor Class | | | | | | | | |
| Proceeds from sale of shares | | | 40,905,684 | | | | 576,912 | |
| Shares issued in reinvestment of distributions | | | 9,374,951 | | | | 19,354,617 | |
| Cost of shares redeemed | | | (16,434,671 | ) | | | (17,577,238 | ) |
| Redemption fees | | | 2,612 | | | | 7,969 | |
| Net increase from capital share transactions | | | 33,848,576 | | | | 2,362,260 | |
| Institutional Class | | | | | | | | |
| Proceeds from sale of shares | | | 9,703,259 | | | | 3,204,613 | |
| Shares issued in reinvestment of distributions | | | 208,376 | | | | 403,144 | |
| Cost of shares redeemed | | | (1,675,613 | ) | | | (2,699,050 | ) |
| Redemption fees | | | 485 | | | | 209 | |
| Net increase from capital share transactions | | | 8,236,507 | | | | 908,916 | |
| Net increase/(decrease) in net assets | | | 55,253,887 | | | | (24,014,247 | ) |
| NET ASSETS: | | | | | | | | |
| Beginning of period | | | 107,770,362 | | | | 131,784,609 | |
| End of period | | $ | 163,024,249 | | | $ | 107,770,362 | |
| | | | | | | | | |
| OTHER INFORMATION: | | | | | | | | |
| Share Transactions: | | | | | | | | |
| Investor Class | | | | | | | | |
| Beginning shares | | | 9,939,604 | | | | 9,481,676 | |
| Shares sold | | | 3,417,489 | | | | 53,925 | |
| Shares issued in reinvestment of dividends | | | 918,212 | | | | 2,022,426 | |
| Shares redeemed | | | (1,533,418 | ) | | | (1,618,423 | ) |
| Ending shares | | | 12,741,887 | | | | 9,939,604 | |
| Institutional Class | | | | | | | | |
| Beginning shares | | | 275,120 | | | | 186,632 | |
| Shares sold | | | 831,613 | | | | 291,039 | |
| Shares issued in reinvestment of dividends | | | 20,172 | | | | 41,820 | |
| Shares redeemed | | | (158,287 | ) | | | (244,371 | ) |
| Ending shares | | | 968,618 | | | | 275,120 | |
See Notes to Financial Statements.
| Centre Global Infrastructure Fund | Statements of Changes in Net Assets |
| | | For The Year Ended September 30, 2020 | | | For The Year Ended September 30, 2019 | |
| OPERATIONS: | | | | | | | | |
| Net investment income | | $ | 962,414 | | | $ | 501,618 | |
| Net realized loss | | | (3,898,926 | ) | | | (19,709 | ) |
| Net change in unrealized appreciation/(depreciation) | | | (3,757,999 | ) | | | 567,655 | |
| Net increase/(decrease) in net assets resulting from operations | | | (6,694,511 | ) | | | 1,049,564 | |
| DISTRIBUTIONS TO SHAREHOLDERS: | | | | | | | | |
| Investor | | | (668,430 | ) | | | (366,658 | ) |
| Institutional | | | (331,972 | ) | | | (117,986 | ) |
| Total distributions | | | (1,000,402 | ) | | | (484,644 | ) |
| CAPITAL SHARE TRANSACTIONS: | | | | | | | | |
| Investor Class | | | | | | | | |
| Proceeds from sale of shares(a) | | | 19,961,747 | | | | 27,332,017 | |
| Shares issued in reinvestment of distributions | | | 484,386 | | | | 280,825 | |
| Cost of shares redeemed | | | (9,205,661 | ) | | | (14,081,842 | ) |
| Redemption fees | | | 5,989 | | | | 2,653 | |
| Net increase from capital share transactions | | | 11,246,461 | | | | 13,533,653 | |
| Institutional Class | | | | | | | | |
| Proceeds from sale of shares(a) | | | 1,766,343 | | | | 29,910,835 | |
| Shares issued in reinvestment of distributions | | | 293,344 | | | | 105,629 | |
| Cost of shares redeemed | | | (16,384,503 | ) | | | (7,840,625 | ) |
| Redemption fees | | | 1,649 | | | | – | |
| Net increase/(decrease) from capital share transactions | | | (14,323,167 | ) | | | 22,175,839 | |
| Net increase/(decrease) in net assets | | | (10,771,619 | ) | | | 36,274,412 | |
| NET ASSETS: | | | | | | | | |
| Beginning of period | | | 52,541,566 | | | | 16,267,154 | |
| End of period | | $ | 41,769,947 | | | $ | 52,541,566 | |
| | | | | | | | | |
| OTHER INFORMATION: | | | | | | | | |
| Share Transactions: | | | | | | | | |
| Investor Class | | | | | | | | |
| Beginning shares | | | 2,837,654 | | | | 1,539,125 | |
| Shares sold(a) | | | 2,120,533 | | | | 2,708,602 | |
| Shares issued in reinvestment of dividends | | | 52,264 | | | | 29,170 | |
| Shares redeemed | | | (956,037 | ) | | | (1,439,243 | ) |
| Ending shares | | | 4,054,414 | | | | 2,837,654 | |
| Institutional Class | | | | | | | | |
| Beginning shares | | | 2,321,016 | | | | 147,361 | |
| Shares sold(a) | | | 228,362 | | | | 2,960,052 | |
| Shares issued in reinvestment of dividends | | | 30,128 | | | | 10,647 | |
| Shares redeemed | | | (1,867,605 | ) | | | (797,044 | ) |
| Ending shares | | | 711,901 | | | | 2,321,016 | |
| (a) | Includes acquisitions described in Note 9. |
See Notes to Financial Statements.
| Annual Report | September 30, 2020 | 21 |
| Centre American Select Equity Fund | Financial Highlights |
| Investor Class | For a share outstanding throughout the periods presented. |
| | | For the Year Ended September 30, 2020 | | | For the Year Ended September 30, 2019 | | | For the Year Ended September 30, 2018 | | | For the Year Ended September 30, 2017 | | | For the Year Ended September 30, 2016 | |
| NET ASSET VALUE, BEGINNING OF PERIOD | | $ | 10.55 | | | $ | 13.63 | | | $ | 13.05 | | | $ | 11.65 | | | $ | 11.67 | |
| INCOME/(LOSS) FROM INVESTMENT OPERATIONS: | | | | | | | | | | | | | | | | | | | | |
| Net investment income/(loss)(a) | | | 0.10 | | | | 0.04 | | | | (0.01 | ) | | | 0.06 | | | | 0.09 | |
| Net realized and unrealized gain/(loss) on investments | | | 2.25 | | | | (0.96 | ) | | | 2.20 | | | | 1.74 | | | | 1.11 | |
| Total income/(loss) from investment operations | | | 2.35 | | | | (0.92 | ) | | | 2.19 | | | | 1.80 | | | | 1.20 | |
| | | | | | | | | | | | | | | | | | | | | |
| DISTRIBUTIONS: | | | | | | | | | | | | | | | | | | | | |
| Net investment income | | | (0.02 | ) | | | (0.03 | ) | | | (0.00 | )(b) | | | (0.15 | ) | | | (0.02 | ) |
| Net realized gains on investments | | | (1.00 | ) | | | (2.13 | ) | | | (1.61 | ) | | | (0.25 | ) | | | (1.20 | ) |
| Total distributions | | | (1.02 | ) | | | (2.16 | ) | | | (1.61 | ) | | | (0.40 | ) | | | (1.22 | ) |
| REDEMPTION FEES ADDED TO PAID-IN CAPITAL (NOTE 4) | | | 0.00 | (c) | | | 0.00 | (c) | | | 0.00 | (c) | | | 0.00 | (c) | | | 0.00 | (c) |
| NET INCREASE/(DECREASE) IN NET ASSET VALUE | | | 1.33 | | | | (3.08 | ) | | | 0.58 | | | | 1.40 | | | | (0.02 | ) |
| NET ASSET VALUE, END OF PERIOD | | $ | 11.88 | | | $ | 10.55 | | | $ | 13.63 | | | $ | 13.05 | | | $ | 11.65 | |
| | | | | | | | | | | | | | | | | | | | | |
| Total Return(d) | | | 23.82 | % | | | (5.12 | %) | | | 18.10 | % | | | 15.99 | % | | | 10.74 | % |
| | | | | | | | | | | | | | | | | | | | | |
| SUPPLEMENTAL DATA: | | | | | | | | | | | | | | | | | | | | |
| Net assets, end of period (000) | | $ | 151,342 | | | $ | 104,838 | | | $ | 129,231 | | | $ | 123,938 | | | $ | 126,238 | |
| | | | | | | | | | | | | | | | | | | | | |
| RATIOS TO AVERAGE NET ASSETS: | | | | | | | | | | | | | | | | | | | | |
| Net investment income/(loss) including reimbursement/waiver | | | 0.93 | % | | | 0.32 | % | | | (0.06 | %) | | | 0.47 | % | | | 0.77 | % |
| Operating expenses excluding reimbursement/waiver | | | 1.56 | % | | | 1.58 | % | | | 1.60 | % | | | 1.46 | % | | | 1.36 | % |
| Operating expenses including reimbursement/waiver | | | 1.47 | % | | | 1.45 | % | | | 1.32 | %(e) | | | 1.05 | % | | | 1.05 | % |
| | | | | | | | | | | | | | | | | | | | | |
| PORTFOLIO TURNOVER RATE | | | 94 | % | | | 114 | % | | | 87 | % | | | 81 | % | | | 74 | % |
| (a) | Calculated using the average shares method. |
| (b) | Less than $(0.005) per share. |
| (c) | Less than $0.005 per share. |
| (d) | Total returns would have been lower had certain expenses not been waived during the period. Returns shown do not reflect the deduction of taxes that a shareholder would pay on fund distributions or the redemption of fund shares. |
| (e) | Effective January 29, 2018, the net expense limitation changed from 1.05% to 1.10%, excluding, among other fees and expenses, 12b-1 fees and shareholder service fees. |
See Notes to Financial Statements.
| Centre American Select Equity Fund | Financial Highlights |
| Institutional Class | For a share outstanding throughout the periods presented. |
| | | For the Year Ended September 30, 2020 | | | For the Year Ended September 30, 2019 | | | For the Year Ended September 30, 2018 | | | For the Year Ended September 30, 2017 | | | For the Year Ended September 30, 2016 | |
| NET ASSET VALUE, BEGINNING OF PERIOD | | $ | 10.66 | | | $ | 13.68 | | | $ | 13.05 | | | $ | 11.67 | | | $ | 11.69 | |
| INCOME/(LOSS) FROM INVESTMENT OPERATIONS: | | | | | | | | | | | | | | | | | | | | |
| Net investment income(a) | | | 0.20 | | | | 0.09 | | | | 0.04 | (b) | | | 0.08 | | | | 0.10 | |
| Net realized and unrealized gain/(loss) on investments | | | 2.23 | | | | (0.95 | ) | | | 2.21 | | | | 1.74 | | | | 1.11 | |
| Total income/(loss) from investment operations | | | 2.43 | | | | (0.86 | ) | | | 2.25 | | | | 1.82 | | | | 1.21 | |
| | | | | | | | | | | | | | | | | | | | | |
| DISTRIBUTIONS: | | | | | | | | | | | | | | | | | | | | |
| Net investment income | | | (0.03 | ) | | | (0.03 | ) | | | (0.01 | ) | | | (0.19 | ) | | | (0.03 | ) |
| Net realized gains on investments | | | (1.00 | ) | | | (2.13 | ) | | | (1.61 | ) | | | (0.25 | ) | | | (1.20 | ) |
| Total distributions | | | (1.03 | ) | | | (2.16 | ) | | | (1.62 | ) | | | (0.44 | ) | | | (1.23 | ) |
| REDEMPTION FEES ADDED TO PAID-IN CAPITAL (NOTE 4) | | | 0.00 | (c) | | | 0.00 | (c) | | | – | | | | 0.00 | (c) | | | – | |
| NET INCREASE/(DECREASE) IN NET ASSET VALUE | | | 1.40 | | | | (3.02 | ) | | | 0.63 | | | | 1.38 | | | | (0.02 | ) |
| NET ASSET VALUE, END OF PERIOD | | $ | 12.06 | | | $ | 10.66 | | | $ | 13.68 | | | $ | 13.05 | | | $ | 11.67 | |
| | | | | | | | | | | | | | | | | | | | | |
| Total Return(d) | | | 24.42 | % | | | (4.61 | %) | | | 18.55 | % | | | 16.20 | % | | | 10.74 | % |
| | | | | | | | | | | | | | | | | | | | | |
| SUPPLEMENTAL DATA: | | | | | | | | | | | | | | | | | | | | |
| Net assets, end of period (000) | | $ | 11,682 | | | $ | 2,932 | | | $ | 2,554 | | | $ | 2,440 | | | $ | 21,058 | |
| | | | | | | | | | | | | | | | | | | | | |
| RATIOS TO AVERAGE NET ASSETS: | | | | | | | | | | | | | | | | | | | | |
| Net investment income including reimbursement/waiver | | | 1.73 | % | | | 0.84 | % | | | 0.32 | % | | | 0.66 | % | | | 0.88 | % |
| Operating expenses excluding reimbursement/waiver | | | 1.26 | % | | | 1.29 | % | | | 1.27 | % | | | 1.18 | % | | | 1.13 | % |
| Operating expenses including reimbursement/waiver | | | 0.99 | % | | | 0.95 | % | | | 0.93 | %(e) | | | 0.95 | % | | | 0.95 | % |
| | | | | | | | | | | | | | | | | | | | | |
| PORTFOLIO TURNOVER RATE | | | 94 | % | | | 114 | % | | | 87 | % | | | 81 | % | | | 74 | % |
| (a) | Calculated using the average shares method. |
| (b) | The per share amount does not correspond to activity reflected in the Statement of Operations due to class specific expenses during the period. |
| (c) | Less than $0.005 per share. |
| (d) | Total returns would have been lower had certain expenses not been waived during the period. Returns shown do not reflect the deduction of taxes that a shareholder would pay on fund distributions or the redemption of fund shares. |
| (e) | Effective January 29, 2018, the net expense limitation changed from 0.95% to 0.90%, excluding, among other fees and expenses, shareholder service fees. |
See Notes to Financial Statements.
| Annual Report | September 30, 2020 | 23 |
| Centre Global Infrastructure Fund | Financial Highlights |
| Investor Class | For a share outstanding throughout the periods presented. |
| | | For the Year Ended September 30, 2020 | | | For the Year Ended September 30, 2019 | | | For the Period January 29, 2018 (Inception) to September 30, 2018 | |
| NET ASSET VALUE, BEGINNING OF PERIOD | | $ | 10.18 | | | $ | 9.64 | | | $ | 10.00 | |
| INCOME/(LOSS) FROM INVESTMENT OPERATIONS: | | | | | | | | | | | | |
| Net investment income(a) | | | 0.25 | | | | 0.22 | | | | 0.12 | |
| Net realized and unrealized gain/(loss) on investments | | | (1.41 | ) | | | 0.57 | | | | (0.29 | ) |
| Total income/(loss) from investment operations | | | (1.16 | ) | | | 0.79 | | | | (0.17 | ) |
| | | | | | | | | | | | | |
| DISTRIBUTIONS: | | | | | | | | | | | | |
| Net investment income | | | (0.26 | ) | | | (0.25 | ) | | | (0.15 | ) |
| Net realized gains on investments | | | – | | | | – | | | | (0.10 | ) |
| Total distributions | | | (0.26 | ) | | | (0.25 | ) | | | (0.25 | ) |
| REDEMPTION FEES ADDED TO PAID-IN CAPITAL (NOTE 4) | | | 0.00 | (b) | | | 0.00 | (b) | | | 0.06 | |
| NET INCREASE/(DECREASE) IN NET ASSET VALUE | | | (1.42 | ) | | | 0.54 | | | | (0.36 | ) |
| NET ASSET VALUE, END OF PERIOD | | $ | 8.76 | | | $ | 10.18 | | | $ | 9.64 | |
| | | | | | | | | | | | | |
| Total Return(c) | | | (11.49 | %) | | | 8.41 | % | | | (1.18 | %) |
| | | | | | | | | | | | | |
| SUPPLEMENTAL DATA: | | | | | | | | | | | | |
| Net assets, end of period (000) | | $ | 35,527 | | | $ | 28,879 | | | $ | 14,843 | |
| | | | | | | | | | | | | |
| RATIOS TO AVERAGE NET ASSETS: | | | | | | | | | | | | |
| Net investment income including reimbursement/waiver | | | 2.62 | % | | | 2.28 | % | | | 1.87 | %(d) |
| Operating expenses excluding reimbursement/waiver | | | 1.89 | % | | | 2.29 | % | | | 2.34 | %(d) |
| Operating expenses including reimbursement/waiver | | | 1.28 | %(e) | | | 1.30 | %(f) | | | 1.33 | %(g) |
| | | | | | | | | | | | | |
| PORTFOLIO TURNOVER RATE | | | 75 | % | | | 233 | % | | | 49 | %(h) |
| (a) | Calculated using the average shares method. |
| (b) | Less than $0.005 per share. |
| (c) | Total returns are for the period indicated and have not been annualized. Total returns would have been lower had certain expenses not been waived during the period. Returns shown do not reflect the deduction of taxes that a shareholder would pay on fund distributions or the redemption of fund shares. |
| (e) | Effective July 21, 2020, the net expense limitation changed from 1.25% to 1.05%, excluding, among other fees and expenses, 12b-1 fees and shareholder service fees. |
| (f) | Effective July 22, 2019, the net expense limitation changed from 1.05% to 1.25%, including, among other fees and expenses, 12b-1 fees and shareholder service fees. |
| (g) | Effective May 18, 2018, the net expense limitation changed from 1.30% to 1.05%, excluding, among other fees and expenses, 12b-1 fees and shareholder service fees. |
| (h) | Portfolio turnover rate for periods less than one full year have not been annualized. |
See Notes to Financial Statements.
| Centre Global Infrastructure Fund | Financial Highlights |
| Institutional Class | For a share outstanding throughout the periods presented. |
| | | For the Year Ended September 30, 2020 | | | For the Year Ended September 30, 2019 | | | For the Period January 29, 2018 (Inception) to September 30, 2018 | |
| NET ASSET VALUE, BEGINNING OF PERIOD | | $ | 10.20 | | | $ | 9.67 | | | $ | 10.00 | |
| INCOME/(LOSS) FROM INVESTMENT OPERATIONS: | | | | | | | | | | | | |
| Net investment income(a) | | | 0.26 | | | | 0.24 | | | | 0.15 | |
| Net realized and unrealized gain/(loss) on investments | | | (1.40 | ) | | | 0.57 | | | | (0.23 | ) |
| Total income/(loss) from investment operations | | | (1.14 | ) | | | 0.81 | | | | (0.08 | ) |
| | | | | | | | | | | | | |
| DISTRIBUTIONS: | | | | | | | | | | | | |
| Net investment income | | | (0.29 | ) | | | (0.28 | ) | | | (0.15 | ) |
| Net realized gains on investments | | | – | | | | – | | | | (0.10 | ) |
| Total distributions | | | (0.29 | ) | | | (0.28 | ) | | | (0.25 | ) |
| REDEMPTION FEES ADDED TO PAID-IN CAPITAL (NOTE 4) | | | 0.00 | (b) | | | – | | | | – | |
| NET INCREASE/(DECREASE) IN NET ASSET VALUE | | | (1.43 | ) | | | 0.53 | | | | (0.33 | ) |
| NET ASSET VALUE, END OF PERIOD | | $ | 8.77 | | | $ | 10.20 | | | $ | 9.67 | |
| | | | | | | | | | | | | |
| Total Return(c) | | | (11.30 | %) | | | 8.59 | % | | | (0.78 | %) |
| | | | | | | | | | | | | |
| SUPPLEMENTAL DATA: | | | | | | | | | | | | |
| Net assets, end of period (000) | | $ | 6,243 | | | $ | 23,663 | | | $ | 1,424 | |
| | | | | | | | | | | | | |
| RATIOS TO AVERAGE NET ASSETS: | | | | | | | | | | | | |
| Net investment income including reimbursement/waiver | | | 2.60 | % | | | 2.48 | % | | | 2.28 | %(d) |
| Operating expenses excluding reimbursement/waiver | | | 1.63 | % | | | 1.61 | % | | | 7.96 | %(d) |
| Operating expenses including reimbursement/waiver | | | 1.02 | %(e) | | | 1.01 | %(f) | | | 1.16 | %(g) |
| | | | | | | | | | | | | |
| PORTFOLIO TURNOVER RATE | | | 75 | % | | | 233 | % | | | 49 | %(h) |
| (a) | Calculated using the average shares method. |
| (b) | Less than $0.005 per share. |
| (c) | Total returns are for the period indicated and have not been annualized. Total returns would have been lower had certain expenses not been waived during the period. Returns shown do not reflect the deduction of taxes that a shareholder would pay on fund distributions or the redemption of fund shares. |
| (e) | Effective July 21, 2020, the net expense limitation changed from 1.00% to 1.10%, excluding, among other fees and expenses, 12b-1 fees and shareholder service fees. |
| (f) | Effective July 22, 2019, the net expense limitation changed from 1.10% to 1.00%, including, among other fees and expenses, 12b-1 fees and shareholder service fees. |
| (g) | Effective May 18, 2018, the net expense limitation changed from 1.30% to 1.10%, excluding, among other fees and expenses, 12b-1 fees and shareholder service fees. |
| (h) | Portfolio turnover rate for periods less than one full year have not been annualized. |
See Notes to Financial Statements.
| Annual Report | September 30, 2020 | 25 |
| Centre Funds | Notes to Financial Statements |
September 30, 2020
1. ORGANIZATION
Centre Funds (the “Trust”) was organized on March 17, 2011, as a Delaware statutory trust and is registered as an open-end management investment company under the Investment Company Act of 1940, as amended (the “1940 Act”). Prior to January 17, 2014, the Trust was known as Drexel Hamilton Mutual Funds. The Trust currently offers shares of beneficial interest (“shares”) of Centre American Select Equity Fund (the “American Select Equity Fund”) and Centre Global Infrastructure Fund (the “Infrastructure Fund”) (each individually a “Fund” and collectively, the “Funds”). The affairs of the Trust are overseen by a Board of Trustees (the “Board” or the “Trustees”). The Declaration of Trust permits the Trustees to create additional series of the Trust and share classes.
Information in the accompanying Funds’ financial statements pertain to the Investor Class and Institutional Class shares offered by each of the Funds. All classes of shares have identical rights to earnings, assets, and voting privileges, except for class-specific expenses and exclusive rights to vote on matters affecting only individual classes.
2. SIGNIFICANT ACCOUNTING POLICIES
The following is a summary of significant accounting policies followed by the Funds in the preparation of the Financial Statements. These policies are in conformity with accounting principles generally accepted in the United States of America (“GAAP”). Each Fund is an investment company and accordingly follows the investment company accounting and reporting guidance of the Financial Accounting Standards Board Accounting Standard Codification Topic 946 Financial Services – Investment Companies.
| (a) | Portfolio securities traded on a securities exchange or quoted by NASDAQ are valued at the last sale price on the principal exchange on which they are traded at the time the securities are valued, or, if not traded on that day, are valued at the closing bid price. Securities traded in the OTC market and not quoted by NASDAQ are valued at their last sale price or, if there is no available price, the last bid price quoted by brokers that make markets in the securities as of the close of regular trading hours on the day the securities are being valued. Foreign securities are valued on the basis of quotations from the primary market in which they are traded, and are translated from the local currency into U.S. dollars using exchange rates as of the close of regular trading (normally 4:00 p.m. Eastern time) on the New York Stock Exchange (the “Exchange”) or using methods determined by the Board. Short-term instruments with maturities of 60 days or less are valued at the price supplied by an approved independent pricing source. Options contracts listed for trading on a securities exchange or board of trade shall be valued at the mean of the highest bid and lowest asked quotation across the exchanges on which the option is traded. Futures contracts are ordinarily valued at the closing settlement price on the exchange on which they are primarily traded or based upon the current settlement price for a like instrument acquired on the day on which the instrument is being valued. Securities and other assets for which quotations are not readily available or deemed unreliable are valued at their fair value using methods determined by the Board. Fair valuation of a particular security is an inherently subjective process, with no single standard to utilize when determining a security’s fair value. As such, different mutual funds could reasonably arrive at a different fair value price for the same security. In each case where a security is fair valued, consideration is given to the facts and circumstances relevant to the particular situation. This consideration includes reviewing various factors set forth in the pricing procedures adopted by the Board and other factors as warranted. In making a fair value determination, factors that may be considered, among others, may include: the type and structure of the security; unusual events or circumstances relating to the security’s issuer; general market conditions; prior day’s valuation; fundamental analytical data; size of the holding; cost of the security on the date of purchase; nature and duration of any restriction on disposition; trading activities; and prices of similar securities or financial instruments. If a Fund invests in shares of other open-end mutual funds, including Money Market Funds, (each, an “Underlying Fund”), the Fund calculates the net asset value of its shares using the reported net asset value of the applicable Underlying Fund. For each Underlying Fund, the net asset value per share for a class of shares is determined as of the close of the Exchange on each day the Exchange is open by dividing the value of the Underlying Fund’s net assets attributable to that class by the number of outstanding shares of that class on that day. |
| (b) | The per share net asset value (the “NAV”) of each Fund is calculated as of the close of regular trading on the Exchange (normally 4:00 p.m. Eastern time) each day the Exchange is open. The per share NAV is calculated by deducting from the Fund’s assets, the Fund’s liabilities, and then dividing the resulting net assets by the total number of shares outstanding, rounded to the nearest cent. The purchase price and redemption price per share is equal to the next determined NAV per share. Redemption of shares of American Select Equity Fund and Infrastructure Fund are subject to a redemption fee of 2% if redeemed within 90 days of purchase. |
| (c) | The Trust treats each Fund as a separate entity for Federal income tax purposes. Each Fund intends to continue to qualify each year as a “regulated investment company” under Subchapter M of the Internal Revenue Code of 1986, as amended (the “Code”). By so qualifying, each Fund will not be subject to Federal income taxes to the extent that it distributes substantially all of its taxable or tax-exempt income, if any, for its tax year ending September 30. In addition, by distributing in each calendar year substantially all of its net investment income, capital gains and certain other amounts, if any, each Fund will not be subject to a Federal excise tax. Therefore, no provision is made by the Funds for Federal income or excise taxes. Withholding taxes on foreign dividends are paid or provided for in accordance with the applicable country’s tax rules and rates. |
| Centre Funds | Notes to Financial Statements |
September 30, 2020
As of and during the year ended September 30, 2020, the Funds did not have a liability for any unrecognized tax benefits in the accompanying financial statements. The Funds recognize the interest and penalties, if any, related to the unrecognized tax benefits as income tax expense in the Statements of Operations. During the year, the Funds did not incur any interest or penalties.
| (d) | Net realized gains and losses on investments are computed on the identified cost basis. Dividend income is recognized on the ex-dividend date or for certain foreign securities, as soon as information is available, and interest income is recognized on an accrual basis. The Funds amortize premium and accrete discount on investments utilizing the effective interest method. Foreign dividend income may be subject to foreign withholding taxes. |
| (e) | A restricted security is a security that has been purchased through a private offering and cannot be resold to the general public without prior registration under the Securities Act of 1933, as amended (the “1933 Act”), or pursuant to the resale limitations provided by Rule 144 under the 1933 Act, or an exemption from the registration requirements of the 1933 Act. Whether a restricted security is illiquid is determined pursuant to guidelines established by the Board. Not all restricted securities are considered to be illiquid. As of September 30, 2020, the Funds did not hold any illiquid securities. |
| (f) | The accompanying financial statements were prepared in accordance with GAAP, which require the use of estimates and assumptions made by management. These may affect the reported amounts of assets and liabilities and disclosure of contingent assets and liabilities at the date of the financial statements and the reported amounts of increases and decreases in net assets from operations during the reporting period. Actual results could differ from those estimates. |
| (g) | Each Fund bears expenses incurred specifically by such Fund, as well as its pro rata portion of Trust expenses, which may be allocated on the basis of relative net assets or the nature of the services performed relative to applicability to each Fund. Expenses that are specific to a Fund or class of shares of a Fund are charged directly to that Fund or share class. All of the realized and unrealized gains and losses and net investment income of a Fund, other than class-specific expenses, are allocated daily to each class in proportion to its average daily net assets. Fees payable under the distribution (Rule 12b-1) plan and shareholder services plan are charged to each respective fund or share class. |
| (h) | The Funds intend to distribute to shareholders all of their net income and/or capital gains on an annual basis. Income and capital gains distributions are determined in accordance with income tax regulations, which may differ from GAAP. Distributions to shareholders are recorded on the ex-dividend date. |
| (i) | A Fund may directly purchase securities of foreign issuers. Investing in securities of foreign issuers involves special risks not typically associated with investing in securities of U.S. issuers. The risks include possible reevaluation of currencies, the inability to repatriate foreign currency, less complete financial information about companies and possible future adverse political and economic developments. Moreover, securities of many foreign issuers and their markets may be less liquid and their prices more volatile than those of securities of comparable U.S. issuers. |
| (j) | The books and records of the Funds are maintained in U.S. dollars. Investment valuations and other assets and liabilities initially expressed in foreign currencies are converted each business day into U.S. dollars based upon current exchange rates. The portion of realized and unrealized gains or losses on investments due to fluctuations in foreign currency exchange rates is not separately disclosed and is not included in net realized and net change in unrealized gains or losses on foreign currencies. |
| (k) | Idle cash may be swept into various overnight demand deposits and is classified as cash and cash equivalents on the Statements of Assets and Liabilities. The Funds maintain cash in bank deposit accounts which, at times, may exceed United States federally insured limits. Amounts swept overnight are available on the next business day. |
3. FAIR VALUE MEASUREMENTS
The Funds normally use third-party pricing services to obtain market quotations for their portfolio investments. Securities and other assets for which representative market quotations are not readily available or which cannot be accurately valued using the Trust’s normal pricing procedures are valued at fair value as determined in good faith under policies approved by the Trustees. Fair value pricing may be used, for example, in situations where (i) an exchange-traded portfolio security is so thinly traded that there have been no transactions for that security over an extended period of time or the validity of a market quotation received is questionable; (ii) the exchange on which the portfolio security is principally traded closes early; or (iii) trading of the portfolio security is halted during the day and does not resume prior to the NAV calculation.
| Annual Report | September 30, 2020 | 27 |
| Centre Funds | Notes to Financial Statements |
September 30, 2020
The inputs used in determining the fair value of each Fund’s investments are summarized into three levels, as described in the following hierarchy:
| Level 1 - | Unadjusted quoted prices in active markets for identical, unrestricted assets or liabilities that a Fund has the ability to access at the measurement date. |
| Level 2 - | Quoted prices which are not active, quoted prices for similar assets or liabilities in active markets or inputs other than quoted prices that are observable (either directly or indirectly). |
| Level 3 - | Significant unobservable prices or inputs (including the oversight of the Board and Centre Asset Management, LLC (the “Adviser”) in determining the fair value of investments) where there is little or no market activity for the asset or liability at measurement date. |
The inputs or methodology used for valuing securities are not necessarily an indication of the risk associated with investing in those securities.
The following is a summary of each Fund’s investments in the fair value hierarchy as of September 30, 2020:
Centre American Select Equity Fund
| Investments in Securities at Value(a) | | Level 1 - Quoted Prices | | | Level 2 -Other Significant Observable Inputs | | | Level 3 -Significant Unobservable Inputs | | | Total | |
| Common Stocks | | $ | 162,273,813 | | | $ | – | | | $ | – | | | $ | 162,273,813 | |
| Purchased Options | | | 769,575 | | | | – | | | | – | | | | 769,575 | |
| Short Term Investments | | | 28,538 | | | | – | | | | – | | | | 28,538 | |
| Total | | $ | 163,071,926 | | | $ | – | | | $ | – | | | $ | 163,071,926 | |
Centre Global Infrastructure Fund
| Investments in Securities at Value(a) | | Level 1 - Quoted Prices | | | Level 2 - Other Significant Observable Inputs | | | Level 3 - Significant Unobservable Inputs | | | Total | |
| Common Stocks | | $ | 40,441,238 | | | $ | – | | | $ | 25,832 | | | $ | 40,467,070 | |
| Short Term Investments | | | 1,068,903 | | | | – | | | | – | | | | 1,068,903 | |
| Total | | $ | 41,510,141 | | | $ | – | | | $ | 25,832 | | | $ | 41,535,973 | |
| (a) | For detailed descriptions of sectors, industries, and countries, see the accompanying Schedules of Investments. |
The following is a summary of valuation techniques and quantitative information used in determining the fair value of the Centre Global Infrastructure Fund’s Level 3 investments at September 30, 2020:
| Asset Type | | Balance as of September 30, 2019 | | | Accrued Discount/ premium | | | Realized Gain/(Loss) | | | Change in Unrealized Appreciation/ Depreciation | | | Purchases | | | Sales Proceeds | | | Transfer into Level 3 | | | Transfer Out of Level 3 | | | Balance as of September 30, 2020 | | | Net change in unrealized appreciation/(depreciation) included in the Statements of Operations attributable to Level 3 investments held at September 30, 2020 | |
| Common Stocks | | $ | – | | | $ | – | | | $ | – | | | $ | 1,260 | | | $ | 24,572 | | | $ | – | | | $ | – | | | $ | – | | | $ | 25,832 | | | $ | 1,260 | |
| | | $ | – | | | $ | – | | | $ | – | | | $ | 1,260 | | | $ | 24,572 | | | $ | – | | | $ | – | | | $ | – | | | $ | 25,832 | | | $ | 1,260 | |
Derivative Financial Instruments
A Fund may use derivative contracts, such as exchange-traded options and futures, that are related to stock market or bond indices, foreign exchange, fixed income or other securities, or be exposed to exchange-traded derivative products. A Fund may invest its assets in derivatives and other instruments to help manage interest rate exposure, protect the Fund’s assets, or enhance returns. A Fund may also be exposed to certain exchange-traded derivative products, such as exchange-traded futures and options that are fully collateralized by cash or securities, for temporary cash management or investment transition purposes, or to hedge the risks of existing positions or overall capital protection.
Derivative Risk: One or more Funds may use derivatives, such as exchange-traded options and futures, that are related to stock market or bond indexes, foreign exchange, fixed income or other securities or be exposed to exchange-traded derivative products. Loss may result from a Fund’s investments in exchange-traded futures and options. The value of derivatives in which a Fund may invest may rise or fall more rapidly than other investments. Other risks of investments in derivatives include imperfect correlation between the value of these instruments and the underlying assets; risks of default by the other party to the derivative transactions; risk that the transactions may result in losses that offset gains in portfolio positions; and risks that the derivative transactions may not be liquid. Derivatives, such as exchange-traded futures and options, contain “inherent” leverage because derivative contracts may give rise to an obligation on the part of a Fund for future payment or liabilities that are larger than the initial margin or premiums required to establish such positions. Combined with the volatility of derivatives prices, the leveraged nature of derivatives trading could cause a Fund to sustain large and sudden losses. The use of derivatives, such as futures and options, can lead to losses, including those magnified by leverage, particularly when derivatives are used to enhance return rather than mitigate risk. Correlation risk is the risk that changes in the value of the derivative may not correlate perfectly with the underlying asset, rate or index. Certain derivative instruments may be difficult to sell when the Adviser believes it would be appropriate to do so.
| Centre Funds | Notes to Financial Statements |
September 30, 2020
Derivatives may have little or no initial cash investment relative to their market value exposure and therefore can produce significant gains or losses in excess of their cost. This use of embedded leverage may allow a Fund to increase its market value exposure relative to its net assets and can substantially increase the volatility of the Fund’s performance.
Additional associated risks from investing in derivatives also exist and potentially could have significant effects on the valuation of the derivatives held by a Fund. Typically, a Fund may attempt to increase or decrease exposure to the risks associated with the securities or other traditional investments in which it invests. The risks associated with a Fund’s use of derivative instruments, including but not limited to volatility risk, correlation risk, segregation risk, and hedging risks, are additional risks that a Fund does not typically seek to increase or decrease exposure to. Examples of these associated risks are liquidity risk, which is the risk that a Fund will not be able to sell the derivative in the open market in a timely manner, and counterparty credit risk, which is the risk that the counterparty will not fulfill its obligation to the Fund.
Option Writing/Purchasing
A Fund may write or purchase option contracts to adjust risk and return of its overall investment positions, subject to any restrictions set forth in the Fund’s prospectus. When a Fund writes or purchases an option, an amount equal to the premium received or paid by the Fund is recorded as a liability or an asset and is subsequently adjusted to the current market value of the option written or purchased. Premiums received or paid from writing or purchasing options that expire unexercised are treated by a Fund on the expiration date as realized gains or losses. The difference between the premium and the amount paid or received on affecting a closing purchase or sale transaction, including brokerage commissions, is also treated as a realized gain or loss. If an option is exercised, the premium paid or received is netted to the cost of the purchase or proceeds from the sale in determining whether a Fund has realized a gain or loss on investment transactions. Risks from entering into option transactions arise from, among other things, the potential inability of counterparties to meet the terms.
Futures
A Fund may use futures subject to any restrictions set forth in the Fund’s prospectus. A Fund may also be exposed to exchange-traded futures that are fully collateralized by cash or securities, for temporary cash management or investment transition purposes, or to hedge the risks of existing positions. To the extent that the Fund uses derivatives for temporary cash management, investment transition purposes, managing duration or to hedge the risks of existing positions, the Fund will be subject to the risks associated with such transactions. During the year ended September 30, 2020, the Funds did not invest in futures contracts.
| Risk Exposure | | Derivatives Statements of Assets and Liabilities Location | | Fair Value | |
| Centre American Select Equity Fund | | | | | | |
Equity Contracts
(Purchased Options) | | Investments, at value | | $ | 769,575 | |
| | | | | $ | 769,575 | |
The effect of derivative instruments on the Statements of Operations for the year ended September 30, 2020 (Net realized gain/(loss) on purchased options contracts are included in Net realized gain/(loss) on investments within the Statements of Operations):
| Derivatives | | Location of Gains/(Loss) On Derivatives Recognized In Income | | Realized Gain/(Loss) on Derivatives Recognized in Income | | | Change in Unrealized Gain/(Loss) on Derivatives Recognized in Income | |
| Centre American Select Equity Fund | | | | | | | | | | |
Equity Contracts
(Purchased Options) | | Net realized gain/(loss) on investments/Net change in unrealized appreciation/(depreciation) on investments | | $ | 2,519,972 | | | $ | (1,513,316 | ) |
| | | | | $ | 2,519,972 | | | $ | (1,513,316 | ) |
| Annual Report | September 30, 2020 | 29 |
| Centre Funds | Notes to Financial Statements |
September 30, 2020
Volume of Derivative Instruments for the Funds during the year ended September 30, 2020, was as follows:
| Derivative Type | | Unit of Measurement | | | Monthly Average | |
| Centre American Select Equity Fund | | | | | | | | |
| Purchased Option Contracts | | Notional value of contracts outstanding | | | $ | 73,412,080 | |
During the ordinary course of business, the Funds may enter into transactions subject to enforceable netting agreements or other similar arrangements (“netting agreements”). Generally, the right to offset in netting agreements allows the Funds to offset any exposure to a specific counterparty with any collateral received or delivered to that counterparty based on the terms of the agreement. Generally, the Funds manage their cash collateral and securities collateral on a counterparty basis.
4. BENEFICIAL INTEREST TRANSACTIONS
On September 30, 2020, there was an unlimited number of shares of beneficial interest authorized for each Fund. Transactions in shares of beneficial interest are shown in the Statements of Changes in Net Assets.
Shares of American Select Equity Fund and Infrastructure Fund that are redeemed within 90 days of purchase may incur a 2% redemption fee deducted from the redemption amount. For the year ended September 30, 2020, redemption fees retained by these Funds are disclosed in the Statements of Changes in Net Assets.
Beneficial Ownership: The beneficial ownership, either directly or indirectly, of more than 25% of the voting securities of a Fund creates a presumption of control of the Fund under Section 2(a)(9) of the 1940 Act. As of September 30, 2020, the following entities owned beneficially more than 25% of each Fund’s outstanding shares. The shares may be held under omnibus accounts (whereby the transactions of two or more shareholders are combined and carried in the name of the originating broker rather than designated separately). Any transaction by these investors could have a material impact on the share class.
| Centre American Select Equity Fund | Percentage |
| Charles Schwab & Co. Inc | 42.90% |
5. INVESTMENT ADVISORY AGREEMENTS AND RELATED-PARTY TRANSACTIONS
The Adviser serves as the investment adviser to each Fund pursuant to an Investment Advisory Agreement with the Trust on behalf of the Fund.
As compensation for the investment advisory services provided to the Funds, the Adviser is entitled to receive monthly compensation, subject to waivers, based on each Fund’s average daily net assets at the annual rate of:
| Fund | Management Fee Rate |
| Centre American Select Equity Fund (total net assets less than or equal to $1 billion) | 0.75% |
| Centre American Select Equity Fund (total net assets over $1 billion) | 0.70% |
| Centre Global Infrastructure Fund | 0.85%* |
| * | Management fee rate effective August 21, 2020. Prior to August 21, 2020, the management fee rate was 0.90%. |
American Select Equity Fund
For the American Select Equity Fund, the Adviser has agreed to reduce its advisory fees and/or reimburse other expenses of the Fund through at least October 31, 2021 to the extent necessary to limit the current operating expenses of the Fund including, as applicable, investment advisory fees, but excluding, as applicable, any taxes, leverage interest, distribution/service (Rule 12b-1) fees, shareholder services fees, brokerage commissions, acquired fund fees and expenses, expenses incurred in connection with any merger or reorganization, and extraordinary expenses (such as litigation and other expenses not incurred in the ordinary course of the Fund’s business) to an annual rate of 1.10% of the average daily net assets of the Investor Class shares and 0.90% of the average daily net assets of the Institutional Class shares (the “Expense Limitation Agreement”). The Expense Limitation Agreement may be terminated at any time by the Board of Trustees of the Trust (the “Board”) upon 60 days’ written notice to the Adviser, but may not be terminated by the Adviser without the consent of the Board. No recoupment will be made more than three years after the date that the applicable amount was initially waived or reimbursed by the Adviser, and the recoupment may not cause the Fund to exceed the then-existing expense limitation for that class at the time such waiver or reimbursement was made.
| Centre Funds | Notes to Financial Statements |
September 30, 2020
Infrastructure Fund
Effective July 21, 2020, the Adviser further contractually agreed to limit its advisory fees and/or reimburse other expenses of the Fund through January 29, 2021, to the extent necessary to limit total net operating expenses of the Fund, including (but not limited to) investment advisory fees of the Adviser, distribution/service (Rule 12b-1) fees, and shareholder services fees, but excluding, as applicable, any taxes, leverage interest, brokerage commissions, acquired fund fees and expenses, expenses incurred in connection with any merger or reorganization, and extraordinary expenses (such as litigation and other expenses not incurred in the ordinary course of the Fund’s business) to an annual rate of 1.05% of the average daily net assets of the Investor Class shares and 1.10% of the average daily net assets of the Institutional Class shares. Each expense limitation agreement may be terminated at any time by the Board, upon 60 days’ written notice to the Adviser, but may not be terminated by the Adviser without the consent of the Board. No recoupment will be made more than three years after the date that the applicable amount was initially waived or reimbursed by the Adviser, and the recoupment may not cause the Fund to exceed the then-existing expense limitation for that class at the time such reimbursement or waiver was made. Any recoupment provision is limited to the lesser of (A) the expense limitation in effect at the time of the waiver; and (B) the expense limitation in effect at the time of recoupment.
During the year ended September 30, 2020, the fee waivers and/or reimbursements were as follows:
| Fund | | Fees Waived and/or Reimbursed by Adviser | |
| Centre American Select Equity Fund | | | | |
| Investor | | $ | 98,153 | |
| Institutional | | | 12,046 | |
| Centre Global Infrastructure Fund | | | | |
| Investor | | | 147,882 | |
| Institutional | | | 77,189 | |
As of September 30, 2020, the balances of recoupable expenses for each Fund were as follows:
| Fund | | Expires 2021 | | | Expires 2022 | | | Expires 2023 | | | Total | |
| Centre American Select Equity Fund | | | | | | | | | | | | | | | | |
| Investor Class | | $ | 357,720 | | | $ | 154,465 | | | $ | 98,153 | | | $ | 610,338 | |
| Institutional Class | | | 8,130 | | | | 10,516 | | | | 12,046 | | | | 30,692 | |
| Centre Global Infrastructure Fund | | | | | | | | | | | | | | | | |
| Investor Class | | $ | 16,342 | | | $ | 155,997 | | | $ | 147,882 | | | $ | 320,221 | |
| Institutional Class | | | 92,541 | | | | 33,985 | | | | 77,189 | | | | 203,715 | |
ALPS Fund Services, Inc. (“ALPS” or the “Administrator”) serves as administrator to the Funds. ALPS receives a monthly fee paid by the Funds subject to a minimum monthly fee and is reimbursed for certain out-of-pocket expenses. Pursuant to an administrative agreement with the Trust, ALPS provides operational services to the Funds including, but not limited to fund accounting and fund administration services and general assistance in each Fund’s operations.
ALPS, pursuant to a transfer agency and services agreement with the Trust, serves as transfer agent for the Funds. Under the transfer agency and services agreement, ALPS receives an annual minimum fee per Fund and a fee based upon each shareholder account and its account activity and is reimbursed for certain out-of-pocket expenses.
ALPS, pursuant to a chief compliance officer services agreement with the Trust, provides chief compliance officer services to the Funds. Additionally, ALPS provides services in monitoring and testing the policies and procedures of the Trust in conjunction with requirements under Rule 38a-1 under the 1940 Act. ALPS receives an annual fee for these services and is reimbursed for certain out-of-pocket expenses, pursuant to the chief compliance officer services agreement.
The Trust has adopted a plan pursuant to Rule 12b-1 under the 1940 Act (the “Plan”). The Plan permits the Trust, on behalf of Investor Class shares of the Funds, to pay up to 0.25% per year to one or more entities for services rendered and expenses borne in connection with providing shareholder or distribution services with respect to the Investor class shares of each Fund.
The Trust has also adopted a shareholder services plan for certain non-distribution shareholder services provided by financial intermediaries. With respect to each Fund, the shareholder services plan authorizes annual payment of up to 0.15% of the average daily net assets attributable to Investor Class shares of the Fund, and up to 0.10% of the average daily net assets attributable to Institutional Class shares of the Fund.
ALPS Distributors, Inc. (the “Distributor”) acts as the principal underwriter of the Funds pursuant to a distribution agreement with the Trust. No payments were retained by the Distributor by the Funds during the year ended September 30, 2020.
| Annual Report | September 30, 2020 | 31 |
| Centre Funds | Notes to Financial Statements |
September 30, 2020
Officers of the Trust and Trustees who are “interested persons” of the Trust or the Adviser receive no salary or fees from the Trust. Each Trustee who is not an “interested person” receives an annual retainer of $20,000 paid quarterly. The Trust reimburses each Trustee and Officer for his or her travel and other expenses relating to attendance at Board meetings.
One Trustee is an officer of the Trust, and serves as Managing Director and Chief Investment Officer of the Adviser.
6. FEDERAL INCOME TAX AND TAX BASIS INFORMATION
As of and during the year ended September 30, 2020, no Fund had a liability for any unrecognized tax benefits. The Funds file U.S. Federal, state, and local tax returns as required. The Funds’ tax returns are subject to examination by the relevant tax authorities until expiration of the applicable statute of limitations, which is generally three years after the filing of the tax return but which can be extended to six years in certain circumstances. Tax returns for open years have incorporated no uncertain tax positions that require a provision for income taxes.
Components of Distributable Earnings on a Tax Basis: At September 30, 2020, permanent differences in book and tax accounting were reclassified. These differences had no effect on net assets and were primarily attributed to non-deductible expenses.
| Fund | | Paid-in Capital | | | Total Distributable Earnings | |
| Centre Global Infrastructure Fund | | $ | (519 | ) | | $ | 519 | |
As of September 30, 2020, the components of distributable earnings on a tax basis were as follows:
| Fund | | Accumulated Capital Gain/(Loss) | | | Ordinary Income Undistributed | | | Net Unrealized Appreciation/(Depreciation) | | | Other Cumulative Effect of Timing Differences | | | Total Accumulated Earnings/(Deficit) | |
| Centre American Select Equity Fund | | $ | 5,585,337 | | | $ | 934,662 | | | $ | 44,198,755 | | | $ | (3,164,508 | ) | | $ | 47,554,246 | |
| Centre Global Infrastructure Fund | | | (28,317,947 | ) | | | – | | | | (2,119,830 | ) | | | (2,457 | ) | | | (30,440,234 | ) |
Under current law, capital losses maintain their character as short-term or long-term and are carried forward to the next tax year without expiration. As of the current fiscal year end, the following amounts are available as carry forwards to the next tax year:
| Fund | | Short-Term | | | Long-Term | |
| Centre Global Infrastructure Fund | | $ | 12,146,245 | | | $ | 16,171,702 | |
Elective Deferrals: Capital Losses arising in the post-October period of the current fiscal year may be deferred to the next fiscal year if the fund elects to defer the recognition of these losses. When this election is made, any losses recognized during the period are treated as having occurred on the first day of the next fiscal year separate from and in addition to the application of normal capital loss carry forwards as described above.
The Funds elect to defer to the period ending September 30, 2021, capital losses recognized during the period November 1, 2019 - September 30, 2020 in the amount of:
| Fund | | Amount | |
| Centre American Select Equity Fund | | $ | 3,162,014 | |
The Funds elect to defer to the period ending September 30, 2021, late year ordinary losses in the amount of:
| Fund | | Amount | |
| Centre Global Infrastructure Fund | | $ | 2,457 | |
Distributions to Shareholders: The Centre American Select Equity Fund normally pays dividends and net investment income, if any, on an annual basis and the Centre Global Infrastructure Fund, intends to make monthly income distributions. Each Fund normally distributes capital gains, if any, on an annual basis. Income dividend distributions are derived from interest and other income each Fund receives from its investments, including distributions of short term capital gains. Capital gain distributions are derived from gains realized when each Fund sells a security it has owned for more than one year. Each Fund may make additional distributions and dividends at other times if the Adviser believes doing so may be necessary for each Fund to avoid or reduce taxes. Net investment income/(loss) and net realized gain/(loss) may differ for financial statement and tax purposes. The amounts and characteristics of tax basis distributable earnings/(accumulated losses) are finalized at fiscal year-end.
| Centre Funds | Notes to Financial Statements |
September 30, 2020
The tax character of distributions paid for the fiscal year ended September 30, 2020 were as follows:
| Distributions Paid From: | | Ordinary Income | | | Long-Term Capital Gains | |
| Centre American Select Equity Fund | | $ | 563,328 | | | $ | 9,341,286 | |
| Centre Global Infrastructure Fund | | | 1,000,402 | | | | – | |
The tax character of distributions paid for the fiscal year ended September 30, 2019 were as follows:
| Distributions Paid From: | | Ordinary Income | | | Long-Term Capital Gains | |
| Centre American Select Equity Fund | | $ | 243,623 | | | $ | 20,045,940 | |
| Centre Global Infrastructure Fund | | | 484,644 | | | | – | |
Unrealized Appreciation and Depreciation on Investments: The amount of net unrealized appreciation/(depreciation) and the cost of investment securities for tax purposes, including short-term securities at September 30, 2020 are displayed in the table below. The difference between book and tax basis unrealized appreciation/(depreciation) for the Funds is primarily attributable to wash sales and certain other investments.
| | | Tax Cost of Investments | | | Gross Unrealized Appreciation | | | Gross Unrealized Depreciation | | | Net Depreciation of Foreign Currency | | | Net Tax Unrealized Appreciation/(Depreciation) on Investments | |
| Centre American Select Equity Fund | | $ | 118,844,633 | | | $ | 50,064,804 | | | $ | (5,866,049 | ) | | $ | – | | | $ | 44,198,755 | |
| Centre Global Infrastructure Fund | | | 43,655,474 | | | | 3,062,504 | | | | (5,182,005 | ) | | | (329 | ) | | | (2,119,830 | ) |
7. PURCHASES AND SALES OF INVESTMENT SECURITIES
For the year ended September 30, 2020, the aggregate cost of purchases and proceeds from sales of investment securities (excluding any U.S. Government Obligations, short-term securities, and purchased options and futures) were as follows:
| Fund | | Purchases of Securities | | | Proceeds From Sales of Securities | |
| Centre American Select Equity Fund | | $ | 142,183,102 | | | $ | 107,684,066 | |
| Centre Global Infrastructure Fund | | | 28,337,629 | | | | 31,466,351 | |
8. INDEMNIFICATIONS
Under the Trust’s organizational documents, its officers and Trustees are indemnified against certain liabilities relating to their duties to the Trust. Additionally, in the ordinary course of business, the Trust enters into contracts with service providers that may contain general indemnification clauses. The Trust’s maximum exposure under these arrangements is unknown, as this would involve future claims that may be made against the Trust that have not yet occurred.
9. FUND REORGANIZATIONS
At a special meeting of shareholders held on June 27, 2019, the shareholders of SkyBridge Dividend Value Fund (the “Dividend Value Fund”), a series of FundVantage Trust, a Delaware statutory trust, approved the reorganization, pursuant to an Agreement and Plan of Reorganization (the “Plan”), of the Dividend Value Fund into the Infrastructure Fund. The Board of Trustees of the Trust (the “Board”) had previously approved the Plan providing for the reorganization.
Following the completion of the reorganization on July 19, 2019, and pursuant to the terms of the Plan, Class A and Class C shareholders of the Dividend Value Fund became Investor Class shareholders of the Infrastructure Fund, and Class I shareholders of the Dividend Value Fund became Institutional Class shareholders of the Infrastructure Fund. The reorganization qualified as a tax-free “reorganization” under the Internal Revenue Code of 1986, as amended (the “Code”) for U.S. federal income tax purposes. The reorganization was accomplished by an exchange of 1,546,099 shares of the Dividend Value Fund’s Class A, valued at $12,150,948, for 1,204,042 shares of the Infrastructure Fund’s Investor Class, 1,948,500 shares of the Dividend Value Fund’s Class C, valued at $15,102,238, for 1,496,486 shares of the Infrastructure Fund’s Investor Class and 3,702,732 shares of the Dividend Value Fund’s Class I, valued at $29,073,849, for 2,875,211 shares of the Infrastructure Fund’s Institutional Class.
| Annual Report | September 30, 2020 | 33 |
| Centre Funds | Notes to Financial Statements |
September 30, 2020
| Acquiring Fund | | | Shares Outstanding of Acquiring Fund | | | Net Assets of Acquiring Fund | | | Acquired Fund | | | Acquired Fund Shares Exchanged | | | Net Assets of Acquired Fund Exchanged | |
| Infrastructure Fund | | | | 1,201,899 | | | $ | 12,130,749 | | | | Dividend Value Fund | | | | 7,197,331 | | | | 56,327,035 | |
The investment portfolio fair value and unrealized appreciation for the Dividend Value Fund immediately prior to the reorganization were as follows:
| Acquired Fund | | | Portfolio Market Value | | | Unrealized Appreciation | |
| Dividend Value Fund | | | $ | 57,041,528 | | | $ | 1,529,861 | |
Immediately following the reorganization the net assets of the combined Fund was as follows:
| | | | Combined Net Assets | |
| Infrastructure Fund | | | $ | 68,457,784 | |
There was $23,971,840 of unused capital loss carryforward of the Dividend Value Fund, that is not subject to tax limitations, for potential utilization as of the closing date of the reorganization, July 19, 2019.
Assuming the reorganization had been completed on October 1, 2018, the Infrastructure Fund’s pro forma results of operations for the year ended September 30, 2019 would be as follows:
| | | | Net Investment Income | | | Net Realized and Unrealized Gain/(Loss) on Investments | | | Net Increase/(Decrease) in Net Assets Resulting from Operations | |
| Infrastructure Fund | | | $ | 3,519,579 | | | $ | (18,604,646 | ) | | $ | (15,085,067 | ) |
Because of the investment portfolios that were combined through the reorganization have been managed as a single integrated portfolio since the closing of the reorganization, it is not practicable to separate the amounts of revenue and earnings of the Dividend Value Fund that have been included in the Infrastructure Fund’s Statement of Operations since July 19, 2019.
At a special meeting of shareholders held on August 20, 2020, the shareholders of Centre Active U.S. Treasury Fund (the “Treasury Fund”), a former series of the Trust, approved the reorganization, pursuant to an Agreement and Plan of Reorganization (the “Plan”), of the Treasury Fund into the Infrastructure Fund. The Board of Trustees of the Trust had previously approved the Plan providing for the reorganization.
Following the completion of the reorganization on August 21, 2020, and pursuant to the terms of the Plan, Investor Class and Institutional Class shareholders of the Treasury Fund became shareholders of the Infrastructure Fund and received Investor Class and Institutional Class shares, respectively, of the Infrastructure Fund. The reorganization did not qualify as a tax-free “reorganization” under the Internal Revenue Code of 1986, as amended (the “Code”) for U.S. federal income tax purposes. The reorganization was accomplished by an exchange of 128,686 shares of the Treasury Fund’s Investor Class, valued at $1,177,292, for 127,537 shares of the Infrastructure Fund’s Investor Class, and 2,124,296 shares of the Treasury Fund’s Institutional Class, valued at $19,301,378, for 2,092,823 shares of the Infrastructure Fund’s Institutional Class.
| Acquiring Fund | | | Shares Outstanding of Acquiring Fund | | | Net Assets of Acquiring Fund | | | Acquired Fund | | | Acquired Fund Shares Exchanged | | | Net Assets of Acquired Fund Exchanged | |
| Infrastructure Fund | | | | 2,667,214 | | | $ | 24,603,879 | | | Treasury Fund | | | | 2,252,982 | | | $ | 20,478,670 | |
The investment portfolio fair value and unrealized depreciation for the Treasury Fund immediately prior to the reorganization were as follows:
| Acquired Fund | | | Portfolio Market Value | | | Unrealized Depreciation* | |
| Treasury Fund | | | $ | 20,506,079 | | | $ | 0 | |
| * | Realized upon completion of the reorganization as it was not tax-free |
Immediately following the reorganization the net assets of the combined Fund was as follows:
| | | | Combined Net Assets | |
| Infrastructure Fund | | | $ | 45,082,549 | |
| Centre Funds | Notes to Financial Statements |
September 30, 2020
There were no unused capital loss carryforwards of the Treasury Fund, subject to tax limitations, for potential utilization as of the closing date of the reorganization, August 21, 2020.
Assuming the reorganization had been completed on October 1, 2019, the inception date of the Infrastructure Fund, the Infrastructure Fund’s pro forma results of operations for the year ended September 30, 2020 would be as follows:
| | | | Net Investment Income | | | Net Realized and Unrealized Gain/(Loss) on Investments | | | Net Increase/(Decrease) in Net Assets Resulting from Operations | |
| Infrastructure Fund | | | $ | 591,863 | | | $ | (9,170,409 | ) | | $ | (8,578,546 | ) |
Because of the investment portfolios that were combined through the reorganization have been managed as a single integrated portfolio since the closing of the reorganization, it is not practicable to separate the amounts of revenue and earnings of the Treasury Fund that have been included in the Infrastructure Fund’s Statement of Operations since August 21, 2020.
10. SUBSEQUENT EVENTS
The Funds have evaluated the need for disclosures and/or adjustments resulting from subsequent events through the date the financial statements were issued. Based on this evaluation, no adjustments were required to the financial statements as of September 30, 2020.
| Annual Report | September 30, 2020 | 35 |
| Centre Funds | Report of Independent Registered Public Accounting Firm |
To the Shareholders and Board of Trustees of
Centre Funds
Opinion on the Financial Statements
We have audited the accompanying statements of assets and liabilities, including the schedules of investments, of Centre Funds comprising Centre American Select Equity Fund and Centre Global Infrastructure Fund (the “Funds”) as of September 30, 2020, the related statements of operations for the year then ended, the statements of changes in net assets for each of the two years in the period then ended, including the related notes, and the financial highlights for each of the five years in the period then ended for the Centre American Select Equity Fund and the three periods in the period then ended for the Centre Global Infrastructure Fund (collectively referred to as the “financial statements”). In our opinion, the financial statements present fairly, in all material respects, the financial position of each of the Funds as of September 30, 2020, the results of their operations for the year then ended, the changes in their net assets for each of the two years in the period then ended, and the financial highlights for each of the periods indicated above, in conformity with accounting principles generally accepted in the United States of America.
Basis for Opinion
These financial statements are the responsibility of the Funds’ management. Our responsibility is to express an opinion on the Funds’ financial statements based on our audits. We are a public accounting firm registered with the Public Company Accounting Oversight Board (United States) (“PCAOB”) and are required to be independent with respect to the Funds in accordance with the U.S. federal securities laws and the applicable rules and regulations of the Securities and Exchange Commission and the PCAOB.
We conducted our audits in accordance with the standards of the PCAOB. Those standards require that we plan and perform the audit to obtain reasonable assurance about whether the financial statements are free of material misstatement whether due to error or fraud.
Our audits included performing procedures to assess the risks of material misstatement of the financial statements, whether due to error or fraud, and performing procedures that respond to those risks. Such procedures included examining, on a test basis, evidence regarding the amounts and disclosures in the financial statements. Our procedures included confirmation of securities owned as of September 30, 2020, by correspondence with the custodian and brokers. Our audits also included evaluating the accounting principles used and significant estimates made by management, as well as evaluating the overall presentation of the financial statements. We believe that our audits provide a reasonable basis for our opinion.
We have served as the Funds’ auditor since 2015.

COHEN & COMPANY, LTD.
Cleveland, Ohio
November 25, 2020
| Centre Funds | Additional Information |
| | September 30, 2020 (Unaudited) |
PROXY VOTING GUIDELINES AND RECORDS
A description of the policies and procedures that the Funds use to determine how to vote proxies relating to portfolio securities and information regarding how the Funds voted proxies during the most recent 12-month period ended June 30, is available without charge, upon request, by (1) calling the Funds at 1-855-298-4236 and (2) on the U.S. Securities and Exchange Commission’s (“SEC”) website at http://www.sec.gov.
PORTFOLIO HOLDINGS DISCLOSURE POLICY
The Trust files, with regard to each Fund, with the SEC a complete schedule of investments for the first and third quarters of each fiscal year as an exhibit to its reports on Form N-PORT. The Funds’ first and third fiscal quarters end on December 31 and June 30. Form N-PORT reports are available on the SEC’s website at http://www.sec.gov. You may also obtain copies by calling the Funds at 1-855-298-4236.
TAX DESIGNATIONS
Qualified Dividend Income
The percentage of ordinary income dividends distributed during the calendar year ended December 31, 2019 are designated as qualified dividend income (QDI) as defined in Section 1(h)(11) of the Internal Revenue Code in the following percentages:
| | Amount |
| Centre American Select Equity Fund | 100.00% |
| Centre Global Infrastructure Fund | 100.00% |
Dividends Received Deduction
For corporate shareholders, the following ordinary dividends paid during the calendar year ended December 31, 2019 qualify for the corporate dividends received deduction:
| | Amount |
| Centre American Select Equity Fund | 100.00% |
| Centre Global Infrastructure Fund | 60.46% |
Pursuant to Section 852(b)(3) of the Internal Revenue Code, the following amounts were designated as long-term capital gain dividends:
| | | Amount |
| Centre American Select Equity Fund | | $ | 9,341,286 | |
SHAREHOLDER PROXY RESULTS
At a special meeting of shareholders held on June 27, 2019, the shareholders of SkyBridge Dividend Value Fund (the “Dividend Value Fund”), a series of FundVantage Trust, a Delaware statutory trust, approved the reorganization, pursuant to an Agreement and Plan of Reorganization (the “Plan”), of the Dividend Value Fund into the Infrastructure Fund. The Board of Trustees of the Trust (the “Board”) had previously approved the Plan providing for the reorganization.
The following are the shareholder proxy voting results for the reorganization:
Proposal 1: To approve the Agreement and Plan of Reorganization
| FOR | % Voted FOR | % FOR of O/S | AGAINST | % Voted
AGAINST | % AGAINST
of O/S | ABSTAIN | % Voted
ABSTAIN | % ABSTAIN
of O/S |
| 4,126,631 | 92.43% | 38.83% | 75,090 | 1.68% | 0.71% | 262,788 | 5.89% | 2.47% |
Proposal 2: If necessary, a proposal to adjourn the Meeting
| FOR | % Voted FOR | % FOR of O/S | AGAINST | % Voted
AGAINST | % AGAINST
of O/S | ABSTAIN | % Voted
ABSTAIN | % ABSTAIN
of O/S |
| 4,117,213 | 92.22% | 38.74% | 83,764 | 1.88% | 0.79% | 263,532 | 5.90% | 2.48% |
| Annual Report | September 30, 2020 | 37 |
| Centre Funds | Additional Information |
| | September 30, 2020 (Unaudited) |
At a special meeting of shareholders held on August 20, 2020, the shareholders of Centre Active U.S. Treasury Fund (the “Treasury Fund”), a former series of the Trust, approved the reorganization, pursuant to an Agreement and Plan of Reorganization (the “Plan”), of the Treasury Fund into the Infrastructure Fund. The Board of Trustees of the Trust had previously approved the Plan providing for the reorganization.
The following are the shareholder proxy voting results for the reorganization:
Proposal 1: To approve the Agreement and Plan of Reorganization
| FOR | % Voted FOR | % FOR of O/S | AGAINST | % Voted
AGAINST | % AGAINST
of O/S | ABSTAIN | % Voted
ABSTAIN | % ABSTAIN
of O/S |
| 924,837 | 69.69% | 36.01% | 148,548 | 11.23% | 5.78% | 249,014 | 18.83% | 9.70% |
Proposal 2: If necessary, a proposal to adjourn the Meeting
| FOR | % Voted FOR | % FOR of O/S | AGAINST | % Voted
AGAINST | % AGAINST
of O/S | ABSTAIN | % Voted
ABSTAIN | % ABSTAIN
of O/S |
| 930,516 | 70.37% | 36.23% | 147 | 11.14% | 5.74% | 244,530 | 18.49% | 9.52% |
APPROVAL OF INVESTMENT ADVISORY AGREEMENTS
At a telephonic meeting held on September 11, 2020 in accordance with U.S. Securities and Exchange Commission Release No. 33897, the Board of Trustees (the “Board” or the “Trustees”) of Centre Funds (the “Trust”), including a majority of the Trustees who are not parties to any of the Advisory Agreements (defined below) or interested persons of any such party (the “Disinterested Trustees”), considered an unanimously approved the renewal of the Investment Advisory Agreement between Centre Asset Management, LLC (“Centre” or the “Adviser”) and the Trust, on behalf of the Centre American Select Equity Fund (the “Equity Fund”) and the Investment Advisory Agreement between the Adviser and the Trust, on behalf of the Centre Global Infrastructure Fund (the “Infrastructure Fund”). In considering whether to approve the renewal of each Investment Advisory Agreement (together, the “Advisory Agreements”), the Trustees considered the factors discussed below, and information made available to them in connection with the meeting relating to such factors (the “Meeting Materials”), including information provided by the Adviser in response to questions from the Trustees, and any other information the Trustees deemed relevant. The Trustees’ approval of the renewal of the Advisory Agreements was not based on any single factor, but on a consideration of the totality of factors and information they reviewed and evaluated.
Nature, Extent, and Quality of Services
The Trustees reviewed and discussed information concerning the nature, extent, and quality of advisory services provided by the Adviser to the Equity Fund and the Infrastructure Fund (together, the “Funds”) pursuant to the Advisory Agreements, including information concerning the investment style and approach of the Adviser and the Adviser’s performance record. The Trustees considered the investment personnel responsible for the day-to-day management of each Fund’s portfolio and such personnel’s experience managing such Fund and investment vehicles employing investment strategies similar to those employed by the Fund. The Trustees also considered information describing the Adviser’s compliance policies and procedures and the Adviser’s compliance resources. They noted their satisfaction with the Trustee’s access to senior management of the Adviser. They considered the Adviser’s efforts to grow the Funds. They discussed the Adviser’s commitment to the Funds and the resources dedicated to servicing the Funds. The Trustees concluded that the nature, extent, and quality of services provided by the Adviser as the investment adviser to the Funds were appropriate and sufficient to support approval of the renewal of the Advisory Agreements.
Performance
The Trustees considered information regarding the Funds’ performance, including information comparing each Fund’s performance to the performance of its benchmark, Adviser selected peer group, Morningstar category, and other accounts for various time periods as of June 30, 2020. The Trustees noted that the Infrastructure Fund only had one year and since inception performance as of June 30, 2020. The Trustees also considered the respective investment strategy of each Fund, noting the Adviser’s representation that the Funds were managed to perform their investment objectives over a long-term investment cycle. Based on the foregoing, the Board determined that the performance of each Fund was acceptable.
Profitability
The Trustees considered information regarding the income earned, after fee waivers, by the Adviser from the advisory fees. The Trustees also considered other benefits to Centre as a result of its relationship with the Funds, including soft dollars. The Trustees also noted that there was a breakpoint applicable to the advisory fees of the Equity Fund for assets in excess of $1 billion. The Trustees concluded that Centre��s profitability from each Fund was not unreasonable and would not prevent it from approving the renewal of the Advisory Agreements.
| Centre Funds | Additional Information |
September 30, 2020 (Unaudited)
Economies of Scale
The Trustees considered information concerning potential economies of scale for each Fund, noting that the Equity Fund (through October 31, 2020) and Infrastructure Fund (through January 29, 2021) each benefit from an expense limitation agreement covering most operating expenses, including the advisory fees charged to the Fund, but excluding expenses such as fees payable by the Funds pursuant to the Trust’s Rule 12b-1 Plan and Shareholder Services Plan. The Trustees considered current asset levels and expectations for growth, and concluded that it was unlikely that the Adviser had achieved material economies of scale in managing the Funds and the Board would reevaluate the issue of economies of scale at the next renewal.
Comparisons of the Advisory Fees and Select Expense Ratios
The Trustees reviewed and discussed the advisory fees payable to the Adviser under each Advisory Agreement for the services it provided thereunder and the net expense ratios of the Investor Class shares of each Fund. The Trustees noted that the expense ratios of the Investor Class shares were higher than those of the Institutional Class shares. The Trustees reviewed, with respect to each Fund, a comparison of the Fund’s advisory fee rate to the applicable Morningstar category median advisory fee rate and the net expense ratio of the Fund’s Investor Class shares compared to the applicable Morningstar category average expense ratio of similarly-situated funds determined by Morningstar based on targeted benchmark, investment style, and average investment size. The Trustees discussed the advisory fees and expense information included in the Board materials with respect to each Fund, and considered whether the advisory fees were reasonable in light of the services provided by the Adviser to the Fund. They noted that the fee paid by the Infrastructure Fund was slightly below the average fees of the peer group, while the fees paid by the Equity Fund were higher than the peer group average, but well within the range of those comparable fees. A representative of the Adviser described fees paid to the Adviser for sub-advisory services provided to funds with similar strategies as the Equity Fund and Infrastructure Fund. The Trustees considered those fees, noting that the services provided to the Funds were greater than those in a sub-advisory relationship, and the Adviser assumes additional regulatory, business, and operational risks when acting as an adviser to registered investment companies.
After reviewing all of the information presented to them, the Trustees concluded that the advisory fees payable to the Adviser by the Funds under the Advisory Agreements were not unreasonable in light of the services provided.
Conclusion
The Trustees, including a majority of the Disinterested Trustees, concluded, based on their consideration of the foregoing and their evaluation of all of the information reviewed by the Trustees, that renewal of the Advisory Agreements was in the best interest of the Funds and their shareholders.
| Annual Report | September 30, 2020 | 39 |
| Centre Funds | Trustees and Officers |
September 30, 2020 (Unaudited)
The following tables provide certain information regarding the Trustees and Officers of Centre Funds as of September 30, 2020 of each of the persons currently serving as a Trustee or Officer of the Trust. The business address of each Trustee or Officer is c/o Centre Funds, 1290 Broadway, Suite 1000, Denver, Colorado 80203. Additional information about members of the Board of Trustees and Officers of the Trust is available in the Statement of Additional Information, which is available, without charge, upon request, by calling the Funds (toll-free) at 1-855-298-4236.
INDEPENDENT TRUSTEES1
Name,
Year of Birth | Position(s)
Held with
Funds or Trust | Length of
Time Served | Principal Occupation(s) During Past 5 Years | Number of
Portfolios in
Fund
Complex
Overseen by
Trustee | Other
Directorships
Held by
Trustee During
Past 5 Years2 |
Dr. James L.
Grant
1949 | Trustee, Chairman | Since 6/2011 | Dr. James L. Grant is Senior Associate Dean, College of Management, University of Massachusetts Boston, and Associate Professor of Accounting and Finance at University of Massachusetts Boston. Dr. Grant has served as an advisory analyst at major Wall Street firms including Credit Suisse Asset Management and GAM. Dr. Grant holds a Ph.D. in Business from the University of Chicago’s Booth School of Business and he has been a featured speaker at industry conferences on value-based metrics. Dr. Grant has served on the editorial advisory board of The Journal of Portfolio Management and currently The Journal of Investing. Dr. Grant has published several articles in finance and investment journals and he has contributed chapters to investment books. Dr. Grant is the author of Foundations of Economic Value Added (Second Edition), the co-author of Focus on Value: A Corporate and Investor Guide to Wealth Creation, and co-author and co-editor respectively of Equity Portfolio Management and Value-Based Metrics: Foundations and Practice. | 2 | None |
Dr. Aloke Ghosh
1963 | Trustee | Since 6/2011 | Professor of Accounting at the Turner School of Accountancy, Belk College of Business, University of North Carolina at Charlotte. Between 2016 and 2017, Dr. Ghosh was on a Fulbright Distinguished Chair assignment, which was a joint US State Department and Fulbright Finland appointment, to Aalto University in Helsinki (Finland). In the past, served as the Accounting Academic Fellow at the U.S. Securities and Exchange Commission and as a Visiting Professor at Aalto University (Finland), Bocconi University (Italy), Monash University (Australia), Columbia University, Emory University, NJIT, Hanken School of Economics (Finland), Tulane University, Victoria University of Wellington (New Zealand), and Yonsei University (South Korea). Serves as an adviser to several leading hedge funds in the U.S. and around the world on accounting matters including serving as a Council Member at Gerson Lehrman Group. Dr. Ghosh holds a Ph.D. in Business and Economics from Tulane University, New Orleans. Dr. Ghosh regularly features as an invited speaker in different industry and academic conferences. | 2 | None |
Joseph M.
Marinaro
1958 | Trustee | Since 6/2012 | Founder, Managing Member of JMM Capital & Consulting LLC, 2014 to present. Public Director, The Small Exchange, June 2019 – present. Independent contractor to Sionic (consulting services), 2018 – present. Advisor and independent contractor to Linium SOS – now Eventum Enterprise Solutions (consulting services), 2014 – 2017. | 2 | None |
| 1 | An “Independent Trustee” is one who is not considered an “interested person” of the Trust, as that term is defined in Section 2(a)(19) of the 1940 Act. |
| 2 | Other directorships held by a Trustee are limited to those of companies (i) with securities registered under section 12 (i.e., publicly traded companies) of the Securities Exchange Act of 1934 (the “Exchange Act”), (ii) that make reports under section 15 of the Exchange Act, or (iii) are registered investment companies. |
| Centre Funds | Trustees and Officers |
September 30, 2020 (Unaudited)
INTERESTED TRUSTEE & OFFICERS
Name,
Year of Birth | Position(s)
Held with
Funds or Trust | Length of
Time Served | Principal Occupation(s) During Past 5 Years | Number of Portfolios in
Fund
Complex
Overseen by
Trustee | Other
Directorships
Held by
Trustee During
Past 5 Years1 |
James A. Abate
1965 | Trustee President, Secretary and Treasurer | Since 6/2011 Since 11/2013 Since 1/2016 | Founder, Managing Director and Chief Investment Officer of Centre Asset Management, LLC from 2006–present. | 2 | None |
Theodore J. Uhl
1974 | Chief Compliance Officer | Since 6/2011 | Mr. Uhl has been Deputy Compliance Officer of ALPS Fund Services Inc. since 2010. | N/A | N/A |
| 1 | Other directorships held by a Trustee are limited to those of companies (i) with securities registered under section 12 (i.e., publicly traded companies) of the Securities Exchange Act of 1934 (the “Exchange Act”), (ii) that make reports under section 15 of the Exchange Act, or (iii) are registered investment companies. |
| Annual Report | September 30, 2020 | 41 |

Item 2. Code of Ethics.
(a) The Registrant, as of the end of the period covered by this report, has adopted a code of ethics that applies to the Registrant’s principal executive officer, principal financial officer, principal accounting officer or controller or any persons performing similar functions on behalf of the Registrant.
(b) Not applicable.
(c) During the period covered by this report, no amendments were made to the provisions of the code of ethics adopted in Item 2(a) above.
(d) During the period covered by this report, no implicit or explicit waivers to the provisions of the code of ethics adopted in Item 2(a) above were granted.
(e) Not applicable.
(f) The Registrant’s Code of Ethics is attached as an Exhibit to this report.
Item 3. Audit Committee Financial Expert.
The Board of Trustees of the Registrant has determined that the Registrant has at least one audit committee financial expert serving on its audit committee. The Board of Trustees has designated Dr. Aloke Ghosh as the Trust’s “audit committee financial expert,” as defined in Form N-CSR under the 1940 Act, based on the Board’s review of his qualifications. Dr. Ghosh is “independent” as defined in paragraph (a)(2) of Item 3 to Form N-CSR.
Item 4. Principal Accountant Fees and Services.
| (a) | Audit Fees: For the Registrant’s fiscal years ended September 30, 2020 and September 30, 2019, the aggregate fees billed for professional services rendered by the principal accountant for the audit of the Registrant’s annual financial statements were $21,100 and $31,650, respectively. |
| (b) | Audit-Related Fees: For the Registrant’s fiscal years ended September 30, 2020 and September 30, 2019, the aggregate fees billed for assurance and related services by the principal accountant that are reasonably related to the performance of the audit of the Registrant’s annual financial statements and are not reported under paragraph (a) of this Item were $0 and $0, respectively. |
| (c) | Tax Fees: For the Registrant’s fiscal years ended September 30, 2020 and September 30, 2019, the aggregate fees billed for professional services rendered by the principal accountant for tax compliance, tax advice, and tax planning were $5,000 and $7,500, respectively. The fiscal years 2020 and 2019 tax fees were for services for dividend calculation, excise tax preparation and tax return preparation. |
| (d) | All Other Fees: For the Registrant’s fiscal years ended September 30, 2020 and September 30, 2019, the aggregate fees billed by the principal accountant for services other than the services reported in paragraphs (a) through (c) of this item were $0 and $0, respectively. |
| (e)(1) | Audit Committee Pre-Approval Policies and Procedures: All services to be performed by the Registrant’s principal accountant must be pre-approved by the Registrant’s audit committee. |
| (e)(2) | No services described in paragraphs (b) through (d) were approved pursuant to paragraph (c)(7)(i)(C) of Rule 2-01 of Regulation S-X. |
| (g) | The aggregate non-audit fees billed by the Registrant’s principal accountant for the fiscal years ended September 30, 2020 and September 30, 2019 were $0 and $0, respectively. |
Item 5. Audit Committee of Listed Registrants.
Not applicable.
Item 6. Investments.
The Schedule of Investments is included as part of the Report to Stockholders filed under Item 1 of this report.
Item 7. Disclosure of Proxy Voting Policies and Procedures for Closed-End Management Investment Companies.
Not applicable.
Item 8. Portfolio Managers of Closed-End Management Investment Companies.
Not applicable.
Item 9. Purchases of Equity Securities by Closed-End Management Investment Company and Affiliated Purchasers.
Not applicable.
Item 10. Submission of Matters to a Vote of Security Holders.
There have been no material changes to the procedures by which shareholders may recommend nominees to the Registrant’s Board of Trustees.
Item 11. Controls and Procedures.
| (a) | The Registrant’s principal executive and principal financial officers, or persons performing similar functions, have concluded that the Registrant’s disclosure controls and procedures (as defined in Rule 30a-3(c) under the Investment Company Act of 1940, as amended (the “1940 Act”) (17 CFR 270.30a-3(c))) are effective, as of a date within 90 days of the filing date of this report that includes the disclosure required by this paragraph, based on their evaluation of these controls and procedures required by Rule 30a-3(b) under the 1940 Act (17 CFR 270.30a-3(b)) and Rules 13a-15(b) or 15d-15(b) under the Securities Exchange Act of 1934, as amended (17 CFR 240.13a-15(b) or 240.15d-15(b)). |
| (b) | No changes in the Registrant’s internal control over financial reporting (as defined in Rule 30a-3(d) under the 1940 Act (17 CFR 270.30a-3(d)) occurred during the Registrant’s second fiscal quarter of the period covered by this report that have materially affected, or are reasonably likely to materially affect, the Registrant’s internal control over financial reporting. |
Item 12. Disclosure of Securities Lending Activities for Closed-End Management Investment Companies.
Not applicable.
Item 13. Exhibits.
SIGNATURES
Pursuant to the requirements of the Securities Exchange Act of 1934 and the Investment Company Act of 1940, the Registrant has duly caused this report to be signed on its behalf by the undersigned, thereunto duly authorized.
CENTRE FUNDS
| By: | /s/ James A. Abate | |
| | James A. Abate | |
| | President (Principal Executive Officer) | |
| | | |
| Date: | December 4, 2020 | |
Pursuant to the requirements of the Securities Exchange Act of 1934 and the Investment Company Act of 1940, this report has been signed below by the following persons on behalf of the Registrant and in the capacities and on the dates indicated.
| By: | /s/ James A. Abate | |
| | James A. Abate | |
| | President (Principal Executive Officer) | |
| | | |
| Date: | December 4, 2020 | |
| By: | /s/ James A. Abate | |
| | James A. Abate | |
| | Treasurer (Principal Financial Officer) | |
| | | |
| Date: | December 4, 2020 | |