Exhibit 99.1
STRATEGY EXCELLENCE GROWTH
Credit Suisse Energy Summit
Vail, CO
February 12, 2014
Pacific Drilling
Forward Looking Statements
Certain statements and information contained in this presentation (and oral statements made regarding the subjects of this presentation) constitute “forward-looking statements” within the meaning of the Private Securities Litigation Reform Act of 1995. Forward-looking statements typically include words or phrases such as “believe,” “expect,” “anticipate,” “project,” “plan,” “intend,” “foresee,” “our ability to,” “estimate,” “potential,” “will,” “should,” “would,” “could” or other similar words, which are generally not historical in nature. Such forward-looking statements specifically include statements involving payment and timing of any future dividends; future operational performance and cashflow; revenue efficiency levels; client contract opportunities; estimated duration of client contracts; contract dayrate amounts; future contract commencement dates and locations; backlog; construction, timing and delivery of newbuild drillships; capital expenditures; growth opportunities; market conditions; cost adjustments; estimated rig availability; new rig commitments; the expected period of time and number of rigs that will be in a shipyard for repairs, maintenance, enhancement or construction; direct rig operating costs; compensation levels; shore based support costs; selling, general and administrative expenses; income tax expense; expected amortization of deferred revenue; expected amortization of deferred mobilization expenses; and expected depreciation and interest expense for the existing credit facilities and senior bonds. These forward-looking statements are based on our current expectations and beliefs concerning future developments and their potential effect on us. While management believes that these forward-looking statements are reasonable as and when made, there can be no assurance that future developments affecting us will be those that we anticipate. In particular, with respect to our any forward looking statements regarding the payment and timing of any future dividends, the declaration of any dividend payments is at the discretion of our Board of Directors, subject to the laws of Luxemburg, and heavily dependent on our company realizing projected cashflows, which could be materially impacted by the factors listed below, among others, including many factors that are outside of our control. There can be no assurance that we will make dividend payments within the period forecasted or at all. All comments concerning our expectations for future revenue and operating results are based on our forecasts for our existing operations and do not include the potential impact of any future acquisitions. Our forward-looking statements involve significant risks and uncertainties (some of which are beyond our control) and assumptions that could cause actual results to differ materially from our historical experience and our present expectations, plans or projections. Important factors that could cause actual results to differ materially from projected cashflows and other projections in the forward-looking statements include, but are not limited to: our ability to secure and maintain drilling contracts, including possible cancellation or suspension of drilling contracts as a result of mechanical difficulties, performance or other reasons; risks inherent to shipyard rig construction, repair, maintenance or enhancement, including delays; unplanned downtime and other risks associated with offshore rig operations, including unscheduled repairs or maintenance; relocations, severe weather or hurricanes; changes in worldwide rig supply and demand, competition and technology; future levels of offshore drilling activity; impact of potential licensing or patent litigation; actual contract commencement dates; environmental or other liabilities, risks or losses; governmental regulatory, legislative and permitting requirements affecting drilling operations; our ability to attract and retain skilled personnel on commercially reasonable terms; governmental action, civil unrest and political and economic uncertainties; terrorism, piracy and military action; and the outcome of litigation, legal proceedings, investigations or other claims or contract disputes.
For additional information regarding known material risk factors that could cause our actual results to differ from our projected results, please see our filings with the Securities and Exchange Commission (SEC), including our Annual Report on Form 20-F and Current Reports on Form 6-K. These documents are available through our website at www.pacificdrilling.com or through the SEC’s Electronic Data and Analysis Retrieval System at www.sec.gov.
Existing and prospective investors are cautioned not to place undue reliance on forward-looking statements, which speak only as of the date hereof. We undertake no obligation to publicly update or revise any forward-looking statements after the date they are made, whether as a result of new information, future events or otherwise.
Pacific Drilling
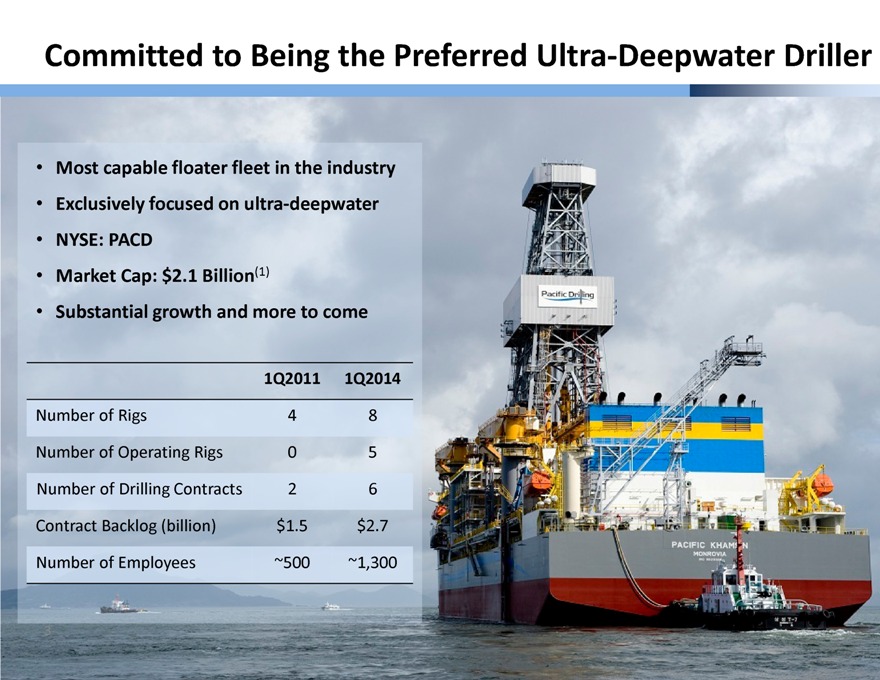
Committed to Being the Preferred Ultra-Deepwater Driller
Most capable floater fleet in the industry
Exclusively focused on ultra-deepwater
NYSE: PACD
Market Cap: $2.1 Billion(1)
Substantial growth and more to come
1Q2011 1Q2014
Number of Rigs 4 8
Number of Operating Rigs 0 5
Number of Drilling Contracts 2 6
Contract Backlog (billion) $1.5 $2.7
Number of Employees ~500 ~1,300
3
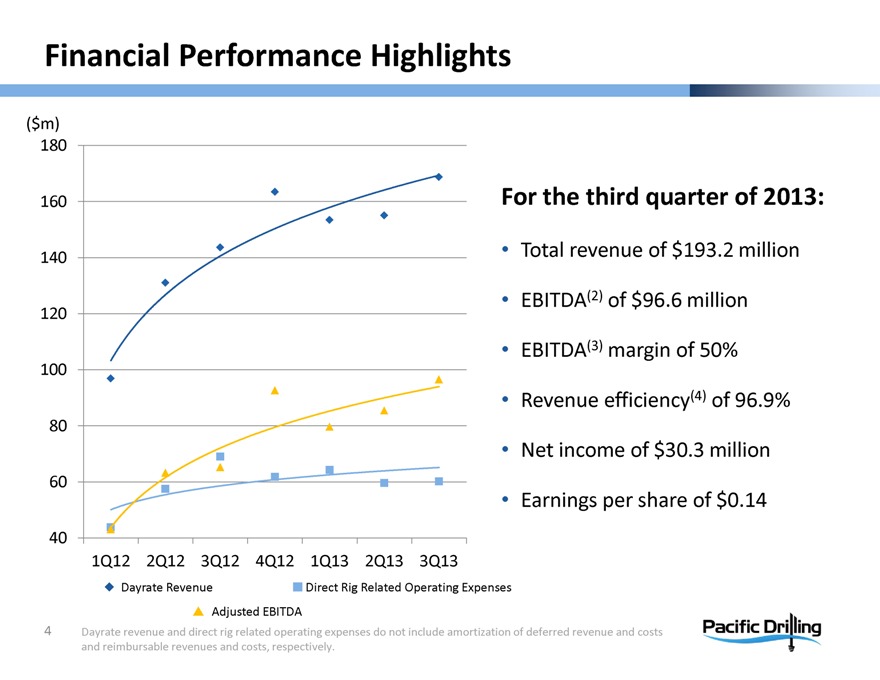
Financial Performance Highlights
($m) 180 160 140 120 100 80 60 40
1Q12 2Q12 3Q12 4Q12 1Q13 2Q13 3Q13
Dayrate Revenue Direct
Rig Related Operating Expenses
Adjusted EBITDA
For the third quarter of 2013:
Total revenue of $193.2 million
EBITDA(2) of $96.6 million
EBITDA(3) margin of 50%
Revenue efficiency(4) of 96.9%
Net income of $30.3 million
Earnings per share of $0.14
4
Dayrate revenue and direct rig related operating expenses do not include amortization of deferred revenue and costs and reimbursable revenues and costs, respectively.
Pacific Drilling
Positioned for Further Success
STRATEGY
EXCELLENCE
GROWTH
5
Pacific Drilling
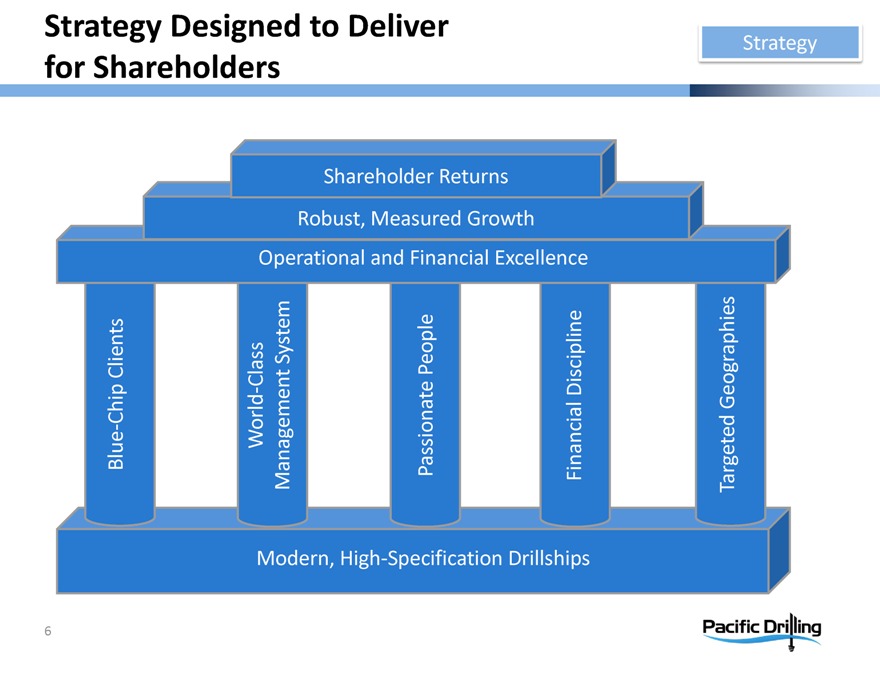
Strategy Designed to Deliver for Shareholders
Strategy
Shareholder Returns
Robust, Measured Growth Operational and Financial Excellence
Blue-Chip Clients
World-Class Management System
Passionate People
Financial Discipline
Targeted Geographies
Modern, High-Specification Drillships
6
Pacific Drilling
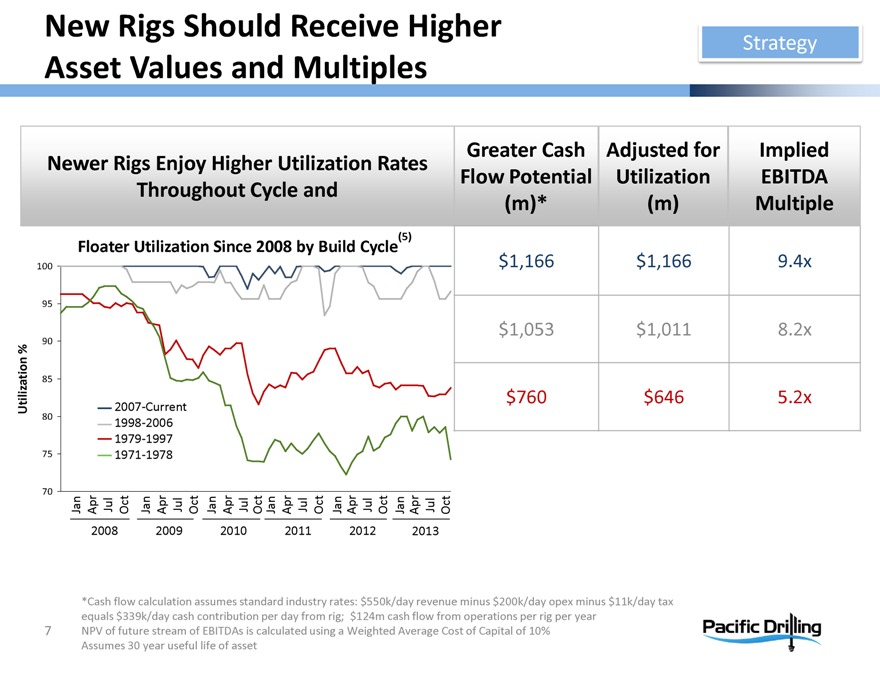
New Rigs Should Receive Higher Asset Values and Multiples
Strategy
Newer Rigs Enjoy Higher Utilization Rates Throughout Cycle and
Floater Utilization Since 2008 by Build Cycle (5)
70 75 80 85 90 95 100
2008 2009 2010 2011 2012 2013
Jan Apr Jul Oct Jan Apr Jul Oct Jan Apr Jul Oct Jan Apr Jul Oct Jan Apr Jul Oct Jan Apr Jul Oct
2007-Current 1998-2006 1979-1997 1971-1978
Utilization %
Greater Cash Flow Potential (m)*
Adjusted for Utilization (m)
Implied EBITDA Multiple
$1,166 $1,166 9.4x $1,053 $1,011 8.2x $760 $646 5.2x
*Cash flow calculation assumes standard industry rates: $550k/day revenue minus $200k/day opex minus $11k/day tax equals $339k/day cash contribution per day from rig; $124m cash flow from operations per rig per year NPV of future stream of EBITDAs is calculated using a Weighted Average Cost of Capital of 10% Assumes 30 year useful life of asset
7
Pacific Drilling
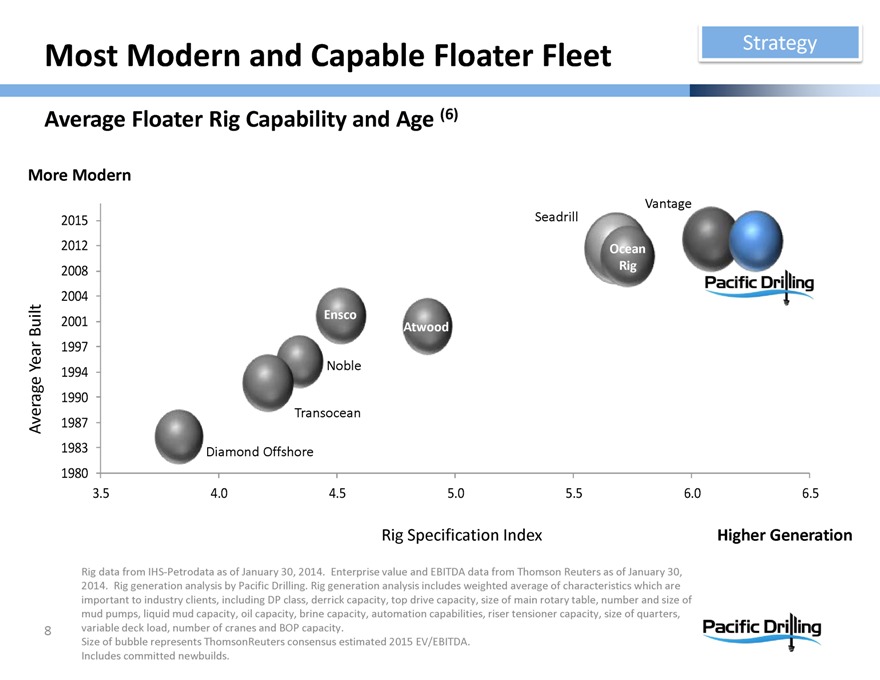
Most Modern and Capable Floater Fleet
Strategy
Average Floater Rig Capability and Age (6)
More Modern
Average Year Built
2015 2012 2008 2004 2001 1997 1994 1990 1987 1983 1980
Pacific Drilling
Vantage
Seadrill
Ocean
Rig
Ensco
Atwood
Noble
Transocean
Diamond Offshore
3.5 4.0 4.5 5.0 5.5 6.0 6.5
Rig Specification Index
Higher Generation
Rig data from IHS-Petrodata as of January 30, 2014. Enterprise value and EBITDA data from Thomson Reuters as of January 30, 2014. Rig generation analysis by Pacific Drilling. Rig generation analysis includes weighted average of characteristics which are important to industry clients, including DP class, derrick capacity, top drive capacity, size of main rotary table, number and size of mud pumps, liquid mud capacity, oil capacity, brine capacity, automation capabilities, riser tensioner capacity, size of quarters, variable deck load, number of cranes and BOP capacity.
Size of bubble represents ThomsonReuters consensus estimated 2015 EV/EBITDA. Includes committed newbuilds.
8
Pacific Drilling
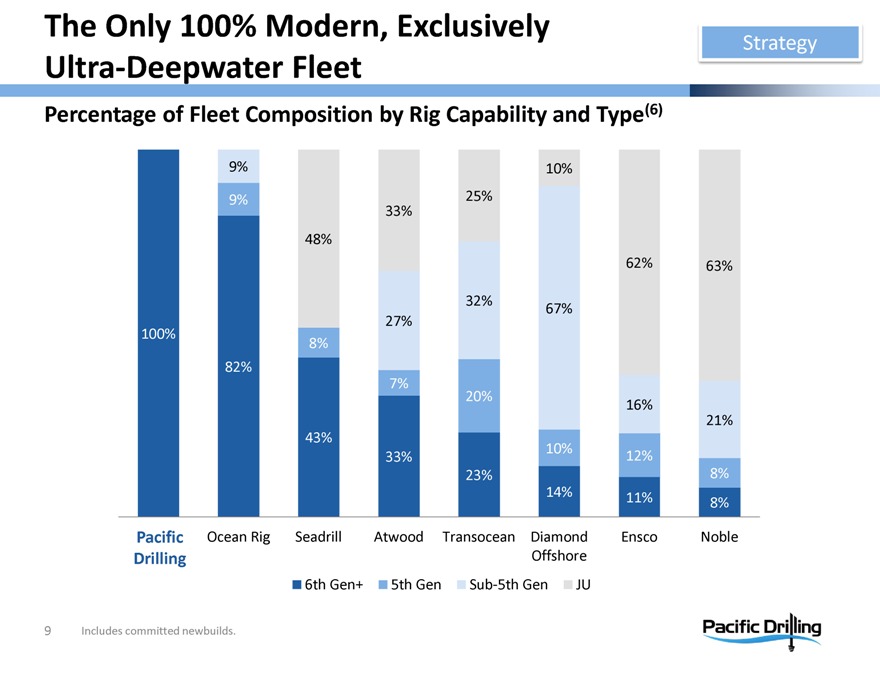
The Only 100% Modern, Exclusively Ultra-Deepwater Fleet
Strategy
Percentage of Fleet Composition by Rig Capability and Type(6)
Pacific Drilling
Ocean Rig
Seadrill
Atwood
Transocean
Diamond Offshore
Ensco
Noble
9%
10%
9%
25%
33%
48%
62%
63%
32%
67%
27%
100%
8%
82%
7%
20%
16%
21%
43%
10%
33%
12%
23%
8%
14%
11%
8%
6th Gen+ 5th Gen Sub-5th Gen JU
Includes committed newbuilds.
9
Pacific Drilling
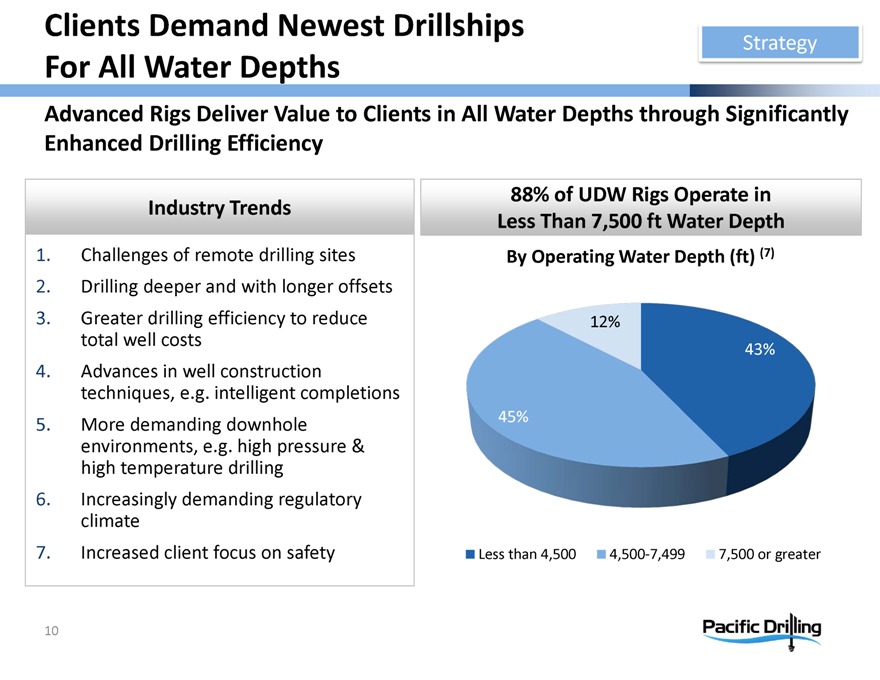
Clients Demand Newest Drillships For All Water Depths
Strategy
Advanced Rigs Deliver Value to Clients in All Water Depths through Significantly Enhanced Drilling Efficiency
Industry Trends
1. Challenges of remote drilling sites
2. Drilling deeper and with longer offsets
3. Greater drilling efficiency to reduce total well costs
4. Advances in well construction techniques, e.g. intelligent completions
5. More demanding downhole environments, e.g. high pressure & high temperature drilling
6. Increasingly demanding regulatory climate
7. Increased client focus on safety
88% of UDW Rigs Operate in Less Than 7,500 ft Water Depth
By Operating Water Depth (ft) (7)
12% 43% 45%
Less than 4,500 4,500-7,499 7,500 or greater
10
Pacific Drilling
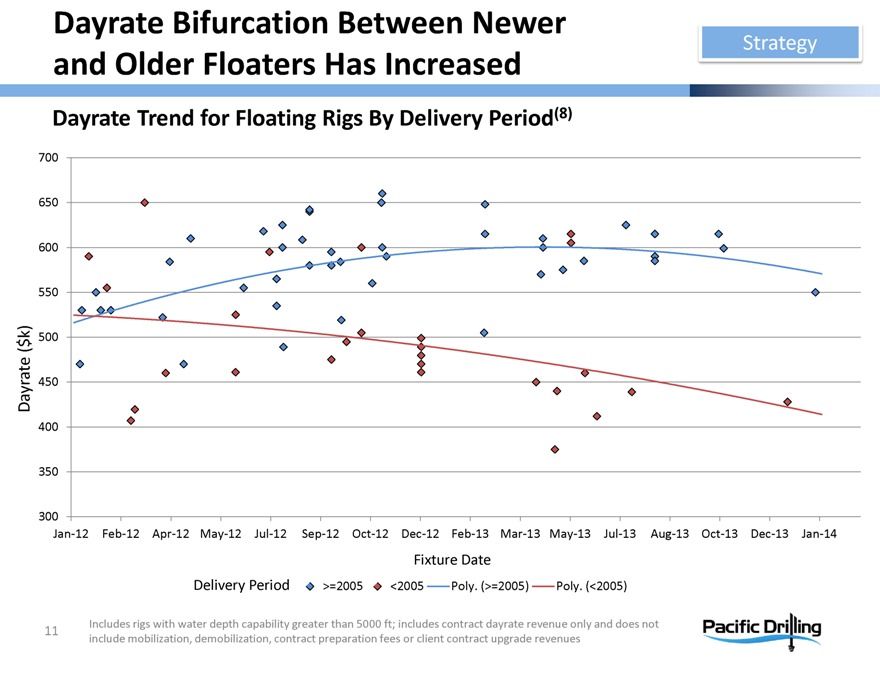
Dayrate Bifurcation Between Newer and Older Floaters Has Increased
Strategy
Dayrate Trend for Floating Rigs By Delivery Period(8)
Dayrate ($k)
700 650 600 550 500 450 400 350 300
Jan-12 Feb-12 Apr-12 May-12 Jul-12 Sep-12 Oct-12 Dec-12 Feb-13 Mar-13 May-13 Jul-13 Aug-13 Oct-13 Dec-13 Jan-14
Fixture Date
Delivery Period >=2005 <2005 Poly. (>=2005) Poly. (<2005)
Includes rigs with water depth capability greater than 5000 ft; includes contract dayrate revenue only and does not include mobilization, demobilization, contract preparation fees or client contract upgrade revenues
11
Pacific Drilling
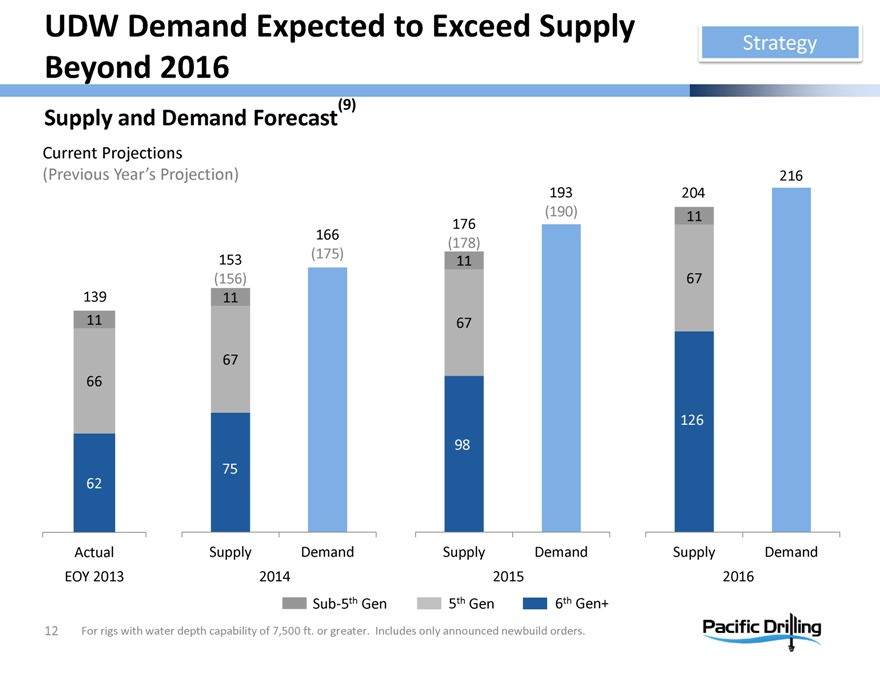
UDW Demand Expected to Exceed Supply Beyond 2016
Strategy
Supply and Demand Forecast(9)
Current Projections
(Previous Year’s Projection)
139 11 66 62
153 (156) 11 67 75
166 (175)
176 (178) 11 67 98
193 (190)
204 11 67 126
216
Actual Supply Demand Supply Demand Supply Demand
EOY 2013 2014 2015 2016
Sub-5th Gen
5th Gen
6th Gen+
For rigs with water depth capability of 7,500 ft. or greater. Includes only announced newbuild orders.
12
Pacific Drilling
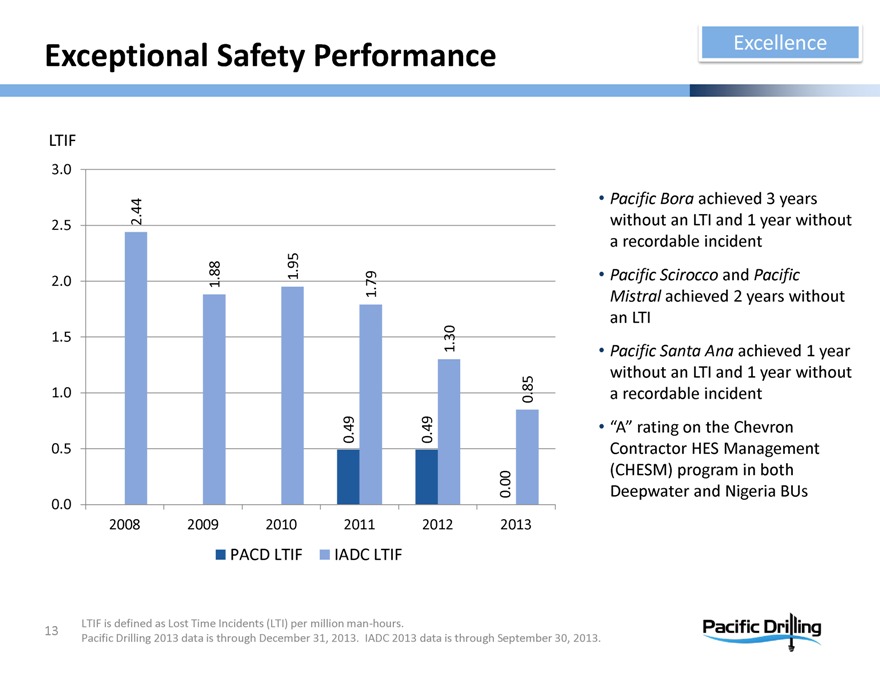
Exceptional Safety Performance
Excellence
LTIF 3.0 2.5 2.0 1.5 1.0 0.5 0.0
2.44 1.88 1.95 0.49 1.79 0.49 1.30 0.00 0.85
2008 2009 2010 2011 2012 2013
PACD LTIF IADC LTIF
Pacific Bora achieved 3 years without an LTI and 1 year without a recordable incident
Pacific Scirocco and Pacific Mistral achieved 2 years without an LTI
Pacific Santa Ana achieved 1 year without an LTI and 1 year without a recordable incident
“A” rating on the Chevron Contractor HES Management (CHESM) program in both Deepwater and Nigeria BUs
LTIF is defined as Lost Time Incidents (LTI) per million man-hours.
Pacific Drilling 2013 data is through December 31, 2013. IADC 2013 data is through September 30, 2013.
13
Pacific Drilling
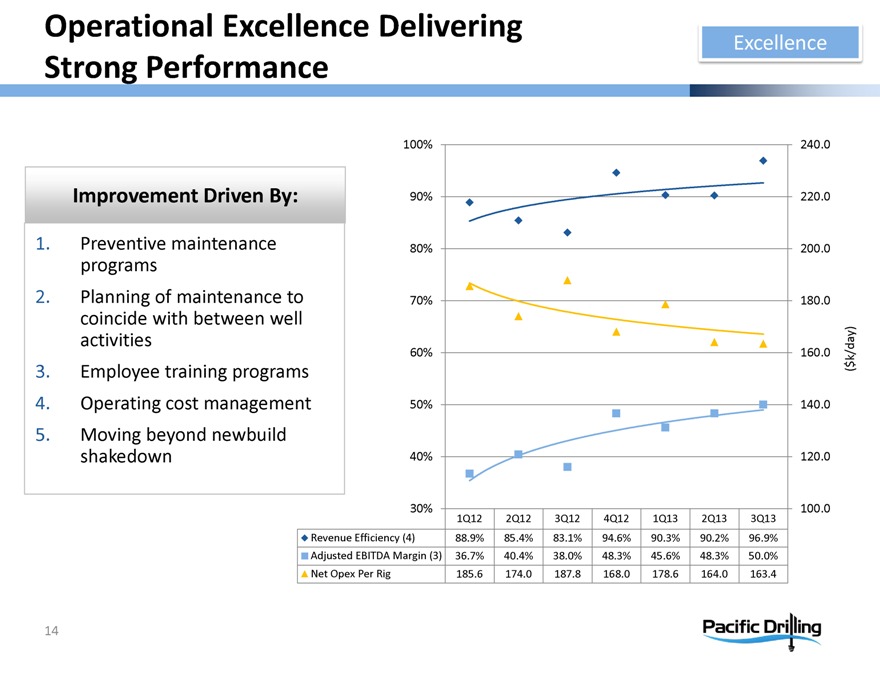
Operational Excellence Delivering
Strong Performance
Excellence
Improvement Driven By:
1. Preventive maintenance programs
2. Planning of maintenance to coincide with between well activities
3. Employee training programs
4. Operating cost management
5. Moving beyond newbuild shakedown
100% 90% 80% 70% 60% 50% 40% 30%
240.0 220.0 200.0 180.0 160.0 ($k/day) 140.0 120.0 100.0
1Q12 2Q12 3Q12 4Q12 1Q13 2Q13 3Q13
Revenue Efficiency (4)
88.9% 85.4% 83.1% 94.6% 90.3% 90.2% 96.9%
Adjusted EBITDA Margin (3)
36.7% 40.4% 38.0% 48.3% 45.6% 48.3% 50.0%
Net Opex Per Rig
185.6 174.0 187.8 168.0 178.6 164.0 163.4
14
Pacific Drilling
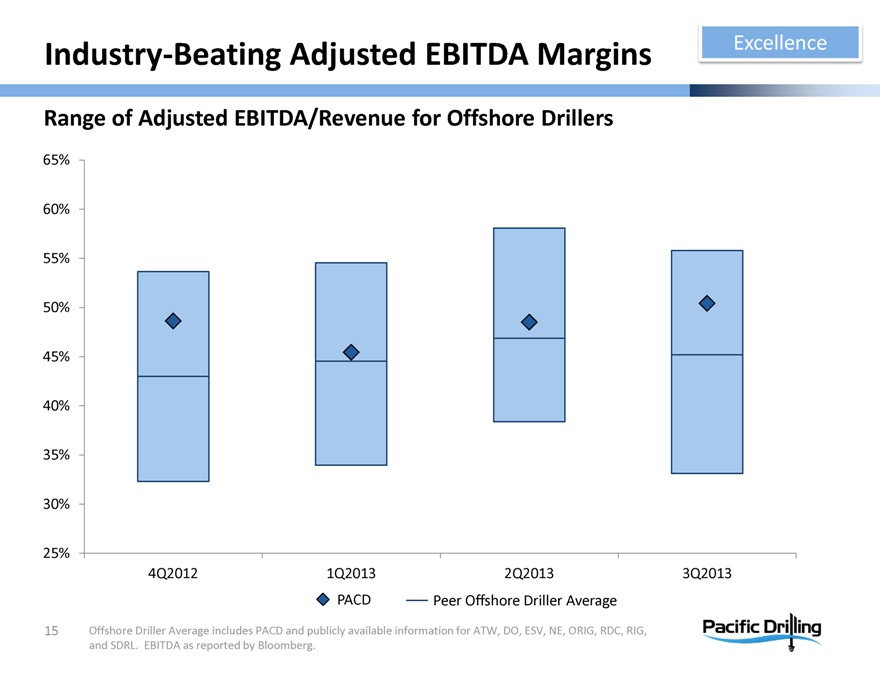
Industry-Beating Adjusted EBITDA Margins
Excellence
Range of Adjusted EBITDA/Revenue for Offshore Drillers
65% 60% 55% 50% 45% 40% 35% 30% 25%
4Q2012 1Q2013 2Q2013 3Q2013
PACD Peer Offshore Driller Average
Offshore Driller Average includes PACD and publicly available information for ATW, DO, ESV, NE, ORIG, RDC, RIG, and SDRL. EBITDA as reported by Bloomberg.
15
Pacific Drilling
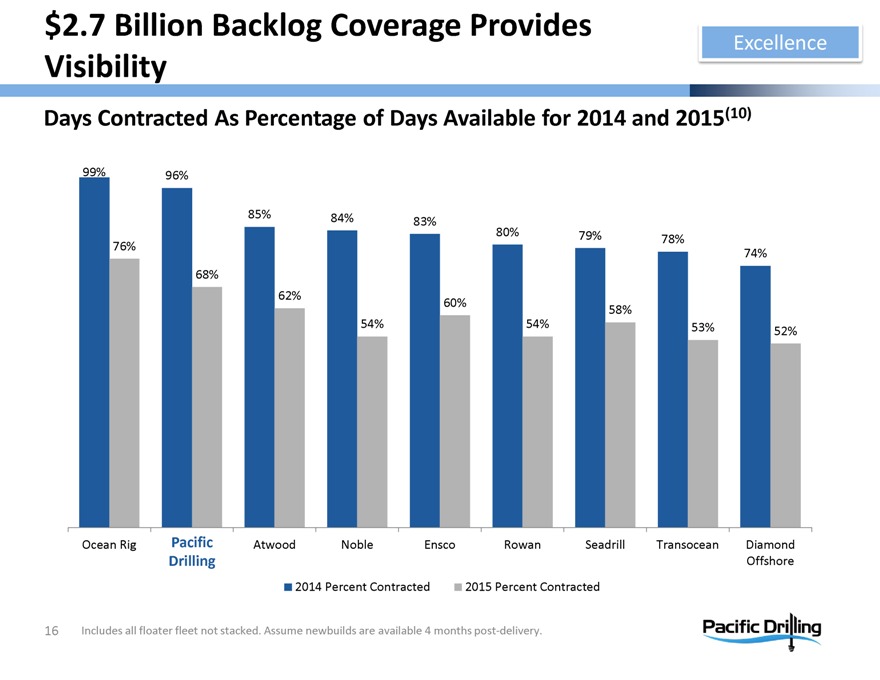
$2.7 Billion Backlog Coverage Provides Visibility
Excellence
Days Contracted As Percentage of Days Available for 2014 and 2015(10)
99% 76%
96% 68%
85% 62%
84% 54%
83% 60%
80% 54%
79% 58%
78% 53%
74% 52%
Ocean Rig
Pacific Drilling
Atwood
Noble
Ensco
Rowan
Seadrill
Transocean
Diamond Offshore
2014 Percent Contracted 2015 Percent Contracted
Includes all floater fleet not stacked. Assume newbuilds are available 4 months post-delivery.
16
Pacific Drilling
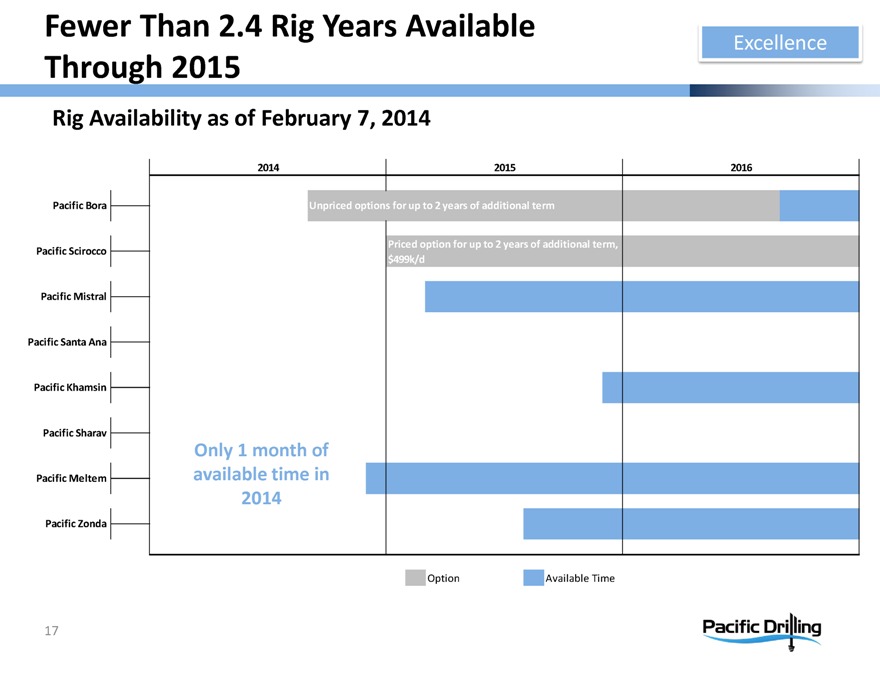
Fewer Than 2.4 Rig Years Available Through 2015
Excellence
Rig Availability as of February 7, 2014
2014 2015 2016
Pacific Bora
Pacific Scirocco
Pacific Mistral
Pacific Santa Ana
Pacific Khamsin
Pacific Sharav
Pacific Meltem
Pacific Zonda
Unpriced options for up to 2 years of additional term
Priced option for up to 2 years of additional term, $499k/d
Only 1 month of available time in 2014
Option Available Time
17
Pacific Drilling
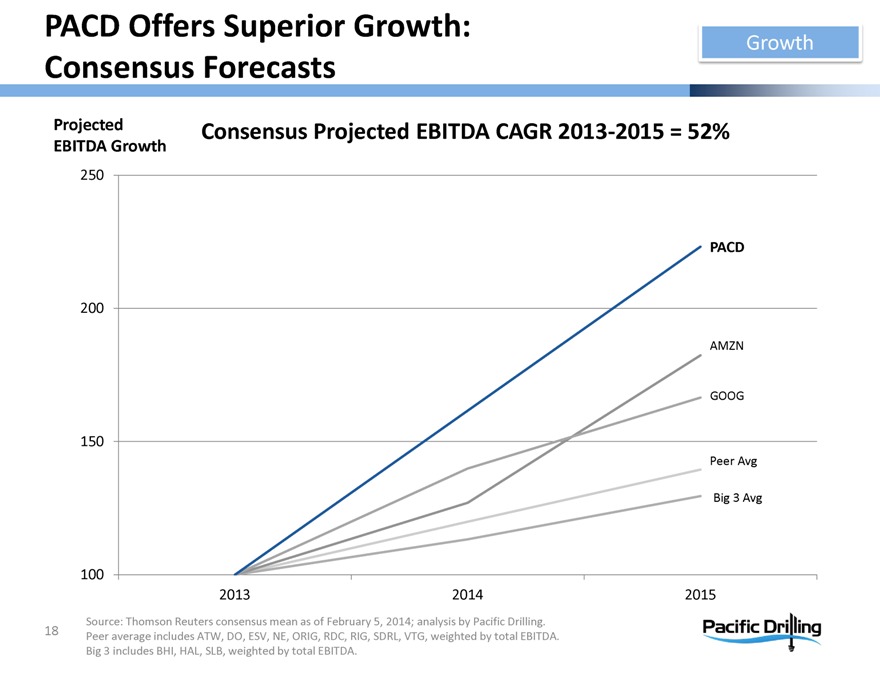
PACD Offers Superior Growth: Consensus Forecasts
Growth
Projected EBITDA Growth
Consensus Projected EBITDA CAGR 2013-2015 = 52%
250 200 150 100
PACD AMZN GOOG Peer Avg Big 3 Avg
2013 2014 2015
Source: Thomson Reuters consensus mean as of February 5, 2014; analysis by Pacific Drilling. Peer average includes ATW, DO, ESV, NE, ORIG, RDC, RIG, SDRL, VTG, weighted by total EBITDA. Big 3 includes BHI, HAL, SLB, weighted by total EBITDA.
18
Pacific Drilling
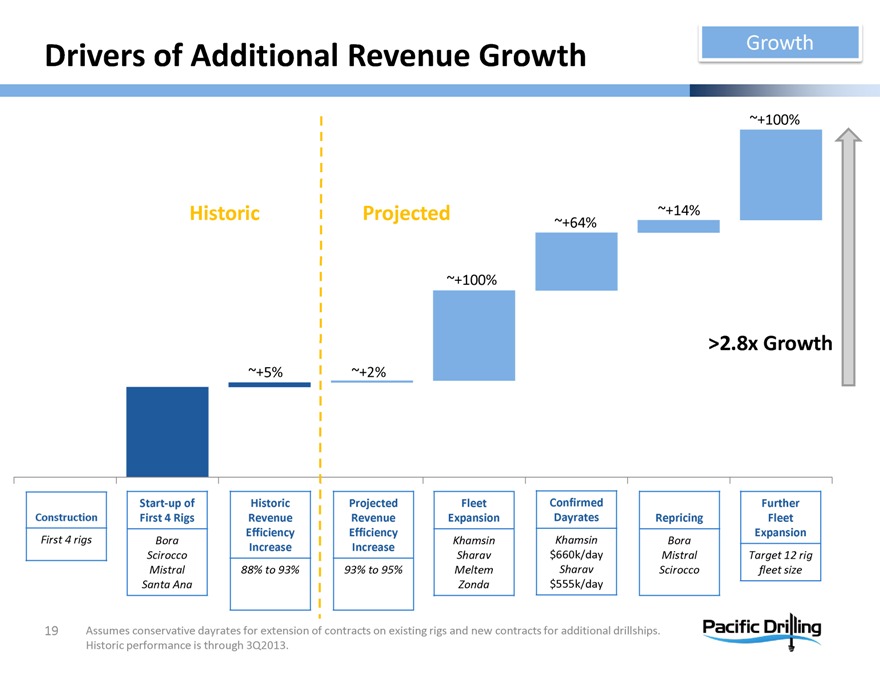
Drivers of Additional Revenue Growth
Growth
Historic Projected
~+5% ~+2% ~+100% ~+64% ~+14% ~+100% >2.8x Growth
Construction First 4 rigs
Start-up of First 4 Rigs Bora Scirocco Mistral Santa Ana
Historic Revenue Efficiency Increase 88% to 93%
Projected Revenue Efficiency Increase 93% to 95%
Fleet Expansion Khamsin Sharav Meltem Zonda
Confirmed Dayrates Khamsin $660k/day Sharav $555k/day
Repricing Bora Mistral Scirocco
Further Fleet Expansion Target 12 rig fleet size
Assumes conservative dayrates for extension of contracts on existing rigs and new contracts for additional drillships. Historic performance is through 3Q2013.
19
Pacific Drilling
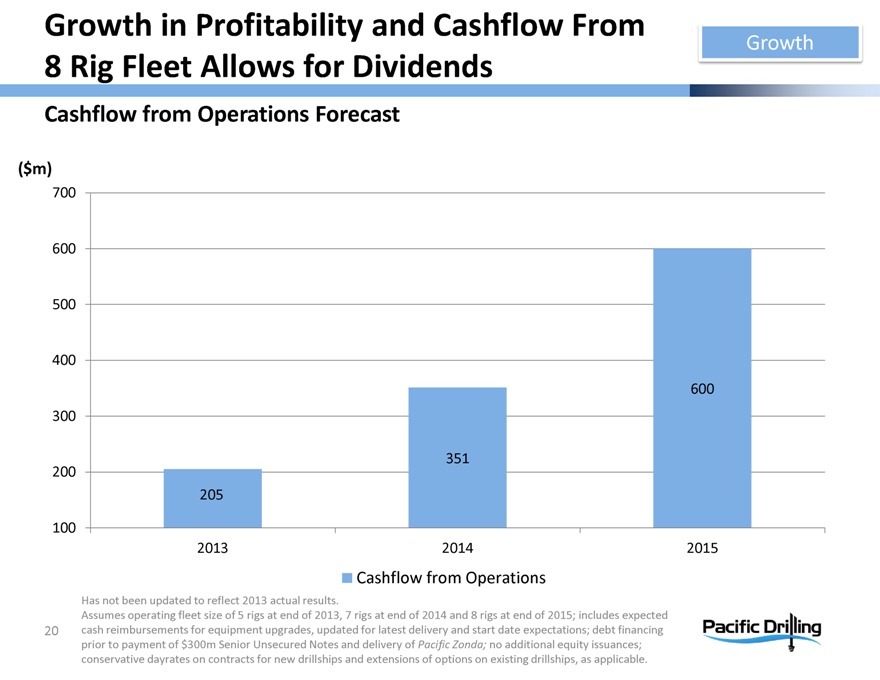
Growth in Profitability and Cashflow From
8 Rig Fleet Allows for Dividends
Growth
Cashflow from Operations Forecast
($m)
700 600 500 400 300 200 100
205 351 600
2013 2014 2015
Cashflow from Operations
Has not been updated to reflect 2013 actual results.
Assumes operating fleet size of 5 rigs at end of 2013, 7 rigs at end of 2014 and 8 rigs at end of 2015; includes expected cash reimbursements for equipment upgrades, updated for latest delivery and start date expectations; debt financing prior to payment of $300m Senior Unsecured Notes and delivery of Pacific Zonda; no additional equity issuances; conservative dayrates on contracts for new drillships and extensions of options on existing drillships, as applicable.
20
Pacific Drilling
Our Current Priorities and Potential Catalysts
Drilling contracts
Pacific Bora option exercise
Pacific Mistral extension
Pacific Scirocco option exercise
Pacific Meltem maiden contract
Continued excellence in operations
Dividend initiation
21
Pacific Drilling

Investor Contact
Pacific Drilling
Amy Roddy
VP Investor Relations
3050 Post Oak Blvd #1500 Houston, Texas USA
Phone: +1 832-255-0502
Email: Investor@pacificdrilling.com
www.pacificdrilling.com
22
Pacific Drilling
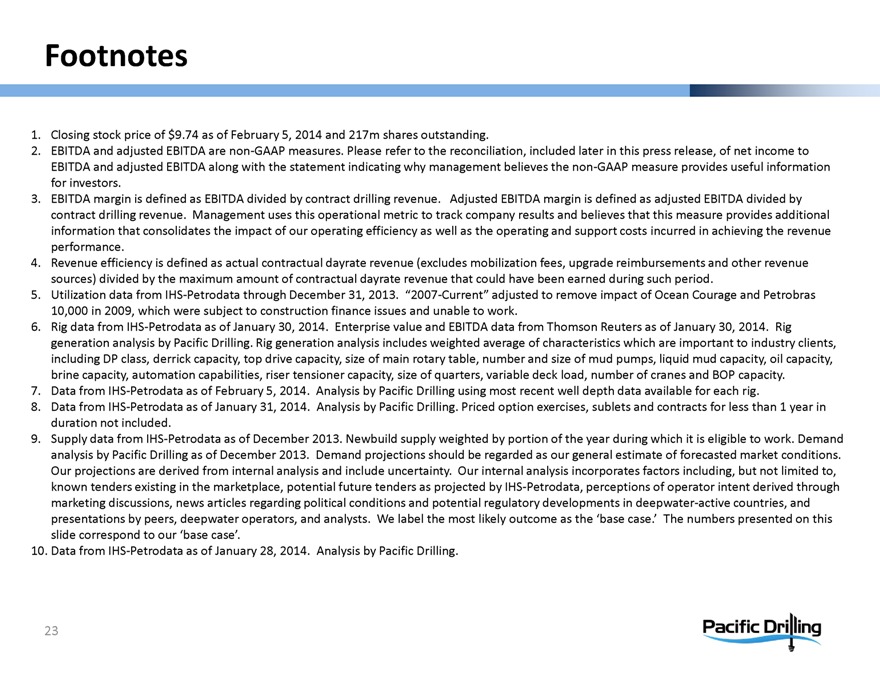
Footnotes
1. Closing stock price of $9.74 as of February 5, 2014 and 217m shares outstanding.
2. EBITDA and adjusted EBITDA are non-GAAP measures. Please refer to the reconciliation, included later in this press release, of net income to EBITDA and adjusted EBITDA along with the statement indicating why management believes the non-GAAP measure provides useful information for investors.
3. EBITDA margin is defined as EBITDA divided by contract drilling revenue. Adjusted EBITDA margin is defined as adjusted EBITDA divided by contract drilling revenue. Management uses this operational metric to track company results and believes that this measure provides additional information that consolidates the impact of our operating efficiency as well as the operating and support costs incurred in achieving the revenue performance.
4. Revenue efficiency is defined as actual contractual dayrate revenue (excludes mobilization fees, upgrade reimbursements and other revenue sources) divided by the maximum amount of contractual dayrate revenue that could have been earned during such period.
5. Utilization data from IHS-Petrodata through December 31, 2013. “2007-Current” adjusted to remove impact of Ocean Courage and Petrobras 10,000 in 2009, which were subject to construction finance issues and unable to work.
6. Rig data from IHS-Petrodata as of January 30, 2014. Enterprise value and EBITDA data from Thomson Reuters as of January 30, 2014. Rig generation analysis by Pacific Drilling. Rig generation analysis includes weighted average of characteristics which are important to industry clients, including DP class, derrick capacity, top drive capacity, size of main rotary table, number and size of mud pumps, liquid mud capacity, oil capacity, brine capacity, automation capabilities, riser tensioner capacity, size of quarters, variable deck load, number of cranes and BOP capacity.
7. Data from IHS-Petrodata as of February 5, 2014. Analysis by Pacific Drilling using most recent well depth data available for each rig.
8. Data from IHS-Petrodata as of January 31, 2014. Analysis by Pacific Drilling. Priced option exercises, sublets and contracts for less than 1 year in duration not included.
9. Supply data from IHS-Petrodata as of December 2013. Newbuild supply weighted by portion of the year during which it is eligible to work. Demand analysis by Pacific Drilling as of December 2013. Demand projections should be regarded as our general estimate of forecasted market conditions.
Our projections are derived from internal analysis and include uncertainty. Our internal analysis incorporates factors including, but not limited to, known tenders existing in the marketplace, potential future tenders as projected by IHS-Petrodata, perceptions of operator intent derived through marketing discussions, news articles regarding political conditions and potential regulatory developments in deepwater-active countries, and presentations by peers, deepwater operators, and analysts. We label the most likely outcome as the ‘base case.’ The numbers presented on this slide correspond to our ‘base case’.
10. Data from IHS-Petrodata as of January 28, 2014. Analysis by Pacific Drilling.
23
Pacific Drilling
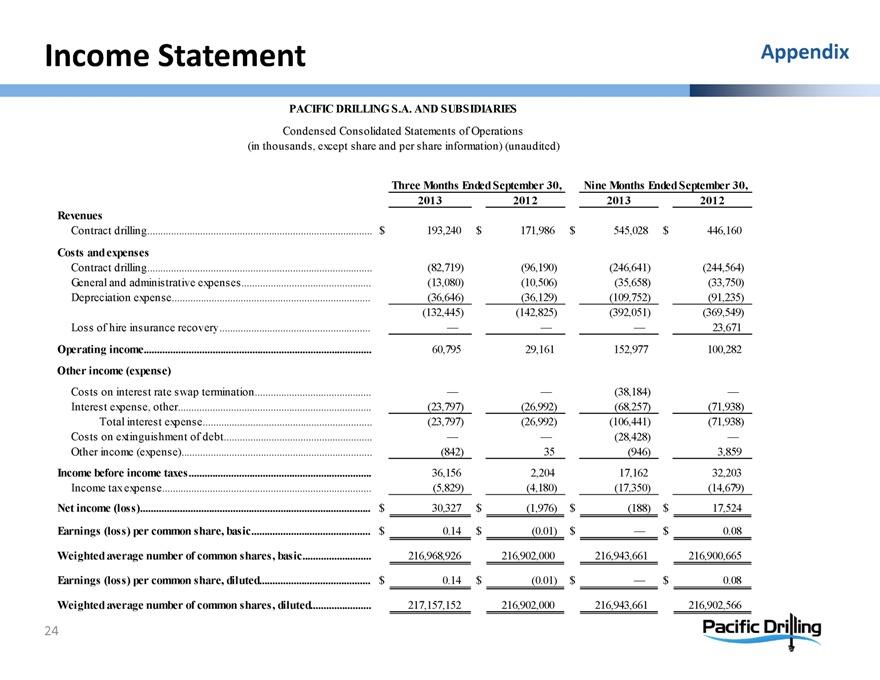
Income Statement
Appendix
PACIFIC DRILLING S.A. AND SUBSIDIARIES
Condensed Consolidated Statements of Operations (in thousands, except share and per share information) (unaudited)
Three Months Ended September 30,
Nine Months Ended September 30,
2013 2012 2013 2012
Revenues
Contract drilling
Costs and expenses
Contract drilling
General and administrative expenses
Depreciation expense
Loss of hire insurance recovery
Operating income
Other income (expense)
Costs on interest rate swap termination
Interest expense, other
Total interest expense
Costs on extinguishment of debt
Other income (expense)
Income before income taxes
Income tax expense
Net income (loss)
Earnings (loss) per common share, basic
Weighted average number of common shares, basic
Earnings (loss) per common share, diluted
Weighted average number of common shares, diluted
$193,240 (82,719) (13,080) (36,646) (132,445) — 60,795 — (23,797) (23,797) — (842) 36,156 (5,829) $30,327 $0.14 216,968,926 $0.14 217,157,152
$171,986 (96,190) (10,506) (36,129) (142,825) — 29,161 — (26,992) (26,992) — 35 2,204 (4,180) $(1,976) $(0.01) 216,902,000 $(0.01) 216,902,000
$545,028 (246,641) (35,658) (109,752) (392,051) — 152,977 (38,184) (68,257) (106,441) (28,428) (946) 17,162 (17,350) $(188) $— 216,943,661 $— 216,943,661
$446,160 (244,564) (33,750) (91,235) (369,549) 23,671 100,282 — (71,938) (71,938) — 3,859 32,203 (14,679) $17,524 $0.08 216,900,665 $0.08 216,902,566
24
Pacific Drilling
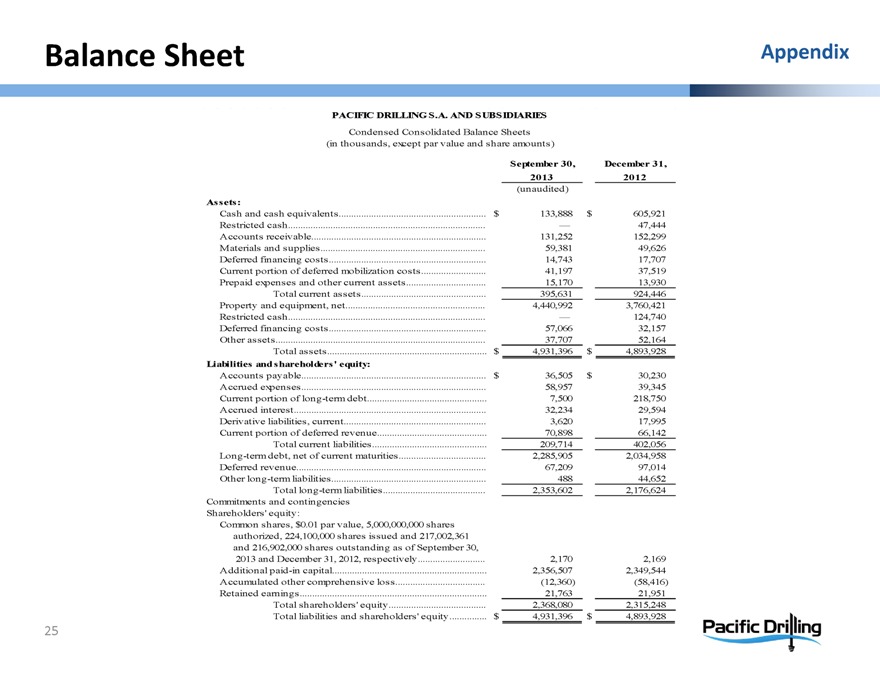
Balance Sheet
Appendix
PACIFIC DRILLING S.A. AND SUBSIDIARIES
Condensed Consolidated Balance Sheets (in thousands, except par value and share amounts)
September 30, 2013
December 31, 2012 (unaudited)
Assets:
Cash and cash equivalents
Restricted cash
Accounts receivable
Materials and supplies
Deferred financing costs
Current portion of deferred mobilization costs
Prepaid expenses and other current assets
Total current assets
Property and equipment, net
Restricted cash
Deferred financing costs
Other assets
Total assets
Liabilities and shareholders’ equity:
Accounts payable
Accrued expenses
Current portion of long-term debt
Accrued interest
Derivative liabilities, current
Current portion of deferred revenue
Total current liabilities
Long-term debt, net of current maturities
Deferred revenue
Other long-term liabilities
Total long-term liabilities
Commitments and contingencies
Shareholders’ equity:
Common shares, $0.01 par value, 5,000,000,000 shares authorized, 224,100,000 shares issued and 217,002,361 and 216,902,000 shares outstanding as of September 30, 2013 and December 31, 2012, respectively
Additional paid-in capital
Accumulated other comprehensive loss
Retained earnings
Total shareholders’ equity
Total liabilities and shareholders’ equity
$133,888 — 131,252 59,381 14,743 41,197 15,170 395,631 4,440,992 — 57,066 37,707 $4,931,396 $36,505 58,957 7,500 32,234 3,620 70,898 209,714 2,285,905 67,209 488 2,353,602 2,170 2,356,507 (12,360) 21,763 2,368,080 $4,931,396
$605,921 47,444 152,299 49,626 17,707 37,519 13,930 924,446 3,760,421 124,740 32,157 52,164 $4,893,928 $30,230 39,345 218,750 29,594 17,995 66,142 402,056 2,034,958 97,014 44,652 2,176,624 2,169 2,349,544 (58,416) 21,951 2,315,248 $4,893,928
25
Pacific Drilling
EBITDA & Adjusted EBITDA Reconciliation
Appendix
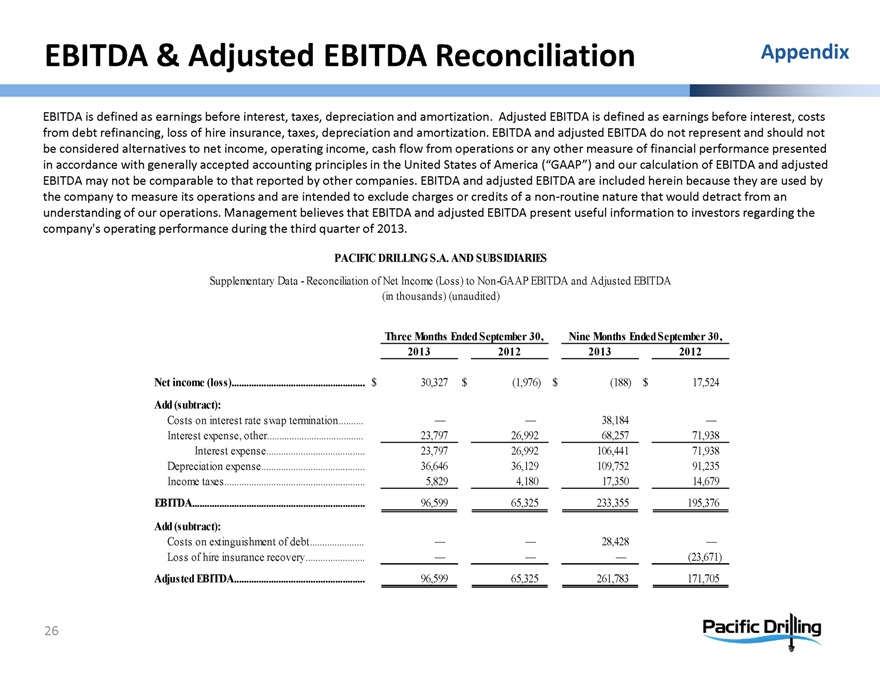
EBITDA is defined as earnings before interest, taxes, depreciation and amortization. Adjusted EBITDA is defined as earnings before interest, costs from debt refinancing, loss of hire insurance, taxes, depreciation and amortization. EBITDA and adjusted EBITDA do not represent and should not be considered alternatives to net income, operating income, cash flow from operations or any other measure of financial performance presented in accordance with generally accepted accounting principles in the United States of America (“GAAP”) and our calculation of EBITDA and adjusted EBITDA may not be comparable to that reported by other companies. EBITDA and adjusted EBITDA are included herein because they are used by the company to measure its operations and are intended to exclude charges or credits of a non-routine nature that would detract from an understanding of our operations. Management believes that EBITDA and adjusted EBITDA present useful information to investors regarding the company’s operating performance during the third quarter of 2013.
PACIFIC DRILLING S.A. AND SUBSIDIARIES
Supplementary Data - Reconciliation of Net Income (Loss) to Non-GAAP EBITDA and Adjusted EBITDA (in thousands) (unaudited)
Three Months Ended September 30,
Nine Months Ended September 30,
2013 2012 2013 2012
Net income (loss)
Add (subtract):
Costs on interest rate swap termination
Interest expense, other
Interest expense
Depreciation expense
Income taxes
EBITDA
Add (subtract):
Costs on extinguishment of debt
Loss of hire insurance recovery
Adjusted EBITDA
$30,327 — 23,797 23,797 36,646 5,829 96,599 — — 96,599
$(1,976) — 26,992 26,992 36,129 4,180 65,325 — — 65,325
$(188) 38,184 68,257 106,441 109,752 17,350 233,355 28,428 — 261,783
$17,524 — 71,938 71,938 91,235 14,679 195,376 — (23,671) 171,705
26
Pacific Drilling
Debt Financing Overview as of December 31, 2013
Appendix
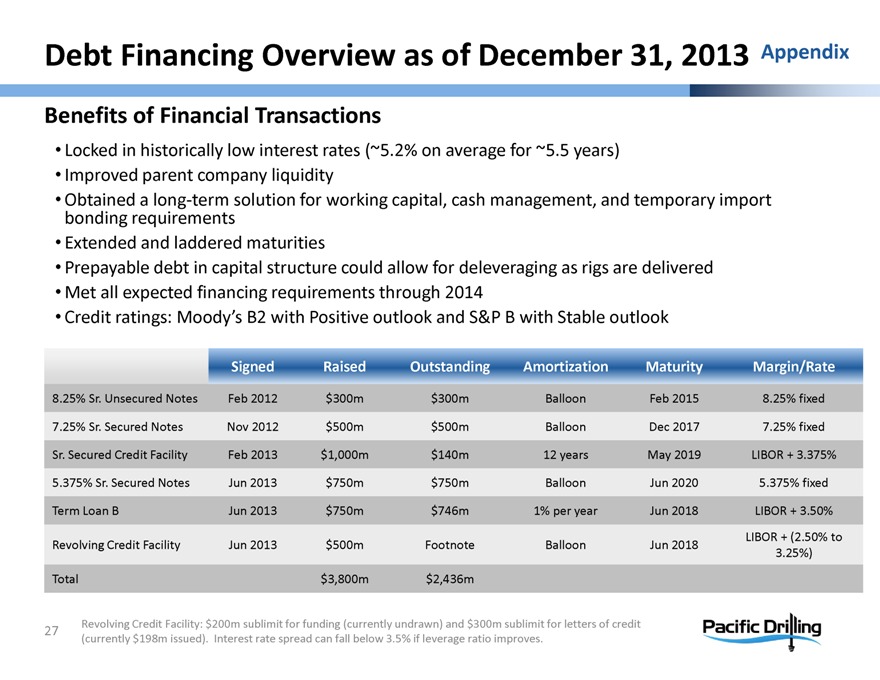
Benefits of Financial Transactions
Locked in historically low interest rates (~5.2% on average for ~5.5 years)
Improved parent company liquidity
Obtained bonding requirements a long-term solution for working capital, cash management, and temporary import
Extended and laddered maturities
Prepayable debt in capital structure could allow for deleveraging as rigs are delivered
Met all expected financing requirements through 2014
Credit ratings: Moody’s B2 with Positive outlook and S&P B with Stable outlook
Signed Raised Outstanding Amortization Maturity Margin/Rate
8.25% Sr. Unsecured Notes Feb 2012 $300m $300m Balloon Feb 2015 8.25% fixed
7.25% Sr. Secured Notes Nov 2012 $500m $500m Balloon Dec 2017 7.25% fixed
Sr. Secured Credit Facility Feb 2013 $1,000m $140m 12 years May 2019 LIBOR + 3.375%
5.375% Sr. Secured Notes Jun 2013 $750m $750m Balloon Jun 2020 5.375% fixed
Term Loan B Jun 2013 $750m $746m 1% per year Jun 2018 LIBOR + 3.50%
Revolving Credit Facility Jun 2013 $500m Footnote Balloon Jun 2018 LIBOR + (2.50% to 3.25%)
Total $3,800m $2,436m
Revolving Credit Facility: $200m sublimit for funding (currently undrawn) and $300m sublimit for letters of credit (currently $198m issued). Interest rate spread can fall below 3.5% if leverage ratio improves.
27
Pacific Drilling
Contract Backlog Overview
Appendix
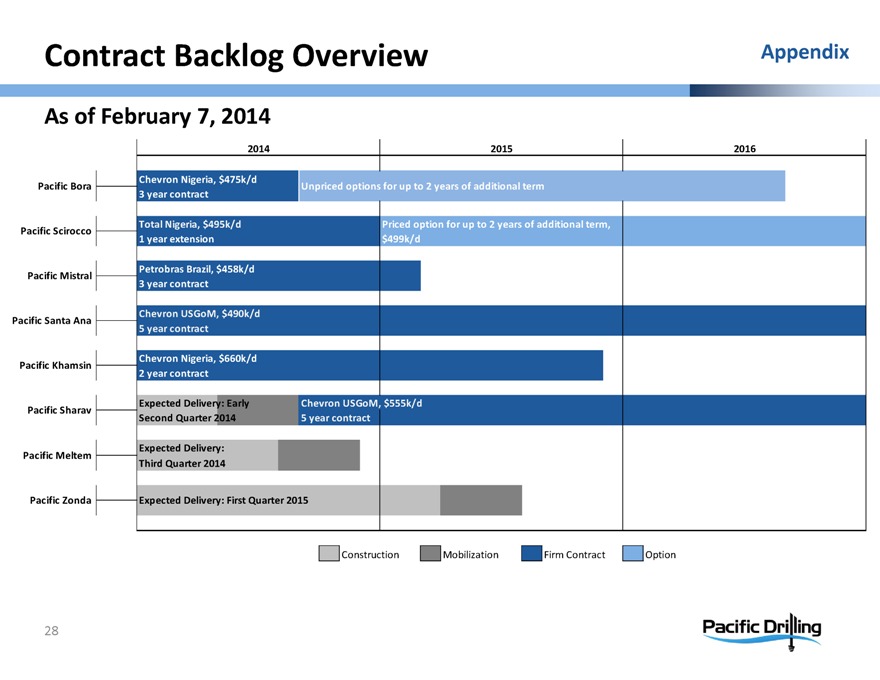
As of February 7, 2014
2014 2015 2016
Pacific Bora Chevron Nigeria, $475k/d 3 year contract Unpriced options for up to 2 years of additional term
Pacific Scirocco
Total Nigeria, $495k/d 1 year extension
Priced option for up to 2 years of additional term, $499k/d
Pacific Mistral
Petrobras Brazil, $458k/d
3 year contract
Pacific Santa Ana
Chevron USGoM, $490k/d
5 year contract
Pacific Khamsin
Chevron Nigeria, $660k/d
2 year contract
Pacific Sharav
Expected Delivery: Early
Chevron USGoM, $555k/d
Second Quarter 2014
5 year contract
Pacific Meltem
Expected Delivery:
Third Quarter 2014
Pacific Zonda
Expected Delivery: First Quarter 2015
Construction Mobilization Firm Contract Option
28
Pacific Drilling