Exhibit 99.1
|
Investor Presentation
September 2014
STRATEGY EXCELLENCE GROWTH
Pacific Drilling
|
Forward Looking Statements
Certain statements and information contained in this presentation (and oral statements made regarding the subjects of this presentation) constitute “forward-looking statements” within the meaning of the Private Securities Litigation Reform Act of 1995. Forward-looking statements typically include words or phrases such as “anticipate,” “believe,” “could,” “estimate,” “expect,” “forecast,” “foresee,” “intend,” “our ability to,” “plan,” “potential,” “project,” “tends to,” “target,” “will,” “would,” orother similar words, or negatives of such words, which are generally not historical in nature. Such forward-looking statements specifically include statements involving future distributions to shareholders; future operational performance and cashflow; backlog; revenue efficiency levels; client contract opportunities; estimated duration of client contracts; contract dayrate amounts; future contract commencement dates and locations; construction, timing and delivery of newbuild drillships; capital expenditures; market conditions; cost adjustments; estimated rig availability; new rig commitments; the expected time and number of rigs in a shipyard for repairs, maintenance, enhancement or construction; expected direct rig operating costs; shore based support costs; selling, general and administrative expenses; income tax expense; expected amortization of deferred revenue; expected amortization of deferred mobilization expenses; and expected depreciation and interest expense for our existing credit facilities and senior bonds. These forward-looking statements are based on our current expectations and beliefs concerning future developments and their potential effect on us. While management believes that these forward-looking statements are reasonable as and when made, there can be no assurance that future developments affecting us will be those that we anticipate. In particular, our forward looking statements regarding future distributions to shareholders are subject to the discretion of our Board of Directors, additional laws of Luxemburg, and the payment of any such distribution is heavily dependent on our ability to achieve projected cashflows, which could be materially impacted by numerous factors, including those listed below. There can be no assurance that we will make distributions within the period or in the amount forecasted or at all. All comments concerning our expectations for future revenue and operating results are based on our forecasts for our existing operations and do not include the potential impact of any future acquisitions. Our forward-looking statements involve significant risks and uncertainties (many of which are beyond our control) and assumptions that could cause actual results to differ materially from our historical experience and our present expectations, plans or projections. Important factors that could cause actual results to differ materially from projected cashflows and other projections in our forward-looking statements include, but are not limited to: our ability to secure and maintain drilling contracts, including possible cancellation or suspension of drilling contracts as a result of mechanical difficulties, performance, regulatory or other approvals, or other reasons; risks inherent to shipyard rig construction, repair, maintenance or enhancement, including delays; changes in worldwide rig supply and demand, competition and technology; levels of offshore drilling activity and general market conditions; unplanned downtime and other risks associated with offshore rig operations, including unscheduled repairs or maintenance; governmental action, strikes, public health threats, civil unrest and political and economic uncertainties; relocations, severe weather or hurricanes; actual contract commencement dates; environmental or other liabilities, risks or losses; governmental regulatory, legislative and permitting requirements affecting drilling operations; our ability to attract and retain skilled personnel on commercially reasonable terms; impact of potential licensing or patent litigation; terrorism, piracy and military action; and the outcome of litigation, legal proceedings, investigations or other claims or contract disputes.
For additional information regarding known material risk factors that could cause our actual results to differ from our projected results, please see our filings with the Securities and Exchange Commission (SEC), including our Annual Report on Form 20-F and Current Reports on Form 6-K. These documents are available through our website at www.pacificdrilling.com or through the SEC’s Electronic Data and Analysis Retrieval System at www.sec.gov.
Existing and prospective investors are cautioned not to place undue reliance on forward-looking statements, which speak only as of the date hereof. We undertake no obligation to publicly update or revise any forward-looking statements after the date they are made, whether as a result of new information, future events or otherwise.
|
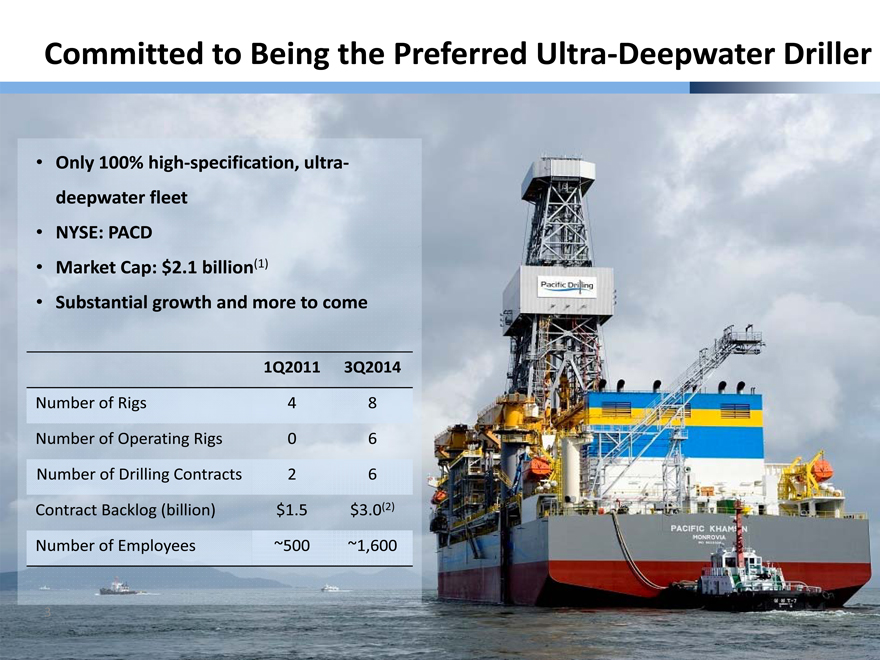
Committed to Being the Preferred Ultra-Deepwater Driller
Only 100% high-specification, ultra-deepwater fleet NYSE: PACD
Market Cap: $2.1 billion(1)
Substantial growth and more to come
1Q2011 3Q2014
Number of Rigs 4 8
Number of Operating Rigs 0 6
Number of Drilling Contracts 2 6
Contract Backlog (billion) $1.5 $3.0(2)
Number of Employees ~500 ~1,600
|
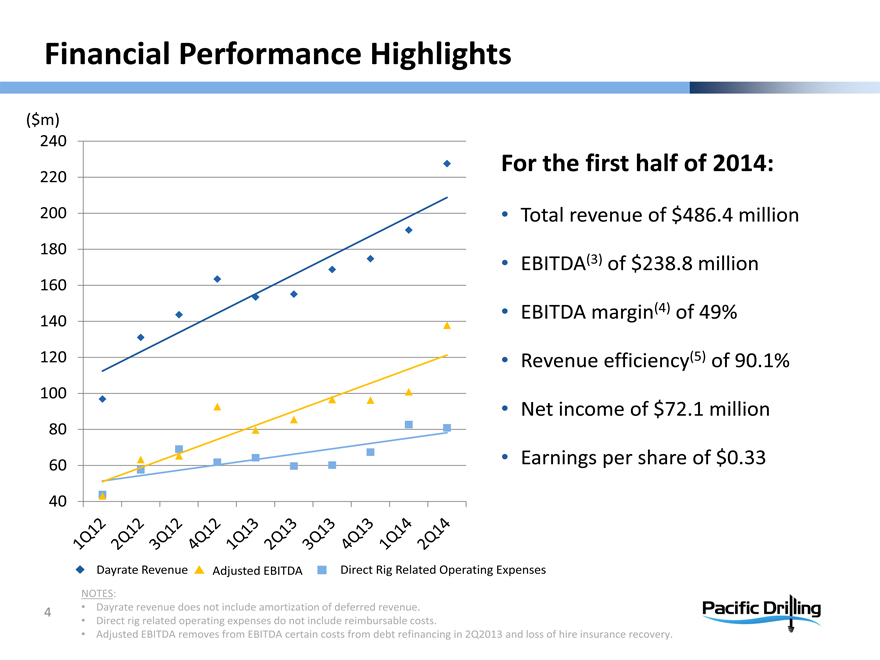
Financial Performance Highlights
($m)
240
220
200
180
160
140
120
100
80
60
40
1Q12
2Q12
3Q12
4Q12
1Q13
2Q13
3Q13
4Q13
1Q14
2Q14
Dayrate Revenue Adjusted EBITDA Direct Rig Related Operating Expenses
For the first half of 2014:
Total revenue of $486.4 million EBITDA(3) of $238.8 million EBITDA margin(4) of 49% Revenue efficiency(5) of 90.1% Net income of $72.1 million
Earnings per share of $0.33
NOTES:
Dayrate revenue does not include amortization of deferred revenue.
Direct rig related operating expenses do not include reimbursable costs.
Adjusted EBITDA removes from EBITDA certain costs from debt refinancing in 2Q2013 and loss of hire insurance recovery.
4 |
|
|
Positioned for Further Success
STRATEGY EXCELLENCE GROWTH
5 |
|
|
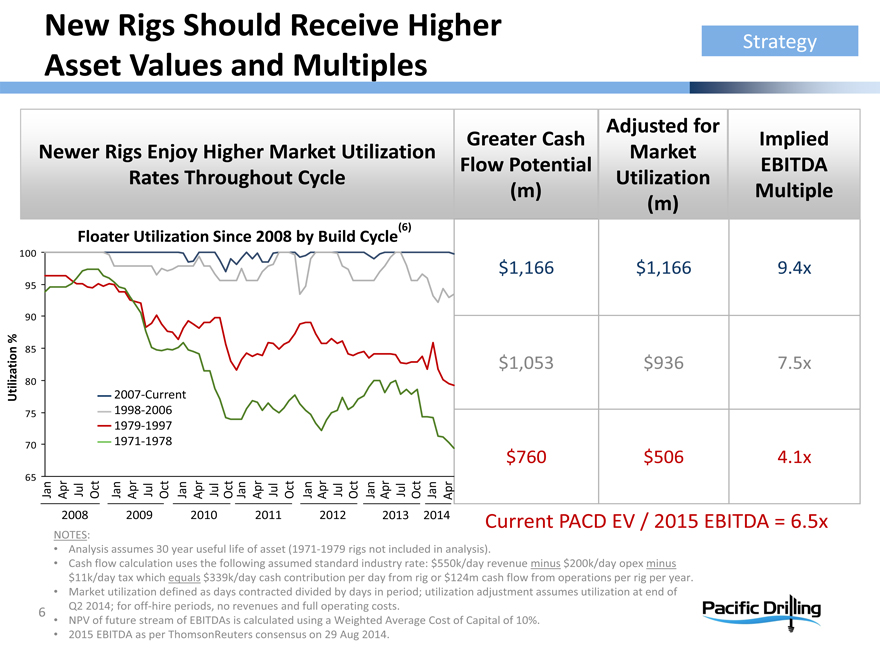
New Rigs Should Receive Higher Asset Values and Multiples
Strategy
New Rigs Enjoy Higher Market Utilization Rates Throughout Cycle
Greater Cash Flow Potential(m)
Adjusted for Market Utilization(m)
Implied EBITDA Multiple
Floater Utilization Since 2008 by Build Cycle(6)
100
$1,166 $1,166 9.4x
95
90
%
Utilization
85
$1,053 $936 7.5x
80
2007-Current
75 1998-2006
1979?1997
70 1971-1978
$760 $506 4.1x
65
Jan Apr Jul Oct Jan Apr Jul Oct Jan Apr Jul Oct Jan Apr Jul Oct Jan Apr Jul Oct Jan Apr Jul Oct Jan Apr
2008 2009 2010 2011 2012 2013 2014 Current PACD EV / 2015 EBITDA = 6.5x
NOTES:
Analysis assumes 30 year useful life of asset (1971?1979 rigs not included in analysis).
Cash flow calculation uses the following assumed standard industry rate: $550k/day revenue minus $200k/day opex minus $11k/day tax which equals $339k/day cash contribution per day from rig or $124m cash flow from operations per rig per year.
Market utilization defined as days contracted divided by days in period; utilization adjustment assumes utilization at end of Q2 2014; for off-hire periods, no revenues and full operating costs.
NPV of future stream of EBITDAs is calculated using a Weighted Average Cost of Capital of 10%.
2015 EBITDA as per ThomsonReuters consensus on 29 Aug 2014.
6
|
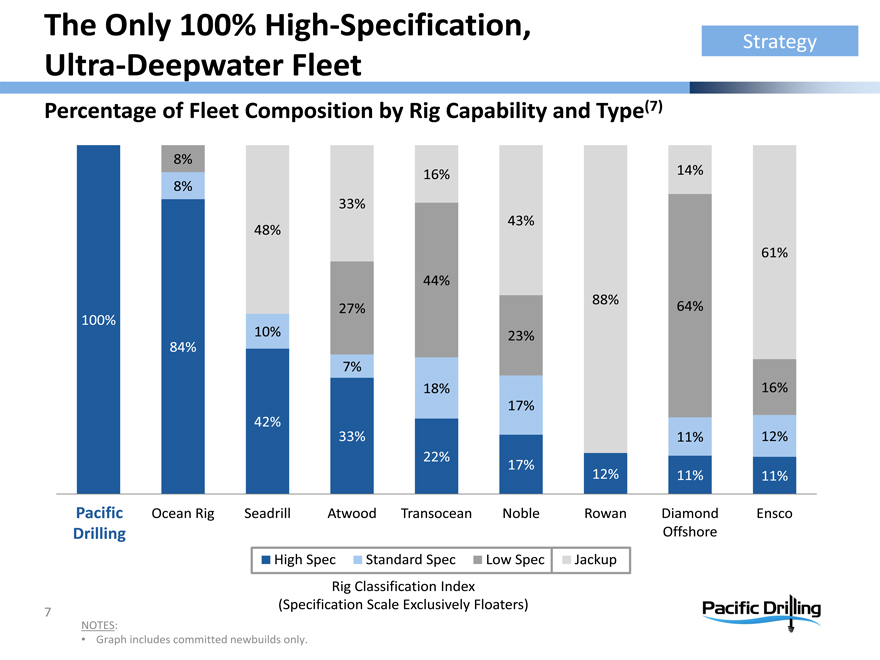
The Only 100% High-Specification, Ultra-Deepwater Fleet
Strategy
Percentage of Fleet Composition by Rig Capability and Type(7)
8%
16% 14%
8%
33%
43%
48%
61%
44%
88%
27% 64%
100%
10% 23%
84%
7%
18% 16%
17%
42%
33% 11% 12%
22% 17%
12% 11% 11%
Pacific Ocean Rig Seadrill Atwood Transocean Noble Rowan Diamond Ensco
Drilling Offshore
High Spec Standard Spec Low Spec Jackup
Rig Classification Index
(Specification Scale Exclusively Floaters)
NOTES:
Graph includes committed newbuilds only.
7
|
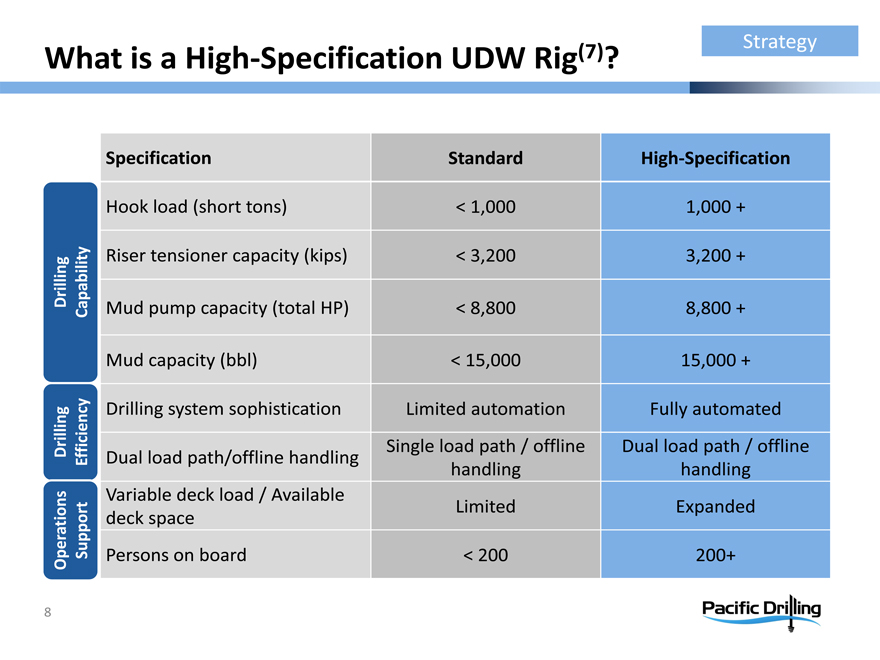
What is a High-Specification UDW Rig(7)?
Strategy
Specification Standard High-Specification
Hook load (short tons) < 1,000 1,000 +
Capability Riser tensioner capacity (kips) < 3,200 3,200 +
Drilling Mud pump capacity (total HP) < 8,800 8,800 +
Mud capacity (bbl) < 15,000 15,000 +
Drilling system sophistication Limited automation Fully automated
Single load path / offline Dual load path / offline
Drilling Efficiency Dual load path/offline handling
handling handling
Variable deck load / Available
Limited Expanded
deck space
Operation Support Persons on board < 200 200+
8
|
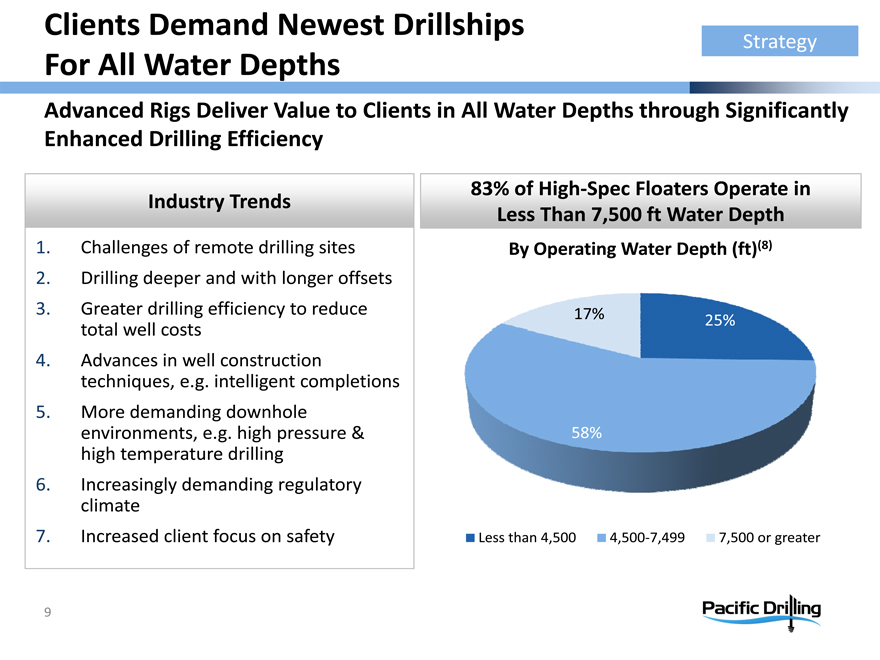
Clients Demand Newest Drillships For All Water Depths
Strategy
Advanced Rigs Deliver Value to Clients in All Water Depths through Significantly Enhanced Drilling Efficiency
Industry Trends
1. Challenges of remote drilling sites
2. Drilling deeper and with longer offsets
3. Greater drilling efficiency to reduce total well costs
4. Advances in well construction techniques, e.g. intelligent completions
5. More demanding downhole environments, e.g. high pressure & high temperature drilling
6. Increasingly demanding regulatory climate
7. Increased client focus on safety
83% of High-Spec Floaters Operate in Less Than 7,500 ft Water Depth
By Operating Water Depth (ft)(8)
17% 25%
58%
Less than 4,500 4,500-7,499 7,500 or greater
9
|
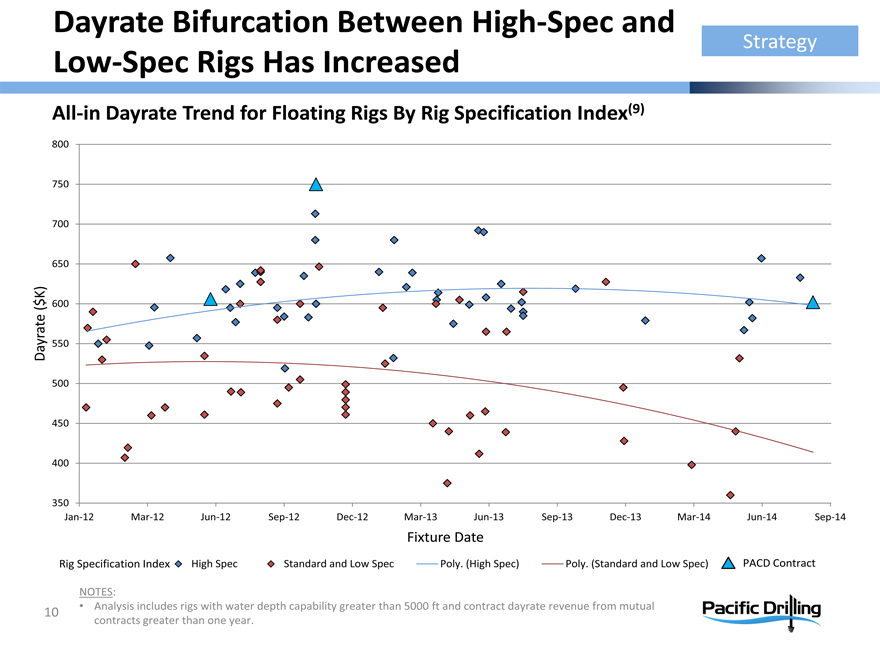
Dayrate Bifurcation Between High-Spec and Low-Spec Rigs Has Increased
Strategy
All-in Dayrate Trend for Floating Rigs By Rig Specification Index(9)
800
750
700
650
600
Dayrate($K) 550
500
450
400
350
Jan-12 Mar-12 Jun-12 Sep-12 Dec-12 Mar-13 Jun-13 Sep-13 Dec-13 Mar-14 Jun-14 Sep-14
Fixture Date
Rig Specification Index High Spec Standard and Low Spec Poly. (High Spec) Poly. (Standard and Low Spec) PACD Contract
NOTES:
Analysis includes rigs with water depth capability greater than 5000 ft and contract dayrate revenue from mutual contracts greater than one year.
10
|
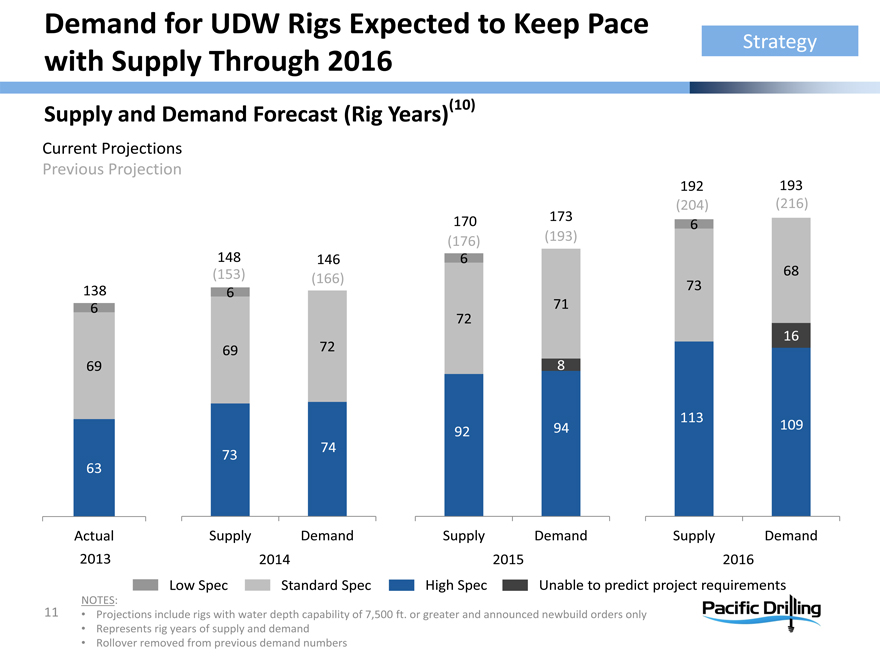
Demand for UDW Rigs Expected to Keep Pace with Supply Through 2016
Strategy
Supply and Demand Forecast (Rig Years)(10)
Current Projections Previous Projection
Previous Projection
192 193
(204)(216)
170 173 6
(176)(193)
148 146 6
(153)(166) 68
138 6 73
6 71
72
16
69 72
69 8
113
92 94 109
73 74
63
Actual Supply Demand Supply Demand Supply Demand
2013 2014 2015 2016
Low Spec Standard Spec High Spec Unable to predict project requirements
NOTES:
Projections include rigs with water depth capability of 7,500 ft. or greater and announced newbuild orders only
Represents rig years of supply and demand
Rollover removed from previous demand numbers
11
|
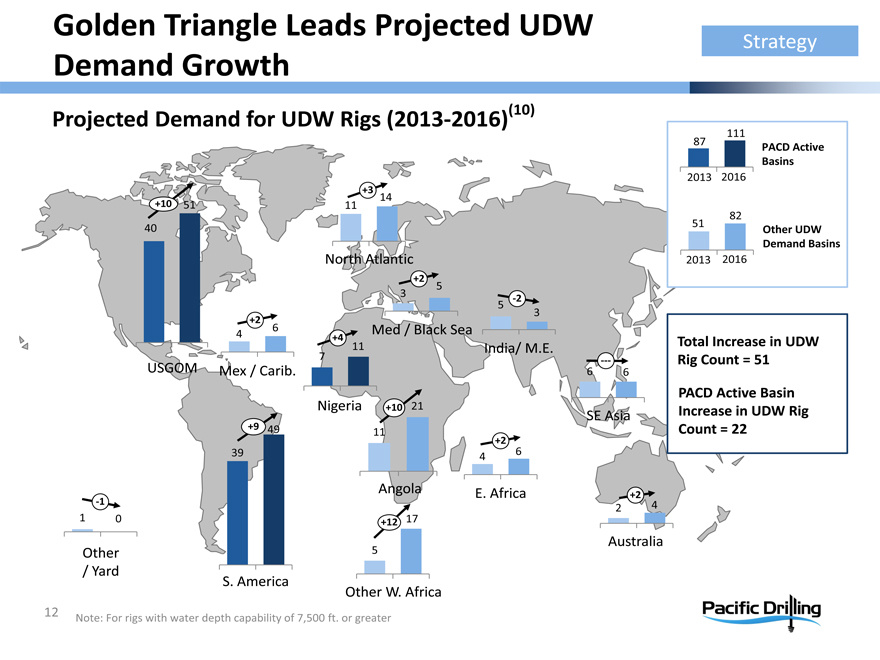
Golden Triangle Leads Projected UDW Demand Growth
Strategy
Projected Demand for UDW Rigs (2013-2016)(10)
Projected Demand for UDW Rigs (2013-2016)
+3 14
+10 51 11
40 |
|
North Atlantic
+2
5 |
|
3 |
| -2 |
5 |
|
3 |
|
+2
4 |
| 6 Med / Black Sea |
+4
11 |
| India/ M.E. |
7 |
|
USGOM Mex / Carib. 6 6
Nigeria +10 21
SE Asia
+9 49 11
+2
39 |
| 4 6 |
Angola E. Africa +2
1 2 4
1 |
| 0 +12 17 |
Australia
Other 5
/ Yard
S. America
Other W. Africa
111 87
PACD Active Basins
2013 2016
82 51
Other UDW Demand Basins
2013 2016
Total Increase in UDW Rig Count = 51
PACD Active Basin Increase in UDW Rig Count = 22
Note: For rigs with water depth capability of 7,500 ft. or greater
12
|
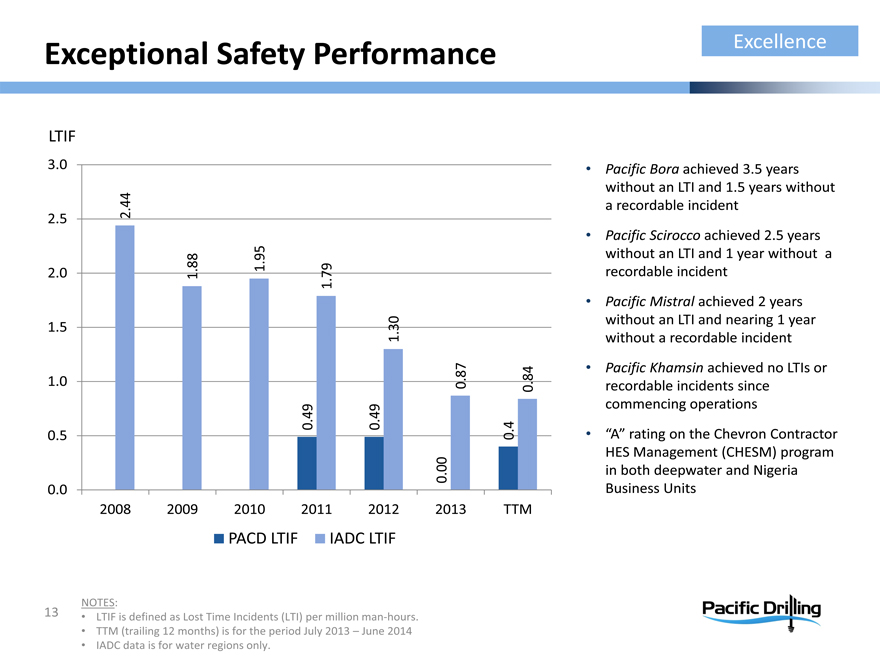
Exceptional Safety Performance
Excellence
. 0 0 . . 1 . 1 2 . 2 . . 3
0 5 0 5 0 5 0 LTIF
2008 2.44 2009 1.88 PACD 2010 1.95
LTIF
0.49
2011 1.79
IADC
LTIF 0.49
2012 1.30
0.00
2013 0.87 TTM 0.4
0.84
Pacific Bora achieved 3.5 years without an LTI and 1.5 years without a recordable incident
Pacific Scirocco achieved 2.5 years without an LTI and 1 year without a recordable incident
Pacific Mistral achieved 2 years without an LTI and nearing 1 year without a recordable incident
Pacific Khamsin achieved no LTIs or recordable incidents since commencing operations
“A” rating on the Chevron Contractor HES Management (CHESM) program in both deepwater and Nigeria Business Units
NOTES:
LTIF is defined as Lost Time Incidents (LTI) per million man-hours.
TTM (trailing 12 months) is for the period July 2013 – June 2014
IADC data is for water regions only.
13
|
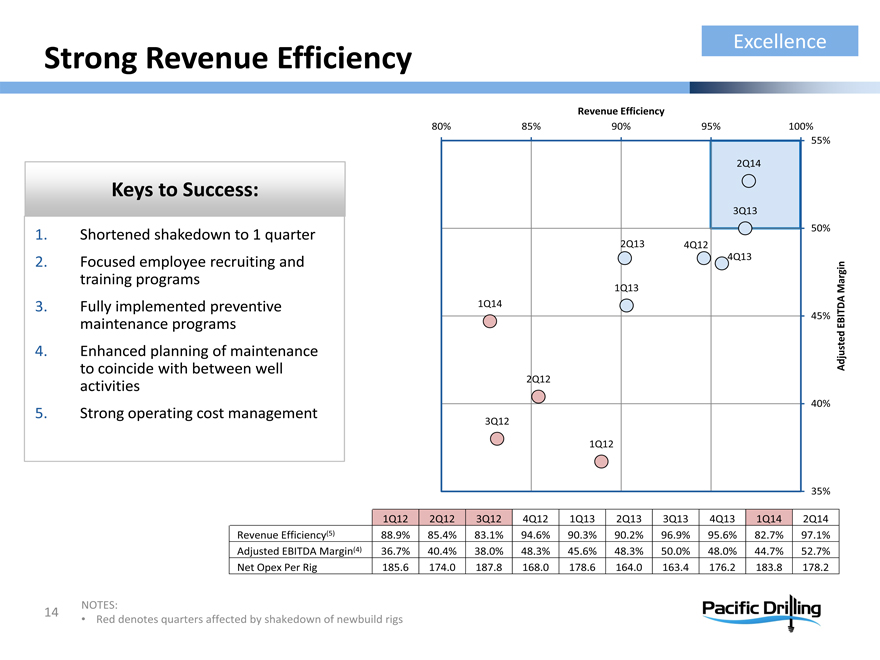
Strong Revenue Efficiency
Excellence
Keys to Success:
1. Shortened shakedown to 1 quarter
2. Focused employee recruiting and training programs
3. Fully implemented preventive maintenance programs
4. Enhanced planning of maintenance to coincide with between well activities
5. Strong operating cost management
Revenue Efficiency
80% 85% 90% 95% 100%
55%
2Q14
3Q13
50%
2Q13 4Q12
4Q13
1Q13 Margin
1Q14
45% EBITDA
Adjusted
2Q12
40%
3Q12
1Q12
35%
1Q12 2Q12 3Q12 4Q12 1Q13 2Q13 3Q13 4Q13 1Q14 2Q14
Revenue Efficiency(5) 88.9% 85.4% 83.1% 94.6% 90.3% 90.2% 96.9% 95.6% 82.7% 97.1%
Adjusted EBITDA Margin(4) 36.7% 40.4% 38.0% 48.3% 45.6% 48.3% 50.0% 48.0% 44.7% 52.7%
Net Opex Per Rig 185.6 174.0 187.8 168.0 178.6 164.0 163.4 176.2 183.8 178.2
NOTES:
Red denotes quarters affected by shakedown of newbuild rigs
14
|
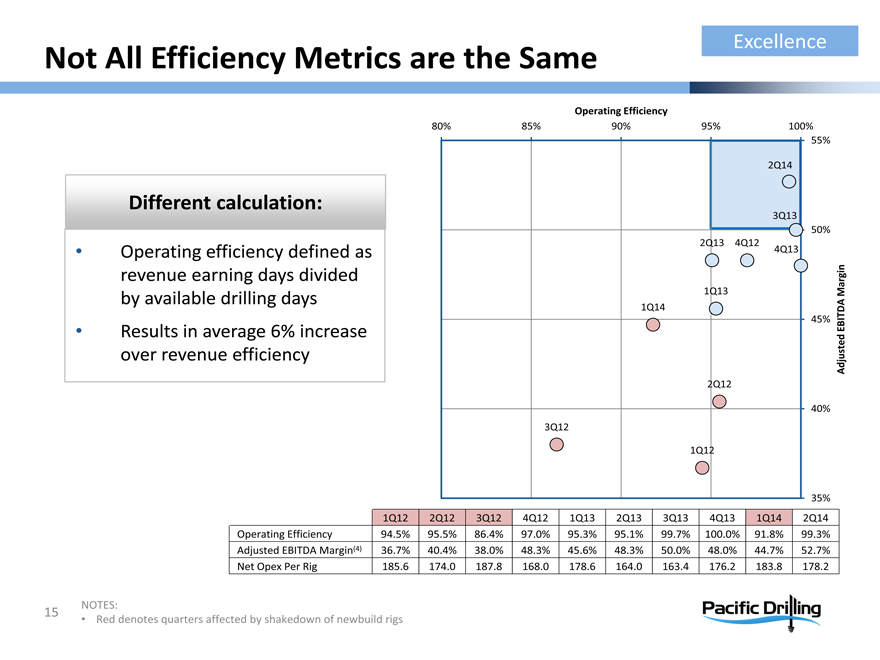
Not All Efficiency Metrics are the Same
Excellence
Different calculation:
Operating efficiency defined as revenue earning days divided by available drilling days
Results in average 6% increase over revenue efficiency
Operating Efficiency
80% 85% 90% 95% 100% 55%
2Q14
3Q13 50% 2Q13 4Q12 4Q13
1Q13 Margin EBITDA
1Q14
45%
Adjusted
2Q12
40% 3Q12 1Q12
35%
1Q12 2Q12 3Q12 4Q12 1Q13 2Q13 3Q13 4Q13 1Q14 2Q14
Operating Efficiency 94.5% 95.5% 86.4% 97.0% 95.3% 95.1% 99.7% 100.0% 91.8% 99.3%
Adjusted EBITDA Margin(4) 36.7% 40.4% 38.0% 48.3% 45.6% 48.3% 50.0% 48.0% 44.7% 52.7%
Net Opex Per Rig 185.6 174.0 187.8 168.0 178.6 164.0 163.4 176.2 183.8 178.2
NOTES:
Red denotes quarters affected by shakedown of newbuild rigs
15
|
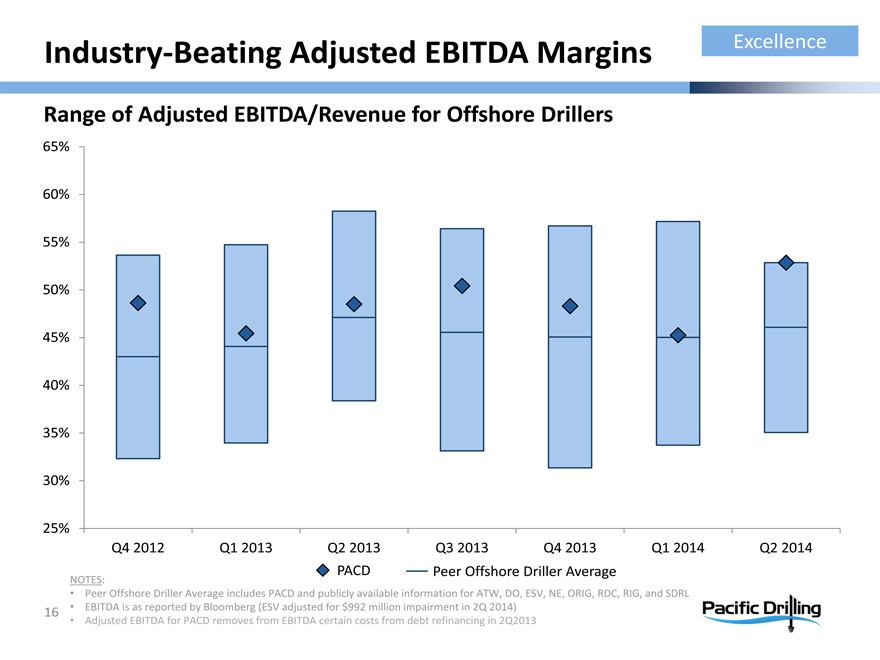
Industry-Beating Adjusted EBITDA Margins
Excellence
Range of Adjusted EBITDA/Revenue for Offshore Drillers
65%
60%
55%
50%
45%
40%
35%
30%
25%
Q4 2012 Q1 2013 Q2 2013 Q3 2013 Q4 2013 Q1 2014 Q2 2014
PACD—Peer Offshore Driller Average
NOTES:
Peer Offshore Driller Average includes PACD and publicly available information for ATW, DO, ESV, NE, ORIG, RDC, RIG, and SDRL
EBITDA is as reported by Bloomberg (ESV adjusted for $992 million impairment in 2Q 2014)
Adjusted EBITDA for PACD removes from EBITDA certain costs from debt refinancing in 2Q2013
16
|
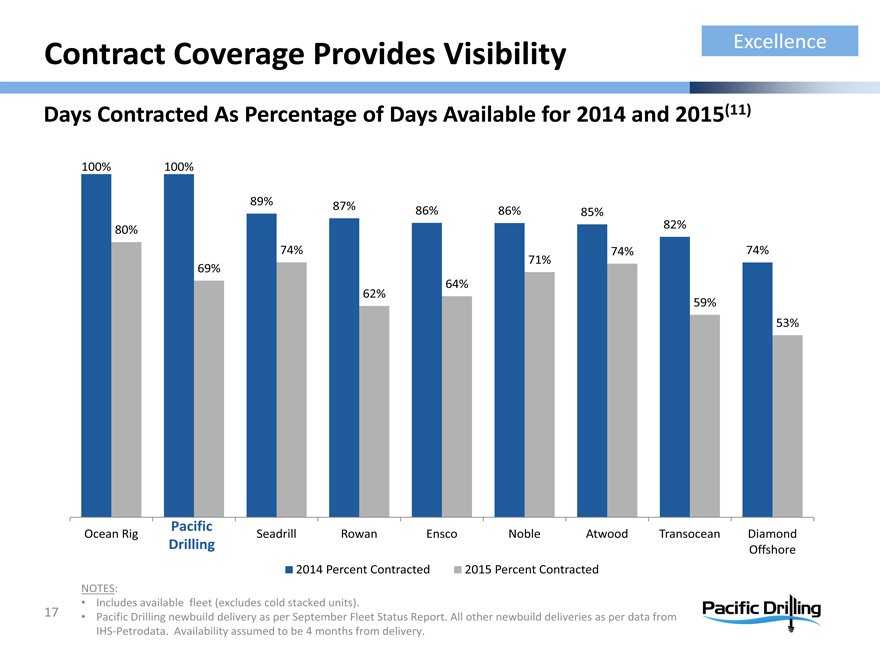
Contract Coverage Provides Visibility
Excellence
Days Contracted As Percentage of Days Available for 2014 and 2015(11)
100% 100%
89% 87% 86% 86%
85%
82% 80%
74% 71% 74% 74% 69% 62% 64% 59% 53%
Pacific
Ocean Rig Drilling Seadrill Rowan Ensco Noble Atwood Transocean Diamond Offshore 2014 Percent Contracted 2015 Percent Contracted
NOTES:
Includes available fleet (excludes cold stacked units).
Pacific Drilling newbuild delivery as per September Fleet Status Report. All other newbuild deliveries as per data from IHS-Petrodata. Availability assumed to be 4 months from delivery.
17
|

Approximately 2 Rig Years Available Through 2015
Excellence
Contract Status as of September 2, 2014
2014 2015 2016
Chevron Nigeria, $475k/d Chevron Nigeria, $586k/d
Pacific Bora
3 year contract 2 year extension
Total Nigeria, $495k/d Total Nigeria, $499k/d
Pacific Scirocco
1 year extension 2 year extension
Petrobras Brazil, $458k/d
Pacific Mistral
3 year contract
Chevron USGoM, $490k/d
Pacific Santa Ana
5 year contract
Chevron Nigeria, $660k/d
Pacific Khamsin
2 year contract
Delivered: Chevron USGoM, $555k/d
Pacific Sharav
May 2014 5 year contract
Expected Delivery:
Pacific Meltem
Late Third Quarter 2014
Pacific Zonda Expected Delivery: First Quarter 2015
Construction Mobilization Firm Contract
18
|
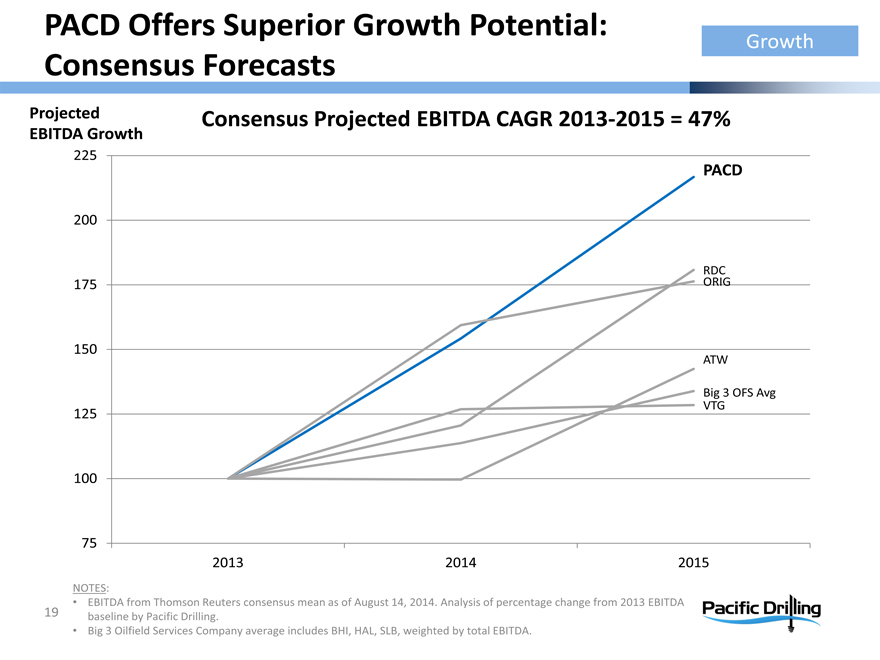
PACD Offers Superior Growth Potential: Consensus Forecasts
Growth
Projected EBITDA Growth
Consensus Projected EBITDA CAGR 2013-2015 = 47%
225
PACD
200
RDC
175 ORIG
150
ATW
Big 3 OFS Avg
VTG
125
100
75 |
|
2013 2014 2015
NOTES:
EBITDA from Thomson Reuters consensus mean as of August 14, 2014. Analysis of percentage change from 2013 EBITDA baseline by Pacific Drilling.
Big 3 Oilfield Services Company average includes BHI, HAL, SLB, weighted by total EBITDA.
19
|
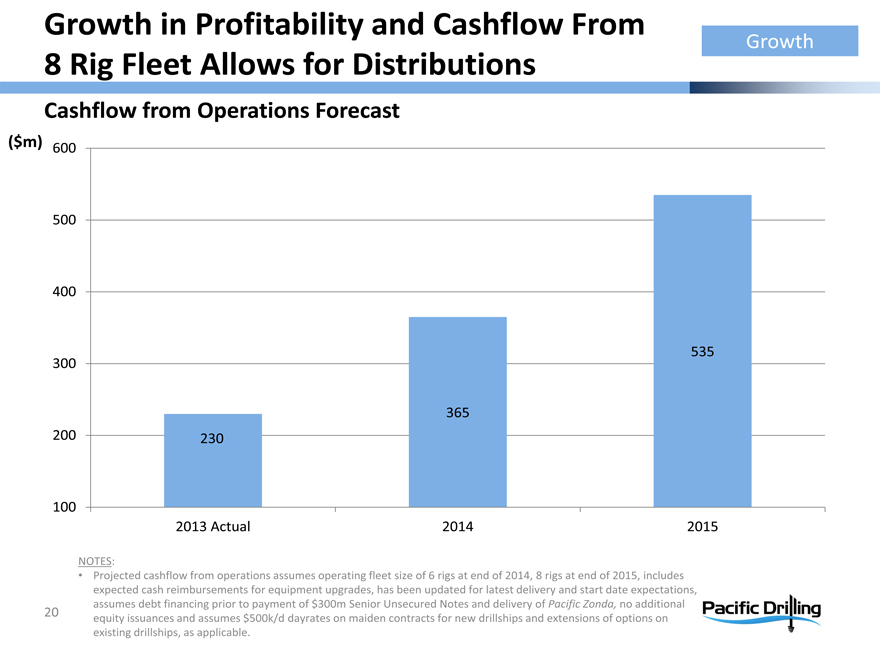
Growth in Profitability and Cashflow From
8 Rig Fleet Allows for Distributions
Growth
Cashflow from Operations Forecast
($m) 600
500
400
300 535
365 200 230
100
2013 Actual 2014 2015
NOTES:
Projected cashflow from operations assumes operating fleet size of 6 rigs at end of 2014, 8 rigs at end of 2015, includes expected cash reimbursements for equipment upgrades, has been updated for latest delivery and start date expectations, assumes debt financing prior to payment of $300m Senior Unsecured Notes and delivery of Pacific Zonda, no additional equity issuances and assumes $500k/d dayrates on maiden contracts for new drillships and extensions of options on existing drillships, as applicable.
20
|
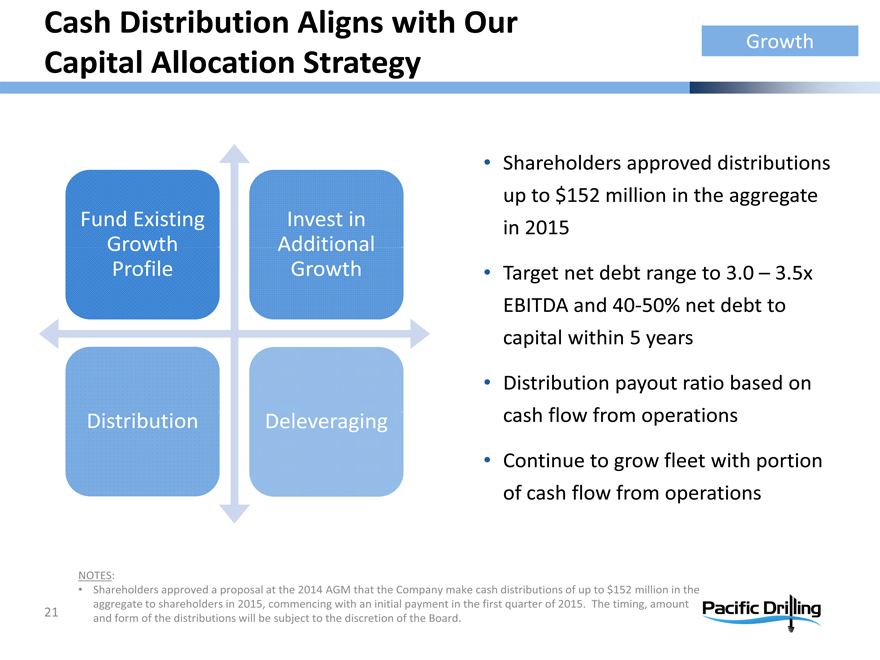
Cash Distribution Aligns with Our Capital Allocation Strategy
Growth
Fund Existing Invest in
Growth Additional
Profile Growth
Distribution Deleveraging
Shareholders approved distributions up to $152 million in the aggregate in 2015
Target net debt range to 3.0 – 3.5x EBITDA and 40-50% net debt to capital within 5 years
Distribution payout ratio based on cash flow from operations
Continue to grow fleet with portion of cash flow from operations
NOTES:
Shareholders approved a proposal at the 2014 AGM that the Company make cash distributions of up to $152 million in the aggregate to shareholders in 2015, commencing with an initial payment in the first quarter of 2015. The timing, amount and form of the distributions will be subject to the discretion of the Board.
21
|

Our Current Priorities and Potential Catalysts
Drilling contracts
Pacific Mistral extension
Pacific Meltem contract
Pacific Zonda contract
Continued excellence in operations
Initiation of cash distributions
22
|
Investor Contact
Pacific Drilling
Amy Roddy
VP Investor Relations
11700 Katy Freeway Suite 175 Houston, Texas 77079 USA
Phone: +1 832-255-0502
Email: Investor@pacificdrilling.com
www.pacificdrilling.com
23
|
Footnotes
1. Closing stock price of $9.77 as of August 26, 2014 and 217.3m shares outstanding.
2. As of September 1, 2014.
3. EBITDA and adjusted EBITDA are non-GAAP measures. EBITDA is defined as earnings before interest, taxes, depreciation and amortization. Adjusted EBITDA is defined as earnings before interest, costs from debt refinancing, loss of hire insurance, taxes, depreciation and amortization. Please refer to the reconciliation attached to this presentation of net income to EBITDA along with a definition and statement indicating why management believes the non-GAAP measure provides useful information for investors.
4. EBITDA margin is defined as EBITDA divided by contract drilling revenue. Adjusted EBITDA margin is defined as adjusted EBITDA divided by contract drilling revenue. Management uses this operational metric to track company results and believes that this measure provides additional information that consolidates the impact of our operating efficiency as well as the operating and support costs incurred in achieving the revenue performance.
5. Revenue efficiency is defined as actual contractual dayrate revenue (excludes mobilization fees, upgrade reimbursements and other revenue sources) divided by the maximum amount of contractual dayrate revenue that could have been earned during a certain period.
6. Utilization data from IHS-Petrodata through June 30, 2014. “2007-Current” adjusted to remove impact of Ocean Courage and Petrobras 10,000 in 2009, which were subject to construction finance issues and unable to work.
7. Rig data from IHS-Petrodata as of July 16, 2014. Rig specification analysis by Pacific Drilling. Rig specification analysis includes weighted average of characteristics which are important to industry clients, including DP class, derrick capacity, top drive capacity, size of main rotary table, number and size of mud pumps, liquid mud capacity, oil capacity, brine capacity, total liquids volume, automation capabilities, riser tensioner capacity, size of quarters, variable deck load, number of cranes and BOP capacity.
8. Rig data from IHS-Petrodata as of August 3, 2014. Analysis by Pacific Drilling using most recent well depth data available for each rig.
9. Rig data from IHS-Petrodata as of August 8, 2014. Analysis by Pacific Drilling. Priced option exercises, sublets and contracts for less than 1 year in duration not included.
10. Supply data from IHS-Petrodata as of July 2014. Demand analysis by Pacific Drilling as of July 2014. Both are weighted by the portion of the year during which either the supply is available or the demand exists. Demand projections should be regarded as our general estimate of forecasted market conditions. Our projections are derived from internal analysis and include uncertainty. Our internal analysis incorporates factors including, but not limited to, known tenders existing in the marketplace, potential future tenders as projected by IHS-Petrodata, perceptions of operator intent derived through marketing discussions, news articles regarding political conditions and potential regulatory developments in deepwater-active countries, and presentations by peers, deepwater operators, and analysts. We label the most likely outcome as the ‘base case.’ The numbers presented on this slide correspond to our ‘base case’. Previous projection as of December 2013.
11. |
| Data from IHS-Petrodata as of August 8, 2014. Analysis by Pacific Drilling. |
24
|
Income Statement
Appendix
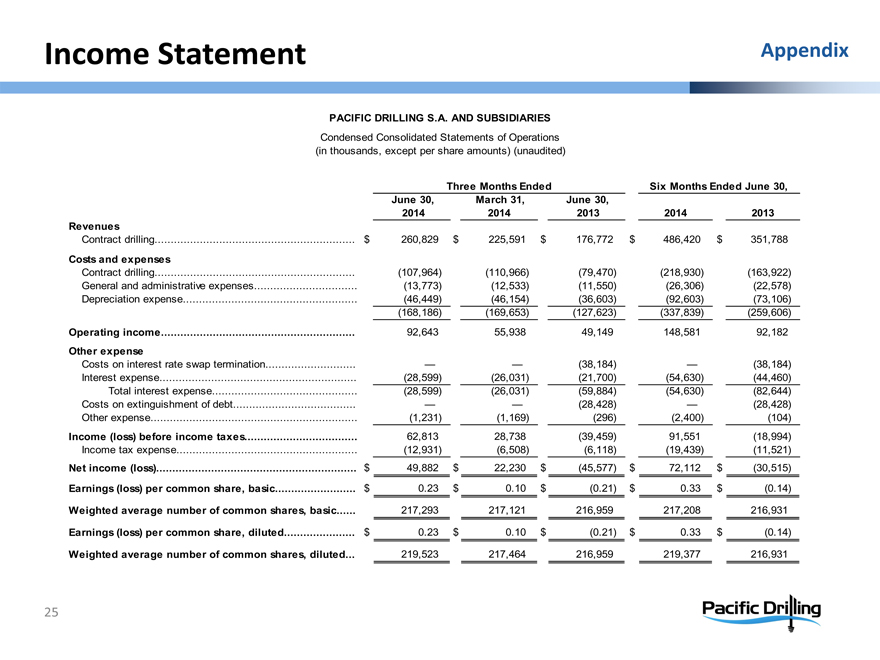
PACIFIC DRILLING S.A. AND SUBSIDIARIES
Condensed Consolidated Statements of Operations (in thousands, except per share amounts) (unaudited)
Three Months Ended Six Months Ended June 30,
June 30, March 31, June 30,
2014 2014 2013 2014 2013
Revenues
Contract drilling $ 260,829 $ 225,591 $ 176,772 $ 486,420 $ 351,788
Costs and expenses
Contract drilling(107,964)(110,966)(79,470)(218,930)(163,922)
General and administrative expenses(13,773)(12,533)(11,550)(26,306)(22,578)
Depreciation expense(46,449)(46,154)(36,603)(92,603)(73,106)
(168,186)(169,653)(127,623)(337,839)(259,606)
Operating income 92,643 55,938 49,149 148,581 92,182
Other expense
Costs on interest rate swap termination — —(38,184) —(38,184)
Interest expense(28,599)(26,031)(21,700)(54,630)(44,460)
Total interest expense(28,599)(26,031)(59,884)(54,630)(82,644)
Costs on extinguishment of debt — —(28,428) —(28,428)
Other expense(1,231)(1,169)(296)(2,400)(104)
Income (loss) before income taxes 62,813 28,738(39,459) 91,551(18,994)
Income tax expense(12,931)(6,508)(6,118)(19,439)(11,521)
Net income (loss) $ 49,882 $ 22,230 $(45,577) $ 72,112 $(30,515)
Earnings (loss) per common share, basic $ 0.23 $ 0.10 $(0.21) $ 0.33 $(0.14)
Weighted average number of common shares, basic 217,293 217,121 216,959 217,208 216,931
Earnings (loss) per common share, diluted $ 0.23 $ 0.10 $(0.21) $ 0.33 $(0.14)
Weighted average number of common shares, diluted 219,523 217,464 216,959 219,377 216,931
25
|
Balance Sheet
Appendix
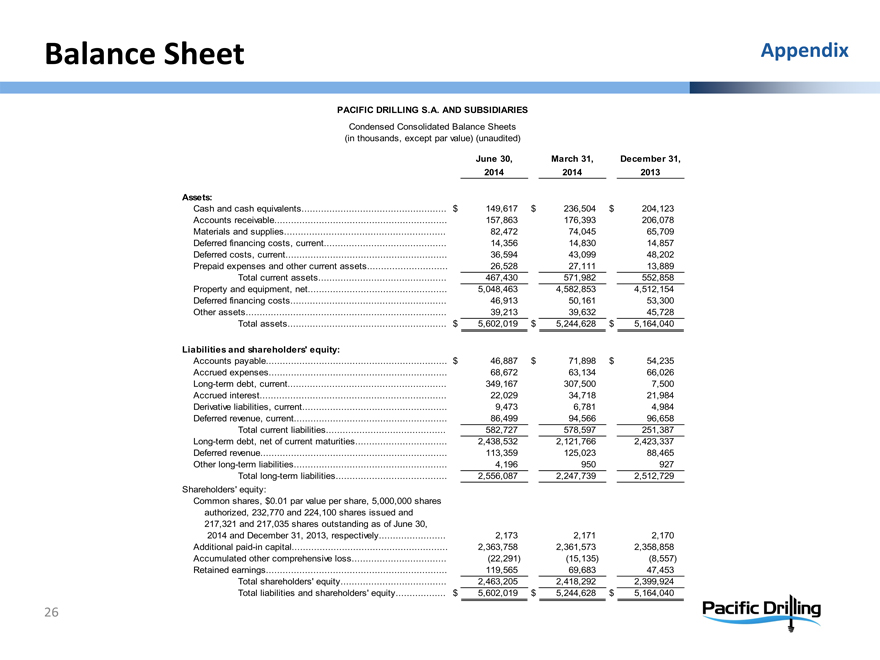
PACIFIC DRILLING S.A. AND SUBSIDIARIES
Condensed Consolidated Balance Sheets (in thousands, except par value) (unaudited)
June 30, March 31, December 31,
2014 2014 2013
Assets:
Cash and cash equivalents $ 149,617 $ 236,504 $ 204,123
Accounts receivable 157,863 176,393 206,078
Materials and supplies 82,472 74,045 65,709
Deferred financing costs, current 14,356 14,830 14,857
Deferred costs, current 36,594 43,099 48,202
Prepaid expenses and other current assets 26,528 27,111 13,889
Total current assets 467,430 571,982 552,858
Property and equipment, net 5,048,463 4,582,853 4,512,154
Deferred financing costs 46,913 50,161 53,300
Other assets 39,213 39,632 45,728
Total assets $ 5,602,019 $ 5,244,628 $ 5,164,040
Liabilities and shareholders’ equity:
Accounts payable $ 46,887 $ 71,898 $ 54,235
Accrued expenses 68,672 63,134 66,026
Long-term debt, current 349,167 307,500 7,500
Accrued interest 22,029 34,718 21,984
Derivative liabilities, current 9,473 6,781 4,984
Deferred revenue, current 86,499 94,566 96,658
Total current liabilities 582,727 578,597 251,387
Long-term debt, net of current maturities 2,438,532 2,121,766 2,423,337
Deferred revenue 113,359 125,023 88,465
Other long-term liabilities 4,196 950 927
Total long-term liabilities 2,556,087 2,247,739 2,512,729
Shareholders’ equity:
Common shares, $0.01 par value per share, 5,000,000 shares
authorized, 232,770 and 224,100 shares issued and
217,321 and 217,035 shares outstanding as of June 30,
2014 and December 31, 2013, respectively 2,173 2,171 2,170
Additional paid-in capital 2,363,758 2,361,573 2,358,858
Accumulated other comprehensive loss(22,291)(15,135)(8,557)
Retained earnings 119,565 69,683 47,453
Total shareholders’ equity 2,463,205 2,418,292 2,399,924
Total liabilities and shareholders’ equity $ 5,602,019 $ 5,244,628 $ 5,164,040
26
|
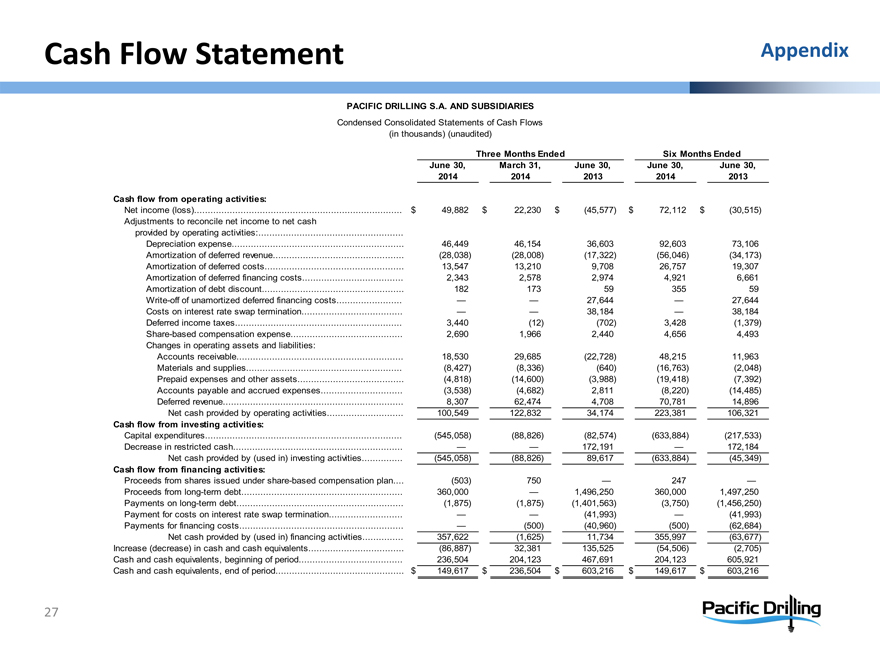
Cash Flow Statement
PACIFIC DRILLING S.A. AND SUBSIDIARIES
Condensed Consolidated Statements of Cash Flows (in thousands) (unaudited)
Three Months Ended Six Months Ended
June 30, March 31, June 30, June 30, June 30,
2014 2014 2013 2014 2013
Cash flow from operating activities:
Net income (loss) $ 49,882 $ 22,230 $(45,577) $ 72,112 $(30,515)
Adjustments to reconcile net income to net cash
provided by operating activities:
Depreciation expense 46,449 46,154 36,603 92,603 73,106
Amortization of deferred revenue(28,038)(28,008)(17,322)(56,046)(34,173)
Amortization of deferred costs 13,547 13,210 9,708 26,757 19,307
Amortization of deferred financing costs 2,343 2,578 2,974 4,921 6,661
Amortization of debt discount 182 173 59 355 59
Write-off of unamortized deferred financing costs — — 27,644 — 27,644
Costs on interest rate swap termination — — 38,184 — 38,184
Deferred income taxes 3,440(12)(702) 3,428(1,379)
Share-based compensation expense 2,690 1,966 2,440 4,656 4,493
Changes in operating assets and liabilities:
Accounts receivable 18,530 29,685(22,728) 48,215 11,963
Materials and supplies(8,427)(8,336)(640)(16,763)(2,048)
Prepaid expenses and other assets(4,818)(14,600)(3,988)(19,418)(7,392)
Accounts payable and accrued expenses(3,538)(4,682) 2,811(8,220)(14,485)
Deferred revenue 8,307 62,474 4,708 70,781 14,896
Net cash provided by operating activities 100,549 122,832 34,174 223,381 106,321
Cash flow from investing activities:
Capital expenditures(545,058)(88,826)(82,574)(633,884)(217,533)
Decrease in restricted cash — — 172,191 — 172,184
Net cash provided by (used in) investing activities(545,058)(88,826) 89,617(633,884)(45,349)
Cash flow from financing activities:
Proceeds from shares issued under share-based compensation plan(503) 750 — 247 —
Proceeds from long-term debt 360,000 — 1,496,250 360,000 1,497,250
Payments on long-term debt(1,875)(1,875)(1,401,563)(3,750)(1,456,250)
Payment for costs on interest rate swap termination — —(41,993) —(41,993)
Payments for financing costs —(500)(40,960)(500)(62,684)
Net cash provided by (used in) financing activities 357,622(1,625) 11,734 355,997(63,677)
Increase (decrease) in cash and cash equivalents(86,887) 32,381 135,525(54,506)(2,705)
Cash and cash equivalents, beginning of period 236,504 204,123 467,691 204,123 605,921
Cash and cash equivalents, end of period $ 149,617 $ 236,504 $ 603,216 $ 149,617 $ 603,216
27
|
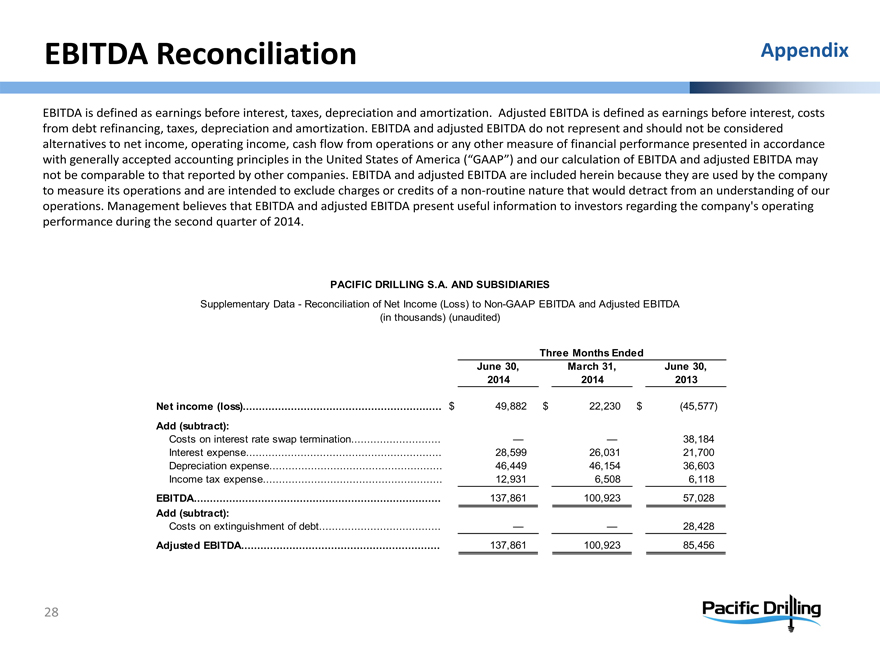
EBITDA Reconciliation
Appendix
EBITDA is defined as earnings before interest, taxes, depreciation and amortization. Adjusted EBITDA is defined as earnings before interest, costs from debt refinancing, taxes, depreciation and amortization. EBITDA and adjusted EBITDA do not represent and should not be considered alternatives to net income, operating income, cash flow from operations or any other measure of financial performance presented in accordance with generally accepted accounting principles in the United States of America (“GAAP”) and our calculation of EBITDA and adjusted EBITDA may not be comparable to that reported by other companies. EBITDA and adjusted EBITDA are included herein because they are used by the company to measure its operations and are intended to exclude charges or credits of a non-routine nature that would detract from an understanding of our operations. Management believes that EBITDA and adjusted EBITDA present useful information to investors regarding the company’s operating performance during the second quarter of 2014.
PACIFIC DRILLING S.A. AND SUBSIDIARIES
Supplementary Data-Reconciliation of Net Income (Loss) to Non-GAAP EBITDA and Adjusted EBITDA (in thousands) (unaudited)
Three Months Ended
June 30, March 31, June 30,
2014 2014 2013
Net income (loss) $ 49,882 $ 22,230 $(45,577)
Add (subtract):
Costs on interest rate swap termination — — 38,184
Interest expense 28,599 26,031 21,700
Depreciation expense 46,449 46,154 36,603
Income tax expense 12,931 6,508 6,118
EBITDA 137,861 100,923 57,028
Add (subtract):
Costs on extinguishment of debt — — 28,428
Adjusted EBITDA 137,861 100,923 85,456
28
|
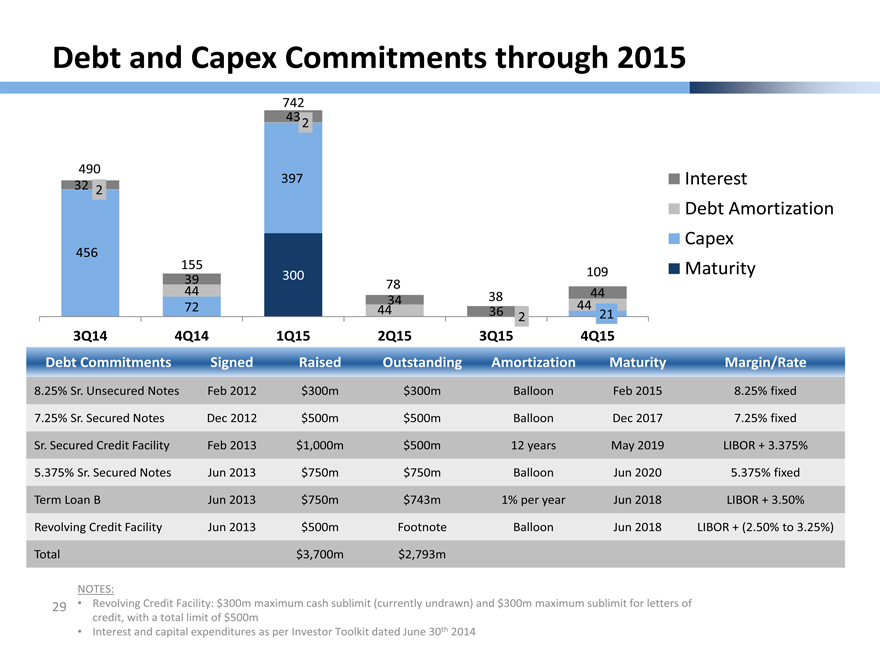
Debt and Capex Commitments through 2015
742
43 |
| 2 |
490
397
32 |
| 2 |
456
155
39 |
| 300 109 |
78 |
|
44 |
| 34 38 44 |
72 |
| 44 36 2 44 21 |
3Q14 4Q14 1Q15 2Q15 3Q15 4Q15
Interest
Debt Amortization Capex Maturity
Debt Commitments Signed Raised Outstanding Amortization Maturity Margin/Rate
8.25% Sr. Unsecured Notes Feb 2012 $300m $300m Balloon Feb 2015 8.25% fixed
7.25% Sr. Secured Notes Dec 2012 $500m $500m Balloon Dec 2017 7.25% fixed
Sr. Secured Credit Facility Feb 2013 $1,000m $500m 12 years May 2019 LIBOR + 3.375%
5.375% Sr. Secured Notes Jun 2013 $750m $750m Balloon Jun 2020 5.375% fixed
Term Loan B Jun 2013 $750m $743m 1% per year Jun 2018 LIBOR + 3.50%
Revolving Credit Facility Jun 2013 $500m Footnote Balloon Jun 2018 LIBOR + (2.50% to 3.25%)
Total $3,700m $2,793m
NOTES:
Revolving Credit Facility: $300m maximum cash sublimit (currently undrawn) and $300m maximum sublimit for letters of credit, with a total limit of $500m
Interest and capital expenditures as per Investor Toolkit dated June 30th 2014
29