
Investor Presentation September 6, 2016

Certain statements and information contained in this presentation constitute “forward-looking statements” within the meaning of the safe harbor provisions of the Private Securities Litigation Reform Act of 1995, and are generally identifiable by the use of words such as “believe,” “estimate,” “expect,” “forecast,” “our ability to,” “plan,” “potential,” “projected,” “target,” “would,” or other similar words, which are generally not historical in nature. The forward-looking statements speak only as of the date hereof, and we undertake no obligation to publicly update or revise any forward-looking statements after the date they are made, whether as a result of new information, future events or otherwise. Our forward-looking statements express our current expectations or forecasts of possible future results or events, including: future financial and operational performance; earnings expectations; revenue efficiency levels; market outlook; forecasts of trends; future client contract opportunities; contract dayrates; our business strategies and plans and objectives of management; estimated duration of client contracts; backlog; expected capital expenditures and projected costs and savings. Although we believe that the assumptions and expectations reflected in our forward-looking statements are reasonable and made in good faith, these statements are not guarantees and actual future results may differ materially due to a variety of factors. These statements are subject to a number of risks and uncertainties, many of which are beyond our control. Important factors that could cause actual results to differ materially from our expectations include: the global oil and gas market and its impact on demand for our services; the offshore drilling market, including reduced capital expenditures by our clients; changes in worldwide oil and gas supply and demand; rig availability and supply and demand for high- specification drillships and other drilling rigs competing with our fleet; costs related to stacking of rigs; our ability to enter into and negotiate favorable terms for new drilling contracts or extensions; our substantial level of indebtedness; possible cancellation, renegotiation, termination or suspension of drilling contracts as a result of market changes or other reasons; and the other risk factors described in our filings with the Securities and Exchange Commission (SEC), including our Annual Report on Form 20-F and Current Reports on Form 6-K. These documents are available through our website at www.pacificdrilling.com or through the SEC’s website at www.sec.gov. The terms “Adjusted EBITDA” and “Adjusted EBITDA Margin” used in this presentation are non–GAAP financial measures, and the reconciliations to the most comparable GAAP financial measures are available on our website at www.pacificdrilling.com. Forward Looking Statements
• Pacific Drilling at a Glance • Rig Market Drivers and Expectations • Pacific Drilling Performance • In Summary 3 Topics
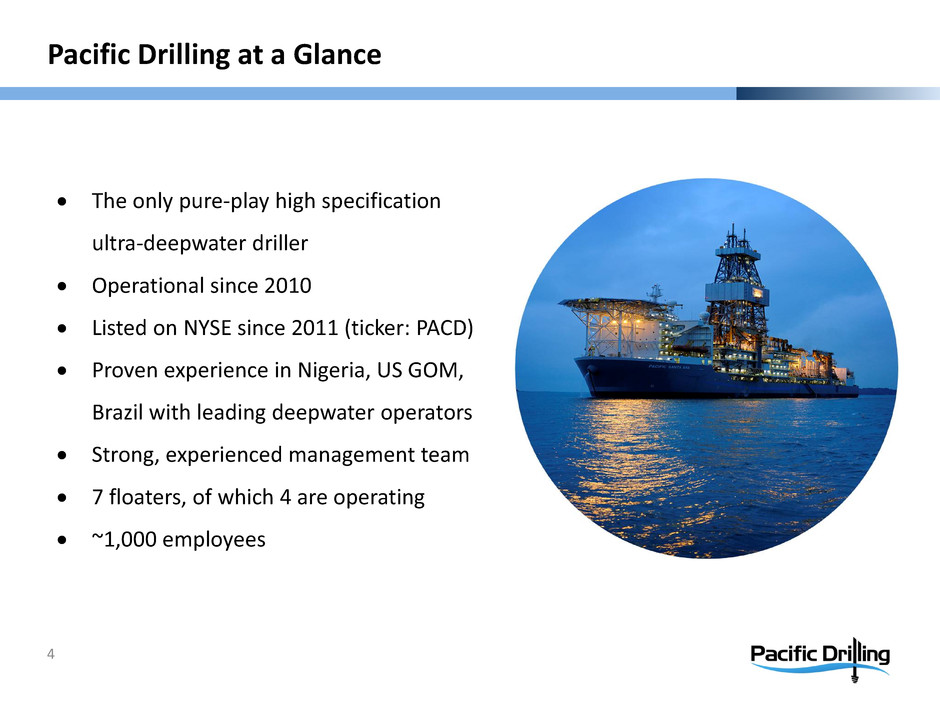
4 • The only pure-play high specification ultra-deepwater driller • Operational since 2010 • Listed on NYSE since 2011 (ticker: PACD) • Proven experience in Nigeria, US GOM, Brazil with leading deepwater operators • Strong, experienced management team • 7 floaters, of which 4 are operating • ~1,000 employees Pacific Drilling at a Glance

Rig Market Drivers and Expectations 5
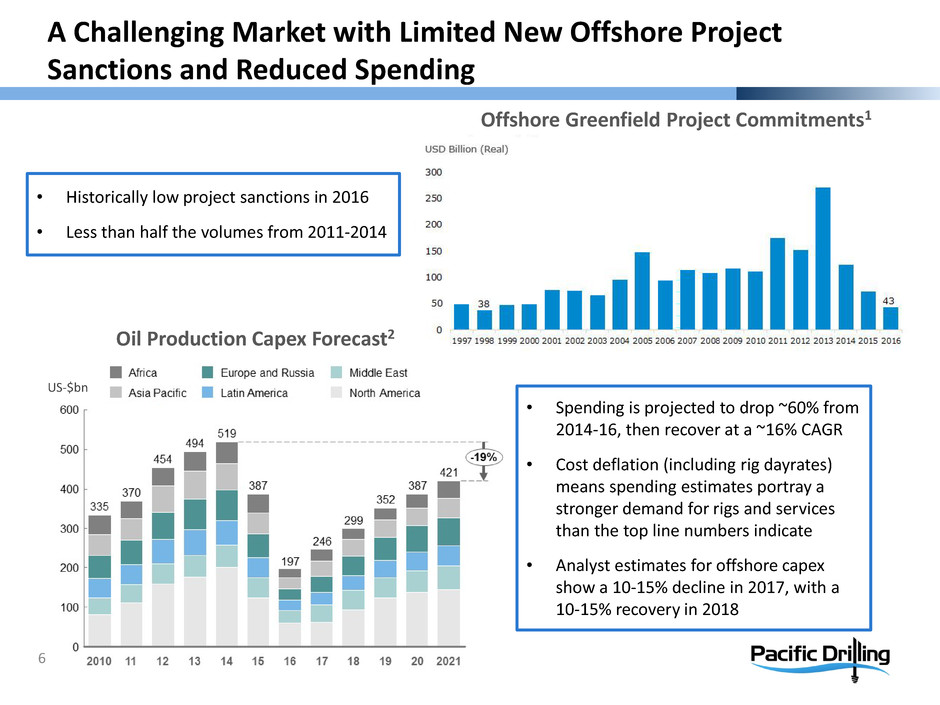
Oil Production Capex Forecast2 Offshore Greenfield Project Commitments1 • Historically low project sanctions in 2016 • Less than half the volumes from 2011-2014 A Challenging Market with Limited New Offshore Project Sanctions and Reduced Spending 6 • Spending is projected to drop ~60% from 2014-16, then recover at a ~16% CAGR • Cost deflation (including rig dayrates) means spending estimates portray a stronger demand for rigs and services than the top line numbers indicate • Analyst estimates for offshore capex show a 10-15% decline in 2017, with a 10-15% recovery in 2018 US-$bn
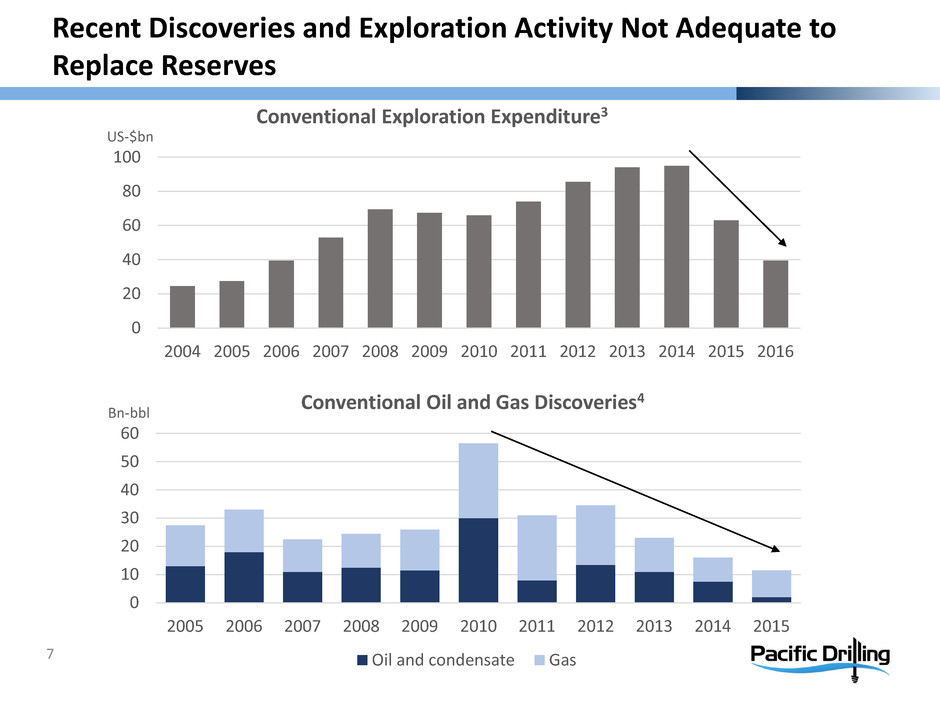
Recent Discoveries and Exploration Activity Not Adequate to Replace Reserves 7 Conventional Oil and Gas Discoveries4 Bn-bbl US-$bn Conventional Exploration Expenditure3 0 10 20 30 40 50 60 2005 2006 2007 2008 2009 2010 2011 2012 2013 2014 2015 Oil and condensate Gas 0 20 40 60 80 100 2004 2005 2006 2007 2008 2009 2010 2011 2012 2013 2014 2015 2016
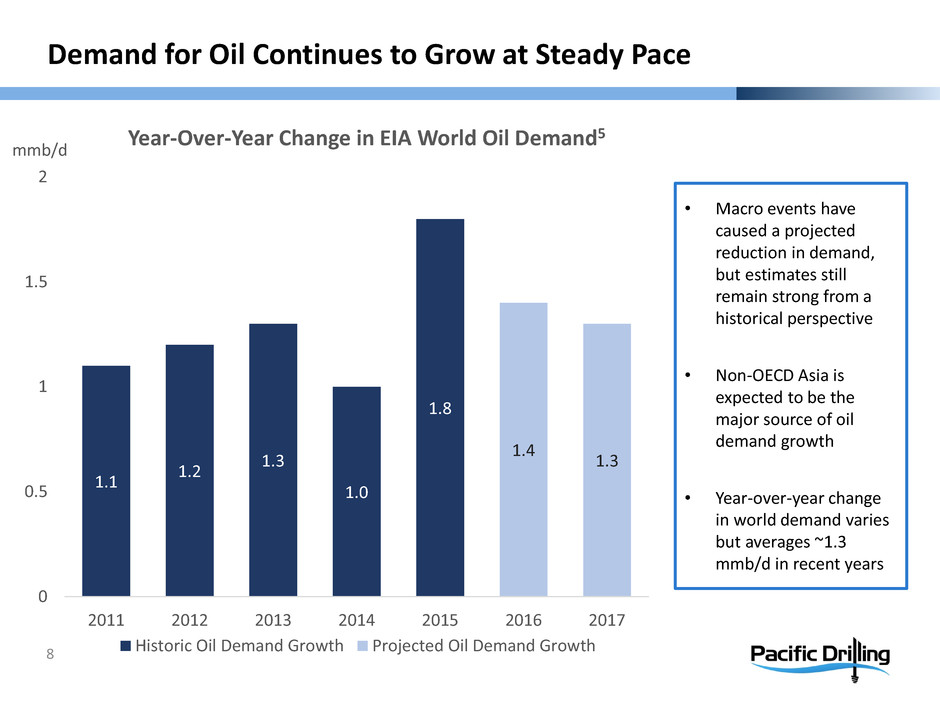
mmb/d 1.1 1.2 1.3 1.0 1.8 1.4 1.3 0 0.5 1 1.5 2 2011 2012 2013 2014 2015 2016 2017 Year-Over-Year Change in EIA World Oil Demand5 Historic Oil Demand Growth Projected Oil Demand Growth • Macro events have caused a projected reduction in demand, but estimates still remain strong from a historical perspective • Non-OECD Asia is expected to be the major source of oil demand growth • Year-over-year change in world demand varies but averages ~1.3 mmb/d in recent years Demand for Oil Continues to Grow at Steady Pace 8
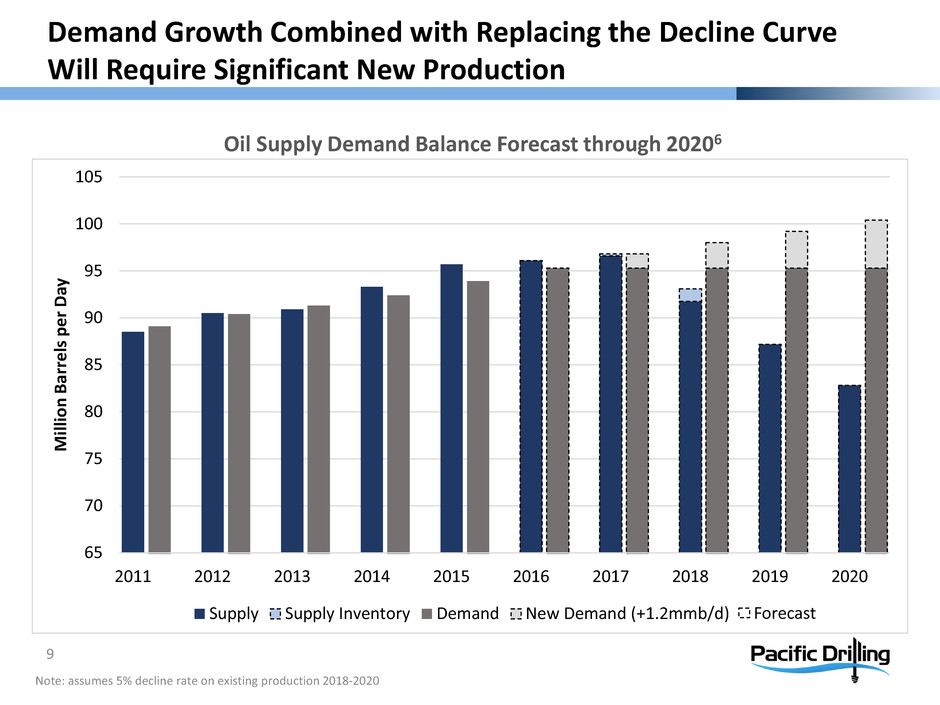
Oil Supply Demand Balance Forecast through 20206 65 70 75 80 85 90 95 100 105 2011 2012 2013 2014 2015 2016 2017 2018 2019 2020 M ill io n B ar re ls p er D ay Supply Supply Inventory Demand New Demand (+1.2mmb/d) Forecast Note: assumes 5% decline rate on existing production 2018-2020 Demand Growth Combined with Replacing the Decline Curve Will Require Significant New Production 9
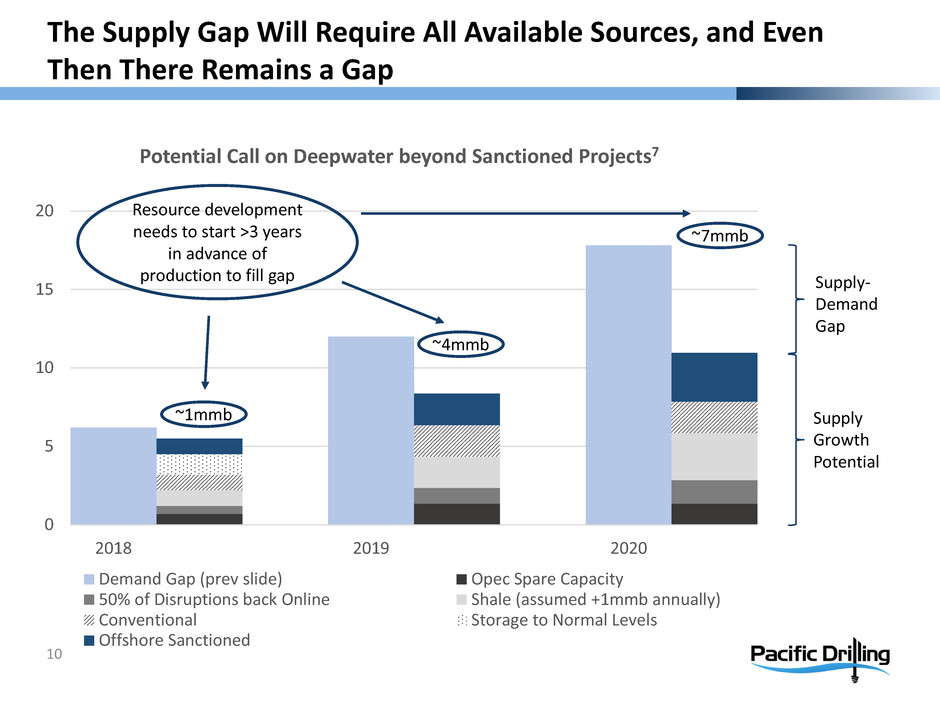
0 5 10 15 20 2018 2019 2020 Potential Call on Deepwater beyond Sanctioned Projects7 Demand Gap (prev slide) Opec Spare Capacity 50% of Disruptions back Online Shale (assumed +1mmb annually) Conventional Storage to Normal Levels Offshore Sanctioned ~1mmb Resource development needs to start >3 years in advance of production to fill gap Supply Growth Potential Supply- Demand Gap The Supply Gap Will Require All Available Sources, and Even Then There Remains a Gap 10 ~4mmb ~7mmb
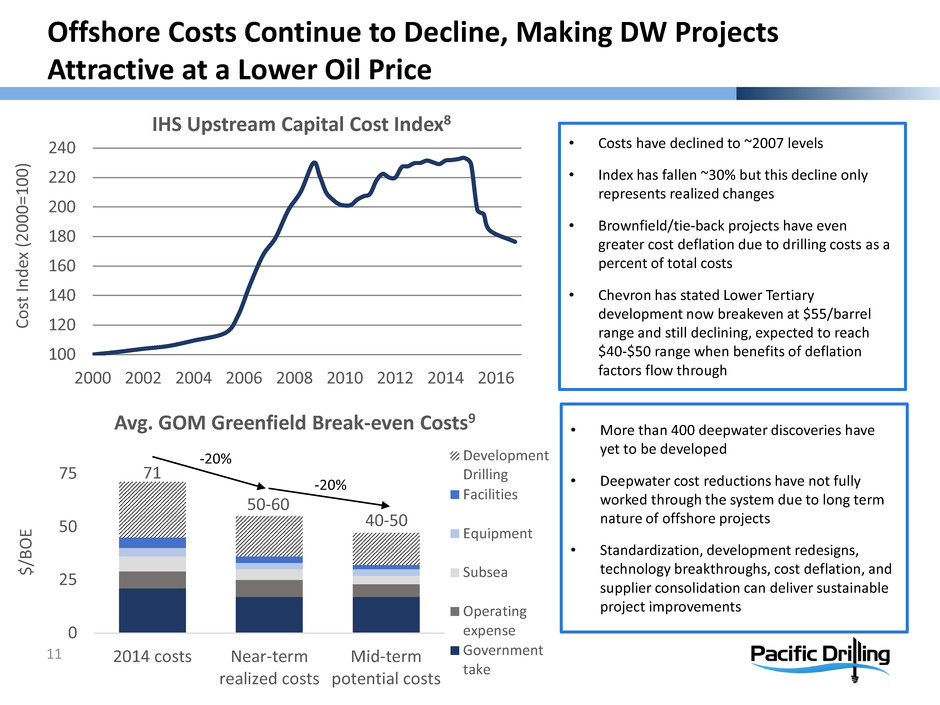
0 25 50 75 2014 costs Near-term realized costs Mid-term potential costs Avg. GOM Greenfield Break-even Costs9 Development Drilling Facilities Equipment Subsea Operating expense Government take • Costs have declined to ~2007 levels • Index has fallen ~30% but this decline only represents realized changes • Brownfield/tie-back projects have even greater cost deflation due to drilling costs as a percent of total costs • Chevron has stated Lower Tertiary development now breakeven at $55/barrel range and still declining, expected to reach $40-$50 range when benefits of deflation factors flow through • More than 400 deepwater discoveries have yet to be developed • Deepwater cost reductions have not fully worked through the system due to long term nature of offshore projects • Standardization, development redesigns, technology breakthroughs, cost deflation, and supplier consolidation can deliver sustainable project improvements Offshore Costs Continue to Decline, Making DW Projects Attractive at a Lower Oil Price 11 100 120 140 160 180 200 220 240 2000 2002 2004 2006 2008 2010 2012 2014 2016 IHS Upstream Capital Cost Index8 Co st In de x (2 00 0= 10 0) $/ BO E 71 50-60 40-50 -20% -20%
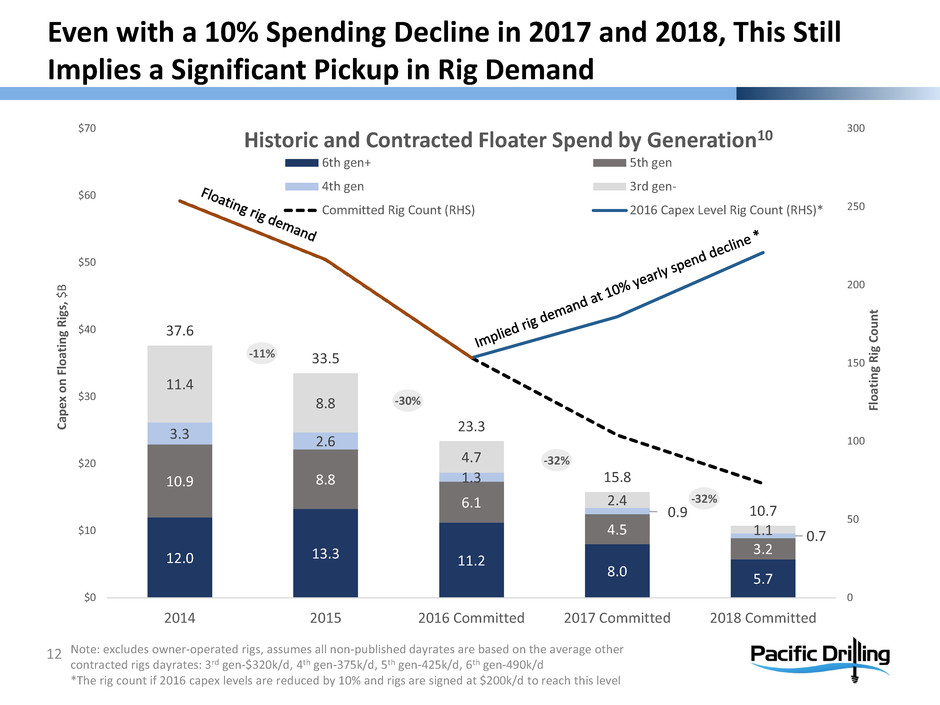
12.0 13.3 11.2 8.0 5.7 10.9 8.8 6.1 4.5 3.2 3.3 2.6 1.3 0.9 0.7 11.4 8.8 4.7 2.4 1.1 37.6 33.5 23.3 15.8 10.7 0 50 100 150 200 250 300 $0 $10 $20 $30 $40 $50 $60 $70 2014 2015 2016 Committed 2017 Committed 2018 Committed Historic and Contracted Floater Spend by Generation10 6th gen+ 5th gen 4th gen 3rd gen- Committed Rig Count (RHS) 2016 Capex Level Rig Count (RHS)* -32% Note: excludes owner-operated rigs, assumes all non-published dayrates are based on the average other contracted rigs dayrates: 3rd gen-$320k/d, 4th gen-375k/d, 5th gen-425k/d, 6th gen-490k/d *The rig count if 2016 capex levels are reduced by 10% and rigs are signed at $200k/d to reach this level -11% -30% -32% Ca pe x on F lo at in g R ig s, $ B Fl oa ti ng R ig C ou nt Even with a 10% Spending Decline in 2017 and 2018, This Still Implies a Significant Pickup in Rig Demand 12
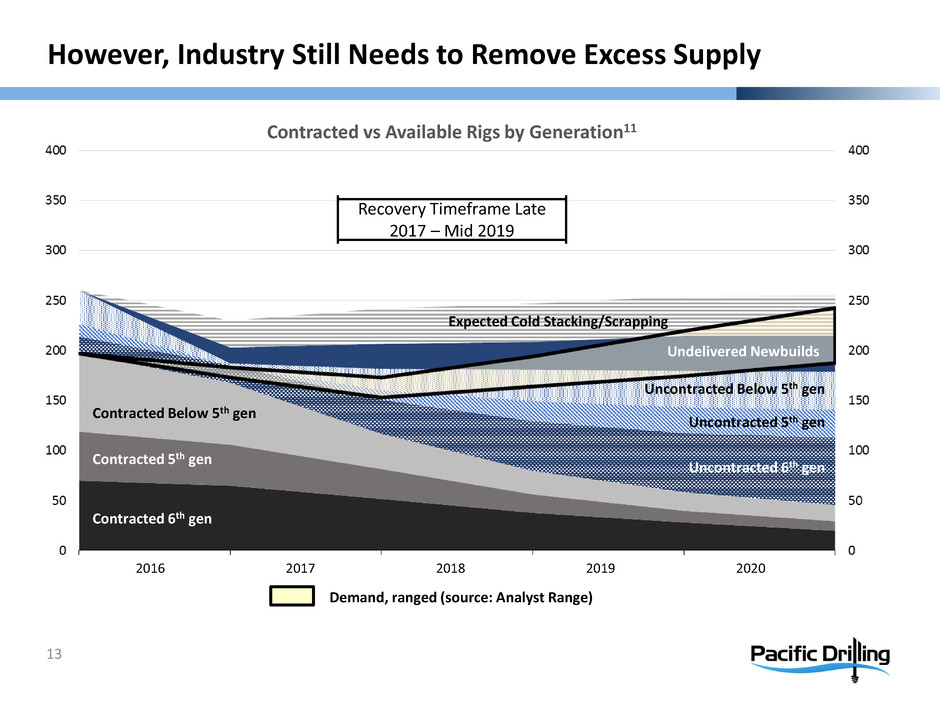
8 Contracted vs Available Rigs by Generation11 Contracted 6th gen Contracted 5th gen Contracted Below 5th gen Demand, ranged (source: Analyst Range) 2016 2017 2018 2019 2020 Uncontracted 6th gen Uncontracted 5th gen Uncontracted Below 5th gen Expected Cold Stacking/Scrapping Undelivered Newbuilds 13 However, Industry Still Needs to Remove Excess Supply Recovery Timeframe Late 2017 – Mid 2019

8 Contracted vs Available Rigs by Generation11 Contracted 6th gen Contracted 5th gen Contracted Below 5th gen Demand, ranged (source: Analyst Range) 2016 2017 2018 2019 2020 Recovery Timeframe Late 2017 – Mid 2019 Note: marketed utilization of 88% excludes undelivered newbuilds Uncontracted 6th gen Uncontracted 5th gen Uncontracted Below 5th gen Undelivered Newbuilds 88% marketed utilization Mid Demand Low DemandHigh Demand 14 But Path to Supply-Demand Balance Is Visible X X X X
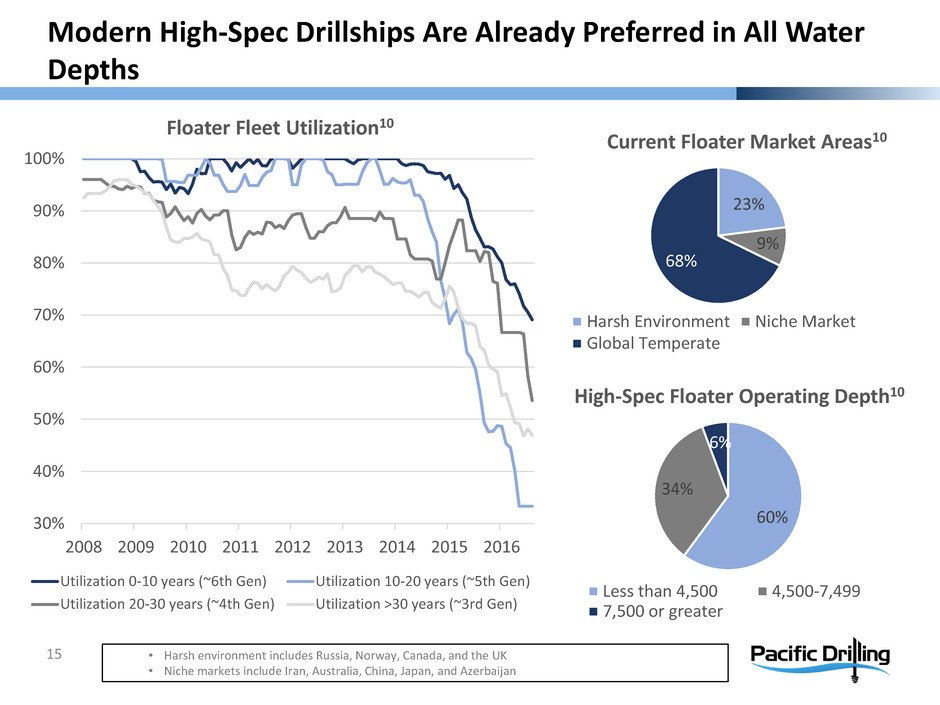
• Harsh environment includes Russia, Norway, Canada, and the UK • Niche markets include Iran, Australia, China, Japan, and Azerbaijan Floater Fleet Utilization10 60% 34% 6% High-Spec Floater Operating Depth10 Less than 4,500 4,500-7,499 7,500 or greater 23% 9% 68% Current Floater Market Areas10 Harsh Environment Niche Market Global Temperate 30% 40% 50% 60% 70% 80% 90% 100% 2008 2009 2010 2011 2012 2013 2014 2015 2016 Utilization 0-10 years (~6th Gen) Utilization 10-20 years (~5th Gen) Utilization 20-30 years (~4th Gen) Utilization >30 years (~3rd Gen) Modern High-Spec Drillships Are Already Preferred in All Water Depths 15

0 40 80 120 160 200 240 280 320 0 5 10 15 20 25 30 35 40 1970 1975 1980 1985 1990 1995 2000 2005 2010 2015 2020 Floater Fleet by Delivery Year12 Removed From Fleet Total Floater Fleet (RHS) # of Rigs Delivered Total # of Floaters in Fleet Lots of Old Rigs Have Already Left the Market and More Will Follow 16

Projected Floater Fleet Changes 12 Note: Cold stacking is assumed after a rig is stacked for more than six months or after announced 103 49 15 40 End of 201812 92 79 34 150 2015 Peak Fleet12 -100 -80 -60 -40 -20 0 20 40 Prior Scrapped Prior Cold Stacked 2016 2017 2018 Abs. Growth % Change 6th Gen + 11 11% 5th Gen -31 -39% 4th Gen -19 -55% 3rd Gen - -111 -74% Additions include 40 newbuilds (7 with Sete) to be delivered through 2018, though we believe all are at risk for delays and some for cancellation A dd it io ns Re m ov al s (355) (206) And the Fleet Will Look Very Different in 2018 17
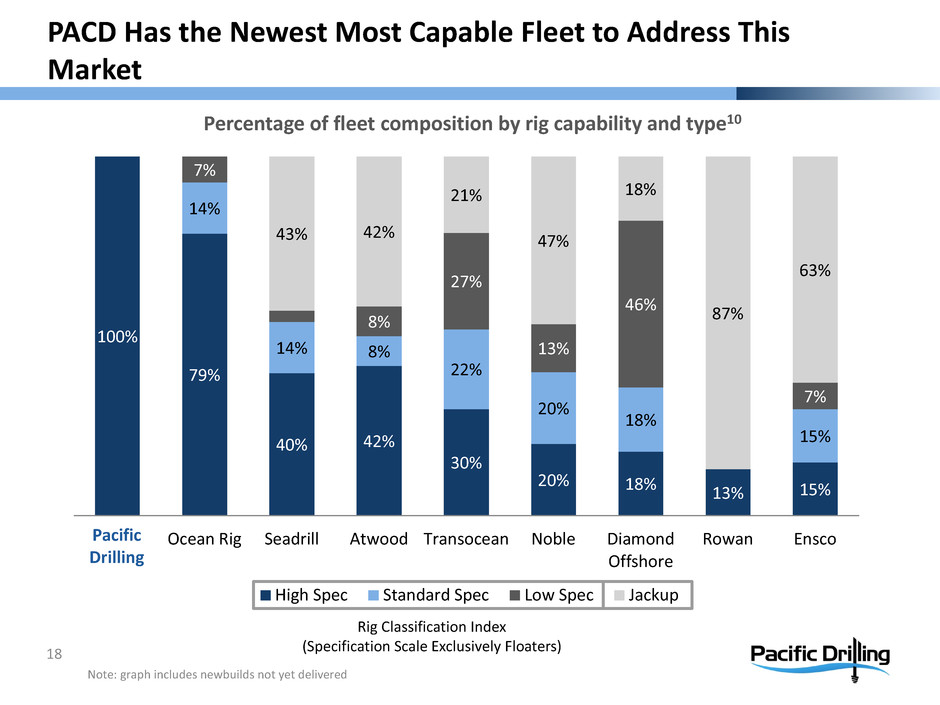
100% 79% 40% 42% 30% 20% 18% 13% 15% 14% 14% 8% 22% 20% 18% 15% 7% 8% 27% 13% 46% 7% 43% 42% 21% 47% 18% 87% 63% Pacific Drilling Ocean Rig Seadrill Atwood Transocean Noble Diamond Offshore Rowan Ensco High Spec Standard Spec Low Spec Jackup Note: graph includes newbuilds not yet delivered Percentage of fleet composition by rig capability and type10 Pacific Drilling Rig Classification Index (Specification Scale Exclusively Floaters) PACD Has the Newest Most Capable Fleet to Address This Market 18

Pacific Drilling Performance 19
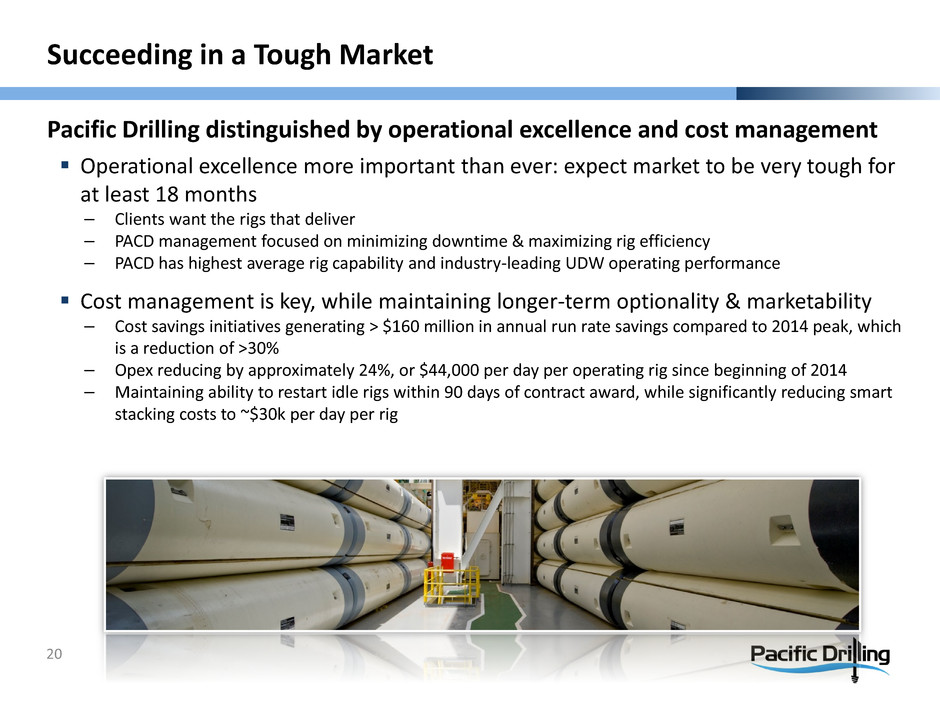
Pacific Drilling distinguished by operational excellence and cost management Operational excellence more important than ever: expect market to be very tough for at least 18 months – Clients want the rigs that deliver – PACD management focused on minimizing downtime & maximizing rig efficiency – PACD has highest average rig capability and industry-leading UDW operating performance Cost management is key, while maintaining longer-term optionality & marketability – Cost savings initiatives generating > $160 million in annual run rate savings compared to 2014 peak, which is a reduction of >30% – Opex reducing by approximately 24%, or $44,000 per day per operating rig since beginning of 2014 – Maintaining ability to restart idle rigs within 90 days of contract award, while significantly reducing smart stacking costs to ~$30k per day per rig Succeeding in a Tough Market 20
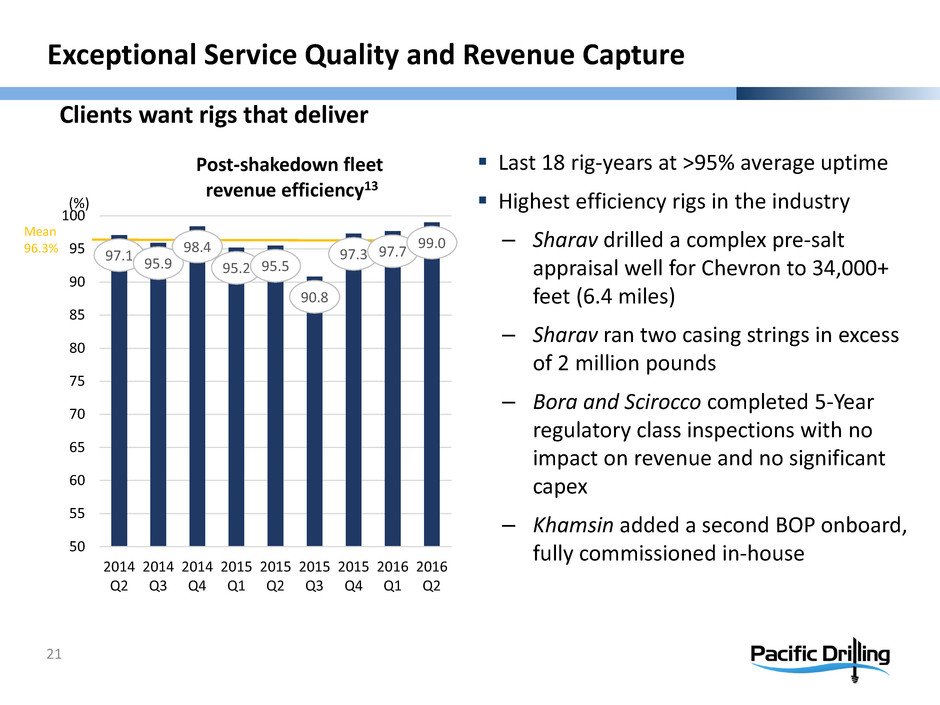
97.1 95.9 98.4 95.2 95.5 90.8 97.3 97.7 99.0 50 55 60 65 70 75 80 85 90 95 100 2014 Q2 2014 Q3 2014 Q4 2015 Q1 2015 Q2 2015 Q3 2015 Q4 2016 Q1 2016 Q2 Post-shakedown fleet revenue efficiency13 (%) Clients want rigs that deliver Mean 96.3% Exceptional Service Quality and Revenue Capture 21 Last 18 rig-years at >95% average uptime Highest efficiency rigs in the industry – Sharav drilled a complex pre-salt appraisal well for Chevron to 34,000+ feet (6.4 miles) – Sharav ran two casing strings in excess of 2 million pounds – Bora and Scirocco completed 5-Year regulatory class inspections with no impact on revenue and no significant capex – Khamsin added a second BOP onboard, fully commissioned in-house
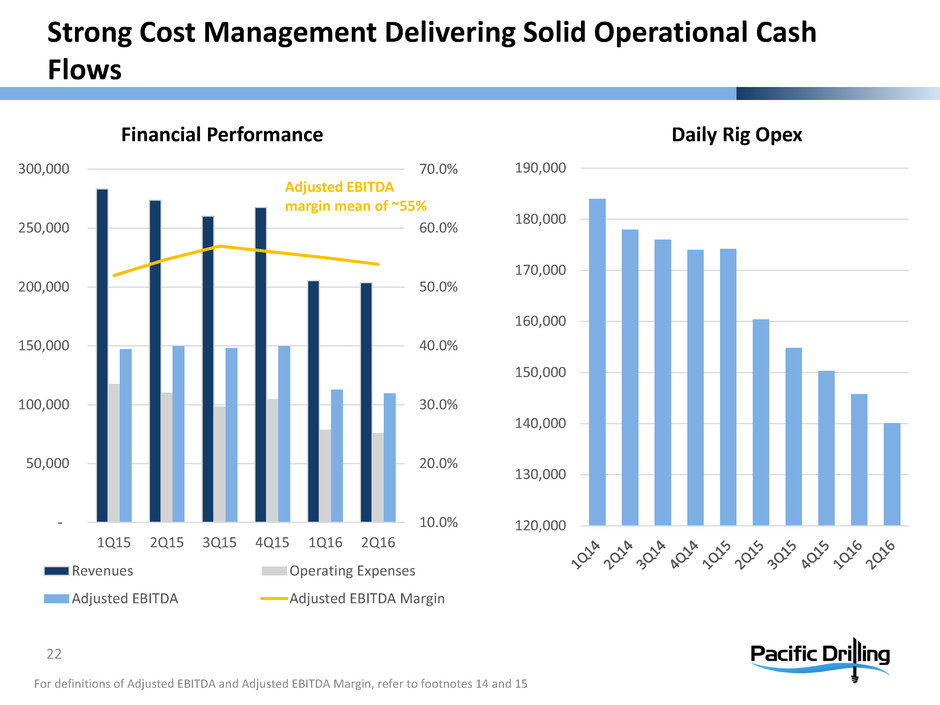
10.0% 20.0% 30.0% 40.0% 50.0% 60.0% 70.0% - 50,000 100,000 150,000 200,000 250,000 300,000 1Q15 2Q15 3Q15 4Q15 1Q16 2Q16 Revenues Operating Expenses Adjusted EBITDA Adjusted EBITDA Margin 120,000 130,000 140,000 150,000 160,000 170,000 180,000 190,000 For definitions of Adjusted EBITDA and Adjusted EBITDA Margin, refer to footnotes 14 and 15 Strong Cost Management Delivering Solid Operational Cash Flows 22 Financial Performance Daily Rig Opex Adjusted EBITDA margin mean of ~55%
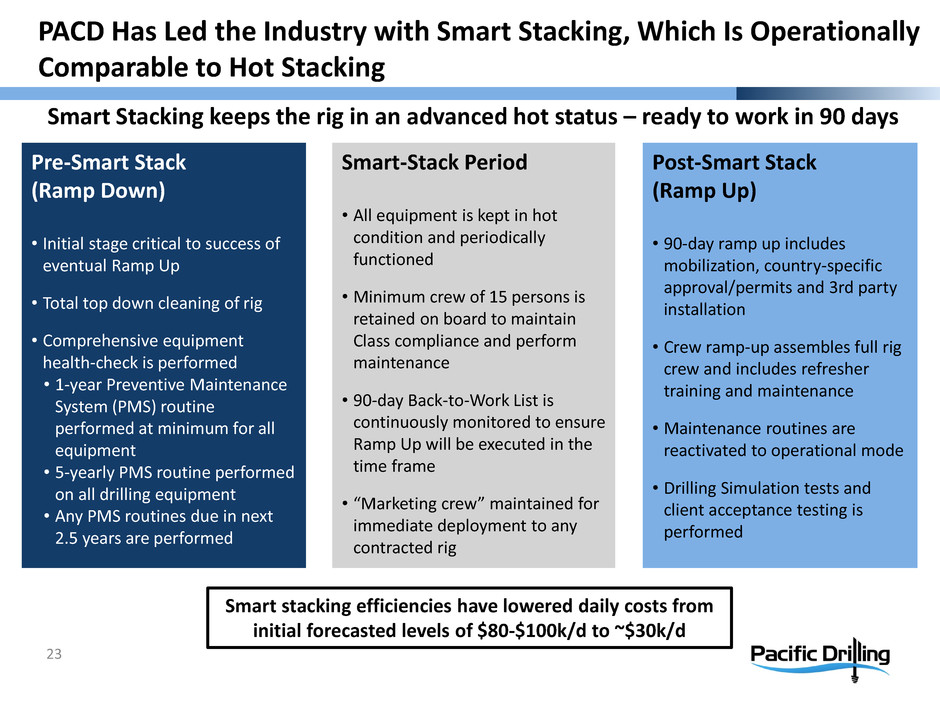
PACD Has Led the Industry with Smart Stacking, Which Is Operationally Comparable to Hot Stacking 23 Pre-Smart Stack (Ramp Down) • Initial stage critical to success of eventual Ramp Up • Total top down cleaning of rig • Comprehensive equipment health-check is performed • 1-year Preventive Maintenance System (PMS) routine performed at minimum for all equipment • 5-yearly PMS routine performed on all drilling equipment • Any PMS routines due in next 2.5 years are performed Smart Stacking keeps the rig in an advanced hot status – ready to work in 90 days Smart stacking efficiencies have lowered daily costs from initial forecasted levels of $80-$100k/d to ~$30k/d Smart-Stack Period • All equipment is kept in hot condition and periodically functioned • Minimum crew of 15 persons is retained on board to maintain Class compliance and perform maintenance • 90-day Back-to-Work List is continuously monitored to ensure Ramp Up will be executed in the time frame • “Marketing crew” maintained for immediate deployment to any contracted rig Post-Smart Stack (Ramp Up) • 90-day ramp up includes mobilization, country-specific approval/permits and 3rd party installation • Crew ramp-up assembles full rig crew and includes refresher training and maintenance • Maintenance routines are reactivated to operational mode • Drilling Simulation tests and client acceptance testing is performed
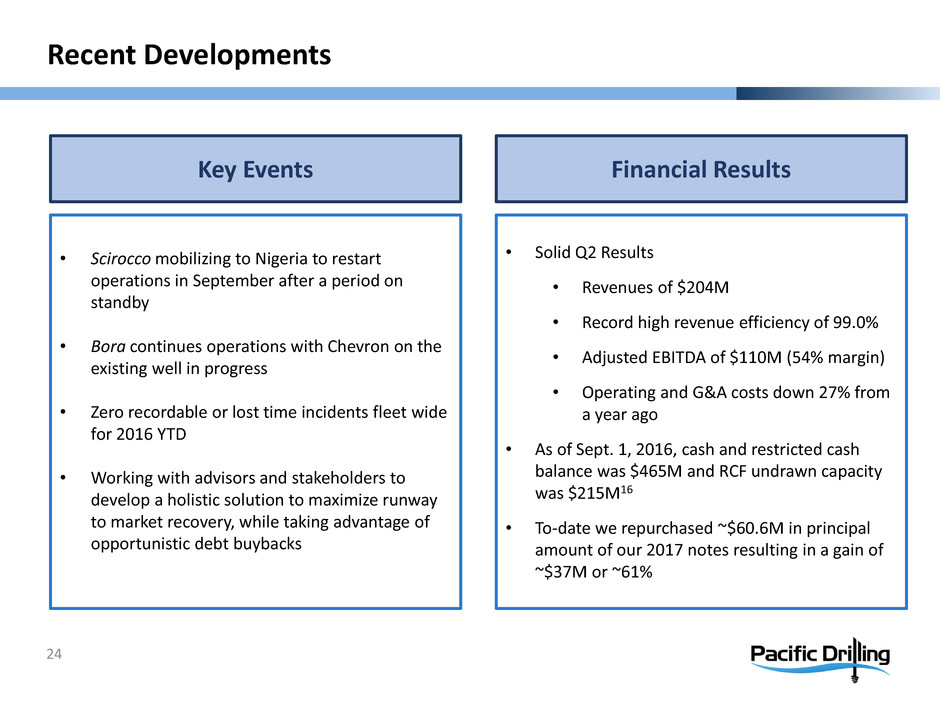
Recent Developments 24 • Solid Q2 Results • Revenues of $204M • Record high revenue efficiency of 99.0% • Adjusted EBITDA of $110M (54% margin) • Operating and G&A costs down 27% from a year ago • As of Sept. 1, 2016, cash and restricted cash balance was $465M and RCF undrawn capacity was $215M16 • To-date we repurchased ~$60.6M in principal amount of our 2017 notes resulting in a gain of ~$37M or ~61% • Scirocco mobilizing to Nigeria to restart operations in September after a period on standby • Bora continues operations with Chevron on the existing well in progress • Zero recordable or lost time incidents fleet wide for 2016 YTD • Working with advisors and stakeholders to develop a holistic solution to maximize runway to market recovery, while taking advantage of opportunistic debt buybacks Financial ResultsKey Events
In Summary 25
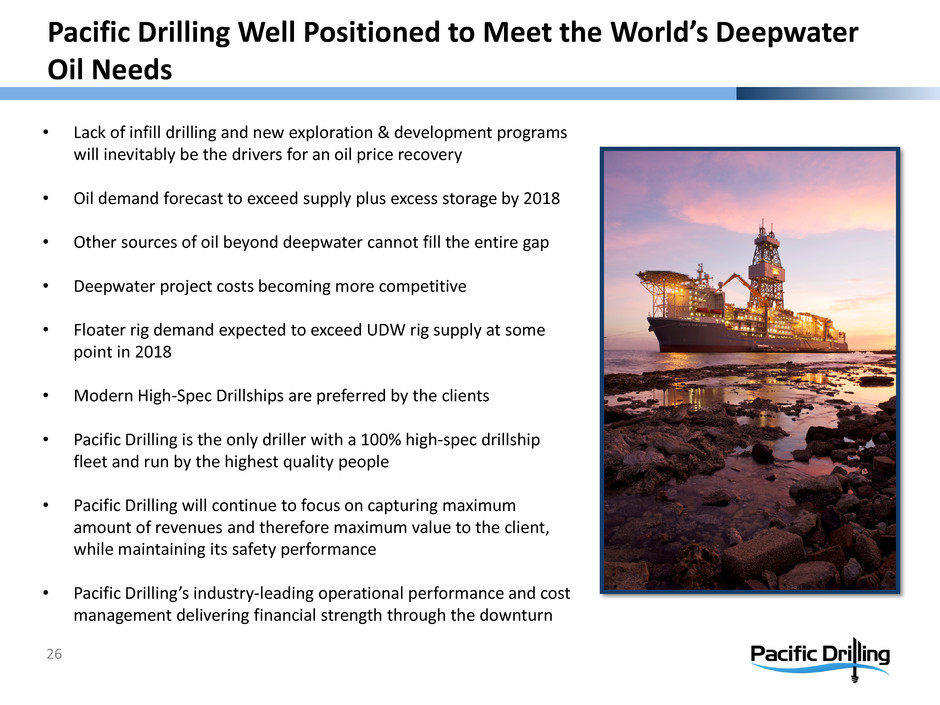
• Lack of infill drilling and new exploration & development programs will inevitably be the drivers for an oil price recovery • Oil demand forecast to exceed supply plus excess storage by 2018 • Other sources of oil beyond deepwater cannot fill the entire gap • Deepwater project costs becoming more competitive • Floater rig demand expected to exceed UDW rig supply at some point in 2018 • Modern High-Spec Drillships are preferred by the clients • Pacific Drilling is the only driller with a 100% high-spec drillship fleet and run by the highest quality people • Pacific Drilling will continue to focus on capturing maximum amount of revenues and therefore maximum value to the client, while maintaining its safety performance • Pacific Drilling’s industry-leading operational performance and cost management delivering financial strength through the downturn Pacific Drilling Well Positioned to Meet the World’s Deepwater Oil Needs 26

Pacific Drilling John Boots SVP Finance & Treasurer 8-10 Avenue de la Gare L-1610 Luxembourg Luxembourg Phone: +352 26-84-57-81 Email: Investor@pacificdrilling.com www.pacificdrilling.com Investor Contact 27
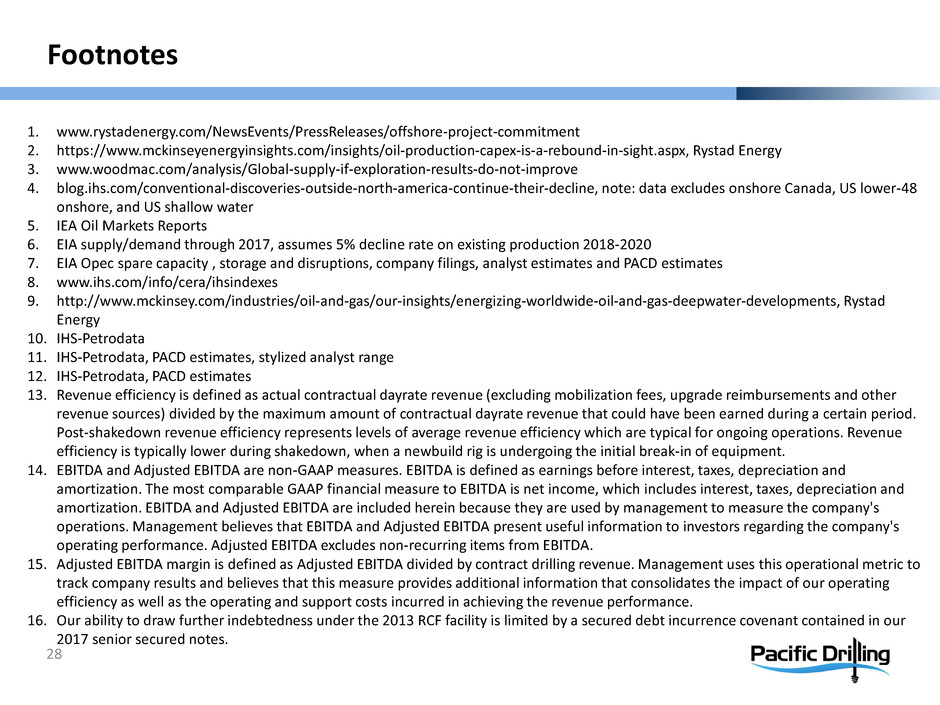
1. www.rystadenergy.com/NewsEvents/PressReleases/offshore-project-commitment 2. https://www.mckinseyenergyinsights.com/insights/oil-production-capex-is-a-rebound-in-sight.aspx, Rystad Energy 3. www.woodmac.com/analysis/Global-supply-if-exploration-results-do-not-improve 4. blog.ihs.com/conventional-discoveries-outside-north-america-continue-their-decline, note: data excludes onshore Canada, US lower-48 onshore, and US shallow water 5. IEA Oil Markets Reports 6. EIA supply/demand through 2017, assumes 5% decline rate on existing production 2018-2020 7. EIA Opec spare capacity , storage and disruptions, company filings, analyst estimates and PACD estimates 8. www.ihs.com/info/cera/ihsindexes 9. http://www.mckinsey.com/industries/oil-and-gas/our-insights/energizing-worldwide-oil-and-gas-deepwater-developments, Rystad Energy 10. IHS-Petrodata 11. IHS-Petrodata, PACD estimates, stylized analyst range 12. IHS-Petrodata, PACD estimates 13. Revenue efficiency is defined as actual contractual dayrate revenue (excluding mobilization fees, upgrade reimbursements and other revenue sources) divided by the maximum amount of contractual dayrate revenue that could have been earned during a certain period. Post-shakedown revenue efficiency represents levels of average revenue efficiency which are typical for ongoing operations. Revenue efficiency is typically lower during shakedown, when a newbuild rig is undergoing the initial break-in of equipment. 14. EBITDA and Adjusted EBITDA are non-GAAP measures. EBITDA is defined as earnings before interest, taxes, depreciation and amortization. The most comparable GAAP financial measure to EBITDA is net income, which includes interest, taxes, depreciation and amortization. EBITDA and Adjusted EBITDA are included herein because they are used by management to measure the company's operations. Management believes that EBITDA and Adjusted EBITDA present useful information to investors regarding the company's operating performance. Adjusted EBITDA excludes non-recurring items from EBITDA. 15. Adjusted EBITDA margin is defined as Adjusted EBITDA divided by contract drilling revenue. Management uses this operational metric to track company results and believes that this measure provides additional information that consolidates the impact of our operating efficiency as well as the operating and support costs incurred in achieving the revenue performance. 16. Our ability to draw further indebtedness under the 2013 RCF facility is limited by a secured debt incurrence covenant contained in our 2017 senior secured notes. Footnotes 28


