UNITED STATES
SECURITIES AND EXCHANGE COMMISSION
Washington, D.C. 20549
FORMN-CSR
CERTIFIED SHAREHOLDER REPORT OF REGISTERED MANAGEMENT INVESTMENT COMPANIES
Investment Company Act file number:811-22550
Name of Fund: BlackRock Preferred Partners LLC
Fund Address: 100 Bellevue Parkway, Wilmington, DE 19809
Name and address of agent for service: John M. Perlowski, Chief Executive Officer, BlackRock Preferred Partners LLC, 55 East 52nd Street, New York, NY 10055
Registrant’s telephone number, including area code: (800)882-0052, Option 4
Date of fiscal year end: 03/31/2019
Date of reporting period: 03/31/2019
| | |
| |
| Item 1 – | | Report to Stockholders |
MARCH 31, 2019
| | |
ANNUAL REPORT | |  |
BlackRock Preferred Partners LLC
Beginning on January 1, 2021, as permitted by regulations adopted by the Securities and Exchange Commission, paper copies of the Fund’s shareholder reports will no longer be sent by mail, unless you specifically request paper copies of the reports from BlackRock or from your financial intermediary, such as a broker-dealer or bank. Instead, the reports will be made available on a website, and you will be notified by mail each time a report is posted and provided with a website link to access the report.
You may elect to receive all future reports in paper free of charge. If you hold accounts directly with BlackRock, you can call(800) 441-7762 to inform BlackRock that you wish to continue receiving paper copies of your shareholder reports. If you hold accounts through a financial intermediary, you can follow the instructions included with this disclosure, if applicable, or contact your financial intermediary to request that you continue to receive paper copies of your shareholder reports. Please note that not all financial intermediaries may offer this service. Your election to receive reports in paper will apply to all funds advised by BlackRock Advisors, LLC, BlackRock Fund Advisors or their affiliates, or all funds held with your financial intermediary, as applicable.
If you already elected to receive shareholder reports electronically, you will not be affected by this change and you need not take any action. You may elect to receive electronic delivery of shareholder reports and other communications by: (i) accessing the BlackRock website at www.blackrock.com/edelivery and logging into your accounts, if you hold accounts directly with BlackRock, or (ii) contacting your financial intermediary, if you hold accounts through a financial intermediary. Please note that not all financial intermediaries may offer this service.
| | |
| | | Not FDIC Insured • May Lose Value • No Bank Guarantee |
The Markets in Review
Dear Member,
This report reflects your Fund’s reporting period ended March 31, 2019. The following review is intended to provide you with additional market perspective over the past 12 months.
In the 12 months ended March 31, 2019, the U.S. equity and bond markets posted positive returns while weathering significant volatility. Though the market’s appetite for risk remained healthy for most of the reporting period, risk taking declined sharply in late 2018. Thereafter, global equity markets rebounded strongly, as inflation diminished and the U.S. Federal Reserve (the “Fed”) announced a shift to less restrictive monetary policy.
Volatility rose in emerging market stocks, as the rising U.S. dollar and higher interest rates in the U.S. disrupted economic growth abroad. U.S.-China trade relations and debt concerns adversely affected the Chinese stock market, while Turkey and Argentina became embroiled in currency crises, largely due to hyperinflation in both countries. An economic slowdown in Europe also led to negative performance for European equities. However, recent economic data indicates that Europe may emerge from its economic soft patch, reinvigorated by a manufacturing rebound and China’s economic stimulus.
Volatility in the U.S. equity market spiked in October, as a wide range of risks were brought to bear on markets, ranging from rising interest rates and slowing global growth to heightened trade tensions and political turmoil in several countries, including the United States. These risks manifested in a broad-basedsell-off in December, leading to the worst December performance on record since 1931.
By comparison, fixed income securities delivered modest positive returns with relatively low volatility. In fixed income markets, short-term U.S. Treasury yields rose the fastest, while longer-term yields declined slightly. This led to positive returns for U.S. Treasuries and a substantial flattening of the yield curve. Investment-grade and high-yield corporate bonds also posted positive returns, as the credit fundamentals in corporate markets remained relatively solid.
The Fed increased short-term interest rates three times during the reporting period. For its last two meetings, the Fed left interest rates unchanged and signaled a slower pace of rate hikes in response to the global economic slowdown. Relatively low inflation and modest economic growth give the Fed room to maintain support for the economy until the economic data builds the case for changing interest rates.
Although fears of recession drove equity volatility higher at the end of 2018, we continue to believe the probability of recession in 2019 remains relatively low. Economic growth and global earnings are likely to slow somewhat in 2019 because the tax cut stimulus will be less pronounced, and the Fed’s rate hikes in 2018 will gain traction in 2019. We expect profit margins to continue to contract, which tends to happen late in the business cycle.
In addition, trade frictions look more baked into asset prices than a year ago, but markets may be overlooking European political risks. As Brexit moves forward, the United Kingdom and the European Union may face significant obstacles. Most recently, Britain’s Parliament voted to extend the deadline for the separation, as policy makers continue to seek the least disruptive ways to disentangle Europe’s second-largest economy from the European Union. U.S. and emerging market equities remain relatively attractive. Within U.S. equities, we believe that companies with high-quality earnings and strong balance sheets offer the most attractive risk/rewardtrade-off.
In this environment, investors need to think globally, extend their scope across a broad array of asset classes and be nimble as market conditions change. We encourage you to talk with your financial advisor and visitblackrock.comfor further insight about investing in today’s markets.
Sincerely,

Rob Kapito
President, BlackRock Advisors, LLC

Rob Kapito
President, BlackRock Advisors, LLC
| | | | | | | | | | |
| Total Returns as of March 31, 2019 |
| | | 6-month | | 12-month |
U.S. large cap equities
(S&P 500®Index) | | | | (1.72 | )% | | | | 9.50 | % |
U.S. small cap equities
(Russell 2000®Index) | | | | (8.56 | ) | | | | 2.05 | |
International equities
(MSCI Europe,
Australasia, Far East Index) | | | | (3.81 | ) | | | | (3.71 | ) |
Emerging market equities
(MSCI Emerging Markets Index) | | | | 1.71 | | | | | (7.41 | ) |
3-month Treasury bill (ICE BofAML3-Month
U.S. Treasury
Bill Index) | | | | 1.17 | | | | | 2.12 | |
U.S. Treasury securities
(ICE BofAML10-Year
U.S. Treasury Index) | | | | 7.08 | | | | | 5.59 | |
U.S. investment grade bonds (Bloomberg Barclays U.S. Aggregate
Bond Index) | | | | 4.63 | | | | | 4.48 | |
Tax-exempt municipal
bonds (S&P Municipal Bond Index) | | | | 4.32 | | | | | 5.12 | |
U.S. high yield bonds
(Bloomberg Barclays U.S. Corporate High Yield 2% Issuer Capped Index) | | | | 2.39 | | | | | 5.93 | |
HFRI Fund of Funds
Composite Index | | | | (0.54 | ) | | | | 0.15 | |
| Past performance is no guarantee of future results. Index performance is shown for illustrative purposes only. You cannot invest directly in an index. | |
| | |
| 2 | | T H I S P A G E I S N O T P A R T O F Y O U R F U N D R E P O R T |
| | | | |
| | | Page | |
The Markets in Review | | | 2 | |
Annual Report: | | | | |
Fund Summary | | | 4 | |
Financial Statements: | | | | |
Schedule of Investments | | | 7 | |
Statement of Assets, Liabilities and Members’ Capital | | | 8 | |
Statement of Operations | | | 9 | |
Statements of Changes in Members’ Capital | | | 9 | |
Statement of Cash Flows | | | 10 | |
Financial Highlights | | | 11 | |
Notes to Financial Statements | | | 12 | |
Report of Independent Registered Public Accounting Firm | | | 17 | |
Automatic Dividend Reinvestment Plan | | | 18 | |
Director and Officer Information | | | 19 | |
Additional Information | | | 22 | |
| | |
Fund Summary as of March 31, 2019 | | BlackRock Preferred Partners LLC |
Investment Objective
BlackRock Preferred Partners LLC’s (the “Fund”)investment objective is to seek total return. Over an investment cycle, the Fund expects to achieve net returns commensurate with the long-term return on equities with less volatility and a relatively low degree of correlation to the equity markets. In order to achieve its objective, the Fund invests in a portfolio of hedge funds organized outside the United States generally believed not to be highly correlated with the Standard & Poor’s 500 Index over a long-term horizon. The Fund intends to invest in private funds or other pooled investment vehicles or accounts organized outside the United States (collectively, the “Portfolio Funds”) managed by third-party investment managers, and the Fund may also invest directly in securities (other than those of Portfolio Funds) or other financial instruments.
On December 1, 2017, the Board of Directors of BlackRock Preferred Partners LLC approved a proposal to close the Fund to new investors and thereafter to liquidate the Fund. Effective December 1, 2017, the Fund is no longer offering its Units to new or existing investors. The liquidation is ongoing, and the timing of the Fund’s final liquidation payment has not yet been determined.
No assurance can be given that the Fund’s investment objective will be achieved.
Portfolio Management Commentary
How did the Fund perform?
For the12-month period ended March 31, 2019, the Fund returned (2.57)% based on net asset value. For the same period, the Fund’s benchmark, the HFRI Fund of Funds Composite Index, returned 0.15%.
Underlying Fund Strategies
The Fund invested in a portfolio of hedge funds as a means to gain exposure to various types of investment strategies in five major categories, including fundamental long/ short, relative value, event-driven, directional trading and, to a lesser extent, direct sourcing strategies. The Fund is currently in the process of liquidating this portfolio of hedge funds.
Fundamental long/short strategies involve buying or selling predominantly corporate securities believed to be over- or underpriced relative to their potential value. Investment strategies in this category include long and short equity- or credit-based strategies, which emphasize a fundamental valuation framework, and equity active value strategies, where an active role is taken to enhance corporate value.
Relative value strategies seek to profit from the mispricing of financial instruments relative to each other or historical norms. These strategies utilize quantitative and qualitative analyses to identify securities or spreads between securities that deviate from their theoretical fair value and/or historical norms.
Event-driven strategies concentrate on companies that are subject to corporate events such as mergers, acquisitions, restructurings, spin-offs, shareholder activism or other special situations that alter a company’s financial structure or operating strategy. The intended goal of these strategies is to profit when the price of a security changes to reflect more accurately the likelihood and potential impact of the occurrence, ornon-occurrence, of the event.
Directional trading strategies seek to profit in changes from macro-level exposures, such as broad securities markets, interest rates, exchange rates and commodities. Examples include global macro strategies that express macroeconomic views based on analysis of fundamental factors and managed futures strategies, which select futures instruments based typically on systematic technical analysis.
Direct sourcing strategies seek to garner profits from areas of the market that are underserved by traditional financial institutions by entering into direct transactions to provide financing to institutions or individuals. Typically, these strategies rely on a manager’s ability to source or access privately structured deals as well as fundamental research specific to each respective deal.
What factors influenced performance?
Performance for the year was driven by remaining positions, as the Fund continued to liquidate the portfolio in an effort to return capital to investors.
Describe recent portfolio activity.
The Fund did not add any new positions during the period and went into liquidation as of December 1, 2017.
Describe portfolio positioning at period end.
The Fund held one hedge fund as of period end. For purposes of financial reporting, the underlying hedge fund is categorized based on its primary underlying strategy exposure. In this regard, portfolio positioning was 100% fundamental long/short strategies. The Fund had a large cash position representing approximately 37% of Members’ Capital as of March 31, 2019 due to the planned liquidation.
The views expressed reflect the opinions of BlackRock as of the date of this report and are subject to change based on changes in market, economic or other conditions. These views are not intended to be a forecast of future events and are no guarantee of future results.
| | |
| 4 | | 2 0 1 9 B L A C K R O C K A N N U A L R E P O R T T O S H A R E H O L D E R S |
| | |
| Fund Summary as of March 31, 2019 (continued) | | BlackRock Preferred Partners LLC |
Total Return Based on a $50,000 Investment
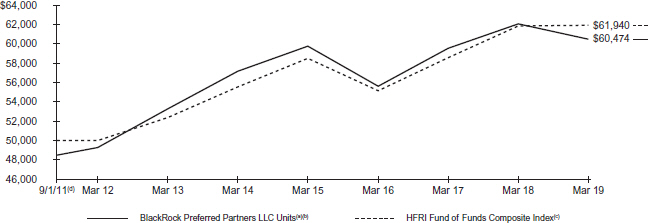
| (a) | Assuming maximum sales charges, if any, transaction costs and other operating expenses, including investment advisory fees. |
| (b) | Under normal market conditions, the Fund invested, in varying proportions, across a number of portfolio strategies, including but not limited to hedge fund strategies and cash strategies. The Fund was also permitted to invest directly in securities (other than those of Portfolio Funds) or other financial instruments selected by the Advisor. The Fund went into liquidation on December 1, 2017. |
| (c) | This index represents funds of hedge funds that invest with multiple hedge fund managers focused on absolute return strategies. This equal-weighted index includes funds of hedge funds tracked by Hedge Fund Research Inc. and is revised several times each month to reflect updated hedge fund return information. For performance presented as of any given month, estimated values of underlying funds are used to build the index until valuations are finalized (generally on a5-month lag although the time period may vary). This index is a proxy for the performance of the universe of funds of hedge funds focused on absolute return strategies. Returns are net of fees. |
| (d) | Commencement of operations. |
Performance Summary for the Period Ended March 31, 2019
| | | | | | | | | | | | | | | | | | | | | | | | | | | | | | | | | | | | | | | | | | | | | | | | | | |
| | | | | | | Average Annual Total Returns(a) |
| | | | | | | 1 Year | | | | 5 Years | | | | Since Inception(b) |
| | | 6-Month
Total Returns | | | | w/o sales
charge | | w/sales
charge | | | | w/o sales
charge | | w/sales
charge | | | | w/o sales
charge | | w/sales
charge |
BlackRock Preferred Partners LLC Units | | | | (4.58 | )% | | | | | | | | | (2.57 | )% | | | | (5.50 | )% | | | | | | | | | 1.13 | % | | | | 0.52 | % | | | | | | | | | 2.95 | % | | | | 2.54 | % |
HFRI Fund of Funds Composite Index | | | | (0.54 | ) | | | | | | | | | 0.15 | | | | | N/A | | | | | | | | | | 2.20 | | | | | N/A | | | | | | | | | | 2.86 | | | | | N/A | |
| | (a) | Assuming maximum sales charges, if any. Average annual total returns with and without sales charges reflect reductions for distribution fees. | |
| | (b) | The Fund commenced operations on September 1, 2011. | |
N/A — Not applicable as index does not have a sales charge.
Past performance is not indicative of future results.
Performance results may include adjustments made for financial reporting purposes in accordance with U.S. generally accepted accounting principles.
About Fund Performance
The Fund has one class of limited liability company interests (“Units”) which incur a maximum initial sales charge of 3.00% and an annual investment advisory fee of 0.75%. Effective December 1, 2017, the Fund is no longer offering its Units to new or existing investors. Effective April 1, 2018, the Advisor elected to voluntarily waive the Fund’s annual investment advisory fee.
Performance information reflects past performance and does not guarantee future results. Current performance may be lower or higher than the performance data quoted. Refer to www.blackrock.comto obtain performance data current to the most recentmonth-end. Performance results do not reflect the deduction of taxes that a Member would pay on Fund distributions or the repurchase of Fund Units. A 2.00% early repurchase fee payable to the Fund was permitted to be charged to a member that tendered its Units to the Fund in connection with a tender offer with a valuation date that is prior to theone-year anniversary of the member’s purchase of the respective Units. This early repurchase fee would apply separately to each purchase of Units made by a member. The purpose of the 2.00% early repurchase fee was to reimburse the Fund for the costs incurred in liquidating investments in the Fund’s portfolio in order to honor the member’s repurchase request and to discourage short-term investments which would have been generally disruptive to the Fund’s investment program. The Fund was permitted, in its sole discretion, to waive the early repurchase fee under certain circumstances described in the Fund’s prospectus. Performance data does not reflect this potential fee and this potential fee does not apply with respect to liquidating distributions. Figures shown in the performance table assume reinvestment of all distributions, if any, at net asset value on the payable date. Investment return and the principal value of Units will fluctuate so that Units, when cancelled following the Fund’s final liquidating distribution, may be worth more or less than their original cost.
The Fund’s investment adviser, BlackRock Advisors LLC (the “Advisor”), waived and/or reimbursed a portion of the Fund’s expenses during the periods described above. Without such waiver and/or reimbursement, the Fund’s performance would have been lower.
See “General Information” at the end of this report for where additional information can be obtained.
| | |
| Fund Summary as of March 31, 2019 (continued) | | BlackRock Preferred Partners LLC |
Fund Information
FUND HOLDINGS
| | | | |
| Security | | Percent of
Members’ Capital | |
Nokota LCB, LLC | | | 5% | |
INVESTMENT STRATEGIES
| | | | |
| Strategies | | Percent of
Members’ Capital | |
Fundamental Long/Short | | | 5% | |
Cash and Other Assets/Liabilities | | | 95 | |
The table below summarizes the changes in the Fund’s monthly net asset value per Unit:
| | | | | | | | | | | | | | | | | | | | | | | | | |
| | | 03/31/19 | | 03/31/18 | | Change | | High | | Low |
Net Asset Value | | | | $0.36 | | | | | $9.53 | | | | | (96.22 | )% | | | | $9.53 | | | | | $0.35 | |
Disclosure of Expenses for Continuously OfferedClosed-End Funds
Members of the Fund may incur the following charges: (a) transactional expenses, such as sales charges and early repurchase fees; and (b) operating expenses, including investment advisory fees, distribution fees, and other fund expenses. The expense example shown below (which is based on a hypothetical investment of $1,000 invested on October 1, 2018 and held through March 31, 2019) is intended to assist members both in calculating expenses based on an investment in the Fund and in comparing these expenses with similar costs of investing in other funds. The Fund’s Units are no longer offered as of December 1, 2017.
The expense example provides information about actual account values and actual expenses. In order to estimate the expenses a member paid during the period covered by this report, members can divide their account value by $1,000 and then multiply the result by the number under the heading entitled “Expenses Paid During the Period.”
The expense example also provides information about hypothetical account values and hypothetical expenses based on the Fund’s actual expense ratio and an assumed rate of return of 5% per year before expenses, which is not the Fund’s actual return. The hypothetical account values and expenses may not be used to estimate the actual ending account balance or expenses you paid for the period. In order to assist members in comparing the ongoing expenses of investing in the Fund and other funds, compare the 5% hypothetical example with the 5% hypothetical examples that appear in member reports of other funds.
The expenses shown in the expense example are intended to highlight members’ ongoing costs only and do not reflect transactional expenses, such as sales charges or early repurchase fees. Therefore, the hypothetical examples are useful in comparing ongoing expenses only, and will not help members determine the relative total expenses of owning different funds. If these transactional expenses were included, member expenses would have been higher.
| | | | | | | | | | | | | | | | | | |
| | | Actual | | | | Hypothetical(b) | | | | |
| | | Beginning
Account Value
(10/01/18) | | Ending Account Value
(03/31/19) | | Expenses Paid During the Period(a) | | | | Beginning
Account Value
(10/01/18) | | Ending
Account Value
(03/31/19) | | Expenses Paid During the Period(a) | | | | Annualized
Expense
Ratio |
BlackRock Preferred Partners LLC | | $1,000.00 | | $954.20 | | $2.29 | | | | $1,000.00 | | $1,022.59 | | $2.37 | | | | 0.50% |
| (a) | Expenses are equal to the annualized expense ratio, multiplied by the average account value over the period, multiplied by 182/365 (to reflect theone-half year period shown). Annualized expense ratio does not include expenses incurred indirectly as a result of investments in Portfolio Funds. |
| (b) | Hypothetical 5% annual return before expenses is calculated by prorating the number of days in the most recent fiscal half year divided by 365. |
| | |
| 6 | | 2 0 1 9 B L A C K R O C K A N N U A L R E P O R T T O S H A R E H O L D E R S |
| | |
Schedule of Investments March 31, 2019 | | BlackRock Preferred Partners LLC (Percentages shown are based on Members’ Capital) |
| | | | | | | | | | | | | | | | |
| Portfolio Funds(a)(b) | | Acquisition Date | | | Cost | | | Value | | | % of
Members’ Capital | |
Fundamental Long/Short | | | | | | | | | | | | | | | | |
Nokota LCB, LLC | | | 03/29/19 | | | $ | 72,636 | | | $ | 72,636 | | | | 4.6 | % |
Total Investments | | | | | | $ | 72,636 | | | | 72,636 | | | | 4.6 | % |
| | | | | | | | | | | | | | | | |
Other Assets Less Liabilities | | | | | | | | | | | 1,516,202 | | | | 95.4 | % |
| | | | | | | | | | | | | | | | |
Members’ Capital | | | | | | | | | | $ | 1,588,838 | | | | 100.0 | % |
| | | | | | | | | | | | | | | | |
| (a) | Restricted security as to resale, excluding 144A securities. The Fund held restricted securities with a current value of $72,636, representing 4.6% of its members’ capital as of period end, and an original cost of $72,636. |
| (b) | Non-income producing security. |
See notes to financial statements.
| | | | |
| S C H E D U L E O F I N V E S T M E N T S | | | 7 | |
Statement of Assets, Liabilities and Members’ Capital
March 31, 2019
| | | | |
| | | BlackRock Preferred
Partners LLC | |
| |
ASSETS | | | | |
Investments in Portfolio Funds at value (cost — $72,636) | | $ | 72,636 | |
Cash | | | 584,658 | |
Receivables: | | | | |
Investments in Portfolio Funds sold | | | 961,243 | |
Investment advisor | | | 43,377 | |
Prepaid expenses | | | 40 | |
| | | | |
Total assets | | | 1,661,954 | |
| | | | |
| |
LIABILITIES | | | | |
Payables: | | | | |
Professional fees | | | 56,223 | |
Directors’ and Officer’s fees | | | 623 | |
Other accrued expenses | | | 16,270 | |
| | | | |
Total liabilities | | | 73,116 | |
| | | | |
MEMBERS’ CAPITAL | | $ | 1,588,838 | |
| | | | |
| |
MEMBERS’ CAPITAL CONSISTS OF | | | | |
Paid-in capital | | $ | 3,515,599 | |
Accumulated loss | | | (1,926,761 | ) |
| | | | |
Members’ Capital | | $ | 1,588,838 | |
| | | | |
| |
NET ASSET VALUE | | | | |
Based on members’ capital of $1,588,838 and 4,449,839 Units outstanding | | $ | 0.36 | |
| | | | |
See notes to financial statements.
| | |
| 8 | | 2 0 1 9 B L A C K R O C K A N N U A L R E P O R T T O S H A R E H O L D E R S |
Statement of Operations
Year Ended March 31, 2019
| | | | |
| | | BlackRock Preferred
Partners LLC | |
| |
INVESTMENT INCOME | | | | |
Dividends | | $ | — | |
| | | | |
EXPENSES | | | | |
Investment advisory | | | 53,315 | |
Professional | | | 72,777 | |
Administration | | | 13,801 | |
Printing | | | 12,000 | |
Investor Servicing Fees | | | 11,842 | |
Directors and Officer | | | 2,200 | |
Miscellaneous | | | 23,411 | |
| | | | |
Total expenses | | | 189,346 | |
| | | | |
Less fees waived and/or reimbursed by advisor | | | (156,743 | ) |
| | | | |
Total expenses after fees waived and/or reimbursed | | | 32,603 | |
| | | | |
Net investment loss | | | (32,603 | ) |
| | | | |
| |
REALIZED AND UNREALIZED LOSS | | | | |
Net realized gain from investments | | | 3,199,498 | |
Net change in unrealized appreciation (depreciation) on investments | | | (3,368,600 | ) |
| | | | |
Total realized and unrealized loss | | | (169,102 | ) |
| | | | |
NET DECREASE IN MEMBERS’ CAPITAL RESULTING FROM OPERATIONS | | $ | (201,705 | ) |
| | | | |
See notes to financial statements.
Statements of Changes in Members’ Capital
| | | | | | | | | | | | |
| | | BlackRock Preferred
Partners LLC | |
| | | Year Ended March 31, | |
| | | 2019 | | | | | | 2018 | |
| | | |
INCREASE (DECREASE) IN MEMBERS’ CAPITAL | | | | | | | | | | | | |
| | | |
OPERATIONS | | | | | | | | | | | | |
Net investment loss | | $ | (32,603 | ) | | | | | | $ | (913,697 | ) |
Net realized gain | | | 3,199,498 | | | | | | | | 9,028,545 | |
Net change in unrealized appreciation (depreciation) | | | (3,368,600 | ) | | | | | | | (6,164,708 | ) |
| | | | | | | | | | | | |
Net increase (decrease) in members’ capital resulting from operations | | | (201,705 | ) | | | | | | | 1,950,140 | |
| | | | | | | | | | | | |
| | | |
DISTRIBUTIONS TO MEMBERS(a)(b) | | | | | | | | | | | | |
From net investment income | | | (578,330 | ) | | | | | | | (4,000,000 | ) |
From return of capital | | | (40,021,670 | ) | | | | | | | — | |
| | | | | | | | | | | | |
Decrease in members’ capital resulting from distributions to members | | | (40,600,000 | ) | | | | | | | (4,000,000 | ) |
| | | | | | | | | | | | |
| | | |
CAPITAL TRANSACTIONS | | | | | | | | | | | | |
Proceeds from the issuance of Units (excluding capital contributions received in advance) | | | — | | | | | | | | 1,818,000 | |
Repurchase of Units resulting from tender offers | | | — | | | | | | | | (6,231,783 | ) |
| | | | | | | | | | | | |
Net decrease in members’ capital derived from capital transactions | | | — | | | | | | | | (4,413,783 | ) |
| | | | | | | | | | | | |
| | | |
MEMBERS’ CAPITAL | | | | | | | | | | | | |
Total decrease in members’ capital | | | (40,801,705 | ) | | | | | | | (6,463,643 | ) |
Beginning of year | | | 42,390,543 | | | | | | | | 48,854,186 | |
| | | | | | | | | | | | |
End of year | | $ | 1,588,838 | | | | | | | $ | 42,390,543 | |
| | | | | | | | | | | | |
| (a) | Distributions for annual periods determined in accordance with U.S. federal income tax regulations. |
| (b) | Prior year distribution character information and undistributed net investment income has been modified or removed to conform with current year RegulationS-X presentation changes. Refer to Note 10 for this prior year information. |
See notes to financial statements.
| | | | |
| F I N A N C I A L S T A T E M E N T S | | | 9 | |
Statement of Cash Flows
Year Ended March 31, 2019
| | | | |
| | | BlackRock Preferred
Partners LLC | |
| |
CASH PROVIDED BY OPERATING ACTIVITES | | | | |
Net decrease in members’ capital resulting from operations | | $ | (201,705 | ) |
Adjustments to reconcile net increase in members’ capital resulting from operations to net cash provided by operating activities: | | | | |
Proceeds from sales of long-term investments | | | 13,223,799 | |
Purchases of long-term investments | | | (72,636 | ) |
(Increase) decrease in assets: | | | | |
Receivables: | | | | |
Investment advisor | | | (43,377 | ) |
Prepaid expenses | | | 858 | |
Increase (decrease) in liabilities: | | | | |
Payables: | | | | |
Distribution fees | | | (71,056 | ) |
Investment advisory fees | | | (140,110 | ) |
Professional fees | | | (32,430 | ) |
Directors’ and Officer’s fees | | | 19 | |
Other accrued expenses | | | (9,288 | ) |
Net realized gain (loss) on investments | | | (3,199,498 | ) |
Net change in unrealized appreciation (depreciation) | | | 3,368,600 | |
| | | | |
Net cash provided by operating activities | | | 12,823,176 | |
| | | | |
| |
CASH USED FOR FINANCING ACTIVITIES | | | | |
Cash distributions paid to members | | | (40,600,000 | ) |
| | | | |
Net cash used for financing activities | | | (40,600,000 | ) |
| | | | |
| |
CASH | | | | |
Net decrease in cash | | | (27,776,824 | ) |
Cash at beginning of year | | | 28,361,482 | |
| | | | |
Cash at end of year | | $ | 584,658 | |
| | | | |
See notes to financial statements.
| | |
| 10 | | 2 0 1 9 B L A C K R O C K A N N U A L R E P O R T T O S H A R E H O L D E R S |
Financial Highlights
(For a share outstanding throughout each period)
| | | | | | | | | | | | | | | | | | | | |
| | | BlackRock Preferred Partners LLC | |
| |
| | | Year Ended March 31, | |
| | | 2019 | | | 2018 | | | 2017 | | | 2016 | | | 2015 | |
| | | | | | |
Net asset value, beginning of year | | $ | 9.53 | | | $ | 9.98 | | | $ | 9.32 | | | $ | 10.57 | | | $ | 10.52 | |
| | | | | | | | | | | | | | | | | | | | |
Net investment loss(a) | | | (0.01 | ) | | | (0.20 | ) | | | (0.20 | ) | | | (0.20 | ) | | | (0.22 | ) |
Net realized and unrealized gain (loss) | | | (0.04 | ) | | | 0.62 | | | | 0.86 | | | | (0.52 | ) | | | 0.68 | (b) |
| | | | | | | | | | | | | | | | | | | | |
Net increase (decrease) from investment operations | | | (0.05 | ) | | | 0.42 | | | | 0.66 | | | | (0.72 | ) | | | 0.46 | |
| | | | | | | | | | | | | | | | | | | | |
| | | | | |
Distributions(c) | | | | | | | | | | | | | | | | | | | | |
From net investment income | | | (0.13 | ) | | | (0.87 | ) | | | — | | | | (0.53 | ) | | | (0.41 | ) |
From return of capital | | | (8.99 | ) | | | — | | | | — | | | | — | | | | — | |
| | | | | | | | | | | | | | | | | | | | |
Total distributions | | | (9.12 | ) | | | (0.87 | ) | | | — | | | | (0.53 | ) | | | (0.41 | ) |
| | | | | | | | | | | | | | | | | | | | |
| | | | | |
Net asset value, end of year | | $ | 0.36 | | | $ | 9.53 | | | $ | 9.98 | | | $ | 9.32 | | | $ | 10.57 | |
| | | | | | | | | | | | | | | | | | | | |
| | | | | |
Total Return(d) | | | | | | | | | | | | | | | | | | | | |
Based on net asset value | | | (2.57 | )% | | | 4.21 | % | | | 7.08 | % | | | (6.91 | )% | | | 4.51 | % |
| | | | | | | | | | | | | | | | | | | | |
| | | | | |
Ratios to Average Members’ Capital(e) | | | | | | | | | | | | | | | | | | | | |
Total expenses. | | | 2.76 | % | | | 2.09 | % | | | 2.05 | % | | | 2.34 | % | | | 2.22 | % |
| | | | | | | | | | | | | | | | | | | | |
Total expenses after fees waived and/or reimbursed | | | 0.50 | % | | | 2.00 | % | | | 2.00 | % | | | 2.00 | % | | | 2.00 | % |
| | | | | | | | | | | | | | | | | | | | |
Net investment loss | | | (0.50 | )% | | | (1.97 | )% | | | (2.00 | )% | | | (2.00 | )% | | | (2.00 | )% |
| | | | | | | | | | | | | | | | | | | | |
| | | | | |
Supplemental Data | | | | | | | | | | | | | | | | | | | | |
Members’ capital, end of year (000) | | $ | 1,589 | | | $ | 42,391 | | | $ | 48,854 | | | $ | 57,471 | | | $ | 74,877 | |
| | | | | | | | | | | | | | | | | | | | |
Portfolio turnover rate | | | 1 | % | | | 4 | % | | | 5 | % | | | 7 | % | | | 19 | % |
| | | | | | | | | | | | | | | | | | | | |
| (a) | Based on average Units outstanding. |
| (b) | Includes repurchase fees, which are less than $0.005 per Unit. |
| (c) | Distributions for annual periods determined in accordance with U.S. federal income tax regulations. |
| (d) | Where applicable, excludes the effects of any sales charges and assumes the reinvestment of distributions. The Fund is a continuously offeredclosed-end fund, the Units of which are offered at net asset value. No secondary market for the Fund’s Units exists. |
| (e) | Ratios do not include expenses incurred indirectly as a result of investments in Portfolio Funds of approximately: |
| | | | | | | | | | | | | | | | | | | | | | | | | | | | | | | | | | | | |
| | | Year Ended March 31, | |
| | | 2019 | | | | | | 2018 | | | | | | 2017 | | | | | | 2016 | | | | | | 2015 | |
Investments in Portfolio Funds | | | 7.65 | % | | | | | | | 2.11 | % | | | | | | | 4.38 | % | | | | | | | 5.27 | % | | | | | | | 5.44 | % |
| | | | | | | | | | | | | | | | | | | | | | | | | | | | | | | | | | | | |
See notes to financial statements.
| | | | |
| F I N A N C I A L H I G H L I G H T S | | | 11 | |
Notes to Financial Statements
BlackRock Preferred Partners LLC (the “Fund”) is registered under the Investment Company Act of 1940, as amended (the “1940 Act”), as a continuously offered,non-diversified,closed-end management investment company. The Fund is organized as a Delaware limited liability company.
On December 1, 2017, the Board of Directors (the “Board”) of the Fund approved a proposal to close the Fund to new investors and thereafter to liquidate the Fund. Effective December 1, 2017, the Fund is no longer offering its Units to new or existing investors. The liquidation is ongoing, and the timing of the Fund’s final liquidation payment has not yet been determined.
| 2. | SIGNIFICANT ACCOUNTING POLICIES |
The financial statements are prepared in conformity with accounting principles generally accepted in the United States of America (“U.S. GAAP”), which may require management to make estimates and assumptions that affect the reported amounts of assets and liabilities in the financial statements, disclosure of contingent assets and liabilities at the date of the financial statements and the reported amounts of increases and decreases in members’ capital from operations during the reporting period. Actual results could differ from those estimates. The Fund is considered an investment company under U.S. GAAP and follows the accounting and reporting guidance applicable to investment companies. Below is a summary of significant accounting policies:
Investment Transactions and Income Recognition:For financial reporting purposes, investment transactions are recorded on the dates the transactions are executed. Realized gains and losses on investment transactions are determined on the identified cost basis. Dividend income is recorded on theex-dividend date.
Distributions:Distributions paid by the Fund are recorded on theex-dividend date. The portion of distributions, if any, that exceeds a fund’s current and accumulated earnings and profits, as measured on a tax basis, constitute anon-taxable return of capital. The character and timing of distributions are determined in accordance with U.S. federal income tax regulations, which may differ from U.S. GAAP.
Deferred Compensation Plan:Under the Deferred Compensation Plan (the “Plan”) approved by the Fund’s Board, the independent Directors (“Independent Directors”) may defer a portion of their annual complex-wide compensation. Deferred amounts earn an approximate return as though equivalent dollar amounts had been invested in common shares of certain funds in the BlackRock Fixed-Income Complex selected by the Independent Directors. This has the same economic effect for the Independent Directors as if the Independent Directors had invested the deferred amounts directly in certain funds in the BlackRock Fixed-Income Complex.
The Plan is not funded and obligations thereunder represent general unsecured claims against the general assets of each Fund, as applicable. Deferred compensation liabilities are included in the Directors’ and Officer’s fees payable in the Statement of Assets, Liabilities and Members’ Capital and will remain as a liability of the Fund until such amounts are distributed in accordance with the Plan.
Recent Accounting Standard:In August 2018, the Financial Accounting Standards Board issued Accounting Standards Update2018-13 “Changes to the Disclosure Requirements for Fair Value Measurement” which modifies disclosure requirements for fair value measurements. The guidance is effective for fiscal years beginning after December 15, 2019 and for interim periods within those fiscal years. Management continues to evaluate the impact of this guidance to the Fund.
Indemnifications:In the normal course of business, the Fund enters into contracts that contain a variety of representations that provide general indemnification. The Fund’s maximum exposure under these arrangements is unknown because it involves future potential claims against the Fund, which cannot be predicted with any certainty.
Other:Expenses directly related to the Fund are charged to the Fund. Other operating expenses shared by several funds, including other funds managed by the Advisor, are prorated among those funds on the basis of relative members’ capital or other appropriate methods.
The Fund has an arrangement with its custodian whereby credits are earned on uninvested cash balances, which could be used to reduce custody fees and/or overdraft charges. The Fund may incur charges on certain uninvested cash balances and overdrafts, subject to certain conditions.
| 3. | INVESTMENT VALUATION AND FAIR VALUE MEASUREMENTS |
Investment Valuation Policies:The Fund’s investments are valued at fair value (also referred to as “market value” within the financial statements) as of the close of trading on the New York Stock Exchange (“NYSE”) (generally 4:00 p.m., Eastern time) (or if the reporting date falls on a day the NYSE is closed, investments are valued at fair value as of the period end). U.S. GAAP defines fair value as the price the Fund would receive to sell an asset or pay to transfer a liability in an orderly transaction between market participants at the measurement date. The Fund determines the fair values of its financial instruments using various independent dealers or pricing services under policies approved by the Board. The BlackRock Global Valuation Methodologies Committee (the “Global Valuation Committee”) is the committee formed by management to develop global pricing policies and procedures and to oversee the pricing function for all financial instruments.
In valuing interests in Portfolio Funds, the Advisor, under the supervision of the Board, considers all relevant information to determine the price that the Fund might reasonably expect to receive from the current sale (or redemption in the case of a Portfolio Fund whose interests carry redemption rights) of the interest in the Portfolio Fund in anarm’s-length transaction. In general, the Advisor will rely primarily on any actual or estimated (as applicable) unaudited values provided by the Portfolio Fund manager to the extent such unaudited values are received in a timely fashion and are believed to be the most reliable and relevant indication of the value of interests in such Portfolio Fund. It is anticipated that these unaudited values will be prepared in accordance with U.S. GAAP and will, in effect, be the fair value of each Portfolio Fund’s assets, less such Portfolio Fund’s liabilities (the net asset value). In some cases, estimated unaudited values are provided before final unaudited values. The Advisor will rely primarily on such estimated unaudited values or final unaudited values, to the extent they are the most reliable and relevant indication of value of interests in the Portfolio Funds. The Advisor will give weight to such valuations and any other factors and considerations set forth in the Valuation Procedures as deemed appropriate in each case. The Fund will only invest in Portfolio Funds that comply with U.S. GAAP and that provide annual audited financial statements. In general, the Advisor will, prior to investing in any Portfolio Fund, and periodically thereafter, assess such Portfolio Fund’s valuation policies and procedures for appropriateness in light of the Fund’s obligation to fair value its assets under the 1940 Act and pursuant to U.S. GAAP for investment companies and will assess the overall reasonableness of the information provided by such
| | |
| 12 | | 2 0 1 9 B L A C K R O C K A N N U A L R E P O R T T O S H A R E H O L D E R S |
Notes to Financial Statements (continued)
Portfolio Fund. As part of this assessment, the Advisor may also evaluate, among other things, a Portfolio Fund’s practices in respect of creating “side pockets” and such Portfolio Fund’s valuation policies and procedures in respect of any such “side pockets.” The Advisor will also review any other information available to it, including reports by independent auditors, fund administrators, if any, and/or other third parties.
In instances where unaudited estimated or final values may not be available, or where such unaudited estimated or final values are determined not to be the most reliable and relevant indication of value of an interest in a Portfolio Fund (as further discussed below), additional factors that may be relevant in determining the value of an interest in a Portfolio Fund, in addition to those other factors and considerations set forth in the Valuation Procedures, include (1) changes in the valuation of hedge fund indices, (2) publicly available information regarding a Portfolio Fund’s underlying portfolio companies or investments, (3) the price at which recent subscriptions and redemptions of such Portfolio Fund interests were offered, (4) relevant news and other sources, (5) significant market events and (6) information provided to the Advisor or the Fund by a Portfolio Fund, or the failure to provide such information as agreed to in the Portfolio Fund’s offering materials or other agreements with the Fund.
In circumstances where, taking into account the factors and considerations set forth above and in the Valuation Procedures, the Advisor has reason to believe that a value provided by a Portfolio Fund is not the most reliable and relevant indication of the value of an interest in the Portfolio Fund, the Advisor may adjust such reported value to reflect the fair value of the interest in the Portfolio Fund. Likewise, in circumstances where a Portfolio Fund does not provide a valuation as contemplated above, the factors and considerations set forth above and in the Valuation Procedures may be the only indicators of the value of an interest in a Portfolio Fund and the Advisor will use such factors, together with other valuation methodologies set forth in the Valuation Procedures that may be relevant, to estimate the fair value of its interest in a Portfolio Fund. In circumstances where the Advisor determines to adjust the values reported by Portfolio Funds, or in circumstances where the Portfolio Funds do not provide valuations as contemplated above (such circumstances being collectively referred to as “Adjusted Fair Values”), such valuations will be subject to review and approval by the Global Valuation Committee or its delegate as outlined in the Valuation Procedures. The Board reviews all fair value determinations at its regularly scheduled meetings and also reviews the Valuation Procedures on a regular basis. As of March 31, 2019, the Advisor did not adjust any values received for the Portfolio Funds.
Fair Value Hierarchy:Various inputs are used in determining the fair value of investments. These inputs to valuation techniques are categorized into a fair value hierarchy consisting of three broad levels for financial statement purposes as follows:
| | • | | Level 1 — Unadjusted price quotations in active markets/exchanges for identical assets or liabilities that the Fund has the ability to access |
| | • | | Level 2 — Other observable inputs (including, but not limited to, quoted prices for similar assets or liabilities in markets that are active, quoted prices for identical or similar assets or liabilities in markets that are not active, inputs other than quoted prices that are observable for the assets or liabilities (such as interest rates, yield curves, volatilities, prepayment speeds, loss severities, credit risks and default rates) or other market–corroborated inputs) |
| | • | | Level 3 — Unobservable inputs based on the best information available in the circumstances, to the extent observable inputs are not available (including the Fund’s own assumptions used in determining the fair value of investments) |
As of March 31, 2019, the Fund’s investment was valued using net asset value per share (“NAV”) as no quoted market value is available and therefore has been excluded from the fair value hierarchy.
| 4. | INVESTMENTS IN PORTFOLIO FUND |
Information reflecting the Fund’s investments in a Portfolio Fund as of March 31, 2019 is summarized below. The Fund is not able to obtain complete investment holding details of the Portfolio Fund held within the Fund’s portfolio in order to determine whether the Fund’s proportionate share of any investments held by the Portfolio Fund exceeds 5% of the members’ capital of the Fund as of March 31, 2019.
| | | | | | | | | | | | |
| Investment | | Value | | | % of Fund’s
Members’ Capital | | | Primary
Geographic
Locations* | |
Fundamental Long/Short | | | | | | | | | | | | |
Nokota LCB, LLC | | $ | 72,636 | | | | 4.6 | | | | North America | |
* Primary Geographic Locations is based upon information of which the Fund is aware regarding the geographic allocations of the investments held by the Portfolio Fund in which the Fund invests. The Fund does not have sufficient portfolio holdings information with respect to the Portfolio Fund to monitor such positions on a look through basis. The information regarding the geographic allocation of investments held by the Portfolio Fund is derived from periodic information provided to the Fund by the managers of such Portfolio Fund. The information in this table represents only information that has been made available to the Fund with respect to investments held by the Portfolio Fund as of March 31, 2019. This information has not been independently verified by the Fund and may not be representative of the current geographic allocation of investments held by the Portfolio Fund since such Portfolio Fund are actively managed and this information is generally provided by the Portfolio Fund on a delayed basis after the date of such information.
The agreement related to investments in Portfolio Fund provide for compensation to the investment managers/general partners of such Portfolio Fund in the form of management fees generally ranging from 1% to 3% (per annum) of members’ capital and incentive fees/allocations generally ranging from 15% to 25% of the net profits earned. The Portfolio Fund’s management fees and incentive fees/allocations are included in net change in unrealized appreciation/depreciation on investments in the Statement of Operations.
| | | | |
| N O T E S T O F I N A N C I A L S T A T E M E N T S | | | 13 | |
Notes to Financial Statements (continued)
The table below summarizes the fair value and other pertinent liquidity information of the underlying Portfolio Funds by class:
| | | | | | | | |
| Major Category | | Fair Value | | | Illiquid
Investments (1) | |
Fundamental Long/Short (a) | | $ | 72,636 | | | | $72,636 | |
| | | | | | | | |
(1) Represents private investment funds that cannot be voluntarily redeemed by the Fund at any time. This includes: (i) private investment funds that are liquidating and making distribution payments as their underlying assets are sold, (ii) suspended redemptions/withdrawals, and (iii) side pocket holdings. These types of investments may be realized within 1 to 3 years from March 31, 2019, depending on the specific investment and market conditions.
(a) Fundamental long/short strategies involve buying or selling predominantly corporate securities believed to be over- or underpriced relative to their potential value. Investment strategies in this category include long and short equity- or credit-based strategies, which emphasize a fundamental valuation framework, and equity active value strategies, where an active role is taken to enhance corporate value. The application of the Valuation Procedures to investments in this category did not result in any Adjusted Fair Values as of March 31, 2019. The fair values of the investments in this category have been estimated based on the net asset values provided by management of the Portfolio Funds.
The Fund had no unfunded capital commitments as of March 31, 2019.
| 5. | INVESTMENT ADVISORY AGREEMENT AND OTHER TRANSACTIONS WITH AFFILIATES |
The Fund entered into an Investment Advisory Agreement with the Advisor, the Fund’s investment adviser and an indirect, wholly-owned subsidiary of BlackRock, Inc. (“BlackRock”), to provide investment advisory services. The Advisor is responsible for the management of the Fund’s portfolio and provides the personnel, facilities, equipment and certain other services necessary to the operations of the Fund. The Investment Advisory Agreement provides that the Advisor receives a quarterly fee in arrears at an annual rate equal to 0.75% of the Fund’smonth-end members’ capital, accrued monthly.
The Fund entered into a Distribution Agreement with BlackRock Investments, LLC (“BRIL”), an affiliate of the Advisor. Pursuant to a Distribution Plan approved by the Fund’s Board, the Fund paid BRIL ongoing distribution fees. The fees were accrued monthly and paid quarterly in arrears at an annual rate equal to 0.75% of the Fund’smonth-end members’ capital. Effective April 1, 2018, the Fund no longer pays distribution fees. In addition, the Distribution Agreement expired on August 22, 2018.
BRIL and broker-dealers, pursuant tosub-agreements with BRIL, provide shareholder servicing and distribution services to the Fund. The ongoing service and/or distribution fee compensates/reimburses BRIL and each broker-dealer for providing shareholder servicing and/or distribution related services to shareholders.
Expense Limitations, Waivers, Reimbursements and Recoupments:The Advisor contractually agreed to waive its investment advisory fee with respect to any portion of the Fund’s assets invested in affiliated equity and fixed-income mutual funds and affiliated exchange-traded funds that have a contractual management fee through July 31, 2018. The Board determined not to renew the agreement, and the agreement expired on July 31, 2018.
Effective April 1, 2018, the Advisor elected to voluntarily waive the Fund’s annual investment advisory fee. For the year ended March 31, 2019, the amount waived was $53,315.
The Fund has entered into an expense limitation agreement (“Expense Agreement”) in which the Advisor has agreed to reimburse certain operating and other expenses of the Fund in order to limit certain expenses to 0.50% per annum of the Fund’s averagemonth-end members’ capital (the “Expense Cap”). Expenses covered by the Expense Cap include all of the Fund’s expenses other than those expressly excluded by the Expense Agreement as follows: (i) the investment management fee, (ii) interest expense, if any, (iii) expenses incurred directly or indirectly by the Fund as a result of expenses related to investing in, or incurred by, a Portfolio Fund or other permitted investment, (iv) any trading-related expenses, including, but not limited to, clearing costs and commissions, (v) dividends on short sales, if any, (vi) any extraordinary expenses not incurred in the ordinary course of the Fund’s business (including, without limitation, litigation expenses) and (vii) if applicable, the distribution fees paid to BRIL or financial intermediaries. The current term of the Expense Agreement expires on July 31, 2019. For the year ended March 31, 2019, the amount waived was $103,428.
Directors and Officers:Certain directors and/or officers of the Fund are directors and/or officers of BlackRock or its affiliates. The Fund reimburses the Advisor for a portion of the compensation paid to the Fund’s Chief Compliance Officer, which is included in Directors and Officer in the Statement of Operations.
For the year ended March 31, 2019, purchases and sales of investments, excluding short-term securities, were $72,636 and $11,197,658, respectively.
It is the Fund’s policy to comply with the requirements of the Internal Revenue Code of 1986, as amended, applicable to regulated investment companies, and to distribute substantially all of its taxable income to its members. Therefore, no U.S. federal income tax provision is required.
The Fund files U.S. federal and various state and local tax returns. No income tax returns are currently under examination. The statute of limitations on the Fund’s U.S. federal tax returns generally remains open for each of the four years ended March 31, 2019. The statutes of limitations on the Fund’s state and local tax returns may remain open for an additional year depending upon the jurisdiction.
Management has analyzed tax laws and regulations and their application to the Fund as of March 31, 2019, inclusive of the open tax return years, and does not believe there are any uncertain tax positions that require recognition of a tax liability in the Fund’s financial statements.
| | |
| 14 | | 2 0 1 9 B L A C K R O C K A N N U A L R E P O R T T O S H A R E H O L D E R S |
Notes to Financial Statements (continued)
The tax character of distributions paid was as follows:
| | | | | | | | |
| | | 03/31/19(a) | | | 03/31/18(a) | |
Ordinary income | | $ | 578,330 | | | $ | 4,000,000 | |
Return of capital | | | 40,021,670 | | | | — | |
| | | | | | | | |
| | $ | 40,600,000 | | | $ | 4,000,000 | |
| | | | | | | | |
| | (a) | Paid as a series of liquidating distributions. | |
As of period end, the tax components of accumulated loss were as follows:
| | | | |
Non-expiring capital loss carryforward(a) | | $ | (1,926,761 | ) |
| | | | |
| | (a) | Amount available to offset future realized capital gains | |
As of March 31, 2019, gross unrealized appreciation and depreciation for investments based on cost for U.S. federal income tax purposes were as follows:
| | | | |
Tax cost | | $ | 72,636 | |
| | | | |
Gross unrealized appreciation | | | — | |
Gross unrealized depreciation | | | — | |
| | | | |
Net unrealized appreciation | | $ | — | |
| | | | |
The Fund’s investments in Portfolio Funds involve varying degrees of interest rate risk, credit and counterparty risk, and market, industry or geographic concentration risks for the Fund. While BlackRock monitors these risks, the varying degrees of transparency into and potential illiquidity of the securities in the Portfolio Funds may hinder BlackRock’s ability to effectively manage and mitigate these risks.
The Fund may, from time to time, allocate a significant percentage of its assets to Portfolio Funds with certain investment strategies. As of September 30, 2018, the Fund allocated a significant percentage of its assets to Portfolio Funds that employ fundamental long/short strategies, event driven and directional trading strategies. Fundamental long/short strategies involve the risk of significant losses to Portfolio Funds (and thus the Fund) if the Portfolio Fund manager’s analysis regarding the valuation of the securities is incorrect or based on inaccurate information. In addition, long and short positions may or may not be related. If the long and short positions are not related, it is possible to have investment losses in both the long and short sides of the portfolio. In the event that the perceived mispricings underlying one or more trading positions were to fail to converge toward, or were to diverge further from, expected relationships, the Portfolio Fund may incur significant losses, which could impact the value of the Fund. Fundamental long-short strategies may also expose Portfolio Funds (and thus the Fund) to risks relating to leverage, portfolio turnover, concentration of the Portfolio Fund’s investment portfolio and short-selling. Event driven strategies involve the risk that such strategy may fail to profit fully or at all or may suffer a loss or a greater loss due to a failure of the component position prices to converge or diverge as anticipated. In addition, a reduction in the volatility and market inefficiencies that create relative value opportunities may limit the Portfolio Funds’ ability to engage in relative value strategies and adversely affect the value of such Portfolio Funds (and thus the Fund).
The Portfolio Funds in which the Fund is invested utilize a wide variety of financial instruments in their trading strategies includingover-the-counter options, futures contracts, forward foreign currency exchange contracts and swap agreements, and securities sold but not yet purchased. Several of these financial instruments contain varying degrees ofoff-balance sheet risk where the maximum potential loss on a particular financial instrument may be in excess of the amounts recorded on each Portfolio Fund’s balance sheet. The Portfolio Funds are required to account for all investments on a fair value basis, and recognize changes in unrealized gains and losses in their statements of operations. In determining the fair values for these financial instruments, the Portfolio Funds will make estimates about future interest rates, default probabilities, volatilities and other pricing factors. These estimates of fair value could differ from actual results.
The Fund’s maximum exposure to market risks of the Portfolio Funds is limited to amounts included in the Fund’s investments in Portfolio Funds recorded as assets on the Statement of Assets, Liabilities and Members’ Capital.
The Fund is designed primarily for long term investors and an investment in the Fund’s Units should be considered to be illiquid. The Fund’s Units are not and will not be listed for trading on a securities exchange. Members may not be able to sell their Units as it is unlikely that a secondary market for the Units will develop or, if a secondary market does develop, members may be able to sell their Units only at substantial discounts from net asset value. Additionally, transfers of Units generally may not be effected without the express written consent of the Board or it’s delegate. Since the Fund is in liquidation, it does not anticipate conducting any further tender offers.
The Portfolio Funds invest in securities and investments with various degrees of liquidity and as such the Fund is subject to certain redemption/withdrawal provisions, in accordance with the Portfolio Funds’ offering agreements.
Certain of the Fund’s Portfolio Funds may utilize leverage. The cumulative effect of the use of leverage by Portfolio Funds in a market that moves adversely to such Portfolio Funds could result in a substantial loss to the Fund, which would be greater than if the Portfolio Funds were not leveraged. Leverage increases the risk and volatility of Portfolio Funds and, as a consequence, the Fund’s risk and volatility.
Certain of the Fund’s Portfolio Funds have the ability to suspend redemptions/withdrawals, and restrict redemptions/withdrawals through the creation of side pockets. The Fund’s ability to liquidate its investment in Portfolio Funds that had imposed such provisions may be adversely impacted. In such cases, until the Fund is permitted to liquidate its interest in the Portfolio Fund, any interest the Fund retains in such Portfolio Fund remains subject to continued exposure to changes in valuations.
The Fund also invests inclosed-end investments that may not permit redemptions/withdrawals or in Portfolio Funds that impose an initial “lockup” period before a
| | | | |
| N O T E S T O F I N A N C I A L S T A T E M E N T S | | | 15 | |
Notes to Financial Statements (continued)
redemption/withdrawal can be made. In addition, certain of the Fund’s Portfolio Funds have the ability to impose redemption gates, and in so doing, may reduce the Fund’s requested redemption/withdrawal below the requested amount.
The Fund entered liquidation on December 1, 2017. The Fund continues to hold one position in Portfolio Funds that is currently subject to restrictions on withdrawals. Members are subject to the risk that the value of these positions may fluctuate prior to their ultimate liquidation, or lose value entirely.
For the year ended March 31, 2018, Units issued and outstanding had a net decrease of 442,756 as a result of 180,724 Units subscribed for and 623,480 Units repurchased in tender offers. For the year ended March 31, 2019, there were no Units issued and outstanding Units had no change. At March 31, 2019, 485,980 Units were owned by BlackRock Holdco 2, Inc., an affiliate of the Fund.
Effective December 1, 2017, the Fund is no longer offering its Units to new or existing investors.
In the normal course, the Fund was permitted to conduct quarterly tender offers for up to 15% of its net asset value at the time in the sole discretion of its Board. In a tender offer, the Fund repurchased outstanding Units at the Fund’s net asset value on the valuation date for the tender offer, which would generally be the last business day of March, June, September or December. Units are not redeemable at an investor’s option nor are they exchangeable for shares of any other fund. Since the Fund is in liquidation, it does not anticipate conducting any further tender offers.
Tender offers were as follows:
| | | | | | | | | | | | | | |
Commencement Date(a) | | Valuation Date | | | | Units Offered
to Repurchase | | | | | Tendered
Units | |
March 27, 2015 | | June 30, 2015 | | | | | 1,127,088 | | | | | | 386,390 | |
June 29, 2015 | | September 30, 2015 | | | | | 1,076,435 | | | | | | 400,883 | |
September 29, 2015 | | December 31, 2015 | | | | | 1,042,852 | | | | | | 66,410 | |
December 31, 2015 | | March 31, 2016 | | | | | 1,002,849 | | | | | | 895,540 | |
March 28, 2016 | | June 30, 2016 | | | | | 1,051,150 | | | | | | 417,967 | |
June 27, 2016 | | September 30, 2016 | | | | | 938,990 | | | | | | 262,639 | |
September 26, 2016 | | December 30, 2016 | | | | | 885,912 | | | | | | 546,881 | |
December 27, 2016 | | March 31, 2017 | | | | | 853,884 | | | | | | 335,574 | |
March 27, 2017 | | June 30, 2017 | | | | | 782,286 | | | | | | 232,339 | |
June 27, 2017 | | September 29, 2017 | | | | | 737,390 | | | | | | 236,085 | |
September 25, 2017 | | December 29, 2017 | | | | | 725,169 | | | | | | 155,055 | |
| | (a) | Date the tender offer period begins. | |
Tendered Unit amounts are shown as repurchase of Units resulting from tender offers in the Statements of Changes in Members’ Capital.
A 2.00% early repurchase fee payable to the Fund was permitted to be charged to any member that tendered its Units to the Fund in connection with a tender offer with a valuation date that was prior to theone-year anniversary of the member’s purchase of the respective Units. The purpose of the 2.00% early repurchase fee was to reimburse the Fund for the costs incurred in liquidating investments in the Fund’s portfolio in order to honor the member’s repurchase request and to discourage short-term investments which are generally disruptive to the Fund’s investment program. This early repurchase fee applied separately to each purchase of Units made by a member and does not apply with respect to liquidating distributions.
The Fund was permitted, in its sole discretion, to waive the early repurchase fee under certain circumstances described in the Fund’s prospectus.
| 10. | REGULATIONS-X AMENDMENTS |
On August 17, 2018, the SEC adopted amendments to certain disclosure requirements in Securities Act ReleaseNo. 33-10532,Disclosure Update and Simplification.The Fund has adopted the amendments pertinent to RegulationS-X in this shareholder report. The amendments impacted certain disclosure presentation on the Statement of Assets and Liabilities, Statement of Changes in Net Assets and Notes to the Financial Statements.
Prior year distribution information and undistributed net investment income in the Statement of Changes in Net Assets has been modified to conform to the current year presentation in accordance with the RegulationS-X changes.
Distributions for the year ended March 31, 2018 were classified as Net Investment Income for $4,000,000.
Accumulated net investment loss, as of March 31, 2018 was $2,916,213.
Management has evaluated the impact of all subsequent events on the Fund through the date the financial statements were issued and has determined that there were no subsequent events requiring adjustment or additional disclosure in the financial statements.
| | |
| 16 | | 2 0 1 9 B L A C K R O C K A N N U A L R E P O R T T O S H A R E H O L D E R S |
Report of Independent Registered Public Accounting Firm
To the Board of Directors and Members of BlackRock Preferred Partners LLC:
Opinion on the Financial Statements and Financial Highlights
We have audited the accompanying statement of assets and liabilities of BlackRock Preferred Partners LLC (the “Fund”), as of March 31, 2019, the related statements of operations and cash flows for the year then ended, the statements of changes in members’ capital for each of the two years in the period then ended, the financial highlights for each of the five years in the period then ended, and the related notes. In our opinion, the financial statements and financial highlights present fairly, in all material respects, the financial position of the Fund as of March 31, 2019, and the results of its operations and its cash flows for the year then ended, and the changes in its net assets for each of the two years in the period then ended and the financial highlights for each of the five years in the period then ended, in conformity with accounting principles generally accepted in the United States of America.
Basis for Opinion
These financial statements and financial highlights are the responsibility of the Fund’s management. Our responsibility is to express an opinion on the Fund’s financial statements and financial highlights based on our audits. We are a public accounting firm registered with the Public Company Accounting Oversight Board (United States) (PCAOB) and are required to be independent with respect to the Fund in accordance with the U.S. federal securities laws and the applicable rules and regulations of the Securities and Exchange Commission and the PCAOB.
We conducted our audits in accordance with the standards of the PCAOB. Those standards require that we plan and perform the audits to obtain reasonable assurance about whether the financial statements and financial highlights are free of material misstatement, whether due to error or fraud. The Fund is not required to have, nor were we engaged to perform, an audit of its internal control over financial reporting. As part of our audits we are required to obtain an understanding of internal control over financial reporting but not for the purpose of expressing an opinion on the effectiveness of the Fund’s internal control over financial reporting. Accordingly, we express no such opinion.
Our audits included performing procedures to assess the risks of material misstatement of the financial statements and financial highlights, whether due to error or fraud, and performing procedures that respond to those risks. Such procedures included examining, on a test basis, evidence regarding the amounts and disclosures in the financial statements and financial highlights. Our audits also included evaluating the accounting principles used and significant estimates made by management, as well as evaluating the overall presentation of the financial statements and financial highlights. Our procedures included confirmation of securities owned as of March 31, 2019, by correspondence with the portfolio fund’s investment advisor. We believe that our audits provide a reasonable basis for our opinion.
Deloitte & Touche LLP
Boston, Massachusetts
May 21, 2019
We have served as the auditor of one or more BlackRock investment companies since 1992.
| | | | |
| R E P O R T O F I N D E P E N D E N T R E G I S T E R E D A C C O U N T I N G F I R M A N D I M P O R T A N T T A X I N F O R M A T I O N | | | 17 | |
| | |
| Automatic Dividend Reinvestment Plan | | BlackRock Preferred Partners LLC |
Effective December 1, 2017, the Fund’s Automatic Dividend Reinvestment Plan (the “Plan”) has been suspended. As a result of the suspension of the Plan, no dividends or distributions will be reinvested in additional Units after December 1, 2017.
| | |
| 18 | | 2 0 1 9 B L A C K R O C K A N N U A L R E P O R T T O S H A R E H O L D E R S |
Director and Officer Information
| | | | | | | | |
| Independent Directors(a) |
| | | | | |
Name
Year of Birth(b) | | Position(s) Held
(Length of
Service)(c) | | Principal Occupation(s) During Past Five Years | | Number of BlackRock-Advised Registered Investment Companies (“RICs”) Consisting of Investment Portfolios (“Portfolios”) Overseen | | Public Company
and Other
Investment
Company
Directorships
Held During Past
Five Years |
| | | | |
Richard E. Cavanagh 1946 | | Co-Chair of the Board and Director
(Since 2011) | | Director, The Guardian Life Insurance Company of America since 1998; Board Chair, Volunteers of America (anot-for-profit organization) from 2015 to 2018 (board member since 2009); Director, Arch Chemical (chemical and allied products) from 1999 to 2011; Trustee, Educational Testing Service from 1997 to 2009 and Chairman thereof from 2005 to 2009; Senior Advisor, The Fremont Group since 2008 and Director thereof since 1996; Faculty Member/Adjunct Lecturer, Harvard University since 2007 and Executive Dean from 1987 to 1995; President and Chief Executive Officer, The Conference Board, Inc. (global business research organization) from 1995 to 2007. | | 88 RICs consisting of 112 Portfolios | | None |
Karen P. Robards 1950 | | Co-Chair of the Board and Director
(Since 2011) | | Principal of Robards & Company, LLC (consulting and private investing) since 1987;Co-founder and Director of the Cooke Center for Learning and Development (anot-for-profit organization) since 1987; Director of Enable Injections, LLC (medical devices) since 2019; Investment Banker at Morgan Stanley from 1976 to 1987. | | 88 RICs consisting of 112 Portfolios | | Greenhill & Co., Inc.; AtriCure, Inc. (medical devices) from 2000 until 2017 |
Michael J. Castellano 1946 | | Director
(Since 2011) | | Chief Financial Officer of Lazard Group LLC from 2001 to 2011; Chief Financial Officer of Lazard Ltd from 2004 to 2011; Director, Support Our Aging Religious(non-profit) from 2009 to June 2015 and since 2017; Director, National Advisory Board of Church Management at Villanova University since 2010; Trustee, Domestic Church Media Foundation since 2012; Director, CircleBlack Inc. (financial technology company) since 2015. | | 88 RICs consisting of 112 Portfolios | | None |
Cynthia L. Egan 1955 | | Director
(Since 2016) | | Advisor, U.S. Department of the Treasury from 2014 to 2015; President, Retirement Plan Services for T. Rowe Price Group, Inc. from 2007 to 2012; executive positions within Fidelity Investments from 1989 to 2007. | | 88 RICs consisting of 112 Portfolios | | Unum (insurance); The Hanover Insurance Group (insurance); Envestnet (investment platform) from 2013 until 2016 |
Frank J. Fabozzi 1948 | | Director
(Since 2011) | | Editor of The Journal of Portfolio Management since 1986; Professor of Finance, EDHEC Business School (France) since 2011; Visiting Professor, Princeton University for the 2013 to 2014 academic year and Spring 2017 semester; Professor in the Practice of Finance, Yale University School of Management from 1994 to 2011 and currently a Teaching Fellow in Yale’s Executive Programs; affiliated professor Karlsruhe Institute of Technology from 2008 to 2011. | | 88 RICs consisting of 112 Portfolios | | None |
Henry Gabbay 1947 | | Director
(Since 2019) | | Board Member, BlackRock Equity-Bond Board from 2007 to 2018; Board Member, BlackRock Equity-Liquidity and BlackRockClosed-End Fund Boards from 2007 through 2014; Consultant, BlackRock, Inc. from 2007 to 2008; Managing Director, BlackRock, Inc. from 1989 to 2007; Chief Administrative Officer, BlackRock Advisors, LLC from 1998 to 2007; President of BlackRock Funds and BlackRock Allocation Target Shares (formerly, BlackRock Bond Allocation Target Shares) from 2005 to 2007 and Treasurer of certainclosed-end funds in the BlackRock fund complex from 1989 to 2006. | | 88 RICs consisting of 112 Portfolios | | None |
R. Glenn Hubbard 1958 | | Director
(Since 2011) | | Dean, Columbia Business School since 2004; Faculty member, Columbia Business School since 1988. | | 88 RICs consisting of 112 Portfolios | | ADP (data and information services); Metropolitan Life Insurance Company (insurance); KKR Financial Corporation (finance) from 2004 until 2014 |
| | | | |
D I R E C T O R A N D O F F I C E R I N F O R M A T I O N | | | 19 | |
Director and Officer Information (continued)
| | | | | | | | |
| Independent Directors(a) |
| | | | | |
Name Year of Birth(b) | | Position(s) Held
(Length of
Service)(c) | | Principal Occupation(s) During Past Five Years | | Number of BlackRock-Advised
Registered Investment Companies
(“RICs”) Consisting of Investment
Portfolios (“Portfolios”) Overseen | | Public Company
and Other
Investment
Company
Directorships
Held During Past
Five Years |
| | | | |
W. Carl Kester
1951 | | Director
(Since 2011) | | George Fisher Baker Jr. Professor of Business Administration, Harvard Business School since 2008; Deputy Dean for Academic Affairs from 2006 to 2010; Chairman of the Finance Unit, from 2005 to 2006; Senior Associate Dean and Chairman of the MBA Program from 1999 to 2005; Member of the faculty of Harvard Business School since 1981. | | 88 RICs consisting of 112 Portfolios | | None |
Catherine A. Lynch
1961 | | Director
(Since 2016) | | Chief Executive Officer, Chief Investment Officer and various other positions, National Railroad Retirement Investment Trust from 2003 to 2016; Associate Vice President for Treasury Management, The George Washington University from 1999 to 2003; Assistant Treasurer, Episcopal Church of America from 1995 to 1999. | | 88 RICs consisting of 112 Portfolios | | None |
|
| Interested Directors(a)(d) |
| | | | | |
Name Year of Birth(b) | | Position(s) Held (Length of Service)(c) | | Principal Occupation(s) During Past Five Years | | Number of BlackRock-Advised
Registered Investment Companies
(“RICs”) Consisting of Investment
Portfolios (“Portfolios”) Overseen | | Public Company
and Other
Investment
Company
Directorships
Held During Past
Five Years |
| | | | |
Robert Fairbairn
1965 | | Director
(Since 2018) | | Senior Managing Director of BlackRock, Inc. since 2010; oversees BlackRock’s Strategic Partner Program and Strategic Product Management Group; Member of BlackRock’s Global Executive and Global Operating Committees;Co-Chair of BlackRock’s Human Capital Committee; Member of the Board of Managers of BlackRock Investments, LLC from 2011 to 2018; Global Head of BlackRock’s Retail and iShares®businesses from 2012 to 2016. | | 129 RICs consisting of 297 Portfolios | | None |
John M. Perlowski
1964 | | Director (Since 2014), President and Chief Executive Officer
(Since 2011) | | Managing Director of BlackRock, Inc. since 2009; Head of BlackRock Global Accounting and Product Services since 2009; Advisory Director of Family Resource Network (charitable foundation) since 2009. | | 129 RICs consisting of 297 Portfolios | | None |
| (a) | The address of each Director is c/o BlackRock, Inc., 55 East 52nd Street, New York, New York 10055. |
| (b) | Each Independent Director holds office until his or her successor is duly elected and qualifies or until his or her earlier death, resignation, retirement or removal as provided by the Fund’sby-laws or charter or statute, or until December 31 of the year in which he or she turns 75. Directors who are “interested persons,” as defined in the Investment Company Act serve until their successor is duly elected and qualifies or until their earlier death, resignation, retirement or removal as provided by the Fund’sby-laws or statute, or until December 31 of the year in which they turn 72. The Board may determine to extend the terms of Independent Directors on acase-by-case basis, as appropriate. |
| (c) | Following the combination of Merrill Lynch Investment Managers, L.P. (“MLIM”) and BlackRock, Inc. in September 2006, the various legacy MLIM and legacy BlackRock fund boards were realigned and consolidated into three new fund boards in 2007. Certain Independent Directors first became members of the boards of other legacy MLIM or legacy BlackRock funds as follows: Richard E. Cavanagh, 1994; Frank J. Fabozzi, 1988; R. Glenn Hubbard, 2004; W. Carl Kester, 1995; and Karen P. Robards, 1998. Mr. Gabbay became a member of the boards of theopen-end funds in the Fixed-Income Complex in 2007. |
| (d) | Mr. Fairbairn and Mr. Perlowski are both “interested persons,” as defined in the Investment Company Act 1940 Act, of the Fund based on their positions with BlackRock, Inc. and its affiliates. Mr. Fairbairn and Mr. Perlowski are also board members of the BlackRock Multi-Asset Complex. |
| | |
| 20 | | 2 0 1 9 B L A C K R O C K A N N U A L R E P O R T T O S H A R E H O L D E R S |
Director and Officer Information (continued)
| | | | |
| Officers Who Are Not Directors(a) |
| | | |
Name Year of Birth(b) | | Position(s) Held (Length of Service) | | Principal Occupation(s) During Past Five Years |
Jonathan Diorio 1980 | | Vice President (Since 2015) | | Managing Director of BlackRock, Inc. since 2015; Director of BlackRock, Inc. from 2011 to 2015. |
Neal J. Andrews 1966 | | Chief Financial Officer (Since 2007) | | Chief Financial Officer of the iShares®exchange traded funds since 2019; Managing Director of BlackRock, Inc. since 2006. |
Jay M. Fife 1970 | | Treasurer (Since 2007) | | Managing Director of BlackRock, Inc. since 2007. |
Charles Park 1967 | | Chief Compliance Officer (Since 2014) | | Anti-Money Laundering Compliance Officer for certain BlackRock-advised Funds from 2014 to 2015; Chief Compliance Officer of BlackRock Advisors, LLC and the BlackRock-advised Funds in the BlackRock Multi-Asset Complex and the BlackRock Fixed-Income Complex since 2014; Principal of and Chief Compliance Officer for iShares®Delaware Trust Sponsor LLC since 2012 and BlackRock Fund Advisors (“BFA”) since 2006; Chief Compliance Officer for theBFA-advised iShares®exchange traded funds since 2006; Chief Compliance Officer for BlackRock Asset Management International Inc. since 2012. |
Janey Ahn 1975 | | Secretary (Since 2012) | | Managing Director of BlackRock, Inc. since 2018; Director of BlackRock, Inc. from 2009 to 2017. |
| (a) | The address of each Officer is c/o BlackRock, Inc., 55 East 52nd Street, New York, New York 10055. |
| (b) | Officers of the Fund serve at the pleasure of the Board. |
Further information about the Fund’s Director’s and Officers is available in the Fund’s Statement of Additional Information, which can be obtained without charge by calling (800)441-7762.
Effective January 1, 2019, Richard E. Cavanagh and Karen P. Robards were appointed as aCo-Chair of the Board. Prior to January 1, 2019, Mr. Cavanagh served as Chair of the Board and Ms. Robards served as Vice Chair of the Board. In addition, effective January 1, 2019, Henry Gabbay was appointed as a Director of the Fund.
Investment Adviser and
Administrator
BlackRock Advisors, LLC
Wilmington, DE 19809
Accounting Agent and
Transfer Agent
BNY Mellon Investment
Servicing (US) Inc.
Wilmington, DE 19809
Custodian
The Bank of New York Mellon
New York, NY 10286
Independent Registered
Public Accounting Firm
Deloitte & Touche LLP
Boston, MA 02116
Legal Counsel
Willkie Farr & Gallagher LLP
New York, NY 10019
Address of the Fund
100 Bellevue Parkway
Wilmington, DE 19809
| | | | |
| D I R E C T O R A N D O F F I C E R I N F O R M A T I O N | | | 21 | |
Additional Information
General Information
During the period, there were no material changes in the Fund’s investment objectives or policies or the Fund’s charter orby-laws that would delay or prevent a change of control of the Fund that were not approved by the shareholders or in the principal risk factors associated with investment in the Fund. There have been no changes in the persons who are primarily responsible for theday-to-day management of the Fund’s portfolio.
The Fund calculates its NAV as of the close of business on the last Business Day of each calendar month, within approximately 25 calendar days after the last Business Day of such month, and at such other times as the Board may determine. Members desiring to obtain the Fund’s most recently calculated NAV may contact The Bank of New York Mellon, at1-888-919-6902.
Electronic Delivery
Members can sign up fore-mail notifications of quarterly statements, annual and semi-annual shareholder reports and prospectuses by enrolling in the electronic delivery program. Electronic copies of shareholder reports are available on BlackRock’s website.
To enroll in electronic delivery:
Shareholders Who Hold Accounts with Investment Advisors, Banks or Brokerages:
Please contact your financial advisor. Please note that not all investment advisors, banks or brokerages may offer this service.
Householding
The Fund will mail only one copy of shareholder documents, including annual and semi-annual reports and proxy statements, to shareholders with multiple accounts at the same address. This practice is commonly called “householding” and is intended to reduce expenses and eliminate duplicate mailings of shareholder documents. Mailings of your shareholder documents may be householded indefinitely unless you instruct us otherwise. If you do not want the mailing of these documents to be combined with those for other members of your household, please call the Fund at (800)882-0052.
Availability of Quarterly Schedule of Investments
The Fund files its complete schedule of portfolio holdings with the SEC for the first and third quarters of each fiscal year on FormN-Q. The Fund’s FormsN-Q are available on the SEC’s website at http://www.sec.gov. The Fund’s FormsN-Q may also be obtained upon request and without charge by calling (800)882-0052.
Availability of Proxy Voting Policies and Procedures
A description of the policies and procedures that the Fund uses to determine how to vote proxies relating to portfolio securities is available upon request and without charge (1) by calling (800)882-0052; (2) athttp://www.blackrock.com;and (3) on the SEC’s website at http://www.sec.gov.
Availability of Proxy Voting Record
Information about how the Fund voted proxies relating to securities held in the Fund’s portfolios during the most recent12-month period ended June 30 is available upon request and without charge (1) at www.blackrock.com;or by calling (800)882-0052; and (2) on the SEC’s website at http://www.sec.gov.
BlackRock Privacy Principles
BlackRock is committed to maintaining the privacy of its current and former fund investors and individual clients (collectively, “Clients”) and to safeguarding theirnon-public personal information. The following information is provided to help you understand what personal information BlackRock collects, how we protect that information and why in certain cases we share such information with select parties.
If you are located in a jurisdiction where specific laws, rules or regulations require BlackRock to provide you with additional or different privacy-related rights beyond what is set forth below, then BlackRock will comply with those specific laws, rules or regulations.
BlackRock obtains or verifies personalnon-public information from and about you from different sources, including the following: (i) information we receive from you or, if applicable, your financial intermediary, on applications, forms or other documents; (ii) information about your transactions with us, our affiliates, or others; (iii) information we receive from a consumer reporting agency; and (iv) from visits to our websites.
BlackRock does not sell or disclose tonon-affiliated third parties anynon-public personal information about its Clients, except as permitted by law or as is necessary to respond to regulatory requests or to service Client accounts. Thesenon-affiliated third parties are required to protect the confidentiality and security of this information and to use it only for its intended purpose.
We may share information with our affiliates to service your account or to provide you with information about other BlackRock products or services that may be of interest to you. In addition, BlackRock restricts access tonon-public personal information about its Clients to those BlackRock employees with a legitimate business need for the information. BlackRock maintains physical, electronic and procedural safeguards that are designed to protect thenon-public personal information of its Clients, including procedures relating to the proper storage and disposal of such information.
| | |
| 22 | | 2 0 1 9 B L A C K R O C K A N N U A L R E P O R T T O S H A R E H O L D E R S |
This report is intended for current holders. It is not a prospectus. Past performance results shown in this report should not be considered a representation of future performance. Statements and other information herein are as dated and are subject to change.

| | |
| Prefp-3/19-AR | |  |
| | |
| Item 2 – | | Code of Ethics – The registrant (or the “Fund”) has adopted a code of ethics, as of the end of the period covered by this report, applicable to the registrant’s principal executive officer, principal financial officer, principal accounting officer or controller, or persons performing similar functions. During the period covered by this report, the code of ethics was amended to update certain information and to make othernon-material changes. During the period covered by this report, there have been no waivers granted under the code of ethics. The registrant undertakes to provide a copy of the code of ethics to any person upon request, without charge, who calls1-800-882-0052, option 4. |
| |
| Item 3 – | | Audit Committee Financial Expert – The registrant’s board of directors (the “board of directors”), has determined that (i) the registrant has the following audit committee financial experts serving on its audit committee and (ii) each audit committee financial expert is independent: |
| |
| | Michael Castellano |
| | Frank J. Fabozzi |
| | Henry Gabbay |
| | Catherine A. Lynch |
| | Karen P. Robards |
| |
| | The registrant’s board of directors has determined that Karen P. Robards qualifies as an audit committee financial expert pursuant to Item 3(c)(4) of FormN-CSR. |
| |
| | Ms. Robards has a thorough understanding of generally accepted accounting principles, financial statements and internal control over financial reporting as well as audit committee functions. Ms. Robards has been President of Robards & Company, a financial advisory firm, since 1987. Ms. Robards was formerly an investment banker for more than 10 years where she was responsible for evaluating and assessing the performance of companies based on their financial results. Ms. Robards has over 30 years of experience analyzing financial statements. She also is a member of the audit committee of one publicly held company and anon-profit organization. |
| |
| | Under applicable securities laws, a person determined to be an audit committee financial expert will not be deemed an “expert” for any purpose, including without limitation for the purposes of Section 11 of the Securities Act of 1933, as a result of being designated or identified as an audit committee financial expert. The designation or identification of a person as an audit committee financial expert does not impose on such person any duties, obligations, or liabilities greater than the duties, obligations, and liabilities imposed on such person as a member of the audit committee and board of directors in the absence of such designation or identification. The designation or identification of a person as an audit committee financial expert does not affect the duties, obligations, or liability of any other member of the audit committee or board of directors. |
| |
| Item 4 – | | Principal Accountant Fees and Services |
| |
| | The following table presents fees billed by Deloitte & Touche LLP (“D&T”) in each of the last two fiscal years for the services rendered to the Fund: |
2
| | | | | | | | | | | | | | | | |
| | | (a) Audit Fees | | (b) Audit-Related Fees1 | | (c) Tax Fees2 | | (d) All Other Fees |
| Entity Name | | Current
Fiscal Year
End | | Previous
Fiscal Year
End | | Current
Fiscal Year
End | | Previous
Fiscal Year
End | | Current
Fiscal Year
End | | Previous
Fiscal Year
End | | Current
Fiscal Year
End | | Previous
Fiscal Year
End |
| BlackRock Preferred Partners LLC | | $27,540 | | $42,840 | | $0 | | $0 | | $15,100 | | $15,100 | | $0 | | $0 |
The following table presents fees billed by D&T that were required to be approved by the registrant’s audit committee (the “Committee”) for services that relate directly to the operations or financial reporting of the Fund and that are rendered on behalf of BlackRock Advisors, LLC ( the “Investment Adviser” or “BlackRock”) and entities controlling, controlled by, or under common control with BlackRock (not including anysub-adviser whose role is primarily portfolio management and is subcontracted with or overseen by another investment adviser) that provide ongoing services to the Fund (“Affiliated Service Providers”):
| | | | |
| | | Current Fiscal Year End | | Previous Fiscal Year End |
| (b) Audit-Related Fees1 | | $0 | | $0 |
| (c) Tax Fees2 | | $0 | | $0 |
| (d) All Other Fees3 | | $2,050,500 | | $2,274,000 |
1 The nature of the services includes assurance and related services reasonably related to the performance of the audit or review of financial statements not included in Audit Fees, including accounting consultations, agreed-upon procedure reports, attestation reports, comfort letters,out-of-pocket expenses and internal control reviews not required by regulators.
2 The nature of the services includes tax compliance and/or tax preparation, including services relating to the filing or amendment of federal, state or local income tax returns, regulated investment company qualification reviews, taxable income and tax distribution calculations.
3Non-audit fees of $2,050,500 and $2,274,000 for the current fiscal year and previous fiscal year, respectively, were paid to the Fund’s principal accountant in their entirety by BlackRock, in connection with services provided to the Affiliated Service Providers of the Fund and of certain other funds sponsored and advised by BlackRock or its affiliates for a service organization review and an accounting research tool subscription. These amounts represent aggregate fees paid by BlackRock and were not allocated on a per fund basis.
(e)(1) Audit CommitteePre-Approval Policies and Procedures:
The Committee has adopted policies and procedures with regard to thepre-approval of services. Audit, audit-related and tax compliance services provided to the registrant on an annual basis require specificpre-approval by the Committee. The Committee also must approve othernon-audit services provided to the registrant and thosenon-audit services provided to the Investment Adviser and Affiliated Service Providers that relate directly to the operations and the financial reporting of the registrant. Certain of thesenon-audit services that the Committee believes are (a) consistent with the SEC’s auditor independence rules and (b) routine and recurring services that will not impair the independence of the independent accountants may be approved by the Committee without consideration on a specificcase-by-case basis (“generalpre-approval”). The term of any generalpre-approval is 12 months from the date of thepre-approval, unless the Committee provides for a different period. Tax or othernon-audit services provided to the registrant which have a direct impact on the operations or financial reporting of the registrant will only be deemedpre-approved provided that any individual project does not exceed $10,000 attributable to the registrant or $50,000 per project. For this purpose, multiple projects will be aggregated to determine if they exceed the previously mentioned cost levels.
Any proposed services exceeding thepre-approved cost levels will require specificpre-approval by the Committee, as will any other services not subject to generalpre-approval (e.g., unanticipated but permissible services). The Committee is informed of each service approved subject to generalpre-approval at the next regularly scheduledin-person board meeting. At this meeting, an analysis of such services is presented to the Committee for ratification. The Committee
3
may delegate to the Committee Chairman the authority to approve the provision of and fees for any specific engagement of permittednon-audit services, including services exceedingpre-approved cost levels.
(e)(2) None of the services described in each of Items 4(b) through (d) were approved by the Committee pursuant to the de minimis exception in paragraph (c)(7)(i)(C) of Rule2-01 of RegulationS-X.
(f) Not Applicable
(g) The aggregatenon-audit fees, defined as the sum of the fees shown under “Audit-Related Fees,” “Tax Fees” and “All Other Fees,” paid to the accountant for services rendered by the accountant to the registrant, the Investment Adviser and the Affiliated Service Providers were:
| | | | | | |
| Entity Name | | Current Fiscal Year End | | Previous Fiscal Year End | | |
| BlackRock Preferred Partners LLC | | $15,100 | | $15,100 |
Additionally, the amounts billed by D&T in connection with services provided to the Affiliated Service Providers of the Fund and of other funds sponsored or advised by BlackRock or its affiliates during the current and previous fiscal years for a service organization review and an accounting research tool subscription were:
| | |
Current Fiscal Year End | | Previous Fiscal Year End |
| $2,050,500 | | $2,274,000 |
| | |
| | | These amounts represent aggregate fees paid by BlackRock and were not allocated on a per fund basis. |
| |
| | | (h) The Committee has considered and determined that the provision ofnon-audit services that were rendered to
the Investment Adviser, and the Affiliated Service Providers that were notpre-approved pursuant to
paragraph (c)(7)(ii) of Rule2-01 of RegulationS-X is compatible with maintaining the principal accountant’s
independence. |
| |
Item 5 – | | Audit Committee of Listed Registrants |
| |
| | | (a) Not Applicable |
| |
| | | (b) Not Applicable |
| |
Item 6 – | | Investments |
| |
| | (a) The registrant’s Schedule of Investments is included as part of the Report to Stockholders filed under Item 1 of this Form. |
4
| | |
| | (b) Not Applicable due to no such divestments during the semi-annual period covered since the previousForm N-CSR filing. |
| |
Item 7 – | | Disclosure of Proxy Voting Policies and Procedures forClosed-End Management Investment Companies – The board of directors has delegated the voting of proxies for the Fund’s portfolio securities to the Investment Adviser pursuant to the Investment Adviser’s proxy voting guidelines. Under these guidelines, the Investment Adviser will vote proxies related to Fund securities in the best interests of the Fund and its stockholders. From time to time, a vote may present a conflict between the interests of the Fund’s stockholders, on the one hand, and those of the Investment Adviser, or any affiliated person of the Fund or the Investment Adviser, on the other. In such event, provided that the Investment Adviser’s Equity Investment Policy Oversight Committee, or asub-committee thereof (the “Oversight Committee”) is aware of the real or potential conflict or materialnon-routine matter and if the Oversight Committee does not reasonably believe it is able to follow its general voting guidelines (or if the particular proxy matter is not addressed in the guidelines) and vote impartially, the Oversight Committee may retain an independent fiduciary to advise the Oversight Committee on how to vote or to cast votes on behalf of the Investment Adviser’s clients. If the Investment Adviser determines not to retain an independent fiduciary, or does not desire to follow the advice of such independent fiduciary, the Oversight Committee shall determine how to vote the proxy after consulting with the Investment Adviser’s Portfolio Management Group and/or the Investment Adviser’s Legal and Compliance Department and concluding that the vote cast is in its client’s best interest notwithstanding the conflict. A copy of the Fund’s Proxy Voting Policy and Procedures are attached as Exhibit 99.PROXYPOL. Information on how the Fund voted proxies relating to portfolio securities during the most recent12-month period ended June 30 is available without charge, (i) at www.blackrock.com and (ii) on the SEC’s website athttp://www.sec.gov. |
| |
Item 8 – | | Portfolio Managers ofClosed-End Management Investment Companies |
| |
| | (a)(1) As of the date of filing this Report: |
| |
| | The Fund is managed by a team of investment professionals comprised of Edward Rzeszowski, Managing Director at BlackRock, and Nicholas Sideratos, Managing Director at BlackRock. Messrs. Rzeszowski and Sideratos are jointly responsible for theday-to-day management of the registrant’s portfolio, which includes setting the registrant’s overall investment strategy, overseeing the management of the registrant and selection of its investments. Messrs. Rzeszowski and Sideratos have each been members of the registrant’s portfolio management team since the Fund’s inception in 2011. |
| | | | |
| Portfolio Manager | | Biography | | |
| Edward Rzeszowski | | Managing Director of BlackRock since 2007; Director of BlackRock from 2006 to 2007. | | |
| Nicholas Sideratos | | Managing Director of BlackRock since 2007; Principal of Quellos from 2006 to 2007. | | |
(a)(2) As of March 31, 2019:
5
| | | | | | | | | | | | |
| | | (ii) Number of Other Accounts Managed and Assets by Account Type | | (iii) Number of Other Accounts and Assets for Which Advisory Fee is Performance-Based |
(i) Name of Portfolio Manager | | Other Registered Investment Companies | | Other Pooled Investment Vehicles | | Other Accounts | | Other Registered Investment Companies | | Other Pooled Investment Vehicles | | Other Accounts |
Edward Rzeszowski | | 0 | | 5 | | 0 | | 0 | | 0 | | 0 |
| | | $0 | | $44.7 Million | | $0 | | $0 | | $0 | | $0 |
Nicholas Sideratos | | 0 | | 8 | | 1 | | 0 | | 0 | | 0 |
| | | $0 | | $2.46 Billion | | $360.6 Million | | $0 | | $0 | | $0 |
(iv) Portfolio Manager Potential Material Conflicts of Interest
BlackRock has built a professional working environment, firm-wide compliance culture and compliance procedures and systems designed to protect against potential incentives that may favor one account over another. BlackRock has adopted policies and procedures that address the allocation of investment opportunities, execution of portfolio transactions, personal trading by employees and other potential conflicts of interest that are designed to ensure that all client accounts are treated equitably over time. Nevertheless, BlackRock furnishes investment management and advisory services to numerous clients in addition to the Fund, and BlackRock may, consistent with applicable law, make investment recommendations to other clients or accounts (including accounts which are hedge funds or have performance or higher fees paid to BlackRock, or in which portfolio managers have a personal interest in the receipt of such fees), which may be the same as or different from those made to the Fund. In addition, BlackRock, Inc., its affiliates and significant shareholders and any officer, director, shareholder or employee may or may not have an interest in the securities whose purchase and sale BlackRock recommends to the Fund. BlackRock, Inc., or any of its affiliates or significant shareholders, or any officer, director, shareholder, employee or any member of their families may take different actions than those recommended to the Fund by BlackRock with respect to the same securities. Moreover, BlackRock may refrain from rendering any advice or services concerning securities of companies of which any of BlackRock, Inc.’s (or its affiliates’ or significant shareholders’) officers, directors or employees are directors or officers, or companies as to which BlackRock, Inc. or any of its affiliates or significant shareholders or the officers, directors and employees of any of them has any substantial economic interest or possesses materialnon-public information. Certain portfolio managers also may manage accounts whose investment strategies may at times be opposed to the strategy utilized for a fund. It should also be noted that Messrs. Rzesowski and Sideratos may be managing hedge fund and/or long only accounts, or may be part of a team managing hedge fund and/or long only accounts, subject to incentive fees. Messrs. Rzesowski and Sideratos may therefore be entitled to receive a portion of any incentive fees earned on such accounts.
As a fiduciary, BlackRock owes a duty of loyalty to its clients and must treat each client fairly. When BlackRock purchases or sells securities for more than one account, the trades must be allocated in a manner consistent with its fiduciary duties. BlackRock attempts to allocate investments in a fair and equitable manner among client accounts, with no account receiving preferential treatment. To this end, BlackRock, Inc. has adopted policies that are intended to ensure reasonable efficiency in client transactions and provide BlackRock with sufficient
6
flexibility to allocate investments in a manner that is consistent with the particular investment discipline and client base, as appropriate.
(a)(3)Portfolio Manager Compensation Overview
The discussion below describes the portfolio managers’ compensation as of March 31, 2019.
BlackRock’s financial arrangements with its portfolio managers, its competitive compensation and its career path emphasis at all levels reflect the value senior management places on key resources. Compensation may include a variety of components and may vary from year to year based on a number of factors. The principal components of compensation include a base salary, a performance-based discretionary bonus, participation in various benefits programs and one or more of the incentive compensation programs established by BlackRock.
Base Compensation. Generally, portfolio managers receive base compensation based on their position with the firm.
Discretionary Incentive Compensation
Discretionary incentive compensation is a function of several components: the performance of BlackRock, Inc., the performance of the portfolio manager’s group within BlackRock, the investment performance, including risk-adjusted returns, of the firm’s assets under management or supervision by that portfolio manager, and the individual’s performance and contribution to the overall performance of these portfolios and BlackRock. Among other things, BlackRock’s Chief Investment Officers make a subjective determination with respect to each portfolio manager’s compensation based on the performance of the Funds and other accounts managed by each portfolio manager. Performance of multi-asset class funds is generally measured on apre-tax basis over various time periods including1-,3- and5- year periods, as applicable. With respect to these portfolio managers, such benchmarks for the Fund and other accounts are:
| | |
| Portfolio Managers | | Applicable Benchmarks |
| Edward Rzeszowski | | HFRI Fund of Funds Composite Index and Bank of America Merrill Lynch3-Month U.S. Treasury Bill Index |
| Nicholas Sideratos | | HFRI Fund of Funds Composite Index |
Distribution of Discretionary Incentive Compensation. Discretionary incentive compensation is distributed to portfolio managers in a combination of cash, deferred BlackRock, Inc. stock awards, and/or deferred cash awards that notionally track the return of certain BlackRock investment products.
Portfolio managers receive their annual discretionary incentive compensation in the form of cash. Portfolio managers whose total compensation is above a specified threshold also receive deferred BlackRock, Inc. stock awards annually as part of their discretionary incentive compensation. Paying a portion of discretionary incentive compensation in the form of deferred BlackRock, Inc. stock puts compensation earned by a portfolio manager for a given year “at risk”
7
based on BlackRock’s ability to sustain and improve its performance over future periods. In some cases, additional deferred BlackRock, Inc. stock may be granted to certain key employees as part of a long-term incentive award to aid in retention, align interests with long-term shareholders and motivate performance. Deferred BlackRock, Inc. stock awards are generally granted in the form of BlackRock, Inc. restricted stock units that vest pursuant to the terms of the applicable plan and, once vested, settle in BlackRock, Inc. common stock. The portfolio managers of this Fund have deferred BlackRock, Inc. stock awards.
For certain portfolio managers, a portion of the discretionary incentive compensation is also distributed in the form of deferred cash awards that notionally track the returns of select BlackRock investment products they manage, which provides direct alignment of portfolio manager discretionary incentive compensation with investment product results. Deferred cash awards vest ratably over a number of years and, once vested, settle in the form of cash. Only portfolio managers who manage specified products and whose total compensation is above a specified threshold are eligible to participate in the deferred cash award program.
Other Compensation Benefits.In addition to base salary and discretionary incentive compensation, portfolio managers may be eligible to receive or participate in one or more of the following:
Incentive Savings Plans — BlackRock, Inc. has created a variety of incentive savings plans in which BlackRock, Inc. employees are eligible to participate, including a 401(k) plan, the BlackRock Retirement Savings Plan (RSP), and the BlackRock Employee Stock Purchase Plan (ESPP). The employer contribution components of the RSP include a company match equal to 50% of the first 8% of eligible pay contributed to the plan capped at $5,000 per year, and a company retirement contribution equal to3-5% of eligible compensation up to the Internal Revenue Service limit ($280,000 for 2019). The RSP offers a range of investment options, including registered investment companies and collective investment funds managed by the firm. BlackRock, Inc. contributions follow the investment direction set by participants for their own contributions or, absent participant investment direction, are invested into a target date fund that corresponds to, or is closest to, the year in which the participant attains age 65. The ESPP allows for investment in BlackRock, Inc. common stock at a 5% discount on the fair market value of the stock on the purchase date. Annual participation in the ESPP is limited to the purchase of 1,000 shares of common stock or a dollar value of $25,000 based on its fair market value on the purchase date. All of the eligible portfolio managers are eligible to participate in these plans.
(a)(4)Beneficial Ownership of Securities – As of March 31, 2019:
| | |
| Portfolio Manager | | Dollar Range of Equity Securities of the Fund Beneficially Owned |
Edward Rzeszowski | | $1-$10,000 |
Nicholas Sideratos | | $1-$10,000 |
(b) Not Applicable
| | |
Item 9 – | | Purchases of Equity Securities byClosed-End Management Investment Company and Affiliated Purchasers – Not Applicable due to no such purchases during the period covered by this report. |
8
| | |
Item 10 – | | Submission of Matters to a Vote of Security Holders – There have been no material changes to these procedures. |
| |
Item 11 – | | Controls and Procedures |
| |
| | (a) The registrant’s principal executive and principal financial officers, or persons performing similar functions, have concluded that the registrant’s disclosure controls and procedures (as defined in Rule30a-3(c) under the Investment Company Act of 1940, as amended (the “1940 Act”)) are effective as of a date within 90 days of the filing of this report based on the evaluation of these controls and procedures required by Rule30a-3(b) under the 1940 Act and Rule 13a-15(b) under the Securities Exchange Act of 1934, as amended. |
| |
| | (b) There were no changes in the registrant’s internal control over financial reporting (as defined inRule 30a-3(d) under the 1940 Act) that occurred during the last fiscal quarter of the period covered by this report that have materially affected, or are reasonably likely to materially affect, the registrant’s internal control over financial reporting. |
| |
Item 12 – | | Disclosure of Securities Lending Activities forClosed-End Management Investment Companies |
| |
| | (a) The following table shows the dollar amounts of income, and dollar amounts of fees and/or compensation paid, relating to the Fund’s securities lending activities during the fiscal year ended March 31, 2019. The Fund did not engage in any securities lending activity during the fiscal year ended March 31, 2019. |
| | | | | | | | | | | | |
| | | BlackRock Preferred Partners LLC | | | | | | | | |
| (1) | | Gross income from securities lending activities | | | | | | $ | 0 | |
| (2) | | Fees and/or compensation for securities lending activities and related services | | | | | | | | |
| | (a) | | Securities lending income paid to BIM for services as securities lending agent | | $ | 0 | | | | | |
| | (b) | | Collateral management expenses (including fees deducted from a polled cash collateral vehicle) not included in (a) | | $ | 0 | | | | | |
| | (c) | | Administrative fees not included in (a) | | $ | 0 | | | | | |
| | (d) | | Indemnification fees not included in (a) | | $ | 0 | | | | | |
| | (e) | | Rebate (paid to borrowers) | | $ | 0 | | | | | |
| | (f) | | Other fees not included in (a) | | $ | 0 | | | | | |
| (3) | | Aggregate fees/compensation for securities lending activities | | | | | | $ | 0 | |
| (4) | | Net income from securities lending activities | | | | | | $ | 0 | |
(b) BlackRock Investment Management, LLC (“BIM”) serves as securities lending agent for the Fund and in that role administers the Fund’s securities lending program pursuant to the terms of a securities lending agency agreement entered into between the Fund and BIM.
| | |
Item 13 – | | Exhibits attached hereto |
| |
| | (a)(1) – Code of Ethics – See Item 2 |
| |
| | (a)(2) – Certifications – Attached hereto |
| |
| | (a)(3) – Not Applicable |
9
| | |
| | (a)(4) – Not Applicable |
| |
| | (b) – Certifications – Attached hereto |
10
Pursuant to the requirements of the Securities Exchange Act of 1934 and the Investment Company Act of 1940, the registrant has duly caused this report to be signed on its behalf by the undersigned, thereunto duly authorized.
BlackRock Preferred Partners LLC
| | |
| By: | | /s/ John M. Perlowski |
| | John M. Perlowski |
| | Chief Executive Officer (principal executive officer) of |
| | BlackRock Preferred Partners LLC |
|
| Date: June 5, 2019 |
Pursuant to the requirements of the Securities Exchange Act of 1934 and the Investment Company Act of 1940, this report has been signed below by the following persons on behalf of the registrant and in the capacities and on the dates indicated.
| | |
| By: | | /s/ John M. Perlowski |
| | John M. Perlowski |
| | Chief Executive Officer (principal executive officer) of |
| | BlackRock Preferred Partners LLC |
|
| Date: June 5, 2019 |
| |
| By: | | /s/ Neal J. Andrews |
| | Neal J. Andrews |
| | Chief Financial Officer (principal financial officer) of |
| | BlackRock Preferred Partners LLC |
|
| Date: June 5, 2019 |
11