| | | |
| ANNUAL REPORT | |
| December 31, 2019 | |
| | | |
Important Notice: The U.S. Securities and Exchange Commission will permit funds to make shareholder reports available electronically beginning January 1, 2021. Accordingly, paper copies will no longer be mailed. Instead, at that time, the Evercore Equity Fund will send a notice, either by mail or e-mail, each time your fund’s updated report is available on our website (www.evercoreequityfund.com). Investors enrolled in electronic delivery will receive the notice by e-mail, with links to the updated report and don’t need to take any action. Investors who are not enrolled in electronic delivery by January 1, 2021 will receive the notice in the mail. All investors who prefer to receive shareholder reports in a printed format may, at any time, choose that option free of charge by calling 1-800-443-4693.
(This Page Intentionally Left Blank.)
EVERCORE EQUITY FUND
SHAREHOLDER LETTER (Unaudited)
Dear Shareholders,
The Evercore Equity Fund was up 11.58% in the fourth quarter capping off a very strong absolute and relative year. For the full year, the fund was up 38.46%. For the year, the S&P 500 was up 31.49%. For the trailing 3 year period, the fund has returned 18.16% per annum versus the S&P 500 up 15.27%.
For the full year, the three largest contributors to performance were Apple, Blackstone and Mastercard. All of these positions have been held for many years. Towards year end, we also had strong contributions from United Health and two of our more recent additions, Best Buy and Royal Caribbean. We had only three holdings generate a negative return for the year; 3M, Dorman and Core Labs. All three were sold well before year-end. We remain very positive on our portfolio holdings and are also finding good opportunities to pursue. We have a number of ideas that are in the later stages of due diligence and are hopeful that we will soon have some new holdings that will be catalysts for performance in the near and further future.
Despite the large gains in 2019, the equity market is not significantly overvalued. It is not cheap on historical terms but, given earnings strength and low inflation we consider it fairly valued – perhaps the higher end of a “fair” range. A key to our consideration of value, is that inflation stays low. While we do not expect it, we will be watching for indicators that signal inflation is picking up as this would make us more cautious.
With respect to the broader outlook, it is always very difficult to predict the markets. The US economy is in very good shape – the consumer is financially strong, unemployment is at record lows, productivity is increasing and inflation is subdued. These are all good data points and should create an environment where corporate profits can grow. There are of course other issues to consider – pandemics, politics, international trade tension, the Federal debt and the deficit. And, while these are all critical issues, they can be over analyzed for their near-term impact on the market. We of course keep our eyes and ears attuned to these important issues but believe that our most important attention should be focused on “our” companies and their progress and valuation.
At year-end, the Evercore Equity Fund had $203mm of assets. We had 35 equity holdings representing 95% of the assets and approximately 5% in cash and cash equivalents.
Sincerely,
| Timothy Evnin | Charles Ryan |
| Portfolio Manager | Portfolio Manager |
| | |
| Michael Seppelt | |
| Portfolio Manager | |
This report must be preceded or accompanied by a prospectus.
The S&P 500 Index is a market-capitalization weighted index that includes the 500 most widely held common stocks. It is not possible to invest directly in an index.
Mutual fund investing involves risk. Principal loss is possible. The Fund may invest in smaller and medium capitalization companies, which involves additional risks such as limited liquidity and greater volatility than large capitalization companies. The Fund may invest in foreign securities which involve political, economic and currency risks, greater volatility and differences in accounting methods.
Opinions expressed are subject to change, are not intended to be a forecast of future events, a guarantee of future results, nor investment advice.
Fund holdings are subject to change and should not be considered a recommendation to buy or sell any security. Please see the schedule of investments section in this report for a full listing of the Fund’s holdings.
The Evercore Equity Fund is distributed by Quasar Distributors, LLC.
Earnings growth is not a measure of the Fund’s future performance.
EVERCORE EQUITY FUND
SCHEDULE OF INVESTMENTS
December 31, 2019
| | | Shares | | | Value | |
| COMMON STOCKS – 95.1% | | | | | | |
| | | | | | | |
| Chemicals – 2.8% | | | | | | |
Celanese Corp. | | | 46,405 | | | $ | 5,713,384 | |
| | | | | | | | | |
| Containers & Packaging – 2.0% | | | | | | | | |
WestRock Co. | | | 93,375 | | | | 4,006,721 | |
| | | | | | | | | |
| Drugs – 2.6% | | | | | | | | |
Abbott Laboratories | | | 61,110 | | | | 5,308,015 | |
| | | | | | | | | |
| Electrical Equipment – 2.5% | | | | | | | | |
Roper Industries, Inc. | | | 14,225 | | | | 5,038,922 | |
| | | | | | | | | |
| Financial Services – 14.3% | | | | | | | | |
BlackRock, Inc. – Class A | | | 7,040 | | | | 3,539,008 | |
Mastercard, Inc. | | | 29,405 | | | | 8,780,039 | |
Morgan Stanley | | | 104,285 | | | | 5,331,049 | |
Synchrony Financial | | | 121,090 | | | | 4,360,451 | |
The Blackstone Group | | | | | | | | |
Inc. – Class A | | | 126,900 | | | | 7,098,786 | |
| | | | | | | | 29,109,333 | |
| | | | | | | | | |
| Health Care Services – 8.3% | | | | | | | | |
Thermo Fisher Scientific, Inc. | | | 27,760 | | | | 9,018,391 | |
UnitedHealth Group, Inc. | | | 26,960 | | | | 7,925,701 | |
| | | | | | | | 16,944,092 | |
| | | | | | | | | |
| Insurance – 2.4% | | | | | | | | |
Chubb Ltd. | | | 30,945 | | | | 4,816,899 | |
| | | | | | | | | |
| Leisure Products – 3.0% | | | | | | | | |
Royal Caribbean Cruises Ltd. | | | 44,795 | | | | 5,980,580 | |
| | | | | | | | | |
| Office Equipment – 4.0% | | | | | | | | |
Apple, Inc. | | | 27,420 | | | | 8,051,883 | |
| | | | | | | | | |
| Property Management – 3.3% | | | | | | | | |
CBRE Group, Inc. – Class A (a) | | | 110,100 | | | | 6,748,029 | |
| | | | | | | | | |
| Restaurants – 2.2% | | | | | | | | |
Domino’s Pizza, Inc. | | | 15,505 | | | | 4,555,059 | |
| | | | | | | | | |
| Retail – 5.0% | | | | | | | | |
Best Buy Co., Inc. | | | 50,905 | | | | 4,469,459 | |
TJX Companies, Inc. | | | 94,205 | | | | 5,752,157 | |
| | | | | | | | 10,221,616 | |
| | | | | | | | | |
| Semiconductors – 6.9% | | | | | | | | |
Applied Materials, Inc. | | | 64,745 | | |
| 3,952,035 | |
IPG Photonics Corp. (a) | | | 25,675 | | | | 3,720,821 | |
Texas Instruments, Inc. | | | 49,990 | | | | 6,413,217 | |
| | | | | | | | 14,086,073 | |
| | | | | | | | | |
| Services – 10.1% | | | | | | | | |
Accenture PLC – Class A | | | 29,215 | | | | 6,151,803 | |
Alphabet, Inc. – Class A (a) | | | 1,865 | | | | 2,497,962 | |
Alphabet, Inc. – Class C (a) | | | 3,647 | | | | 4,876,112 | |
Amazon.com, Inc. (a) | | | 3,780 | | | | 6,984,835 | |
| | | | | | | | 20,510,712 | |
| | | | | | | | | |
| Software – 9.7% | | | | | | | | |
Adobe Systems, Inc. (a) | | | 16,730 | | | | 5,517,721 | |
Ansys, Inc. (a) | | | 17,895 | | | | 4,606,352 | |
Microsoft Corp. | | | 60,760 | | | | 9,581,852 | |
| | | | | | | | 19,705,925 | |
| | | | | | | | | |
| Specialty Retail – 13.1% | | | | | | | | |
Alibaba Group | | | | | | | | |
Holding Ltd. (a) | | | 26,125 | | | | 5,541,112 | |
AutoZone, Inc. (a) | | | 4,550 | | | | 5,420,461 | |
BorgWarner, Inc. | | | 111,990 | | | | 4,858,126 | |
Home Depot, Inc. | | | 28,545 | | | | 6,233,657 | |
Nike, Inc. – Class B | | | 44,215 | | | | 4,479,422 | |
| | | | | | | | 26,532,778 | |
| | | | | | | | | |
| Telecommunications – 2.9% | | | | | | | | |
American Tower Corp. – REIT | | | 25,570 | | | | 5,876,497 | |
| TOTAL COMMON STOCKS | | | | | | | | |
(Cost $94,035,686) | | | | | | | 193,206,518 | |
The accompanying notes are an integral part of these financial statements.
EVERCORE EQUITY FUND
SCHEDULE OF INVESTMENTS (continued)
December 31, 2019
| | | Shares | | | Value | |
| SHORT-TERM INVESTMENT – 4.9% | | | | | | |
Invesco Government & | | | | | | |
Agency Portfolio, | | | | | | |
Institutional Class, 1.51% (b) | | | 9,883,902 | | | $ | 9,883,902 | |
| TOTAL SHORT-TERM | | | | | | | | |
| INVESTMENT | | | | | | | | |
(Cost $9,883,902) | | | | | | | 9,883,902 | |
| | | | | | | | | |
| TOTAL INVESTMENTS | | | | | | | | |
(Cost $103,919,588) – 100.0% | | | | | | | 203,090,420 | |
Other Assets in Excess | | | | | | | | |
of Liabilities – 0.0% | | | | | | | 25,016 | |
| TOTAL NET | | | | | | | | |
| ASSETS – 100.0% | | | | | | $ | 203,115,436 | |
(a) | Non-income producing security |
(b) | The rate shown is the annualized seven day effective yield as of December 31, 2019. |
REIT – Real Estate Investment Trust
The accompanying notes are an integral part of these financial statements.
EVERCORE EQUITY FUND
STATEMENT OF ASSETS AND LIABILITIES
December 31, 2019
| ASSETS: | | | |
| Investments, at value (cost $103,919,588) | | $ | 203,090,420 | |
| Receivable for fund shares sold | | | 79,755 | |
| Dividends receivable | | | 125,534 | |
| Interest receivable | | | 14,029 | |
| Prepaid expenses | | | 22,545 | |
| Total Assets | | | 203,332,283 | |
| | | | | |
| LIABILITIES: | | | | |
| Payable for fund shares redeemed | | | 236 | |
| Investment advisory | | | | |
| fee payable (Note 4) | | | 153,870 | |
| Accrued fund administration | | | | |
| and accounting fees | | | 35,685 | |
| Accrued expenses and other payables | | | 27,056 | |
| Total Liabilities | | | 216,847 | |
| NET ASSETS | | $ | 203,115,436 | |
| | | | | |
| NET ASSETS CONSIST OF: | | | | |
| Capital stock | | $ | 104,410,441 | |
| Total distributable earnings | | | 98,704,995 | |
| TOTAL NET ASSETS | | $ | 203,115,436 | |
| | | | | |
Shares outstanding (unlimited shares | | | | |
authorized, no par value) | | | 9,316,877 | |
| NET ASSET VALUE, OFFERING AND | | | | |
| REDEMPTION PRICE PER SHARE | | $ | 21.80 | |
EVERCORE EQUITY FUND
STATEMENT OF OPERATIONS
For the year ended December 31, 2019
| INVESTMENT INCOME: | | | |
| Dividend and interest income | | $ | 2,470,577 | |
| Less: foreign taxes withheld | | | (10,194 | ) |
| Total investment income | | | 2,460,383 | |
| | | | | |
| EXPENSES: | | | | |
| Investment advisory fees (Note 4) | | | 1,301,786 | |
| Fund administration and accounting fees | | | 204,924 | |
| Trustees’ fees and expenses (Note 4) | | | 46,038 | |
| Transfer agent fees and expenses | | | 38,610 | |
| Legal fees | | | 32,690 | |
| Federal and state registration fees | | | 30,443 | |
| Insurance expense | | | 21,621 | |
| Audit and tax fees | | | 15,506 | |
| Reports to shareholders | | | 10,622 | |
| Custody fees | | | 9,652 | |
| Total expenses before | | | | |
| expense recoupment | | | 1,711,892 | |
| Net expenses recouped | | | | |
| by Adviser (Note 4) | | | 23,823 | |
| Net expenses | | | 1,735,715 | |
| NET INVESTMENT INCOME | | | 724,668 | |
| | | | | |
| REALIZED AND UNREALIZED | | | | |
| GAIN ON INVESTMENTS: | | | | |
| Net realized gain on | | | | |
| investment transactions | | | 4,636,391 | |
| Change in unrealized appreciation | | | | |
| on investments | | | 49,708,044 | |
| Net realized and unrealized | | | | |
| gain on investments | | | 54,344,435 | |
| NET INCREASE IN NET ASSETS | | | | |
| RESULTING FROM OPERATIONS | | $ | 55,069,103 | |
The accompanying notes are an integral part of these financial statements.
EVERCORE EQUITY FUND
STATEMENTS OF CHANGES IN NET ASSETS
| | | For the | | | For the | |
| | | Year | | | Year | |
| | | Ended | | | Ended | |
| | | December 31, | | | December 31, | |
| | | 2019 | | | 2018 | |
| OPERATIONS: | | | | | | |
| Net investment income | | $ | 724,668 | | | $ | 198,727 | |
| Net realized gain on | | | | | | | | |
| investment transactions | | | 4,636,391 | | | | 1,944,359 | |
| Change in unrealized | | | | | | | | |
| appreciation | | | | | | | | |
| on investments | | | 49,708,044 | | | | (9,581,304 | ) |
| Net increase (decrease) | | | | | | | | |
| in net assets resulting | | | | | | | | |
| from operations | | | 55,069,103 | | | | (7,438,218 | ) |
| | | | | | | | | |
| CAPITAL SHARE | | | | | | | | |
| TRANSACTIONS: | | | | | | | | |
| Proceeds from shares sold | | | 21,539,465 | | | | 15,748,661 | |
| Cost of shares redeemed | | | (10,013,132 | ) | | | (13,538,548 | ) |
| Reinvested distributions | | | 3,500,232 | | | | 2,694,694 | |
| Net increase in net assets | | | | | | | | |
| resulting from capital | | | | | | | | |
| share transactions | | | 15,026,565 | | | | 4,904,807 | |
| | | | | | | | | |
| DISTRIBUTIONS TO | | | | | | | | |
| SHAREHOLDERS | | | (4,503,220 | ) | | | (3,024,159 | ) |
| | | | | | | | | |
| TOTAL INCREASE | | | | | | | | |
| (DECREASE) IN | | | | | | | | |
| NET ASSETS | | | 65,592,448 | | | | (5,557,570 | ) |
| | | | | | | | | |
| NET ASSETS: | | | | | | | | |
| Beginning of year | | | 137,522,988 | | | | 143,080,558 | |
| End of year | | $ | 203,115,436 | | | $ | 137,522,988 | |
EVERCORE EQUITY FUND
NOTES TO FINANCIAL STATEMENTS
December 31, 2019
1. Organization
The Evercore Equity Fund (the “Fund”) is the sole series of Wall Street EWM Funds Trust (the “Trust”). The Trust was organized as a Delaware statutory trust on April 12, 2011. The Trust is registered with the Securities and Exchange Commission (“SEC”) under the Investment Company Act of 1940 (the “1940 Act”), as amended, as an open-end management investment company. The Fund is a diversified series with its own investment objectives and policies within the Trust. The Fund seeks to produce growth of capital by investing principally in a diversified portfolio of common stocks. As a secondary objective, the Fund seeks realization of current income through the receipt of interest or dividends from investments by investing in dividend paying securities. The Fund is the successor in interest to The Wall Street Fund, Inc. (the “Predecessor Fund”). On September 15, 2014, the shareholders of the Predecessor Fund approved the reorganization of the Predecessor Fund into the Fund, and effective as of the close of business on October 1, 2014, the assets and liabilities of the Predecessor Fund were transferred to the Fund in exchange for shares of the Fund. Prior to the reorganization, the Fund had no assets or operations. Since the Fund’s investment objectives and policies are the same in all material respects as the Predecessor Fund’s, and since the Fund has engaged Evercore Wealth Management, LLC (the “Adviser”) that previously provided services to the Predecessor Fund, the Fund has adopted the prior performance and financial history of the Predecessor Fund. On March 1, 2016, the Fund’s name changed from “The Wall Street Fund” to “Evercore Equity Fund.” The Fund is an investment company and accordingly follows the investment company accounting and reporting guidance of the Financial Accounting Standards Board (“FASB”) Accounting Standards Codification (“ASC”) Topic 946 Financial Services – Investment Companies.
2. Significant Accounting Policies
The following is a summary of significant accounting policies consistently followed by the Fund in the preparation of its financial statements. These policies are in conformity with accounting principles generally accepted in the United States of America (“U.S. GAAP”), which require management to make estimates and assumptions that affect the reported amounts of assets and liabilities and disclosure of contingent assets and liabilities at the date of the financial statements and the reported results of operations during the reporting period. Actual results could differ from those estimates and assumptions.
The accompanying notes are an integral part of these financial statements.
EVERCORE EQUITY FUND
NOTES TO FINANCIAL STATEMENTS (continued)
December 31, 2019
(a) Investment Valuation – Securities which are traded on a national stock exchange are valued at the last sale price on the securities exchange on which such securities are primarily traded. Securities traded on the over-the-counter market and listed securities for which there were no transactions are valued at the last sale price. Debt securities are valued at the mean price furnished by a national pricing service, subject to review by the Fund’s investment adviser and determination of the appropriate price whenever a furnished price is significantly different from the previous day’s furnished price. Investments in open-end mutual funds (other than exchange-traded funds) are valued at their respective net asset values (“NAV”) on the valuation date. Securities for which market quotations are not readily available and other assets are valued at fair value as determined in good faith by the Fund’s investment adviser pursuant to procedures approved by and under supervision of the Fund’s Board of Trustees.
U.S. GAAP requires disclosures regarding the valuation inputs and techniques used to measure fair value and any changes in such valuation inputs and techniques. The various inputs used in determining the value of each of the Fund’s investments are summarized in the following three broad categories:
| Level 1 – | Unadjusted quoted prices in active markets for identical assets or liabilities that the Fund has the ability to access. |
| | |
| Level 2 – | Observable inputs other than quoted prices included in Level 1 that are observable for the asset or liability, either directly or indirectly. These inputs may include quoted prices for the identical instrument on an inactive market, prices for similar instruments, interest rates, prepayment speeds, credit risk, yield curves, default rates and similar data. |
| | |
| Level 3 – | Unobservable inputs for the asset or liability, to the extent relevant observable inputs are not available, representing the Fund’s own assumptions about the assumptions a market participant would use in valuing the asset or liability, and would be based on the best information available. |
The valuation levels are not necessarily an indication of the risk associated with investing in these investments. As of December 31, 2019, the Fund’s investments were classified as follows:
| | | | | | | | | | | | Total | |
| | | Level 1 | | | Level 2 | | | Level 3 | | | Fair Value | |
| Common | | | | | | | | | | | | |
| Stocks* | | $ | 193,206,518 | | | $ | — | | | $ | — | | | $ | 193,206,518 | |
| Short-Term | | | | | | | | | | | | | | | | |
| Investment | | | 9,883,902 | | | | — | | | | — | | | | 9,883,902 | |
| Total | | | | | | | | | | | | | | | | |
| Investments | | $ | 203,090,420 | | | $ | — | | | $ | — | | | $ | 203,090,420 | |
| * | Please refer to the Schedule of Investments for further industry breakout. |
(b) Federal Income and Excise Taxes – The Fund intends to meet the requirements of the Internal Revenue Code applicable to regulated investment companies and to distribute substantially all net investment company taxable income and net capital gains to shareholders in a manner which results in no tax cost to the Fund. Therefore, no federal income or excise tax provision is recorded.
The Fund has adopted financial reporting rules regarding recognition and measurement of tax positions taken or expected to be taken on a tax return. Management has reviewed all open tax years and concluded that there is no impact on the Fund’s net assets and no tax liability resulting from unrecognized tax benefits relating to uncertain income tax positions taken or expected to be taken on a tax return. The Fund is not subject to examination by U.S. tax authorities for tax years prior to the year ended December 31, 2016.
(c) Distributions to Shareholders – Dividends from net investment income and distributions of net realized capital gain, if any, will be declared and paid at least annually. Distributions to shareholders are recorded on the ex-dividend date.
(d) Securities Transactions and Investment Income – Investment transactions are recorded on the trade date for financial statement purposes. Realized gains and losses on sales of securities are calculated on the basis of identified cost. Dividend income is recognized on the ex-dividend date and interest income is recognized on an accrual basis. Acquisition and market discounts and premiums are amortized over the life of the security. Withholding taxes on foreign dividends have been provided for in accordance with the Fund’s understanding of the applicable country’s tax rules and regulations.
EVERCORE EQUITY FUND
NOTES TO FINANCIAL STATEMENTS (continued)
December 31, 2019
Distributions received from the Fund’s investments in real estate investment trusts (“REITs”) and master limited partnerships (“MLPs”) may be characterized as ordinary income, net capital gain, or a return of capital. The proper characterization of REIT and MLP distributions is generally not known until after the end of each calendar year. The Fund must use estimates in reporting the character of their income and distributions for financial statement purposes. Due to the nature of REIT and MLP investments, a portion of the distributions received by the Fund’s shareholders may represent a return of capital. U.S. GAAP requires that certain components of net assets relating to permanent differences be reclassified between financial and tax reporting. These differences are caused primarily by differences in the timing of the recognition of certain components of income, expense or realized capital gain for federal income tax purposes. These reclassifications have no effect on net assets, results of operations or NAV per share.
3. Investment Transactions
The aggregate purchases and sales of securities for the year ended December 31, 2019, excluding short-term investments, were $31,323,013 and $25,006,903, respectively. There were no purchases or sales of long-term U.S. government securities.
4. Investment Adviser
The Fund has entered into an Investment Advisory Agreement (the “Agreement”) with the Adviser, with whom certain trustees and officers of the Fund are also officers and directors of the Adviser. Pursuant to this Agreement, the Adviser is entitled to receive a management fee, calculated daily and payable monthly, at an annual rate of 0.75% of the Fund’s average daily net assets.
The Adviser has contractually agreed to waive its management fee and reimburse the Fund’s other expenses to the extent necessary to ensure that the total annual operating expenses (excluding all federal, state and local taxes, interest, dividends and interest on short positions, acquired fund fees and expenses, brokerage commissions and other costs incurred in connection with the purchase and sale of securities and extraordinary items) do not exceed 1.00% of the Fund’s average daily net assets. Fees waived and expenses reimbursed by the Adviser may be recouped by the Adviser for a period of three fiscal years following the fiscal period during which such waiver or reimbursement was made if such recoupment can be achieved without exceeding the expense limit in effect at the time the waiver and reimbursement occurred. During the year ended December 31, 2019, the Adviser recouped $23,823 of previously waived expenses. Waived fees and reimbursed expenses subject to potential recovery by year of expiration are as follows:
| | Expiration | Amount | |
| | 2020 | $70,688 | |
| | 2021 | $38,899 | |
Mr. Frederick Taylor serves as an Interested Trustee on the Trust as that term is defined in Section 2(a)(19) of the 1940 Act because of his association with the Adviser. For his services on the Board of Trustees, Mr. Taylor receives an annual fee of $15,000 from the Fund. Please see the Trustees & Officers table for further information.
5. Shares of Common Stock
Transactions in shares of common stock were as follows:
| | | Year Ended | | | Year Ended | |
| | | December 31, 2019 | | | December 31, 2018 | |
| Shares Sold | | | 1,128,993 | | | | 866,945 | |
| Shares Redeemed | | | (513,782 | ) | | | (755,969 | ) |
| Shares Reinvested | | | 160,856 | | | | 168,419 | |
| Net Increase | | | 776,067 | | | | 279,395 | |
| Shares Outstanding: | | | | | | | | |
| Beginning of Year | | | 8,540,810 | | | | 8,261,415 | |
| End of Year | | | 9,316,877 | | | | 8,540,810 | |
6. Tax Information
As of December 31, 2019, the Fund’s most recently completed fiscal year end, cost of investments and distributable earnings on a tax basis were as follows:
Cost of Investments | | $ | 105,453,354 | |
Gross tax unrealized appreciation | | $ | 99,840,521 | |
Gross tax unrealized depreciation | | | (2,203,455 | ) |
Net unrealized appreciation | | | 97,637,066 | |
Undistributed ordinary income | | | 100,092 | |
Undistributed long-term capital gain | | | 967,837 | |
Distributable earnings | | $ | 98,704,995 | |
The basis of investments for tax and financial reporting purposes differs principally due to the deferral of losses on wash sales and partnership basis adjustments.
The tax character of distributions paid during the years ended December 31, 2019 and 2018 were as follows:
| | | 2019 | | | 2018 | |
| Ordinary Income | | $ | 776,711 | | | $ | 386,081 | |
| Long-Term Capital Gain | | $ | 3,726,509 | | | $ | 2,638,078 | |
EVERCORE EQUITY FUND
NOTES TO FINANCIAL STATEMENTS (continued)
December 31, 2019
The Fund intends to utilize provisions of the federal income tax laws which allow it to carry a realized capital loss forward and offset such losses against any future realized capital gains. At December 31, 2019, the Fund did not have any capital loss carryovers. A regulated investment company may elect for any taxable year to treat any portion of any qualified late year loss as arising on the first day of the next taxable year. Qualified late year losses are certain capital losses which occur during the portion of the Fund’s taxable year subsequent to October 31. At December 31, 2019, the Fund does not plan to defer any late year ordinary or post-October capital losses.
7. Guarantees and Indemnifications
In the normal course of business, the Fund enters into contracts with its service providers that contain general indemnification clauses. The Fund’s maximum exposure under these arrangements is unknown as this would involve future claims against the Fund that have not yet occurred. Based on experience, the Fund expects the risk of loss to be remote.
8. Subsequent Events
In preparing these financial statements, management has evaluated events and transactions for potential recognition or disclosure through the date the financial statements were issued. There were no events or transactions that occurred during the period subsequent to December 31, 2019, that materially impacted the amounts or disclosures in the Fund’s financial statements, other than the following:
On November 25, 2019, U.S. Bancorp, the parent company of Quasar Distributors, LLC, the Fund’s distributor, announced that it had signed a purchase agreement to sell Quasar to Foreside Financial Group, LLC such that Quasar will become a wholly-owned broker-dealer subsidiary of Foreside. The transaction is expected to close by the end of March 2020. Quasar will remain the Fund’s distributor at the close of the transaction, subject to Board approval.
9. New Accounting Pronouncements
In August 2018, FASB issued Accounting Standards Update 2018-13, Fair Value Measurement (Topic 820): Disclosure Framework—Changes to the Disclosure Requirements for Fair Value Measurement (“ASU 2018-13”). The primary focus of ASU 2018-13 is to improve the effectiveness of the disclosure requirements for fair value measurements. The changes affect all companies that are required to include fair value measurement disclosures. In general, the amendments in ASU 2018-13 are effective for all entities for fiscal years and interim periods within those fiscal years, beginning after December 15, 2019. An entity is permitted to early adopt the removed or modified disclosures upon the issuance of ASU 2018-13 and may delay adoption of the additional disclosures, which are required for public companies only, until their effective date. Management has evaluated the ASU 2018-13 and has adopted the framework.
EVERCORE EQUITY FUND
FINANCIAL HIGHLIGHTS
Selected per share data is based on a share of common stock outstanding throughout each period
Years Ended December 31,
| | | 2019 | | | 2018 | | | 2017 | | | 2016 | | | 2015 | | | 2014 | | | 2013 | | | 2012 | | | 2011 | | | 2010 | |
| Per Share Data | |
| Net asset value, beginning of year | | $ | 16.10 | | | $ | 17.32 | | | $ | 14.07 | | | $ | 13.40 | | | $ | 14.39 | | | $ | 13.23 | | | $ | 9.84 | | | $ | 8.99 | | | $ | 8.93 | | | $ | 7.76 | |
| | | | | | | | | | | | | | | | | | | | | | | | | | | | | | | | | | | | | | | | | |
| Income from investment operations: | |
Net investment income (loss)(1) | | | 0.08 | | | | 0.02 | | | | 0.02 | | | | 0.02 | | | | 0.04 | | | | 0.02 | | | | 0.02 | | | | 0.01 | | | | 0.04 | | | | (0.01 | ) |
| Net realized and unrealized | | | | | | | | | | | | | | | | | | | | | | | | | | | | | | | | | | | | | | | | |
| gain (loss) on investments | | | 6.11 | | | | (0.88 | ) | | | 3.55 | | | | 0.69 | | | | (0.37 | ) | | | 2.07 | | | | 3.68 | | | | 0.87 | | | | 0.02 | | | | 1.18 | |
| Total from investment operations | | | 6.19 | | | | (0.86 | ) | | | 3.57 | | | | 0.71 | | | | (0.33 | ) | | | 2.09 | | | | 3.70 | | | | 0.88 | | | | 0.06 | | | | 1.17 | |
| | | | | | | | | | | | | | | | | | | | | | | | | | | | | | | | | | | | | | | | | |
| Less distributions: | |
| Distributions from net investment income | | | (0.08 | ) | | | (0.04 | ) | | | (0.05 | ) | | | (0.03 | ) | | | (0.04 | ) | | | (0.02 | ) | | | (0.03 | ) | | | (0.03 | ) | | | — | | | | — | |
| Distributions from net realized | | | | | | | | | | | | | | | | | | | | | | | | | | | | | | | | | | | | | | | | |
| gains from security transactions | | | (0.41 | ) | | | (0.32 | ) | | | (0.27 | ) | | | (0.01 | ) | | | (0.62 | ) | | | (0.91 | ) | | | (0.28 | ) | | | — | | | | — | | | | — | |
| Total distributions | | | (0.49 | ) | | | (0.36 | ) | | | (0.32 | ) | | | (0.04 | ) | | | (0.66 | ) | | | (0.93 | ) | | | (0.31 | ) | | | (0.03 | ) | | | — | | | | — | |
| Net asset value, end of year | | $ | 21.80 | | | $ | 16.10 | | | $ | 17.32 | | | $ | 14.07 | | | $ | 13.40 | | | $ | 14.39 | | | $ | 13.23 | | | $ | 9.84 | | | $ | 8.99 | | | $ | 8.93 | |
| | | | | | | | | | | | | | | | | | | | | | | | | | | | | | | | | | | | | | | | | |
| Total return | | | 38.46 | % | | | (4.94 | )% | | | 25.35 | % | | | 5.31 | % | | | (2.30 | )% | | | 15.74 | % | | | 37.65 | % | | | 9.77 | % | | | 0.67 | % | | | 15.08 | % |
| | | | | | | | | | | | | | | | | | | | | | | | | | | | | | | | | | | | | | | | | |
| Supplemental data and ratios: | |
| Net assets, end of year (in 000’s) | | $ | 203,115 | | | $ | 137,523 | | | $ | 143,081 | | | $ | 114,616 | | | $ | 109,354 | | | $ | 97,184 | | | $ | 78,048 | | | $ | 54,216 | | | $ | 28,051 | | | $ | 20,394 | |
| Ratio of expenses to average net assets, | | | | | | | | | | | | | | | | | | | | | | | | | | | | | | | | | | | | | | | | |
| before reimbursements/recoupment | | | 0.99 | % | | | 1.02 | % | | | 1.06 | % | | | 1.07 | % | | | 1.07 | % | | | 1.29 | % | | | 1.25 | % | | | 1.32 | % | | | 1.47 | % | | | 2.08 | % |
| Ratio of expenses to average net assets, | | | | | | | | | | | | | | | | | | | | | | | | | | | | | | | | | | | | | | | | |
| net of reimbursements/recoupment | | | 1.00 | % | | | 1.00 | % | | | 1.00 | % | | | 1.00 | % | | | 1.00 | % | | | 1.00 | % | | | 1.00 | % | | | 1.00 | % | | | 1.00 | % | | | 1.63 | % |
| Ratio of income (loss) to average net assets, |
| before reimbursements/recoupment | | | 0.43 | % | | | 0.11 | % | | | 0.06 | % | | | 0.08 | % | | | 0.27 | % | | | (0.14 | )% | | | (0.10 | )% | | | 0.05 | % | | | (0.04 | )% | | | (0.64 | )% |
Ratio of income (loss) to average net assets,
|
| net of reimbursements/recoupment | | | 0.42 | % | | | 0.13 | % | | | 0.12 | % | | | 0.16 | % | | | 0.34 | % | | | 0.15 | % | | | 0.15 | % | | | 0.37 | % | | | 0.43 | % | | | (0.19 | )% |
| Portfolio turnover rate | | | 15.11 | % | | | 14.13 | % | | | 10.73 | % | | | 22.60 | % | | | 23.52 | % | | | 21.53 | % | | | 36.65 | % | | | 84.10 | % | | | 88.29 | % | | | 42.58 | % |
__________
| (1) | Net investment income (loss) per share is calculated using ending balances prior to consideration of adjustments for permanent book and tax differences. |
The accompanying notes are an integral part of these financial statements.
REPORT OF INDEPENDENT REGISTERED PUBLIC ACCOUNTING FIRM
To the Shareholders and Board of Trustees of
Wall Street EWM Funds Trust
Opinion on the Financial Statements
We have audited the accompanying statement of assets and liabilities, including the schedule of investments, of Wall Street EWM Funds Trust comprising Evercore Equity Fund (the “Fund”) as of December 31, 2019, the related statement of operations for the year then ended, the statements of changes in net assets for each of the two years in the period then ended, including the related notes, and the financial highlights for each of the ten years in the period then ended (collectively referred to as the “financial statements”). In our opinion, the financial statements present fairly, in all material respects, the financial position of the Fund as of December 31, 2019, the results of its operations for the year then ended, the changes in its net assets for each of the two years in the period then ended, and the financial highlights for each of the ten years in the period then ended, in conformity with accounting principles generally accepted in the United States of America.
Basis for Opinion
Thee financial statements are the responsibility of the Fund’s management. Our responsibility is to express an opinion on the Fund’s financial statements based on our audits. We are a public accounting firm registered with the Public Company Accounting Oversight Board (United States) (“PCAOB”) and are required to be independent with respect to the Fund in accordance with the U.S. federal securities laws and the applicable rules and regulations of the Securities and Exchange Commission and the PCAOB.
We onducted our audits in accordance with the standards of the PCAOB. Those standards require that we plan and perform the audit to obtain reasonable assurance about whether the financial statements are free of material misstatement whether due to error or fraud.
Our audits included performing procedures to assess the risks of material misstatement of the financial statements, whether due to error or fraud, and performing procedures that respond to those risks. Such procedures included examining, on a test basis, evidence regarding the amounts and disclosures in the financial statements. Our procedures included confirmation of securities owned as of December 31, 2019, by correspondence with the custodian. Our audits also included evaluating the accounting principles used and significant estimates made by management, as well as evaluating the overall presentation of the financial statements. We believe that our audits provide a reasonable basis for our opinion.
We have served as the Fund’s auditor since 2005.
COHEN & COMPANY, LTD.
Chicago, Illinois
February 25, 2020
EVERCORE EQUITY FUND
PERFORMANCE INFORMATION
For periods ended December 31, 2019 (Unaudited)
Value of $10,000 Investment

This chart assumes an initial investment of $10,000 on December 31, 2009. Fund performance reflects any fee waivers in effect. In the absence of fee waivers, total return would be reduced. Returns shown include the reinvestment of all distributions, but do not reflect the deduction of taxes that a shareholder would pay on Fund distributions or the redemption of Fund shares. Past performance is not predictive of future performance. Investment return and principal value will fluctuate so that your shares, when redeemed, may be worth more or less than their original cost.
Average Annual Total Returns
for the Periods Ended December 31, 2019
| | | One Year | Five Years | Ten Years | |
| | Evercore Equity Fund | 38.46% | 11.16% | 13.15% | |
| | S&P 500 Index1 | 31.49% | 11.70% | 13.56% | |
| | Russell 1000 Index2 | 31.43% | 11.48% | 13.54% | |
Index performance is for illustrative purposes only and does not reflect any fees, expenses, or taxes. Direct investment in the indexes is not available.
1 | S&P 500 Index – an unmanaged market capitalization-weighted index based on the average weighted performance of 500 widely held common stocks. |
2 | Russell 1000 Index– an unmanaged index that measures the performance of the 1,000 largest U.S. companies (90% of the investable U.S. equity market) based on total market capitalization. |
EVERCORE EQUITY FUND
EXPENSE EXAMPLE
For the Six Months Ended December 31, 2019 (Unaudited)
As a shareholder of the Fund, you incur ongoing costs, including management fees and other Fund expenses. If you invest through a financial intermediary, you may also incur additional costs such as a transaction fee charged on the purchase or sale of the Fund or an asset-based management fee. This Example is intended to help you understand your ongoing costs (in dollars) of investing in the Fund and to compare these costs with the ongoing costs of investing in other mutual funds.
The Example is based on an investment of $1,000 invested at the beginning of the period and held for the entire period from July 1, 2019 to December 31, 2019.
Actual Expenses
The first line of the table below provides information about actual account values and actual expenses. You may use the information in this line, together with the amount you invested, to estimate the expenses you paid over the period. Simply divide your account value by $1,000 (for example, an $8,600 account value divided by $1,000 = 8.6), then multiply the result by the number in the first line under the heading entitled “Expenses Paid During Period” to estimate the expenses you paid on your account during the period.
Hypothetical Example for Comparison Purposes
The second line of the table below provides information about hypothetical account values and hypothetical expenses based on the Fund’s actual expense ratios and an assumed rate of return of 5% per year before expenses, which is not the Fund’s actual return. The hypothetical account values and expenses may not be used to estimate the actual ending account balance or expenses you paid for the period. You may use this information to compare the ongoing costs of investing in the Fund and other funds. To do so, compare this 5% hypothetical example with the 5% hypothetical examples that appear in the shareholder reports of the other funds.
Please note that the expenses shown in the table are meant to highlight your ongoing costs only and do not reflect any costs that may be associated with investing in the Fund through a financial intermediary. Therefore, the second line of the table is useful in comparing the ongoing costs only, and will not help you determine the relative total costs of owning different funds. In addition, if any costs associated with investing through a financial intermediary were included, your costs would have been higher.
| | | | Expenses |
| | | | Paid |
| | Beginning | Ending | During |
| | Account | Account | Period(1) |
| | Value | Value | (7/1/19 – |
| | (7/1/19) | (12/31/19) | 12/31/19) |
Actual(2) | $1,000.00 | $1,143.80 | $5.40 |
Hypothetical (5% return | | | |
before expenses) | $1,000.00 | $1,020.16 | $5.09 |
| (1) | Expenses are equal to the Fund’s annualized expense ratio of 1.00% for the six-months ended December 31, 2019, multiplied by the average account value over the period, multiplied by 184/365 to reflect the one-half year period. |
| (2) | Based on the actual returns for the six-month period ended December 31, 2019 of 14.38%. |
EVERCORE EQUITY FUND
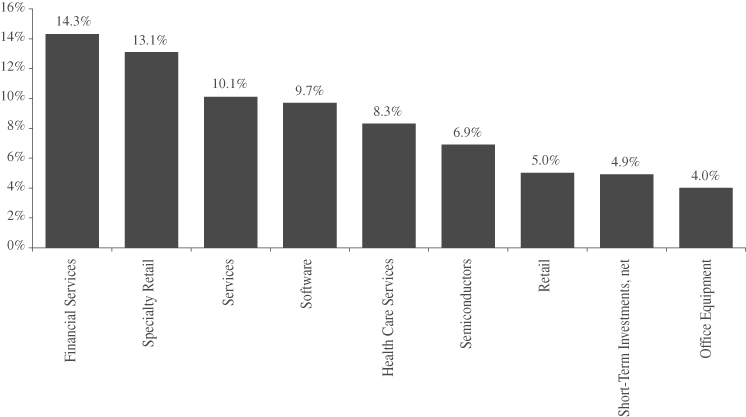
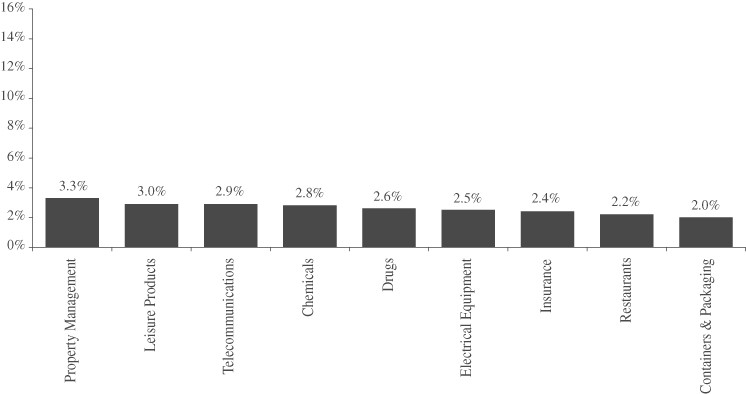
ALLOCATION OF PORTFOLIO ASSETS
(Calculated as a percentage of net assets)
December 31, 2019 (Unaudited)
EVERCORE EQUITY FUND
TRUSTEES AND OFFICERS (Unaudited)
The business affairs of the Fund are managed under the direction of the Fund’s Board of Trustees. Information pertaining to the Trustees and Officers of the Fund is set forth below. The SAI includes additional information about the Fund’s Trustees and Officers and is available, without charge, upon request by calling 1-800-443-4693.
| | | Term of | | Number of | |
| | | Office and | | Portfolios in | |
| | | Length of | Principal | Fund Complex | Other Directorships |
| Name, Address | | Time | Occupation During | Overseen | Served During |
and Age | Position | Served* | Past Five Years | by Trustee | Past Five Years |
INDEPENDENT | | | | | |
TRUSTEES: | | | | | |
Laird I. Grant | Trustee | Since 2012 | Retired; Managing Director | 1 | Trustee, Community |
55 East 52nd Street, | | | and Senior Portfolio Manager, | | Foundation of Collier |
23rd Floor | | | U.S. Trust Company of | | County 2014-2017; |
New York, NY 10055 | | | Florida, 2001-2008. | | Chair of the Investment |
Year of Birth: 1945 | | | | | Committee, Community |
| | | | | | Foundation of Collier |
| | | | | | County 2014-2017; |
| | | | | | Member of the |
| | | | | | Investment Committee, |
| | | | | | Community Foundation |
| | | | | | of Collier County |
| | | | | | 2013-2014; David |
| | | | | | Lawrence Center 2019- |
| | | | | | Present; Toscana at Bay |
| | | | | | Colony 2019-Present. |
| | | | | | |
Katharine Plourde | Trustee | Since 2014 | Private Investor; | 1 | Pall Corporation |
55 East 52nd Street, | | | Corporate Director of three | | 1995-2015, OM |
23rd Floor | | | NYSE-listed companies: | | Group 2002-2015, |
New York, NY 10055 | | | Pall Corporation, OM Group, | | Albany International |
Year of Birth: 1951 | | | and Albany International. | | 2013-Present. |
| | | | | | |
INTERESTED | | | | | |
TRUSTEE: | | | | | |
Frederick Taylor** | Chairman, | Since 2013 | Senior Advisor, Evercore | 1 | John’s Island Golf Club, |
55 East 52nd Street, | Trustee, and | | Wealth Management, LLC | | 2012-Present; Vero |
23rd Floor | President | | 2008-Present. | | Beach Museum and Vero |
New York, NY 10055 | | | | | Beach Museum |
Year of Birth: 1941 | | | | | Endowment Trust Board, |
| | | | | | 2012-Present; Trustee |
| | | | | | Emeritus, Wesleyan |
| | | | | | University, 2006-Present. |
EVERCORE EQUITY FUND
TRUSTEES AND OFFICERS (Unaudited) (Continued)
| | | Term of | | Number of | |
| | | Office and | | Portfolios in | |
| | | Length of | Principal | Fund Complex | Other Directorships |
| Name, Address | | Time | Occupation During | Overseen | Served During |
and Age | Position | Served* | Past Five Years | by Trustee | Past Five Years |
OFFICERS: | | | | | |
| Ruth P. Calaman | Executive | Since 2012 | General Counsel, | N/A | None |
| 55 East 52nd Street, | Vice | | Chief Compliance Officer, | | |
| 23rd Floor | President, | | Evercore Wealth Management | | |
| New York, NY10055 | Secretary | | LLC and Evercore Trust | | |
| Year of Birth: 1966 | and Chief | | Company, N.A. since 2011. | | |
| | Compliance | | | | |
| | Officer | | | | |
| | | | | | |
| Dianna Caban | Executive | Since 2019 | Director, Evercore Wealth | N/A | None |
| 55 East 52nd Street, | Vice | | Management, LLC since 2008. | | |
| 23rd Floor | President | | | | |
| New York, NY 10055 | and | | | | |
| Year of Birth: 1961 | Treasurer | | | | |
| * | | Each Trustee serves for an indefinite term until his or her successor is duly elected and qualifies, unless the Trustee resigns, dies or is removed in accordance with the provisions of the Fund’s By-Laws. |
| ** | | Denotes a Trustee who is an “interested person of the Trust” as that term is defined in Section 2 (a)(19) of the 1940 Act because of his association with the Adviser. |
EVERCORE EQUITY FUND
APPROVAL OF THE INVESTMENT ADVISORY AGREEMENT (Unaudited)
On September 3, 2019, the Board of Trustees, including each of the Independent Trustees, of the Wall Street EWM Funds Trust considered and unanimously approved the continuation for a one year period of the investment advisory agreement (the “Advisory Agreement”) with Evercore Wealth Management, LLC (“EWM” or the “Adviser”), effective October 1, 2019. In reaching its decision to approve the continuation of the Advisory Agreement, the Board considered the overall fairness of the Advisory Agreement and whether the Advisory Agreement was in the best interests of the Fund and its shareholders. The Board further considered all factors it deemed relevant with respect to the Fund, including: (1) the nature, extent, and quality of the services provided by EWM, including the performance of the Fund and EWM; (2) comparative fee and expense data for the Fund and other investment companies with similar investment objectives; (3) the extent to which EWM realizes economies of scale as the Fund grows larger and shares those economies with the Fund and its shareholders; (4) the cost of the services provided and the profits realized by EWM and its affiliates from services rendered to the Fund (the “profitability” of the Fund to EWM); and (5) other indirect benefits to EWM and its affiliates attributable to its relationship with the Fund. In approving the Advisory Agreement, the Board did not identify any single factor or particular information as all-important or controlling and each Trustee may have attributed different weight to each factor. In connection with its deliberations, the Board took into account information provided throughout the year at its meetings, as well as information provided specifically in connection with the annual renewal process, as discussed below.
Nature, Extent and Quality of Services to be Provided. The Board considered the scope of services to be provided by EWM under the Advisory Agreement, noting that EWM will continue to provide investment management services to the Fund, which include, but are not limited to, the following: (1) investing the Fund’s assets consistent with the Fund’s investment objective and investment policies; (2) determining the portfolio securities to be purchased, sold or otherwise disposed of and the timing of such transactions; (3) voting all proxies with respect to the Fund’s portfolio securities; (4) maintaining the required books and records for transactions effected by EWM on behalf of the Fund; and (5) selecting broker-dealers to execute orders on behalf of the Fund. The Board considered EWM’s specific responsibilities in all aspects of day-to-day management of the Fund as well as the qualifications, experience and responsibilities of the Fund’s portfolio managers and other key personnel at EWM. The Board reviewed the Fund’s short- and long-term investment performance for the various periods ended June 30, 2019 and July 31, 2019, together with the relative performance of relevant benchmarks and of the Fund’s peer groups of mutual funds as categorized by Broadridge Financial Solutions, Inc., an independent mutual fund research and rating service, using both Morningstar and Lipper classification systems. In connection with its review, the Board also considered information regarding EWM’s code of ethics and compliance program with EWM management and other key personnel, and noted the resources and personnel allocated to these functions, as well as the firm’s compliance history with respect to the Fund. The Board evaluated EWM’s financial condition, noting that it appeared to be sufficiently capitalized to provide high quality services to the Fund, and considered EWM’s history, reputation and resources. The Board concluded that EWM had sufficient quality and depth of personnel, resources, investment methods and compliance policies and procedures essential to performing its duties under the Advisory Agreement. The Board concluded that it is satisfied with the nature, extent and quality of services provided by EWM to the Fund pursuant to the Advisory Agreement.
Comparative Fee and Expense Data. The Board considered a comparative analysis of the advisory fee and total expense ratio of the Fund and those of a peer group of funds within the Lipper Multi-Cap Growth category and the Morningstar U.S. Fund Large Growth category that was prepared by the Fund’s administrator, U.S. Bancorp Fund Services, LLC, but that included certain data obtained from Broadridge Financial Solutions, Inc. The Board noted that the Fund’s investment advisory fee, after fee waivers, was in line with the median contractual investment advisory fee reported for its Lipper and Morningstar peer groups. The Board noted that the Fund’s total expenses (after fee waivers and expense reimbursements) were below the median total expenses reported for its Lipper peer group and were below the average and equal to the median total expenses reported for its Morningstar peer group. While recognizing that it is difficult to compare investment advisory fees since investment advisory services provided may vary from one investment adviser to another and for other reasons, the Board concluded that EWM’s investment advisory fee is reasonable. The Board noted that EWM has agreed to reimburse Fund operating expenses in order to maintain a competitive annual net expense ratio of 1.00% of daily average net assets.
EVERCORE EQUITY FUND
APPROVAL OF THE INVESTMENT ADVISORY AGREEMENT (Unaudited) (Continued)
Economies of Scale. The Board considered whether the Fund is experiencing and would benefit from any economies of scale, noting that the current investment advisory fee for the Fund does not contain breakpoints. The Board determined that the investment advisory fees are reasonable and appropriate and that breakpoints in the fee schedule are unnecessary based on the current relatively low level of the Fund’s assets. The Board further considered EWM’s agreement to reimburse Fund operating expenses in order to maintain a competitive annual net expense ratio. Based on its review, the Board determined that the current investment management fee structure was reasonable.
Cost of Advisory Services and Profitability. The Board considered the annual investment advisory fee to be paid by the Fund to EWM in the amount of 0.75% of the Fund’s average annual daily net assets for services to be rendered to the Fund by EWM and its affiliates. The Board noted the relatively small size of the Fund, the competitive level of the advisory fee charged by EWM, and profitability information regarding the level of profits realized by the Adviser in connection with the operation of the Fund. The Board reviewed the methodology followed in allocating costs to the Fund, while recognizing that allocation methodologies are inherently subjective and various allocation methodologies may each be reasonable while producing different results. In this respect, the Board noted that the cost allocation methodology was generally consistent with that followed in profitability report presentations for the Fund made in prior years. The Board also took into account management’s ongoing costs and expenditures in providing and improving services for the Fund, as well as the need to meet additional regulatory and compliance requirements resulting from changes in rules and other regulations, and determined that EWM’s profitability with respect to the Fund was reasonable. The Board further noted that EWM has contractually agreed to reimburse the Fund for its operating expenses, and may reduce its investment advisory fees, in order to ensure that total annual fund operating expenses (excluding all federal, state and local taxes, interest, dividends and interest on short positions, acquired fund fees and expenses, brokerage commissions and other costs incurred in connection with the purchase and sale of securities and extraordinary items) do not exceed 1.00% of the Fund’s average daily net assets annually. In this regard, the Board noted that, while it is possible that the Fund’s operating expenses may increase at a future time, the Fund’s expense limitation arrangement will continue in effect until at least April 30, 2020 at which point it would be subject to renewal for successive terms.
Other Indirect Benefits. The Board also considered the extent to which EWM derives indirect benefits from Fund operations. In this regard, the Board noted that EWM does not intend to use an affiliated broker-dealer to perform trading for the Fund. The Board also noted that EWM would continue its existing practice, which allows the use of soft dollar arrangements consistent with Section 28(e) of the Securities Exchange Act of 1934, as amended, and that research services furnished by broker-dealers and other third-parties as a result of such arrangements may be beneficial to EWM and its other clients, as well as the Fund. The Board also considered that, conversely, the Fund may benefit from research services obtained by EWM from the placement of portfolio brokerage of other clients. The Board also considered that the Fund may be offered to EWM’s advisory clients who may invest in the Fund which may benefit EWM financially and in other ways. Based on its review, the Board determined that indirect benefits that may accrue to EWM are fair and reasonable.
Based on its consideration of the foregoing factors and conclusions, and such other factors and conclusions as it deemed relevant, the Board, including all of the Independent Trustees, concluded based on its business judgment that the approval of the Advisory Agreement is in the best interests of the Fund and its shareholders.
**********
ADDITIONAL INFORMATION
December 31, 2019 (Unaudited)
Availability of Proxy Voting Information
Information regarding how the Fund votes proxies relating to portfolio securities is available without charge upon request by calling toll-free at (800) 443-4693 or by accessing the Fund’s website at www.evercoreequityfund.com and the SEC’s website at www.sec.gov. Information regarding how the Fund voted proxies relating to portfolio securities during the most recent 12 month period ended June 30 is available on the SEC’s website at www.sec.gov or by calling the toll-free number listed above.
Availability of Fund Portfolio Information
The Fund files its complete schedule of portfolio holdings with the SEC for the first and third quarters of each fiscal year on Form N-Q, which is available on the SEC’s website at www.sec.gov, or by calling the Fund at (800) 443-4693. The Fund’s Form N-Q may be reviewed and copied at the SEC’s Public Reference Room in Washington, D.C. For information on the Public Reference Room call 1-800-SEC-0330. In addition, the Fund will make its portfolio holdings information publicly available by posting the information at www.evercoreequityfund.com on a monthly basis.
Qualified Dividend Income/Dividends Received Deduction
For the fiscal year ended December 31, 2019, certain dividends paid by the Fund may be reported as qualified dividend income and may be eligible for taxation at capital gain rates. The percentage of dividends declared from ordinary income designated as qualified dividend income was 100% for the Fund.
For corporate shareholders, the percentage of ordinary income distributions qualifying for the corporate dividends received deduction for the fiscal year ended December 31, 2019 was 100% for the Fund.
The percentage of taxable ordinary income distributions that are designated as short-term capital gain distributions under Internal Revenue section 87(k)(2)(c) was 0.00%.
(This Page Intentionally Left Blank.)
TRUSTEES
Frederick Taylor, Chairman
Laird I. Grant
Katharine Plourde
OFFICERS
Frederick Taylor, President
Ruth Calaman, Executive Vice President,
Secretary & Chief Compliance Officer
Dianna Caban,
Executive Vice President & Treasurer
INVESTMENT ADVISOR
Evercore Wealth Management, LLC
55 East 52nd Street
23rd Floor
New York, New York 10055
CUSTODIAN
U.S. Bank, N.A.
1555 North Rivercenter Drive, Suite 302
Milwaukee, Wisconsin 53212
ADMINISTRATOR, TRANSFER AGENT,
DIVIDEND PAYING AGENT &
SHAREHOLDER SERVICING AGENT
U.S. Bancorp Fund Services, LLC
615 East Michigan Street
P.O. Box 701
Milwaukee, Wisconsin 53201
INDEPENDENT REGISTERED
PUBLIC ACCOUNTING FIRM
Cohen & Company, Ltd.
151 North Franklin Street, Suite 575
Chicago, Illinois 60606
DISTRIBUTOR
Quasar Distributors, LLC
777 East Wisconsin Ave.
Milwaukee, Wisconsin 53202
EVERCORE EQUITY FUND
55 East 52nd Street
23rd Floor
New York, New York 10055
(800) 443-4693
http://www.evercoreequityfund.com
Item 2. Code of Ethics.
The registrant has adopted a code of ethics that applies to the registrant’s principal executive officer and principal financial officer. The registrant has not made any amendments to its code of ethics during the period covered by this report. The registrant has not granted any waivers from any provisions of the code of ethics during the period covered by this report.
A copy of the registrant’s Code of Ethics is filed herewith.
Item 3. Audit Committee Financial Expert.
The registrant’s board of trustees has determined that it does not have an audit committee financial expert serving on its audit committee. At this time, the registrant believes that the experience provided by each member of the audit committee together offers the registrant adequate oversight for the registrant’s level of financial complexity.
Item 4. Principal Accountant Fees and Services.
The registrant has engaged its principal accountant to perform audit services, audit-related services, tax services and other services during the past two fiscal years. “Audit services” refer to performing an audit of the registrant's annual financial statements or services that are normally provided by the accountant in connection with statutory and regulatory filings or engagements for those fiscal years. “Audit-related services” refer to the assurance and related services by the principal accountant that are reasonably related to the performance of the audit. “Tax services” refer to professional services rendered by the principal accountant for tax compliance, tax advice, and tax planning, including reviewing the Fund’s tax returns and distribution calculations. There were no “Other services” provided by the principal accountant. The following table details the aggregate fees billed or expected to be billed for each of the last two fiscal years for audit fees, audit-related fees, tax fees and other fees by the principal accountant.
| | FYE 12/31/2019 | FYE 12/31/2018 |
Audit Fees | 13,500 | 13,500 |
Audit-Related Fees | 0 | 0 |
Tax Fees | 2,000 | 2,000 |
All Other Fees | 0 | 0 |
The audit committee has adopted pre-approval policies and procedures that require the audit committee to pre‑approve all audit and non‑audit services of the registrant, including services provided to any entity affiliated with the registrant.
The following table indicates the non-audit fees billed or expected to be billed by the registrant’s accountant for services to the registrant and to the registrant’s investment adviser (and any other controlling entity, etc.—not sub-adviser) for the last two years. The audit committee of the board of trustees/directors has considered whether the provision of non-audit services that were rendered to the registrant's investment adviser is compatible with maintaining the principal accountant's independence and has concluded that the provision of such non-audit services by the accountant has not compromised the accountant’s independence.
Non-Audit Related Fees | FYE 12/31/2019 | FYE 12/31/2018 |
Registrant | 0 | 0 |
Registrant’s Investment Adviser | 0 | 0 |
Item 5. Audit Committee of Listed Registrants.
Not applicable to registrants who are not listed issuers (as defined in Rule 10A-3 under the Securities Exchange Act of 1934).
Item 6. Investments.
(a) Schedule of Investments is included as part of the report to shareholders filed under Item 1 of this Form.
(b) Not applicable.
Item 7. Disclosure of Proxy Voting Policies and Procedures for Closed-End Management Investment Companies.
Not applicable to open-end investment companies.
Item 8. Portfolio Managers of Closed-End Management Investment Companies.
Not applicable to open-end investment companies.
Item 9. Purchases of Equity Securities by Closed‑End Management Investment Company and Affiliated Purchasers.
Not applicable to open-end investment companies.
Item 10. Submission of Matters to a Vote of Security Holders.
There have been no material changes to the procedures by which shareholders may recommend nominees to the Registrant’s Board of Trustees.
Item 11. Controls and Procedures.
(a) | The Registrant’s President and Treasurer have reviewed the Registrant's disclosure controls and procedures (as defined in Rule 30a-3(c) under the Investment Company Act of 1940 (the “Act”)) as of a date within 90 days of the filing of this report, as required by Rule 30a-3(b) under the Act and Rules 13a-15(b) or 15d‑15(b) under the Securities Exchange Act of 1934. Based on their review, such officers have concluded that the disclosure controls and procedures are effective in ensuring that information required to be disclosed in this report is appropriately recorded, processed, summarized and reported and made known to them by others within the Registrant and by the Registrant’s service provider. |
(b) | There were no significant changes in the Registrant's internal control over financial reporting (as defined in Rule 30a-3(d) under the Act) that occurred during the period covered by this report that has materially affected, or is reasonably likely to materially affect, the Registrant's internal control over financial reporting. |
Item 12. Disclosure of Securities Lending Activities for Closed-End Management Investment Companies
Not applicable to open-end investment companies.
Item 13. Exhibits.
(a) | (1) Any code of ethics or amendment thereto, that is subject of the disclosure required by Item 2, to the extent that the registrant intends to satisfy Item 2 requirements through filing an exhibit. 1) Filed herewith |
(2) Certifications pursuant to Section 302 of the Sarbanes-Oxley Act of 2002. Filed herewith.
(3) Any written solicitation to purchase securities under Rule 23c‑1 under the Act sent or given during the period covered by the report by or on behalf of the registrant to 10 or more persons. Not applicable to open-end investment companies.
(4) Change in the registrant’s independent public accountant. There was no change in the registrant’s independent public accountant for the period covered by this report.
| (b) | Certification pursuant to Section 906 of the Sarbanes‑Oxley Act of 2002. Furnished herewith. |
SIGNATURES
Pursuant to the requirements of the Securities Exchange Act of 1934 and the Investment Company Act of 1940, the registrant has duly caused this report to be signed on its behalf by the undersigned, thereunto duly authorized.
(Registrant) Wall Street EWM Funds Trust
By (Signature and Title)* /s/ Frederick Taylor
Frederick Taylor, President
Date February 25, 2020
Pursuant to the requirements of the Securities Exchange Act of 1934 and the Investment Company Act of 1940, this report has been signed below by the following persons on behalf of the registrant and in the capacities and on the dates indicated.
By (Signature and Title)* /s/ Frederick Taylor
Frederick Taylor, President
Date February 25, 2020
By (Signature and Title)* /s/ Dianna Caban
Dianna Caban, Treasurer
Date February 25, 2020
* Print the name and title of each signing officer under his or her signature.