united states
securities and exchange commission
washington, d.c. 20549
form n-csr
certified shareholder report of registered management
investment companies
Investment Company Act file number 811-22549
Northern Lights Fund Trust II
(Exact name of registrant as specified in charter)
17645 Wright Street, Ste 200, Omaha, Nebraska 68130
(Address of principal executive offices) (Zip code)
Rich Malinowski, Gemini Fund Services, LLC.
80 Arkay Drive, Hauppauge, NY 11788
(Name and address of agent for service)
Registrant's telephone number, including area code: 631-470-2734
Date of fiscal year end: 3/31
Date of reporting period:3/31/19
Item 1. Reports to Stockholders.
| |
| |
| |
| |
 |
| |
| |
| |
| |
| T W O O A K S D I V E R S I F I E D |
| G R O W T H A N D I N C O M E F U N D |
| |
| |
| |
| |
| |
| |
| |
| |
| |
| |
| |
| |
| |
| |
| Annual Report |
| March 31, 2019 |
| |
| |
| |
| |
| |
| |
| |
| |
| |
| |
| |
| |
| |
| |
| |
| |
| |
| |
| |
| |
| |
| |
| |
| |
| |
| Beginning on January 1, 2021, as permitted by regulations adopted by the Securities and Exchange Commission, paper copies of the Fund’s shareholder reports like this one will no longer be sent by mail, unless you specifically request paper copies of the reports. Instead, the reports will be made available on the Fund’s website www.twooaks.com and you will be notified by mail each time a report is posted and provided with a website link to access the report. |
| |
| If you already elected to receive shareholder reports electronically, you will not be affected by this change and you need not take any action. You may elect to receive shareholder reports and other communications from the Fund electronically or to continue receiving paper copies of shareholder reports, which are available free of charge, by contacting your financial intermediary (such as a broker-dealer or bank) or, if you are a direct investor, by following the instructions included with paper Fund documents that have been mailed to you. |
The Two Oaks Diversified Growth and Income Fund March 31, 2019
Dear Fellow Shareholders of The Two Oaks Diversified Growth and Income Fund, it has been over thirteen years since we took over the portfolio management of the Montecito Fund on November 1, 2005. The fund we inherited started operations on April 15, 2002 and has a publishable track record back to this date. However, the current management and investment disciplines have been in place since November 1, 2005. We are pleased that we now have a publishable 13-year track record for the fund that shows the results of our investment philosophy. On November 1, 2005 the Net Asset Value of the fund was $10.09 per share. Since November 1, 2005 there have been $6.0136 in distributions and the Net Asset Value per Class A share was $12.89 as of March 31, 2019. This has resulted in a total positive return of $8.81 per share. As of the end of March the portfolio was invested 45.85% in Equities, 31.89% in Real Estate and Asset Based securities, 17.29% in Fixed Income and held 4.97% in Cash. The benchmark selected for our fund is a blend of 60% Standard and Poor’s 500 and 40% Bloomberg Barclay’s U.S. Aggregate Bond Index. From November 1, 2005 until March 31, 2019 this index showed a cumulative rate of return of 154.54% and an Average Annual Return of 7.21%. During this same time frame our fund at Net Asset Value showed a cumulative rate of return of 117.77% and an Average Annual Return of 5.97%. For the year ended March 31, 2019 our Class A shares were up 4.05%. This return consisted of depreciation of $.27 per share and distributions of $0.7692 per share. Trailing 1 year returns can be attributed to a solid income generation from our equity, real estate, and asset based securities. Asset prices have rebounded nicely since the sell- off that ended 2018.
The performance data quoted here represents past performance. Current performance may be lower or higher than the performance data quoted above. Investment return and principal value will fluctuate, so that shares, when redeemed, may be worth more or less than their original cost. Past performance is no guarantee of future results. A Fund’s performance, especially for very short periods of time, should not be the sole factor in making your investment decisions. For performance information current to the most recent month-end, please call 888.806.8633.
MARKET THOUGHTS
The economy and equities
A few years ago we predicted that the corporate tax law changes and a new deregulation bias in Washington, coupled with disruptive technology efficiencies, would create a more business friendly environment in which corporate board rooms would once again think about the future. This has certainly played out. The tax cuts have had a material impact on corporations. After all, the government effectively gave 14% ownership back to the shareholders of corporations when they lowered the maximum corporate tax rate from 35% to 21% and freed up that cash flow for corporate board rooms to work with. The impact on earnings was immediate, and the lag into GDP was not nearly as long as many thought it would be. GDP that had not been above 3% since late 2015 came in at 4.2% in the second quarter of 2018 and 3.5% in the third quarter. The Federal Reserve has used this economic strength to continue raising rates in an attempt to get us back to neutral. The animal spirits of early 2018 were quickly replaced by a narrative heralded by the press and impatient prognosticators that a recession is overdue. However, just because something hasn’t happened in a while doesn’t actually mean it will anytime soon. Corporate tax cuts have left a lasting impact and have companies investing in their future. Tax savings are being invested in people (we now have unemployment under 4%) and long-term investments as noted by the record amounts of dollars spent on Capital Expenditures and Research and Development in 2018. Savings from taxes have
4638-NLD-4/30/2019
led to a pick-up in wage growth, earnings growth, cash flow growth and acted as a stimulus for the economy. The “sugar high” of the first year is over and the Federal Reserve recognizes that the economy’s strength allows them to raise rates from accommodative to neutral. While there are numerous global economic pressures that many are focused on, we continue to see the U.S. economy growing, albeit at a slightly slower pace. We do question how steady the ride will be with the Fed searching for normalcy. As the training wheels are removed from the economy, there certainly could be some wobbles along the way. However, we do not believe the economy is as fragile as many are predicting and see the odds of a near-term recession as rather remote.
While earnings should not grow at the same rate we witnessed in 2018, we do believe a solid rate of growth is indeed achievable. Yes, there has been a peak in the growth rate of earnings, however,not a peak in earnings. There will be more potential headwinds again – there always are. However, you can make the case for both positive and negative surprises looking forward. Democrats may flex their muscles in the House and impeach the President over one thing or another, but chances of a conviction in the Senate are remote. Posturing for 2020 elections may lead to a lame duck President. The “Trade War” may continue or be resolved and go down as the quintessential example of Trump’s “who blinks first” brinksmanship. While these are the headlines of today, the headlines we worry about are “black swan” events not currently on our radar. These can lead to emotional reactions in the market and cause significant volatility.
Interest Rates
When it comes to interest rates, it’s all about the Fed. The fed funds rate increased 4 times during the year and several of the Federal Reserve voting members did indeed address their concern with causing an inverted yield curve. The economy has been firing on all cylinders for a while now. The Federal Reserve’s goals of maximum employment, stable prices, and moderate long-term interest rates are all being achieved. As such, the Fed has prudently been raising rates to remove the accommodative money policy and return interest rates to a “Neutral” range. We applaud the Federal Reserve for keeping its eye on their dual mandate and not succumbing to political pressures or a false assumed mandate of smoothing out asset prices in various market places. There are some real questions they will wrestle with in 2019: What is the “Neutral Rate”? How do you shrink the Fed balance sheet without negatively impacting the velocity of money? We believe the economy is different now than when the baby boom generation was driving the labor force. That post World War II rebuilding / growth phase was accompanied by a technological revolution leading to growth rates that may not be consistently achievable going forward. This thinking could be proven wrong if our immigration quotas were greatly expanded. However, without a dramatic labor force expansion we feel the economy is near full employment and economic growth will be in the 3% range going forward.
Energy and inflation
Looking at energy markets, we believe our thoughts on oil over the past couple of years has been right on. The economics of oil is based on the cost of development and production on the one hand and the political will of the largest producing nations on the other. Technological advancement has driven down
4638-NLD-4/30/2019
the cost of production over the years. Depending on the well and its location, $40 a barrel production cost seems to be in the ballpark. Most oil producers can hedge the revenue side of the equation in the futures market by selling future production. With a fixed revenue side and a known cost of production, the speculation comes down to the amount of reserves to be found. With today’s radar, echo sonograms and even satellite imagery, the reliability of finding reserves makes that speculation less risky than it ever has before. Today’s oil companies are in a better position than ever to be able to make a profit with more known’s than ever before. Importantly, before the drill bit hits the dirt, the economics of that well are substantially locked in for the first 18 months to 2 years. The United States has become the swing producer on the global stage using the price of oil as the catalyst for exploration decisions. Because of this, the United States moves at a much slower pace than an authoritative regime that can literally turn off the spigot and impact the supply and demand equation on an immediate basis. However, those regimes have found that flooding the market with oil to try and capture market share is more detrimental to their budgets than they ever dreamed. Knowing where the downside price of oil becomes so painful as to warrant production cuts to prop up the price (and thereby the revenues into their countries) has been a point of conjecture.
With all these dynamics in play, we believe oil remains range-bound for the foreseeable future thus impacting our thoughts on inflation. Given the potential for continued Washington gridlock, passing a Federal minimum wage increase seems unlikely. Resolution to trade and tariff issues with China seems possible but may take longer than many think given the negotiating styles of both sides. Further, even if oil climbs higher in price, the continued impact of disruptive technology on industry after industry will serve to keep inflation in check and relatively muted.
Real estate
The beauty of Commercial real estate is investor expectations are truly long-term, therefore, investment trends are multi-year as well. Perhaps it’s from properties not being priced on a daily basis like public ownership of businesses (stocks) that leads to a longer average holding period. More likely it’s from the judicious use of leverage, strict underwriting standards, long-term leases, and high transaction costs that make for a more stable investment encouraging multi-year holding periods. This does not mean we shouldn’t pay attention to long-term trends in real estate that favor one sector over another. We believe active management adds significant value by identifying those trends allowing investors who participate via publicly traded ownership of commercial real estate (via REITs) the opportunity to increase their rates of return.
Demographic shifts, business environments, and business trends all play into identifying real estate sectors that potentially will fare the best. As an example - online purchases continue to grow year over year. This is to the detriment of bricks-and-mortar stores and to the benefit of warehouses and distribution centers. This is a long-term trend we expect to continue for some time into the future. Therefore, we focus a portion of our holdings in warehouses and distribution centers and avoid investing
4638-NLD-4/30/2019
in malls and other retail locations. Another example - for a number of years, Millennials and Gen Xers have stayed home longer. When they did leave home they went to apartments. They seem to be a more fiscally responsible generation. They have not wanted to add a large mortgage on top of their student loans or lack the down payment money needed to buy their own homes. So, apartments have been attractive. As these younger generations have now been working longer and saving money, we are seeing this trend shift as demand for entry-level housing has grown nicely (at least in the affordable areas of the country). Should this trend continue, we will consider moving out of an over-weighted position in apartments. Finally, a very long-term trend that appears to be accelerating is growth of the cloud. Obviously, we’re not talking about buying pieces of the sky, but rather the data centers that house all of the technology that is the cloud.
As we do not see a rapid rise in interest rates, we believe rental increases will be able to offset the negative impact of cap rates creeping up. Therefore, we see returns from commercial real estate coming from cash flow and not appreciation. The only exception will be those portfolios adding incremental value though accretive acquisitions or property enhancements that drive additional revenue.
When it comes to residential real estate we believe the Millennial generation (to be fair it spreads out on both sides of this group a bit) is a potent buying force. As previously stated, they have become a far more fiscally responsible group, not buying homes until they can afford them and not buying more house than they think they will need long-term. At the same time, Baby-Boomers, who by and large used their homes as spending accounts for a lifestyle they could not really afford, are finding they need to downsize to become more fiscally solvent. As Boomers downsize they are competing for homes in the same marketplace as Millennials, creating more demand in the bottom end of the market and not the high end. Further, owners of more expensive homes in high income tax states will feel the sting of losing a great amount of federal subsidy via reduced tax deductions for income tax, property tax, and mortgage interest. This could remain a limiting factor going forward and lead to a growing migration out of those high tax states. Should this continue, we could see downward pressure on the prices of homes selling for above the maximum conforming Fannie Mae loan amount of $453,100.
THOUGHTS ON PORTFOLIO POSITIONING
To find opportunity we first analyze the marketplace. As you are now aware of our thoughts related to the economy, equity markets, interest rates, energy prices, inflation, and real estate, you get a sense of the type of research and long-term investment thinking that goes into our decisions. Please note, today’s observations share some of the observations we made at this time last year as our investment outlook is truly long-term in nature:
| • | From a historical valuation perspective, the S&P 500 Index looks to be within its “Fair Value” range. It was certainly pushing towards the upper limit but the pullback in Q4 2018 quickly brought it back to long-term averages. With sentiment still cautious towards stocks, we believe the odds of a significant |
4638-NLD-4/30/2019
market crash are rather remote. Instead, we believe a case can be made for a continued march higher as stocks continue to climb the never-ending “wall of worry”.
| • | Fixed Income markets continue to offer little yield with the 10 year U.S. Treasury bond yielding 2.4% at quarter end. While we would like to find more yield in the Fixed Income sector of our portfolio, we feel the principal risk associated with extending the duration is not justified by the low current yields. |
| • | Sacrificing credit quality to chase yield is not something we do. |
| • | Alternatives to traditional fixed income continue to make sense. Many Real Estate Investment Trusts (REITs) entered 2018 trading at premium valuations & offered little to no additional yield when compared to several “blue-chip” companies. However, valuations quickly became more attractive with last year’s fears of rates rising faster than anticipated and market volatility experienced in the fourth quarter. |
We continue to believe that it is more prudent than ever to focus on a bottoms-up, fundamental based approach to the markets. Up until recently you were able to achieve success by merely having exposure to the broad markets. However, last year reminded us just how volatile markets can be. We continue to believe success will be earned by focusing on long-term investment themes, unique company-specific ideas, & investing in less followed asset classes such as the following:
| • | Demographics of our country are changing – Baby Boom generation is aging and 10,000 are reaching traditional retirement age every day. Further, the Millennial generation has now surpassed the size of the Baby Boom generation. We have a new demographic force shaping the future of our economy. |
| • | Productivity & Connectivity is happening like never before through technological advancements |
| • | U.S. remains on course to eventually become Energy Independent and has a new role as the world-wide swing producer. |
| • | Manufacturing is changing due to cheap energy feedstocks & advances in automation |
| • | Customization is key as consumers are being empowered with more choices than ever before |
| • | Water & the availability of potable water are essential to our global economy |
| • | Real Assets will play a vital role in portfolio construction for their reliable income, upside potential, fundamental growth trends, low volatility, inflation protection, & diversification benefits |
| • | Global standard of living increases as emerging economies continue to develop |
| • | Find better values by sifting through currently out of favor companies with correctable issues, and if able to be paid to be patient, invest for the long term |
4638-NLD-4/30/2019
| • | Find companies taking market share. Business is competition & we believe the market will be willing to pay up for businesses that are taking market share from competitors |
| • | Find companies with potential catalysts. When we talk about catalysts we mean a potential event that can create some positive buzz around a company. This may include being acquired by another company, buying another company, a top-level management change, having financial opportunities such as a dividend raise or share buyback, breaking off or an outright sale of a business line that no longer fits with the company’s strategic vision, etc. |
| • | In Fixed Income markets find issues offering a potential hedge against a rising interest rate environment such as a floating rate coupon or conversion feature. Also, if we are going to own a “traditional coupon bond”, keep the maturity short. |
We believe our current asset allocation & portfolio holdings reflect these points. Looking forward, we believe the greatest value & opportunities will be found by keeping the asset allocation near a maximum weighting in equities, minimum in fixed income, & neutral in real estate / asset based securities.
CLOSING THOUGHTS
We continue to believe that owning high quality investment assets that pay an income that grows over time and diversifying those holdings is an excellent equation for investors to achieve financial independence. Our disciplines dictate that we be balanced, with 15% to 50% in each of the three major asset categories – Equities, Fixed Income, and Real Estate and Asset Based. Adding to that asset allocation is our own proprietary research and analytical tools that are the hallmarks of our “common sense investing” for the long term. Thank you for your continued confidence and the opportunity to manage our fund. We take very seriously our responsibility and will always endeavor to be responsive to your questions and concerns. As always, we welcome and encourage your comments and feedback.
| Blake Todd | Jarrett Perez, CFA |
| Portfolio Manager | Portfolio Manager |
| | |
The material herein has been provided by Two Oaks Investment Management, LLC and is for informational purposes only.
Two Oaks Investment Management, LLC is not affiliated with Northern Lights Distributors, LLC.
Bloomberg Barclays Capital U.S. Aggregate Bond Index covers the USD-denominated, investment-grade, fixed-rate, taxable bond market of SEC-registered securities. The index includes bonds from the Treasury, Government- Related, Corporate, MBS (agency fixed-rate and hybrid ARM pass-throughs), ABS, and CMBS sectors. The U.S. Aggregate Index is a component of the U.S. Universal Index in its entirety. Fixed Income securities are subject to risks including inflationary and interest rate changes, among others.
4638-NLD-4/30/2019
S&P 500 Index is an unmanaged composite of 500 large capitalization companies. This index is widely used by professional investors as a performance benchmark for large-cap stocks. You cannot invest directly in an index and unmanaged index returns do not reflect any fees, expenses or sales charges.
4638-NLD-4/30/2019
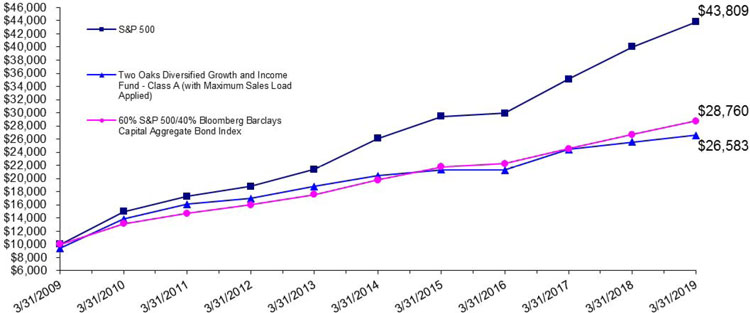
| Two Oaks Diversified Growth and Income Fund (Unaudited) |
| Growth of $10,000 |
| Performance Summary – For Year Ended March 31, 2019 |
| | | Annualized |
| | | | | Since Inception |
| | 1 Year | 5 Years | 10 Years | 04/15/2002 |
| Two Oaks Diversified Growth and Income Fund(1) – Class A: | 4.05% | 5.40% | 10.92% | 4.84% |
| Without Sales Charge |
| With Sales Charge(2) | (1.91)% | 4.16% | 10.27% | 4.48% |
| S&P 500 | 9.50% | 10.91% | 15.92% | 7.90% |
| 60% S&P 500/40% Bloomberg Barclays U.S. Aggregate Bond | 7.78% | 7.75% | 11.14% | 6.74% |
| | | | | |
| (1) | Effective November 1, 2005, the strategy of the Montecito Fund changed and Blake T. Todd assumed the role of Portfolio Manager. |
| (2) | Adjusted for initial maximum sales charge of 5.75%. |
The S&P 500 is a market capitalization-weighted index of 500 widely held common stocks. The Bloomberg Barclays U.S. Aggregate Bond Index is an unmanaged market index representative of the U.S. taxable fixed income securities.
Past performance is not predictive of future results and current performance may be lower or higher than the performance data quoted. The Fund’s total annual gross operating expenses, as stated in the fee table to the Portfolio’s prospectus dated July 31, 2018, are 1.72% for Class A. The investment return and principal value of an investment will fluctuate. An investor’s shares, when redeemed, may be worth more or less than the original cost. The returns shown do not reflect the deduction of taxes that a shareholder would have to pay on Fund distributions or the redemption of the Fund shares. Investment performance current to the most recent month-end may be obtained by calling (888) 806-8633.
| Two Oaks Diversified Growth and Income Fund |
| March 31, 2019 (Unaudited) |
| Top 10 Holdings* (Unaudited) | | % of Net Assets | | | Portfolio Composition (Unaudited) | | % of Net Assets | |
| Brookfield Infrastructure Partners LP | | | 4.2 | % | | Common Stock | | | 54.3 | % |
| Apple, Inc. | | | 3.5 | % | | Real Estate Investment Trusts (REITS) | | | 21.4 | % |
| Walt Disney Co. | | | 3.3 | % | | Corporate Bonds | | | 17.3 | % |
| Dollar General Corp., 3.2500%, Due 4/15/2023 | | | 3.3 | % | | Short-Term Investments | | | 3.8 | % |
| Bluerock Residential Growth REIT, Inc. | | | 3.1 | % | | Closed-End Fund | | | 1.9 | % |
| International Business Machines Corp. | | | 3.0 | % | | Cash And Other Assets Less Liabilities | | | 1.3 | % |
| Rockwell Automation, Inc. | | | 2.9 | % | | NET ASSETS | | | 100.0 | % |
| Marathon Oil Corp. | | | 2.7 | % | | | | | | |
| T. Rowe Price Group, Inc. | | | 2.7 | % | | | | | | |
| UnitedHealth Group, Inc. | | | 2.7 | % | | | | | | |
| | | | | | | | | | | |
| * | As of March 31, 2019. Top ten holdings exclude short-term investments. |
Please refer to the Portfolio of Investments in this annual report for a detailed listing of the Fund’s holdings.
| Two Oaks Diversified Growth and Income Fund | |
| SCHEDULE OF INVESTMENTS | March 31, 2019 |
| Shares | | | Security | | Fair Value | |
| | | | | COMMON STOCK - 54.3% | | | | |
| | | | | APPAREL - 1.0% | | | | |
| | 15,000 | | | Hanesbrands, Inc. | | $ | 268,200 | |
| | | | | | | | | |
| | | | | BANKS - 0.7% | | | | |
| | 20,000 | | | Community West Bancshares | | | 203,600 | |
| | | | | | | | | |
| | | | | BEVERAGES - 1.6% | | | | |
| | 2,500 | | | Constellation Brands, Inc. | | | 438,325 | |
| | | | | | | | | |
| | | | | COMMERCIAL SERVICES - 1.5% | | | | |
| | 10,000 | | | Service Corporation International | | | 401,500 | |
| | | | | | | | | |
| | | | | COMPUTERS - 6.4% | | | | |
| | 5,000 | | | Apple, Inc. | | | 949,750 | |
| | 5,750 | | | International Business Machines Corp. | | | 811,325 | |
| | | | | | | | 1,761,075 | |
| | | | | DIVERSIFIED FINANCIAL SERVICES - 6.9% | | | | |
| | 20,000 | | | BGC Partners, Inc., Class A | | | 106,200 | |
| | 15,000 | | | Charles Schwab Corp. | | | 641,400 | |
| | 7,500 | | | T. Rowe Price Group, Inc. | | | 750,900 | |
| | 2,500 | | | Visa, Inc. | | | 390,475 | |
| | | | | | | | 1,888,975 | |
| | | | | ELECTRIC - 4.2% | | | | |
| | 27,750 | | | Brookfield Infrastructure Partners LP | | | 1,161,893 | |
| | | | | | | | | |
| | | | | FOOD - 2.1% | | | | |
| | 7,000 | | | Calavo Growers, Inc. | | | 586,950 | |
| | | | | | | | | |
| | | | | HEALTHCARE - SERVICES - 2.7% | | | | |
| | 3,000 | | | UnitedHealth Group, Inc. | | | 741,780 | |
| | | | | | | | | |
| | | | | HOUSEWARES - 0.8% | | | | |
| | 2,800 | | | The Scotts Miracle-Gro Co. | | | 220,024 | |
| | | | | | | | | |
| | | | | MACHINERY - DIVERSIFIED - 4.9% | | | | |
| | 4,500 | | | Rockwell Automation, Inc. | | | 789,570 | |
| | 7,000 | | | Xylem, Inc. | | | 553,280 | |
| | | | | | | | 1,342,850 | |
| | | | | MEDIA - 4.8% | | | | |
| | 10,000 | | | Comcast Corp., Class A | | | 399,800 | |
| | 8,200 | | | Walt Disney Co. | | | 910,446 | |
| | | | | | | | 1,310,246 | |
| | | | | OIL & GAS - 4.3% | | | | |
| | 12,500 | | | Apache Corp. | | | 433,250 | |
| | 45,000 | | | Marathon Oil Corp. | | | 751,950 | |
| | | | | | | | 1,185,200 | |
| | | | | | | | | |
The accompanying notes are an integral part of these financial statements.
| Two Oaks Diversified Growth and Income Fund | |
| SCHEDULE OF INVESTMENTS (Continued) | March 31, 2019 |
| Shares | | | Security | | Fair Value | |
| | | | | COMMON STOCK - 54.3% (Continued) | | | | |
| | | | | REAL ESTATE - 0.3% | | | | |
| | 9,277 | | | Newmark Group, Inc., Class A | | $ | 77,370 | |
| | | | | | | | | |
| | | | | RETAIL - 4.2% | | | | |
| | 3,000 | | | McDonald’s Corp. | | | 569,700 | |
| | 2,200 | | | PriceSmart, Inc. | | | 129,536 | |
| | 6,000 | | | Starbucks Corp. | | | 446,040 | |
| | | | | | | | 1,145,276 | |
| | | | | SEMICONDUCTORS - 2.0% | | | | |
| | 10,000 | | | Intel Corp. | | | 537,000 | |
| | | | | | | | | |
| | | | | SOFTWARE - 0.9% | | | | |
| | 1,000 | | | NetEase, Inc. - ADR | | | 241,450 | |
| | | | | | | | | |
| | | | | TRANSPORTATION - 2.6% | | | | |
| | 4,000 | | | FedEx Corp. | | | 725,640 | |
| | | | | | | | | |
| | | | | WATER - 2.4% | | | | |
| | 50,000 | | | Consolidated Water Co., Ltd. | | | 643,500 | |
| | | | | | | | | |
| | | | | TOTAL COMMON STOCK | | | 14,880,854 | |
| | | | | (Cost - $12,075,635) | | | | |
| | | | | | | | | |
| | | | | REAL ESTATE INVESTMENT TRUSTS (REITS) - 21.4% | | | | |
| | | | | APARTMENTS - 3.2% | | | | |
| | 80,000 | | | Bluerock Residential Growth REIT, Inc. | | | 862,400 | |
| | | | | | | | | |
| | | | | DIVERSIFIED - 12.9% | | | | |
| | 43,000 | | | Armada Hoffler Properties, Inc. | | | 670,370 | |
| | 20,000 | | | CorEnergy Infrastructure Trust, Inc. | | | 735,000 | |
| | 6,200 | | | Digital Realty Trust, Inc. | | | 737,800 | |
| | 4,000 | | | EPR Properties | | | 307,600 | |
| | 50,000 | | | Lexington Realty Trust | | | 453,000 | |
| | 45,000 | | | UMH Properties, Inc. | | | 633,600 | |
| | | | | | | | 3,537,370 | |
| | | | | HEALTH CARE - 1.1% | | | | |
| | 10,000 | | | HCP, Inc. | | | 313,000 | |
| | | | | | | | | |
| | | | | OFFICE PROPERTY - 2.3% | | | | |
| | 54,343 | | | City Office REIT, Inc. | | | 614,619 | |
| | | | | | | | | |
| | | | | WAREHOUSE/INDUSTRIAL - 1.9% | | | | |
| | 40,000 | | | Monmouth Real Estate Investment Corp. | | | 527,200 | |
| | | | | | | | | |
| | | | | TOTAL REAL ESTATE INVESTMENTS TRUSTS
(Cost - $4,472,144) | | | 5,854,589 | |
| | | | | | | | | |
The accompanying notes are an integral part of these financial statements.
| Two Oaks Diversified Growth and Income Fund | |
| SCHEDULE OF INVESTMENTS (Continued) | March 31, 2019 |
| Principal Amount | | | Security | | Coupon Rate (%) | | Maturity Date | | Fair Value | |
| | | | | CORPORATE BONDS - 17.3% | | | | | | | | |
| | | | | BANKS - 3.6% | | | | | | | | |
| $ | 500,000 | | | Barclays Bank PLC, 3 mo. LIBOR + 1.25% (a) | �� | 4.0489 | | 4/11/2023 | | $ | 493,945 | |
| | 500,000 | | | Goldman Sachs Group, Inc., 3mo. LIBOR + 1.15% (a) | | 3.7936 | | 5/20/2020 | | | 503,508 | |
| | | | | | | | | | | | 997,453 | |
| | | | | ELECTRIC - 1.9% | | | | | | | | |
| | 500,000 | | | Public Service Enterprise Group, Inc. | | 2.0000 | | 11/15/2021 | | | 485,672 | |
| | | | | | | | | | | | | |
| | | | | ENVIRONMENTAL CONTROL - 1.2% | | | | | | | | |
| | 347,000 | | | Waste Management, Inc. | | 2.4000 | | 5/15/2023 | | | 341,310 | |
| | | | | | | | | | | | | |
| | | | | MISCELLANEOUS MANUFACTURING - 1.8% | | | | | | |
| | 500,000 | | | General Electric Co., 3 mo. LIBOR + 1.00% (a) | | 3.7873 | | 4/15/2023 | | | 484,229 | |
| | | | | | | | | | | | | |
| | | | | OIL & GAS - 1.8% | | | | | | | | |
| | 500,000 | | | Chevron Corp. | | 2.4980 | | 3/3/2022 | | | 500,318 | |
| | | | | | | | | | | | | |
| | | | | PHARMACEUTICALS - 1.9% | | | | | | | | |
| | 500,000 | | | McKesson Corp. | | 3.7960 | | 3/15/2024 | | | 510,681 | |
| | | | | | | | | | | | | |
| | | | | RETAIL - 3.3% | | | | | | | | |
| | 900,000 | | | Dollar General Corp. | | 3.2500 | | 4/15/2023 | | | 905,570 | |
| | | | | | | | | | | | | |
| | | | | TELECOMMUNICATIONS - 1.8% | | | | | | | | |
| | 500,000 | | | AT&T, Inc. | | 3.0000 | | 6/30/2022 | | | 502,424 | |
| | | | | | | | | | | | | |
| | | | | TOTAL CORPORATE BONDS
(Cost - $4,714,543) | | | | | | | 4,727,657 | |
| | | | | | | | | | | | | |
| Shares | | | | | | | | | | | |
| | | | | CLOSED-END FUND - 1.9% | | | | | | | | |
| | 22,000 | | | Tortoise Energy Infrastructure Corp. | | | | | | |
| | | | | TOTAL CLOSED-END FUND
(Cost - $503,323) | | | | | 517,000 | |
| | | | | | | | | | | | | |
| | | | | SHORT-TERM INVESTMENTS - 3.8% | | | | | | | | |
| | 1,046,353 | | | Dreyfus Institutional Preferred Government Money Market Fund Premier Shares, 2.40% (b) | | | 1,046,353 | |
| | | | | TOTAL SHORT-TERM INVESTMENTS
(Cost - $1,046,353) | | | | | | |
| | | | | | | | | | | | | |
| | | | | TOTAL INVESTMENTS - 98.7%
(Cost - $22,811,998) | | | | $ | 27,026,453 | |
| | | | | CASH AND OTHER ASSETS LESS LIABILITIES - 1.3% | | | | | 356,965 | |
| | | | | NET ASSETS - 100.0% | | | | $ | 27,383,418 | |
| | | | | | | | | | | | | |
ADR - American Depositary Receipt
LP - Limited Partnership
PLC - Public Limited Company
REITS - Real Estate Investment Trusts
LIBOR - London Interbank Offered Rate
| (a) | Variable rate security; the rate shown represents the rate at March 31, 2019. |
| (b) | Money market fund; interest rate reflects the seven-day effective yield on March 31, 2019. |
The accompanying notes are an integral part of these financial statements.
| Two Oaks Diversified Growth and Income Fund | |
| STATEMENT OF ASSETS AND LIABILITIES | March 31, 2019 |
| Assets: | | | | |
| Investments in Securities at Fair Value (Cost $22,811,998) | | $ | 27,026,453 | |
| Cash | | | 311,796 | |
| Receivables: | | | | |
| Dividends and Interest | | | 75,748 | |
| Fund Shares Sold | | | 94 | |
| Prepaid Expenses and Other Assets | | | 3,552 | |
| Total Assets | | | 27,417,643 | |
| | | | | |
| Liabilities: | | | | |
| Payables: | | | | |
| Accrued Advisory Fees | | | 13,839 | |
| Accrued Distribution Fees | | | 5,766 | |
| Payable to Related Parties | | | 8,044 | |
| Accrued Expenses and Other Liabilities | | | 6,576 | |
| Total Liabilities | | | 34,225 | |
| | | | | |
| Net Assets | | $ | 27,383,418 | |
| | | | | |
| Class A Shares: | | | | |
| Net Asset Value and Redemption Price Per Share ($0 par value, unlimited shares authorized) ($27,383,418/2,124,179 shares) | | $ | 12.89 | |
| | | | | |
| Maximum Offering Price Per Share ($12.89/0.9425) | | $ | 13.68 | |
| | | | | |
| Composition of Net Assets: | | | | |
| At March 31, 2019, Net Assets consisted of: | | | | |
| Paid-in-Capital | | | 22,704,353 | |
| Accumulated Earnings | | | 4,679,065 | |
| Net Assets | | $ | 27,383,418 | |
| | | | | |
The accompanying notes are an integral part of these financial statements.
| Two Oaks Diversified Growth and Income Fund | For the Year Ended |
| STATEMENT OF OPERATIONS | March 31, 2019 |
| Investment Income: | | | | |
| Dividend Income (net of $3,318 foreign taxes) | | $ | 612,742 | |
| Interest Income | | | 164,139 | |
| Total Investment Income | | | 776,881 | |
| | | | | |
| Expenses: | | | | |
| Investment Advisory Fees | | | 165,481 | |
| Distribution Fees - Class A | | | 68,951 | |
| Administration Fees | | | 43,069 | |
| Trustee Fees | | | 29,308 | |
| Transfer Agent Fees | | | 28,980 | |
| Fund Accounting Fees | | | 24,192 | |
| Legal Fees | | | 25,598 | |
| Chief Compliance Officer Fees | | | 20,741 | |
| Audit Fees | | | 17,002 | |
| Registration & Filing Fees | | | 13,028 | |
| Printing Expenses | | | 11,912 | |
| Third Party Administrative Servicing Fees | | | 7,503 | |
| Custody Fees | | | 5,888 | |
| Insurance Expense | | | 2,000 | |
| Miscellaneous Expense | | | 2,000 | |
| Total Expenses | | | 465,653 | |
| Net Investment Income | | | 311,228 | |
| | | | | |
| Net Realized and Unrealized Gain (Loss) on Investments: | | | | |
| Net Realized Gain From Security Transactions | | | 1,187,987 | |
| Net Change in Net Unrealized (Depreciation) on Investments | | | (403,289 | ) |
| Net Realized and Unrealized Gain on Investments | | | 784,698 | |
| | | | | |
| Net Increase in Net Assets Resulting From Operations | | $ | 1,095,926 | |
| | | | | |
The accompanying notes are an integral part of these financial statements.
| Two Oaks Diversified Growth and Income Fund |
| STATEMENTS OF CHANGES IN NET ASSETS |
| | | Year Ended | | | Year Ended | |
| | | March 31, 2019 | | | March 31, 2018 | |
| | | | | | | |
| Operations: | | | | | | | | |
| Net Investment Income | | $ | 311,228 | | | $ | 224,808 | |
| Net Realized Gain From Security Transactions | | | 1,187,987 | | | | 937,064 | |
| Net Change in Net Unrealized Appreciation (Depreciation) on Investments | | | (403,289 | ) | | | 93,415 | |
| Net Increase in Net Assets Resulting From Operations | | | 1,095,926 | | | | 1,255,287 | |
| | | | | | | | | |
| Dividends and Distributions to Shareholders From: | | | | | | | | |
| Net Investment Income: | | | | | | | | |
| Class A ($0 and $0.13 per share, respectively) | | | — | | | | (262,469 | ) |
| Net Realized Gains: | | | | | | | | |
| Class A ($0 and $0.36 per share, respectively) | | | — | | | | (732,556 | ) |
| Total Distributions Paid* | | | | | | | | |
| Class A ($0.77 and $0 per share, respectively) | | | (1,533,633 | ) | | | — | |
| Total Distributions to Shareholders | | | (1,533,633 | ) | | | (995,025 | ) |
| | | | | | | | | |
| Capital Share Transactions: | | | | | | | | |
| Class A: | | | | | | | | |
| Proceeds from Shares Issued (102,017 and 241,210 shares, respectively) | | | 1,317,319 | | | | 3,231,249 | |
| Exchanges from Class C (0 and 187,007 shares, respectively) | | | — | | | | 2,451,663 | |
| Reinvestment of Dividends (122,896 and 73,068 shares, respectively) | | | 1,529,988 | | | | 989,756 | |
| Cost of Shares Redeemed (207,764 and 309,554 shares, respectively) | | | (2,747,335 | ) | | | (4,137,948 | ) |
| Class C***: | | | | | | | | |
| Proceeds from Shares Issued (0 and 2,260 shares, respectively) | | | — | | | | 29,194 | |
| Exchanges to Class A (0 and 188,589 shares, respectively) | | | — | | | | (2,451,663 | ) |
| Cost of Shares Redeemed (0 and 1,124 shares, respectively) | | | — | | | | (14,535 | ) |
| Total Capital Share Transactions | | | 99,972 | | | | 97,716 | |
| | | | | | | | | |
| Total Increase (Decrease) in Net Assets | | | (337,735 | ) | | | 357,978 | |
| | | | | | | | | |
| Net Assets: | | | | | | | | |
| Beginning of Year | | | 27,721,153 | | | | 27,363,175 | |
| End of Year** | | $ | 27,383,418 | | | $ | 27,721,153 | |
| | | | | | | | | |
| * | Distributions from net investment income and net realized capital gains are combined for the year ended March 31, 2019. See “New Accounting Pronouncements” in the Notes to Financial Statements for more information. The dividends and distributions to shareholders for the year ended March 31, 2018 have not been reclassified to conform to the current year presentation. |
| ** | Net Assets-End of Year includes accumulated undistributed net investment income of $62,886 as of March 31, 2018. |
| *** | Class C shares were converted into Class A on May 20, 2017. |
The accompanying notes are an integral part of these financial statements.
| Two Oaks Diversified Growth and Income Fund |
| FINANCIAL HIGHLIGHTS |
| |
| The table below sets forth financial data for one share of capital stock outstanding throughout each year presented. |
| | | Class A (a) | |
| | | | | | | | | | | | | | | | |
| | | For the Year Ended March 31, | |
| | | 2019 | | | 2018 | | | 2017 | | | 2016 | | | 2015 | |
| | | | | | | | | | | | | | | | |
| Net Asset Value, Beginning of Year | | $ | 13.16 | | | $ | 13.02 | | | $ | 11.52 | | | $ | 12.04 | | | $ | 12. 19 | |
| | | | | | | | | | | | | | | | | | | | | |
| From Operations: | | | | | | | | | | | | | | | | | | | | |
| Net investment income (b) | | | 0.15 | | | | 0.12 | | | | 0.11 | | | | 0.20 | | | | 0.19 | |
| Net gain (loss) from securities (both realized and unrealized) | | | 0.35 | | | | 0.51 | | | | 1.57 | | | | (0.25 | ) | | | 0.34 | |
| Total from operations | | | 0.50 | | | | 0.63 | | | | 1.68 | | | | (0.05 | ) | | | 0.53 | |
| | | | | | | | | | | | | | | | | | | | | |
| Distributions to shareholders from | | | | | | | | | | | | | | | | | | | | |
| Net investment income | | | (0.16 | ) | | | (0.13 | ) | | | (0.18 | ) | | | (0.16 | ) | | | (0.17 | ) |
| Net realized gains | | | (0.61 | ) | | | (0.36 | ) | | | — | | | | (0.28 | ) | | | (0.51 | ) |
| Return of capital | | | — | | | | — | | | | — | | | | (0.03 | ) | | | — | |
| Total distributions | | | (0.77 | ) | | | (0.49 | ) | | | (0.18 | ) | | | (0.47 | ) | | | (0.68 | ) |
| | | | | | | | | | | | | | | | | | | | | |
| Net Asset Value, End of Year | | $ | 12.89 | | | $ | 13.16 | | | $ | 13.02 | | | $ | 11.52 | | | $ | 12.04 | |
| | | | | | | | | | | | | | | | | | | | | |
| Total Return (c) | | | 4.05 | % | | | 4.70 | % | | | 14.63 | % | | | (0.31 | )% | | | 4.46 | % |
| | | | | | | | | | | | | | | | | | | | | |
| Ratios/Supplemental Data | | | | | | | | | | | | | | | | | | | | |
| Net assets, end of year (in 000’s) | | $ | 27,383 | | | $ | 27,721 | | | $ | 24,940 | | | $ | 22,059 | | | $ | 23,837 | |
Ratio of expenses to average net assets,
before recapture (d) | | | 1.69 | % | | | 1.70 | % | | | 1.75 | % | | | 1.81 | % | | | 1.74 | % |
| net of recapture (d) | | | 1.69 | % | | | 1.75 | % (e) | | | 1.75 | % | | | 1.75 | % | | | 1.75 | % (e) |
| Ratio of net investment income to average net assets (d) | | | 1.13 | % | | | 0.86 | % | | | 0.90 | % | | | 1.71 | % | | | 1.55 | % |
| Portfolio turnover rate | | | 15 | % | | | 22 | % | | | 24 | % | | | 28 | % | | | 25 | % |
| | | | | | | | | | | | | | | | | | | | | |
| (a) | Class C shares were merged into Class A on May 20, 2017. The amounts presented represent the results of the Class A shares for the periods prior to the merger and the results of the combined share class for the period subsequent to the merger. |
| (b) | Per share amounts are calculated using the average shares method, which more appropriately presents the per share data for each year. |
| (c) | Total returns are historical in nature and assume changes in share price, reinvestment of dividends and capital gains distributions, if any, and do not assume the effects of any sales charges. Had the Adviser not waived a portion of its fee during 2014 and 2016-2017, total returns would have been lower. |
| (d) | Does not include expenses of the investment companies in which the Fund invests. |
| (e) | Inclusive of Adviser’s recapture of waived/reimbursed fees from prior periods. |
The accompanying notes are an integral part of these financial statements.
| Two Oaks Diversified Growth and Income Fund | |
| NOTES TO FINANCIAL STATEMENTS | March 31, 2019 |
| | |
Two Oaks Diversified Growth and Income Fund (the “Fund”) is a diversified series of Northern Lights Fund Trust II (the “Trust”), a Delaware statutory trust organized on August 26, 2010. The Fund is registered under the Investment Company Act of 1940, as amended (the “Act”), as an open-end management investment company. The Fund commenced operations on April 15, 2002. The investment objective of the Fund is long-term growth of capital and income.
The Fund currently only offers Class A shares. On May 20, 2017, $2,451,663 and 188,589 shares of Class C were converted into 187,007 Class A shares. Class A shares are offered at net asset value plus a maximum sales charge of 5.75%. Each class represents an interest in the same assets of the Fund and classes are identical except for differences in their sales charge structures and ongoing service and distribution charges. All classes of shares have equal voting privileges except that each class has exclusive voting rights with respect to its service and/or distribution plans. The Fund’s income, expenses (other than class specific distribution fees) and realized and unrealized gains and losses are allocated proportionately each day based upon the relative net assets of each class.
| 2. | SUMMARY OF SIGNIFICANT ACCOUNTING POLICIES |
The following is a summary of significant accounting policies followed by the Fund in preparation of the financial statements. These policies are in conformity with accounting principles generally accepted in the United States of America (“GAAP”). The preparation of financial statements requires management to make estimates and assumptions that affect the reported amounts of assets and liabilities and disclosure of contingent assets and liabilities at the date of the financial statements and the reported amounts of income and expenses for the period. Actual results could differ from those estimates. The Fund is an investment company and accordingly follows the investment company accounting and reporting guidance of the Financial Accounting Standards Board (FASB)Accounting Standard Codification Topic 946 “Financial Services – Investment Companies” including FASB Accounting Standard Update ASU 2013-08.
Security valuation– Securities listed on an exchange are valued at the last reported sale price at the close of the regular trading session of the primary exchange on the business day the value is being determined, or in the case of securities listed on NASDAQ at the NASDAQ Official Closing Price (“NOCP”). In the absence of a sale such securities shall be valued at the mean between the current bid and ask prices on the day of valuation. Debt securities (other than short-term obligations) are valued each day by an independent pricing service approved by the Board of Trustees (the “Board”) based on methods which include consideration of: yields or prices of securities of comparable quality, coupon, maturity and type, indications as to values from dealers, and general market conditions or market quotations from a major market maker in the securities. Investments valued in currencies other than the U.S. dollar are converted to U.S. dollars using exchange rates obtained from pricing services. Short-term debt obligations having 60 days or less remaining until maturity, at time of purchase, may be valued at amortized cost.
The Fund may invest in portfolios of open- end or closed-end investment companies (the “underlying funds”). Open-end underlying funds are valued at their respective net asset values as reported by such investment companies. The underlying funds value securities in their portfolios for which market quotations are readily available at their market values (generally the last reported sale price) and all other securities and assets at their fair value by the methods established by the Boards of the underlying funds. The shares of many closed-end investment companies, after their initial public offering, frequently trade at a price per share, which is different than the net asset value per share. The difference represents a market premium or market discount of such shares. There can be no assurances that the market discount or market premium on shares of any closed-end investment company purchased by the Fund will not change.
The Fund may hold securities, such as private investments, interests in commodity pools, other non-traded securities or temporarily illiquid securities, for which market quotations are not readily available or are determined to be unreliable. These securities will be valued using the “fair value” procedures approved by the Board. The Board has delegated execution of these procedures to a fair value team composed of one or more representatives from each of the (i) Trust, (ii) administrator, and (iii) adviser. The team may also enlist third party consultants such as a valuation specialist at a public accounting firm, valuation consultant, or financial officer of a security issuer on an as-needed basis to assist in determining a security-specific fair value. The Board has also engaged a third party valuation firm to attend valuation meetings held by the trust, review minutes of such meetings, and report to the Board on a quarterly basis. The Board reviews and ratifies the execution of this process and the resultant fair value prices at least quarterly to assure the process produces reliable results.
Fair Valuation Process. As noted above, the fair value team is composed of one or more representatives from each of the (i) Trust, (ii) administrator, and (iii) adviser. The applicable investments are valued collectively via inputs from each of these groups. For example, fair value determinations are required for the following securities: (i) securities for which market quotations are insufficient or not readily available on a particular business day (including securities for which there is a short and
| Two Oaks Diversified Growth and Income Fund | |
| NOTES TO FINANCIAL STATEMENTS (Continued) | March 31, 2019 |
| | |
temporary lapse in the provision of a price by the regular pricing source), (ii) securities for which, in the judgment of the adviser, the prices or values available do not represent the fair value of the instrument. Factors which may cause the adviser to make such a judgment include, but are not limited to, the following: only a bid price or an asked price is available; the spread between bid and asked prices is substantial; the frequency of sales; the thinness of the market; the size of reported trades; and actions of the securities markets, such as the suspension or limitation of trading; (iii) securities determined to be illiquid; (iv) securities with respect to which an event that will affect the value thereof has occurred (a “significant event”) since the closing prices were established on the principal exchange on which they are traded, but prior to a Fund’s calculation of its net asset value. Specifically, interests in commodity pools or managed futures pools are valued on a daily basis by reference to the closing market prices of each futures contract or other asset held by a pool, as adjusted for pool expenses. Restricted or illiquid securities, such as private investments or non-traded securities are valued via inputs from the adviser based upon the current bid for the security from two or more independent dealers or other parties reasonably familiar with the facts and circumstances of the security (who should take into consideration all relevant factors as may be appropriate under the circumstances). If the adviser is unable to obtain a current bid from such independent dealers or other independent parties, the fair value team shall determine the fair value of such security using the following factors: (i) the type of security; (ii) the cost at date of purchase; (iii) the size and nature of the Fund’s holdings; (iv) the discount from market value of unrestricted securities of the same class at the time of purchase and subsequent thereto; (v) information as to any transactions or offers with respect to the security; (vi) the nature and duration of restrictions on disposition of the security and the existence of any registration rights; (vii) how the yield of the security compares to similar securities of companies of similar or equal creditworthiness; (viii) the level of recent trades of similar or comparable securities; (ix) the liquidity characteristics of the security; (x) current market conditions; and (xi) the market value of any securities into which the security is convertible or exchangeable.
The Fund utilizes various methods to measure the fair value of most of its investments on a recurring basis. GAAP establishes a hierarchy that prioritizes inputs to valuation methods. The three levels of input are:
Level 1– Unadjusted quoted prices in active markets for identical assets and liabilities that the Fund has the ability to access.
Level 2– Observable inputs other than quoted prices included in level 1 that are observable for the asset or liability, either directly or indirectly. These inputs may include quoted prices for the identical instrument in an inactive market, prices for similar instruments, interest rates, prepayment speeds, credit risk, yield curves, default rates and similar data.
Level 3– Unobservable inputs for the asset or liability, to the extent relevant observable inputs are not available, representing the Fund’s own assumptions about the assumptions a market participant would use in valuing the asset or liability, and would be based on the best information available.
The availability of observable inputs can vary from security to security and is affected by a wide variety of factors, including, for example, the type of security, whether the security is new and not yet established in the marketplace, the liquidity of markets, and other characteristics particular to the security. To the extent that valuation is based on models or inputs that are less observable or unobservable in the market, the determination of fair value requires more judgment. Accordingly, the degree of judgment exercised in determining fair value is greatest for instruments categorized in Level 3.
The inputs used to measure fair value may fall into different levels of the fair value hierarchy. In such cases, for disclosure purposes, the level in the fair value hierarchy within which the fair value measurement falls in its entirety, is determined based on the lowest level input that is significant to the fair value measurement in its entirety.
| Two Oaks Diversified Growth and Income Fund | |
| NOTES TO FINANCIAL STATEMENTS (Continued) | March 31, 2019 |
| | |
The inputs or methodology used for valuing securities are not necessarily an indication of the risk associated with investing in those securities. The following table summarizes the inputs used as of March 31, 2019 for the Fund’s assets measured at fair value:
| Assets* | | Level 1 | | | Level 2 | | | Level 3 | | | Total | |
| Common Stock | | $ | 14,880,854 | | | $ | — | | | $ | — | | | $ | 14,880,854 | |
| REITS | | | 5,854,589 | | | | — | | | | — | | | | 5,854,589 | |
| Corporate Bonds | | | — | | | | 4,727,657 | | | | — | | | | 4,727,657 | |
| Closed-End Fund | | | 517,000 | | | | — | | | | — | | | | 517,000 | |
| Short-Term Investments | | | 1,046,353 | | | | — | | | | — | | | | 1,046,353 | |
| Total | | $ | 22,298,796 | | | $ | 4,727,657 | | | $ | — | | | $ | 27,026,453 | |
The Fund did not hold any Level 3 securities during the year.
There were no transfers between Level 1 and Level 2 during the year presented. It is the Fund’s policy to record transfers into or out of all Levels at the end of the reporting period.
| * | Please refer to the Schedule of Investments for industry classifications. |
Security transactions and related income –Security transactions are accounted for on trade date. Interest income is recognized on an accrual basis. Discounts are accreted and premiums are amortized on securities purchased over the lives of the respective securities. Dividend income is recorded on the ex-dividend date. Realized gains or losses from sales of securities are determined by comparing the identified cost of the security lot sold with the net sales proceeds. Withholding taxes on foreign dividends have been provided for in accordance with the Fund’s understanding of the applicable country’s tax rules and rates.
Distributions received from investments in securities that represent a return of capital or capital gain are recorded as a reduction of cost of investment or as a realized gain, respectively. The calendar year-end amounts of ordinary income, capital gains, and return of capital included in distributions received from the Fund’s investments in real estate investment trusts (“REITS”) and master limited partnerships (“MLPS”) are reported to the Fund after the end of the calendar year; accordingly, the Fund estimates these amounts for accounting purposes until the characterization of REIT and MLP distributions is reported to the Fund after the end of the calendar year. Estimates are based on the most recent REIT and MLP distribution information available.
Dividends and distributions to shareholders –Dividends from net investment income, if any, are declared and paid quarterly. Distributable net realized capital gains, if any, are declared and distributed annually. Dividends from net investment income and distributions from net realized gains are determined in accordance with federal income tax regulations, which may differ from GAAP, and are recorded on the ex-dividend date. These “book/tax” differences are considered either temporary (e.g., deferred losses, capital loss carryforwards) or permanent in nature. To the extent these differences are permanent in nature, such amounts are reclassified within the composition of net assets based on their federal tax-basis treatment; temporary differences do not require reclassification. Any such reclassifications will have no effect on net assets, results of operations, or net asset values per share of the Fund.
Federal income tax –The Fund intends to continue to comply with the requirements of the Internal Revenue Code applicable to regulated investment companies and to distribute all of its taxable income to shareholders. Therefore, no provision for Federal income tax is required.
The Fund recognizes the tax benefits of uncertain tax positions only where the position is “more likely than not” to be sustained assuming examination by tax authorities. Management has analyzed the Fund’s tax positions and has concluded that no liability for unrecognized tax benefits should be recorded related to uncertain tax positions taken on returns filed for open tax years ended March 31, 2016 to March 31, 2018, or expected to be taken in the Fund’s March 31, 2019 year-end tax returns. The Fund identified its major tax jurisdictions as U.S. Federal, Nebraska state and foreign jurisdictions where the Fund makes significant investments; however, the Fund is not aware of any tax positions for which it is reasonably possible that the total amounts of unrecognized tax benefits will change materially in the next twelve months.
Foreign Currency –The accounting records of the Fund are maintained in U.S. dollars. Investment securities and other assets and liabilities denominated in a foreign currency, and income receipts and expense payments are translated into U.S. dollars using the prevailing exchange rate at the London market close. Purchases and sales of securities are translated into U.S. dollars at the contractual currency rates established at the approximate time of the trade. Net realized gains and losses on foreign currency transactions represent net gains and losses from currency realized between the trade and settlement dates on securities transactions and the difference between income accrued versus income received. The effects of changes in foreign currency exchange rates on investments in securities are included with the net realized and unrealized gain or loss on investment securities.
| Two Oaks Diversified Growth and Income Fund | |
| NOTES TO FINANCIAL STATEMENTS (Continued) | March 31, 2019 |
| | |
Expenses –Expenses of the Trust that are directly identifiable to a specific Fund are charged to that Fund. Expenses, which are not readily identifiable to a specific Fund, are allocated in such a manner as deemed equitable, taking into consideration the nature and type of expense and the relative sizes of the funds in the Trust.
Indemnification –The Trust indemnifies its officers and trustees for certain liabilities that may arise from the performance of their duties to the Trust. Additionally, in the normal course of business, the Fund enters into contracts that contain a variety of representations and warranties and which provide general indemnities. The Fund’s maximum exposure under these arrangements is unknown, as this would involve future claims that may be made against the Fund that have not yet occurred. However, based on experience, the risk of loss due to these warranties and indemnities appears to be remote.
| 3. | INVESTMENT ADVISORY AGREEMENT AND TRANSACTIONS WITH RELATED PARTIES |
Pursuant to the Investment Advisory Agreement (the “Advisory Agreement”), investment advisory services are provided to the Fund by Two Oaks Investment Management, LLC (the “Adviser”). Under the terms of the Advisory Agreement, the Adviser receives monthly fees calculated at an annual rate of 0.60% of the average daily net assets of the Fund. For the year ended March 31, 2019, the Adviser earned advisory fees of $165,481.
The Trust, on behalf of the Fund, has adopted the Trust’s Master Distribution and shareholder serving plan (the “Plan”) pursuant to Rule 12b-1 under the 1940 Act. The Plan provides that a monthly service and/or distribution fee is calculated by the Funds at an annual rate of 0.25% of the average daily net assets attributable to the Class A shares and is paid to Northern Lights Distributors, LLC (the “Distributor” or “NLD”) to provide compensation for ongoing distribution-related activities or services and/or maintenance of the Funds’ shareholder accounts, not otherwise required to be provided by the Adviser. The Plan is a compensation plan, which means that compensation is provided regardless of 12b-1 expenses incurred.
The Plan further provides for periodic payments to brokers, dealers and other financial intermediaries, for providing shareholder services and for promotional and other sales-related costs. For the year ended March 31, 2019, the Fund paid distribution fees of $68,951.
The Distributor acts as the Fund’s principal underwriter in a continuous public offering of the Funds’ shares. For the year ended March 31, 2019, the Distributor received $ 23,798 in underwriting commissions for sales of shares, of which $19,854 was paid to selling brokers and $3,944 was retained by the principal underwriter.
In addition, certain affiliates of the Distributor provide services to the Fund as follows:
Gemini Fund Services, LLC (“GFS”), an affiliate of the Distributor, provides administration, fund accounting, and transfer agent services to the Trust. Pursuant to separate servicing agreements with GFS, the Fund pays GFS customary fees for providing administration, fund accounting, and transfer agency services to the Fund. Certain officers of the Trust are also officers of GFS, and are not paid any fees directly by the Fund for serving in such capacities.
Northern Lights Compliance Services, LLC (“NLCS”) – NLCS, an affiliate of GFS and the Distributor, provides a Chief Compliance Officer to the Trust, as well as related compliance services, pursuant to a consulting agreement between NLCS and the Trust. Under the terms of such agreement, NLCS receives customary fees from the Fund.
Blu Giant, LLC (“Blu Giant”) – Blu Giant, an affiliate of GFS and the Distributor, provides EDGAR conversion and filing services as well as print management services for the Fund on an ad-hoc basis. For the provision of these services, Blu Giant receives customary fees from the Fund.
Effective February 1, 2019, NorthStar Financial Services Group, LLC, the parent company of GFS and its affiliated companies including NLD, NLCS and Blu Giant (collectively, the “Gemini Companies”), sold its interest in the Gemini Companies to a third party private equity firm that contemporaneously acquired Ultimus Fund Solutions, LLC (an independent mutual fund administration firm) and its affiliates (collectively, the “Ultimus Companies”). As a result of these separate transactions, the Gemini Companies and the Ultimus Companies are now indirectly owned through a common parent entity, The Ultimus Group, LLC.
| Two Oaks Diversified Growth and Income Fund | |
| NOTES TO FINANCIAL STATEMENTS (Continued) | March 31, 2019 |
| | |
| 4. | INVESTMENT TRANSACTIONS |
The cost of purchases and proceeds from the sale of securities, other than short-term securities, for the year ended March 31, 2019 amounted to $4,033,903 and $6,046,328, respectively.
| 5. | AGGREGATE UNREALIZED APPRECIATION AND DEPRECIATION – TAX BASIS |
The identified cost of investments in securities owned by the Fund for federal income tax purposes, and its respective gross unrealized appreciation and depreciation at March 31, 2019, were as follows:
| | | | | | | | | | Net Unrealized | |
| | | | Gross Unrealized | | | Gross Unrealized | | | Appreciation/ | |
| Tax Cost | | | Appreciation | | | (Depreciation) | | | (Depreciation) | |
| $ | 22,774,233 | | | $ | 5,272,378 | | | $ | (1,020,158 | ) | | $ | 4,252,220 | |
| | | | | | | | | | | | | | | |
| 6. | DISTRIBUTIONS TO SHAREHOLDERS AND TAX COMPONENTS OF CAPITAL |
The tax character of fund distributions paid for the years ended March 31, 2019 and March 31, 2018 was as follows:
| | | Fiscal Year Ended | | | Fiscal Year Ended | |
| | | March 31, 2019 | | | March 31, 2018 | |
| Ordinary Income | | $ | 340,858 | | | $ | 626,900 | |
| Long-Term Capital Gain | | | 1,192,775 | | | | 368,125 | |
| | | $ | 1,533,633 | | | $ | 995,025 | |
| | | | | | | | | |
As of March 31, 2019, the components of accumulated earnings/ (deficit) on a tax basis were as follows:
| Undistributed | | | Undistributed | | | Post October Loss | | | Capital Loss | | | Other | | | Unrealized | | | Total | |
| Ordinary | | | Long-Term | | | and | | | Carry | | | Book/Tax | | | Appreciation/ | | | Accumulated | |
| Income | | | Gains | | | Late Year Loss | | | Forwards | | | Differences | | | (Depreciation) | | | Earnings/(Deficits) | |
| $ | 5,543 | | | $ | 421,302 | | | $ | — | | | $ | — | | | $ | — | | | $ | 4,252,220 | | | $ | 4,679,065 | |
| | | | | | | | | | | | | | | | | | | | | | | | | | | |
The difference between book basis and tax basis unrealized appreciation and undistributed ordinary income is primarily attributable to tax adjustments for partnerships, and C-Corporation return of capital distributions.
| 7. | NEW ACCOUNTING PRONOUNCEMENTS |
In August 2018, the FASB issued Accounting Standards Update (“ASU”) No. 2018-13, which changes certain fair value measurement disclosure requirements. The new ASU, in addition to other modifications and additions, removes the requirement to disclose the amount and reasons for transfers between Level 1 and Level 2 of the fair value hierarchy, and the policy for the timing of transfers between levels. For investment companies, the amendments are effective for financial statements issued for fiscal years beginning after December 15, 2019, and interim periods within those fiscal years. Early adoption is allowed. At this time, management is evaluating the implications of the ASU and any impact on the financial statement disclosures.
In August 2018, the Securities and Exchange Commission adopted amendments to certain disclosure requirements under Regulation S-X to conform to US GAAP, including: (i) an amendment to require presentation of the total, rather than the components, of distributable earnings on the Statement of Assets and Liabilities; and (ii) an amendment to require presentation of the total, rather than the components, of distributions to shareholders, except for tax return of capital distributions, if any, on the Statement of Changes in Net Assets. The amendments also removed the requirement for parenthetical disclosure of undistributed net investment income on the Statement of Changes in Net Assets. These amendments have been adopted with these financial statements.
| Two Oaks Diversified Growth and Income Fund | |
| NOTES TO FINANCIAL STATEMENTS (Continued) | March 31, 2019 |
| | |
Subsequent events after the date of the Statement of Assets and Liabilities have been evaluated through the date the financial statements were issued. Management has determined that no events or transactions occurred requiring adjustment or disclosure in the financial statements.

REPORT OF INDEPENDENT REGISTERED PUBLIC ACCOUNTING FIRM
To the Shareholders of Two Oaks Diversified Growth and Income Fund and
Board of Trustees of Northern Lights Fund Trust II
Opinion on the Financial Statements
We have audited the accompanying statement of assets and liabilities, including the schedule of investments, of Two Oaks Diversified Growth and Income Fund (the “Fund”), a series of Northern Lights Fund Trust II, as of March 31, 2019, and the related statement of operations for the year then ended, the statements of changes in net assets for each of the two years in the period then ended, including the related notes, and the financial highlights for each of the five years in the period then ended (collectively referred to as the “financial statements”). In our opinion, the financial statements present fairly, in all material respects, the financial position of the Fund as of March 31, 2019, the results of its operations for the year then ended, the changes in its net assets for each of the two years in the period then ended, and the financial highlights for each of the five years in the period then ended, in conformity with accounting principles generally accepted in the United States of America.
Basis for Opinion
These financial statements are the responsibility of the Fund’s management. Our responsibility is to express an opinion on the Fund’s financial statements based on our audits. We are a public accounting firm registered with the Public Company Accounting Oversight Board (United States) (“PCAOB”) and are required to be independent with respect to the Fund in accordance with the U.S. federal securities laws and the applicable rules and regulations of the Securities and Exchange Commission and the PCAOB.
We conduct our audits in accordance with the standards of the PCAOB. Those standards require that we plan and perform the audit to obtain reasonable assurance about whether the financial statements are free of material misstatement, whether due to error or fraud.
Our audits include performing procedures to assess the risks of material misstatement of the financial statements, whether due to error or fraud, and performing procedures that respond to those risks. Such procedures include examining, on a test basis, evidence regarding the amounts and disclosures in the financial statements. Our procedures include confirmation of securities owned as of March 31, 2019, by correspondence with the custodian. Our audits also include evaluating the accounting principles used and significant estimates made by management, as well as evaluating the overall presentation of the financial statements. We believe that our audits provide a reasonable basis for our opinion.
We have served as the Fund’s auditor since 2004.
COHEN & COMPANY, LTD.
Cleveland, Ohio
May 23, 2019
COHEN & COMPANY, LTD.
800.229.1099|866.818.1538 fax| cohenepa.com
Registered with the Public Company Accounting Oversight Board
FACTORS CONSIDERED BY THE TRUSTEES WITH THE APPROVAL OF THE RENEWAL OF THE INVESTMENT ADVISORY AGREEMENT
At a Meeting (the “Meeting”) of the Board of Trustees (the “Board”) of Northern Lights Fund Trust II (the “Trust”) held on July 23 and 24, 2018, the Board, including the disinterested Trustees (the “Independent Trustees”), considered the renewal of an Investment Advisory Agreement between the Trust, on behalf of the Two Oaks Diversified Growth and Income Fund (“Two Oaks”), and Two Oaks Investment Management, LLC (“TOIM”) (“Two Oaks Advisory Agreement”).
Based on their evaluation of the information provided by TOIM, in conjunction with Two Oaks’ other service providers, the Board, by a unanimous vote (including a separate vote of the Independent Trustees), approved the renewal of the Two Oaks Advisory Agreement with respect to Two Oaks.
In advance of the Meeting, the Board requested and received materials to assist them in considering the Two Oaks Advisory Agreement. The materials provided contained information with respect to the factors enumerated below, including the Two Oaks Advisory Agreement, a memorandum prepared by the Independent Trustees legal counsel discussing in detail the Trustees’ fiduciary obligations and the factors they should assess in considering the renewal of the Two Oaks Advisory Agreement and comparative information relating to the advisory fee and other expenses of Two Oaks. The materials also included due diligence materials relating to TOIM (including due diligence questionnaire completed by TOIM, TOIM’s Forms ADV, select financial information of TOIM, bibliographic information regarding TOIM’s key management and investment advisory personnel, and comparative fee information relating to Two Oaks) and other pertinent information. At the Meeting, the Independent Trustees were advised by counsel that is experienced in Investment Company Act of 1940 matters and that is independent of fund management and met with such counsel separately from fund management.
The Board reviewed and discussed the written materials that were provided in advance of the Meeting and deliberated on the renewal of the Two Oaks Advisory Agreement. The Board relied upon the advice of independent legal counsel and their own business judgment in determining the material factors to be considered in evaluating the Two Oaks Advisory Agreement and the weight to be given to each such factor. The conclusions reached by the Board were based on a comprehensive evaluation of all of the information provided and were not the result of any one factor. Moreover, each Trustee may have afforded different weight to the various factors in reaching his conclusions with respect to the Two Oaks Advisory Agreement. In considering the renewal of the Two Oaks Advisory Agreement, the Board reviewed and analyzed various factors that they determined were relevant, including the factors enumerated below.
Nature, Extent and Quality of Services. The Board reviewed materials provided by TOIM related to the renewal of the Two Oaks Advisory Agreement, including TOIM’s ADV, a description of the manner in which investment decisions are made and executed and a review of the professional personnel performing services for Two Oaks, including the individuals that primarily monitor and execute the investment process. The Board discussed the extent of TOIM’s research capabilities, the quality of its compliance infrastructure and the experience of its Fund management personnel. Additionally, the Board received satisfactory responses from representatives of TOIM with respect to a series of important questions, including: whether TOIM was involved in any lawsuits or pending regulatory actions; whether TOIM’s management of other accounts would conflict with its management of Two Oaks; and whether TOIM has procedures in place to adequately allocate trades among its respective clients. The Board reviewed the description provided by TOIM of its practices for monitoring compliance with Two Oaks’ investment limitations, noting that TOIM’s CCO would continually review the portfolio managers’ performance of their duties to ensure compliance under TOIM’s compliance program. The Board also discussed TOIM’s compliance program with the CCO of the Trust. The Board noted that the CCO of the Trust continued to represent that TOIM’s policies and procedures were reasonably designed to prevent violations of applicable securities laws. The Board then reviewed the capitalization of TOIM based on representations made by TOIM and concluded that TOIM was sufficiently well-capitalized, or that its control persons had the ability to make additional contributions in order to meet its obligations to Two Oaks. The Board concluded that TOIM had sufficient quality and depth of personnel, resources, investment methods and compliance policies and procedures essential to performing its
duties under the Two Oaks Advisory Agreement and that the nature, overall quality and extent of the management services to be provided by TOIM to Two Oaks were satisfactory.
Performance.The Board discussed the reports prepared by Broadridge and reviewed the performance of the Fund as compared to its peer group, Morningstar category and benchmark for the one year, three year, five year, and since inception periods ended June 30, 2018. The Board noted that Two Oaks outperformed its peer group and Morningstar category for the one year and three year periods, underperformed its Morningstar category but outperformed its peer group for the five year period, underperformed its Morningstar category and peer group for the since inception period and underperformed its benchmark for all periods. In reviewing Two Oaks’ performance, the Board noted that the Fund’s primary benchmark was the S&P 500 Index while a blended index, 60% of which is based on the S&P 500 Index and 40% on the Barclays U.S. Aggregate Bond Index was used as a secondary benchmark. The Board discussed the benchmark with TOIM, noting that the S&P 500 Index is a broad based equity securities index while the Fund is a blend of equities, fixed income and real estate/asset-based securities. TOIM discussed with the Board the difficulty in finding an exact benchmark because the Fund’s allocation among asset classes vary. After considering other factors relating to TOIM’s and the portfolio managers’ track record, the Board concluded that the overall performance of Two Oaks under the management of TOIM was satisfactory.
Fees and Expenses. As to the costs of the services to be provided by TOIM, the Board reviewed and discussed the Two Oaks’ advisory fee and total operating expenses as compared to its peer group and Morningstar category as presented in the Broadridge Report noting that the 0.60% advisory fee is less than the Morningstar category and peer group average of 0.64% and 0.61%, respectively. The Board also noted that, although its net total annual operating expenses are the highest in its peer group, it was significantly lower than the highest such fee in its Morningstar category. After further discussion, the Board concluded that based on TOIM’s experience, expertise and services to Two Oaks, the advisory fee charged by TOIM was not unreasonable.
Profitability.The Board also considered the level of profits that could be expected to accrue to TOIM with respect to Two Oaks based on break even and profitability reports and analyses reviewed by the Board and the selected financial information provided by TOIM. After review and discussion, the Board concluded that, based on the services provided by TOIM and the projected growth of the Fund, anticipated profits from TOIM’s relationship with Two Oaks would not be excessive.
Economies of Scale. As to the extent to which Two Oaks will realize economies of scale as it grows, and whether the fee levels reflect these economies of scale for the benefit of investors, the Board discussed the current size of the Fund, TOIM’s expectations for growth of the Fund, and concluded that any material economies of scale would not be achieved in the near term.
Conclusion.The Board relied upon the advice of counsel, and their own business judgment in determining the material factors to be considered in evaluating the Two Oaks Advisory Agreement and the weight to be given to each such factor. Accordingly, having requested and received such information from TOIM as the Trustees believed to be reasonably necessary to evaluate the terms of the Two Oaks Advisory Agreement, and as assisted by the advice of independent counsel, the Board, including a majority of the Independent Trustees, unanimously concluded with respect to the Two Oaks Advisory Agreement, that (a) the terms of the Two Oaks Advisory Agreement are reasonable; (b) the advisory fee is reasonable; and (c) the Two Oaks Advisory Agreement is in the best interests of Two Oaks and its shareholders. In considering the renewal of the Two Oaks Advisory Agreement, the Trustees did not identify any one factor as all important, but rather considered these factors collectively and determined that approval of the renewal of the Two Oaks Advisory Agreement was in the best interests of Two Oaks and its shareholders. Moreover, the Board noted that each Trustee may have afforded different weight to the various factors in reaching his conclusions with respect to the Two Oaks Advisory Agreement.
| Two Oaks Diversified Growth and Income Fund | |
| FUND EXPENSES (Unaudited) | March 31, 2019 |
| | |
As a shareholder of the Fund you incur two types of costs: (1) transaction costs, including sales charges (loads) on purchase payments and contingent deferred sales charges on redemptions and (2) ongoing costs, including management fees; distribution and/or service (12b-1 fees) fees; and other Fund expenses. This Example is intended to help you understand your ongoing costs (in dollars) of investing in the Funds and to compare these costs with the ongoing costs of investing in other mutual funds.
This Example is based on an investment of $1,000 invested at the beginning of the period and held for the entire period as indicated below.
Actual Expenses: The first section of the table provides information about actual account values and actual expenses. You may use the information in this line, together with the amount you invested, to estimate the expenses that you paid over the period. Simply divide your account value by $1,000 (for example, an $8,600 account value divided by $1,000 = 8.6), then multiply the result by the number in the first line under the heading entitled “Expenses Paid During the Period” to estimate the expenses you paid on your account during the period.
Hypothetical Examples for Comparison Purposes: The second section of the table below provides information about hypothetical account values and hypothetical expenses based on the Fund’s actual expense ratio and an assumed rate of return of 5% per year before expenses, which is not the Fund’s actual return. The hypothetical account values and expenses may not be used to estimate the actual ending account balance or expenses you paid for the period. You may use this information to compare the ongoing costs of investing in the Funds and other funds. To do so, compare this 5% hypothetical example with the 5% hypothetical examples that appear in the shareholder reports of the other funds.
Please note that the expenses shown in the table are meant to highlight your ongoing costs only and do not reflect any transactional costs, such as sales charges (loads) or contingent deferred sales charges on redemptions. Therefore, the second line of the table is useful in comparing ongoing costs only, and will not help you determine the relative total costs of owning different funds. In addition, if these transactional costs were included, your costs would have been higher.
| | Beginning | | | Expenses Paid |
| | Account | | Expense | During the |
| | Value | Ending Account Value | Ratio | Period* |
| | (10/1/18) | (3/31/19) | (Annualized) | (10/1/18-3/31/19) |
| Actual: | | | | |
| Class A | $1,000.00 | $966.90 | 1.74% | $ 8.53 |
| Hypothetical (5% return | | | | |
| before expenses): | | | | |
| Class A | $1,000.00 | $1,016.26 | 1.74% | $ 8.75 |
| * | Expenses are equal to the Fund’s annualized expense ratio multiplied by the average account value over the period, multiplied by 182/365 (to reflect the one-half year period). |
| Two Oaks Diversified Growth and Income Fund |
| SUPPLEMENTAL INFORMATION (Unaudited) |
| March 31, 2019 |
| |
Trustees and Officers. The Trustees and the officers of the Trust are listed below with their addresses, present positions with the Trust and principal occupations over at least the last five years. Unless otherwise noted, the address of each Trustee and Officer is 17645 Wright Street, Suite 200, Omaha, NE 68130.
Independent Trustees *
Name and Year
of Birth | Position/Term of
Office* | Principal Occupation
During the Past Five Years | Number of
Portfolios in
Fund
Complex***
Overseen by
Trustee | Other Directorships
held by Trustee During
the Past Five Years |
Thomas T.
Sarkany
1946 | Trustee since October 2011 | President, TTS Consultants, LLC (financial services) (since 2010). | 1 | Director, Aquila Distributors; Trustee, Arrow ETF Trust; Trustee, Arrow Investments Trust; Trustee, Northern Lights Fund Trust IV |
Anthony H.
Lewis
1946 | Trustee Since May 2011 | Chairman and CEO of The Lewis Group USA (executive consulting firm) (since 2007). | 1 | Director, Member of the Compensation Committee and Member of the Risk Committee of Torotel Inc. (Magnetics, Aerospace and Defense), Trustee, Chairman of the Fair Valuation Committee and Member of the Audit Committee of the Wildermuth Endowment Strategy Fund |
Keith Rhoades
1948 | Trustee Since May 2011 | Retired since 2008. | 1 | NONE |
Randal D.
Skalla
1962 | Trustee since May 2011 | President, L5 Enterprises, Inc. (financial services company) (since 2001). | 1 | Board Member, Orizon Investment Counsel (financial services company) (from 2001 to 2017) |
3/31/19 – NLII v1
| Two Oaks Diversified Growth and Income Fund |
| SUPPLEMENTAL INFORMATION (Unaudited)(Continued) |
| March 31, 2019 |
Interested Trustees and Officers
Name and Year
of Birth | Position/Term of
Office* | Principal Occupation
During the Past Five Years | Number of
Portfolios in
Fund
Complex***
Overseen by
Trustee | Other Directorships held
by Trustee During the
Past Five Years |
Brian Nielsen**
1972 | Trustee Since May 2011 | Trustee (since 2011) of Northern Lights Fund Trust II; Special Projects Counsel of NorthStar Financial Services Group, LLC (from 2018 to 2019); General Counsel (from 2001 to 2014) and Secretary (from 2001 to 2018) of CLS Investments, LLC; General Counsel (from 2001 to 2014) and Secretary (from 2001 to 2018) of Orion Advisor Services, LLC; Manager (from 2012 to 2015), General Counsel and Secretary (from 2003 to p2018) of NorthStar Financial Services Group, LLC; CEO (from 2012 to 2018), General Counsel (from 2003 to 2014), Secretary (from 2003 to 2018) and Manager (from 2005 to 2018) of Northern Lights Distributors, LLC; Director, Secretary and General Counsel (from 2004 to 2018) of Constellation Trust Company; CEO (from 2015 to 2018), Manager (from 2008 to 2015), General Counsel and Secretary (from 2011 to 2018) of Northern Lights Compliance Services, LLC; General Counsel and Secretary (from 2011 to 2018) of Blu Giant, LLC; General Counsel (from 2012 to 2014) and Secretary (from 2012 to 2018) of Gemini Fund Services, LLC; Manager (from 2012 to 2018) of Arbor Point Advisors, LLC; General Counsel and Secretary (from 2013 to 2014) of Gemini Hedge Fund Services, LLC; General Counsel and Secretary (from 2013 to 2014) of Gemini Alternative Funds, LLC; Secretary and General Counsel of NorthStar Holdings, LLC (from 2013 to 2015); Director, Secretary and General Counsel of NorthStar CTC Holdings, Inc. (from 2015 to 2018) and Secretary and Chief Legal Officer (from 2003 to 2018) of AdvisorOne Funds. | 1 | Manager of Northern Lights Distributors, LLC (from 2005 to 2018); Manager of NorthStar Financial Services Group, LLC (from 2012 to 2015); Manager of Arbor Point Advisors, LLC (from 2012 to 2018); Director of Constellation Trust Company |
Kevin E. Wolf
80 Arkay Drive
Hauppauge, NY
11788
1969 | President Since January 2013 | Vice President of The Ultimus Group, LLC and Executive Vice President of Gemini Fund Services, LLC (since 2019), President, Gemini Fund Services, LLC (2012 - 2019). | N/A | N/A |
Richard
Malinowski
80 Arkay Drive.
Hauppauge,
NY 11788
1983 | Secretary since January 2018 | Senior Vice President Legal Administration, Gemini Fund Services, LLC (since April 2017); Vice President and Counsel (April 2016 to 2017) and AVP and Staff Attorney (September 2012 to March 2016). | N/A | N/A |
| | | | | |
Erik Naviloff
80 Arkay Drive
Hauppauge, NY
11788
1968 | Treasurer Since January 2013 | Vice President of Gemini Fund Services, LLC (since 2011). | N/A | N/A |
Emile R.
Molineaux
80 Arkay Drive
Hauppauge, NY
11788
1962 | Chief Compliance Officer and Anti Money Laundering Officer Since May 2011 | Senior Compliance Officer and CCO of Various clients of Northern Lights Compliance Services, LLC (since 2011). | N/A | N/A |
| | | | | |
| * | The term of office for each Trustee and Officer listed above will continue indefinitely. |
| ** | Brian Nielsen is an “interested person” of the Trust as that term is defined under the 1940 Act, because of his prior affiliation with Northern Lights Distributors, LLC (the Fund’s Distributor). |
| *** | As of March 31, 2019, the Trust was comprised of 22 active portfolios managed by unaffiliated investment advisers. The term “Fund Complex” applies only to the Fund. The Fund does not hold itself out as related to any other series within the Trust for investment purposes, nor does it share the same investment adviser with any other series. |
The Fund’s Statement of Additional Information (“SAI”) includes additional information about the Trustees and is available free of charge, upon request, by calling toll-free at 1-855-896-6257.
3/31/19 – NLII v1
Privacy Policy
Rev. May 2019
| FACTS | WHAT DOES NORTHERN LIGHTS FUND TRUST II (“NLFT II”) DO WITH YOUR PERSONAL INFORMATION? |
| Why? | Financial companies choose how they share your personal information. Federal law gives consumers the right to limit some but not all sharing. Federal law also requires us to tell you how we collect, share, and protect your personal information. Please read this notice carefully to understand what we do. |
| What? | The types of personal information we collect and share depend on the product or service you have with us. This information can include:
|
● Social Security number ● Employment information ● Account balances | ● Account transactions ● Income ● Investment experience |
When you are no longer our customer, we continue to share your information as described in this notice. |
| How? | All financial companies need to share a customer’s personal information to run their everyday business - to process transactions, maintain customer accounts, and report to credit bureaus. In the section below, we list the reasons financial companies can share their customer’s personal information; the reasons NLFT II chooses to share; and whether you can limit this sharing. |
| | |
| Reasons we can share your personal information | Does NLFT II
share? | Can you limit
this sharing? |
For our everyday business purposes —
such as to process your transactions, maintain your account(s), respond to court orders and legal investigations, or report to credit bureaus
| Yes | No |
For our marketing purposes —
to offer our products and services to you
| Yes | No |
For joint marketing with other financial companies
| Yes | No |
For our affiliates’ everyday business purposes —
information about your transactions and experiences
| Yes | No |
For our affiliates’ everyday business purposes —
information about your creditworthiness
| No | We don’t share |
For nonaffiliates to market to you
| No | We don’t share |
| Questions? | Call 1-402-493-4603 |
| Who we are |
| Who is providing this notice? | Northern Lights Fund Trust II |
| What we do |
| How does NLFT II protect my personal information? | To protect your personal information from unauthorized access and use, we use security measures that comply with federal law. These measures include computer safeguards and secured files and buildings.
|
| How does NLFT II collect my personal information? | We collect your personal information, for example, when you
|
● open an account ● give us your income information ● provide employment information | ● provide account information ● give us your contact information |
| We also collect your personal information from others, such as credit bureaus, affiliates, or other companies. |
| Why can’t I limit all sharing? | Federal law gives you the right to limit only ● sharing for affiliates’ everyday business purposes—information about your creditworthiness ● affiliates from using your information to market to you ● sharing for nonaffiliates to market to you State laws and individual companies may give you additional rights to limit sharing. |
| Definitions |
| Affiliates | Companies related by common ownership or control. They can be financial and nonfinancial companies. ● Northern Lights Fund Trust II has no affiliates. |
| Nonaffiliates | Companies not related by common ownership or control. They can be financial and nonfinancial companies. ● NLFT II does not share with nonaffiliates so they can market to you. |
| Joint marketing | A formal agreement between nonaffiliated financial companies that together market financial products and services to you. ● Our joint marketing partners include other financial service companies. |
| INVESTMENT ADVISOR |
| Two Oaks Investment Management, LLC |
| 7110 North Fresno Street, Suite 450 |
| Fresno, CA 93720 |
| |
| ADMINISTRATOR |
| Gemini Fund Services, LLC |
| 80 Arkay Drive |
| Hauppauge, NY 11788 |
| |
| |
| |
| |
How to Obtain Proxy Voting Information
Information regarding how the Fund votes proxies relating to portfolio securities for the 12 month period ended June 30th as well as a description of the policies and procedures that the Fund used to determine how to vote proxies is available without charge, upon request, by calling 1-855-896-6257 or by referring to the Securities and Exchange Commission’s (“SEC”) website athttp://www.sec.gov.
How to Obtain 1st and 3rd Fiscal Quarter Portfolio Holdings
The Fund files its complete schedule of portfolio holdings with the SEC for the first and third quarters of each fiscal year on Form N-Q.Form N-Q is available on the SEC’s website athttp://www.sec.gov and may be reviewed and copied at the SEC’s Public Reference Room in Washington, DC (1-800-SEC-0330).The information on Form N-Q is available without charge, upon request, by calling 1-855-896-6257.
For more complete information about the Two Oaks Diversified Growth and Income Fund, including charges and expenses, please call (855) 896-6257 and request a free prospectus. Read the prospectus carefully before you invest or send money. For more information about the Fund’s Board of Directors, please call or write to request the Fund’s Statement of Additional Information.

| |
| TWO OAKS DIVERSIFIED |
| GROWTH AND INCOME FUND |
| |
| |
| |
| |
Annual Report
March 31, 2019 |
Item 2. Code of Ethics.
(a) As of the end of the period covered by this report, the registrant has adopted a code of ethics that applies to the registrant's principal executive officer, principal financial officer, principal accounting officer or controller, or persons performing similar functions, regardless of whether these individuals are employed by the registrant or a third party.
(b) For purposes of this item, “code of ethics” means written standards that are reasonably designed to deter wrongdoing and to promote:
| (1) | Honest and ethical conduct, including the ethical handling of actual or apparent conflicts of interest between personal and professional relationships; |
| (2) | Full, fair, accurate, timely, and understandable disclosure in reports and documents that a registrant files with, or submits to, the Commission and in other public communications made by the registrant; |
(3) Compliance with applicable governmental laws, rules, and regulations;
| (4) | The prompt internal reporting of violations of the code to an appropriate person or persons identified in the code; and |
(5) Accountability for adherence to the code.
(c) Amendments: During the period covered by the report, there have not been any amendments to the provisions of the code of ethics.
(d) Waivers: During the period covered by the report, the registrant has not granted any express or implicit waivers from the provisions of the code of ethics.
(e) The Code of Ethics is not posted on Registrant’ website.
(f) A copy of the Code of Ethics is attached as an exhibit.
Item 3. Audit Committee Financial Expert.
(a) The Registrant’s board of trustees has determined that Keith Rhoades is an audit committee financial expert, as defined in Item 3 of Form N-CSR. Mr. Rhoades is independent for purposes of this Item.
Item 4. Principal Accountant Fees and Services.
2019 - $14,500
2018 - $14,000
2019 – None
2018 – None
2019 – $3,000
2018 – $3,000
Preparation of Federal & State income tax returns, assistance with calculation of required income, capital gain and excise distributions and preparation of Federal excise tax returns.
2019 – None
2018 – None
| (e) | (1)Audit Committee’s Pre-Approval Policies |
The registrant’s Audit Committee is required to pre-approve all audit services and, when appropriate, any non-audit services (including audit-related, tax and all other services) to the registrant. The registrant’s Audit Committee also is required to pre-approve, when appropriate, any non-audit services (including audit-related, tax and all other services) to its adviser, or any entity controlling, controlled by or under common control with the adviser that provides ongoing services to the registrant, to the extent that the services may be determined to have an impact on the operations or financial reporting of the registrant. Services are reviewed on an engagement by engagement basis by the Audit Committee.
| (2) | Percentages of Services Approved by the Audit Committee |
| | 2019 | 2018 |
| Audit-Related Fees: | 0.00% | 0.00% |
| Tax Fees: | 0.00% | 0.00% |
| All Other Fees: | 0.00% | 0.00% |
| (f) | During the audit of registrant's financial statements for the most recent fiscal year, less than 50 percent of the hours expended on the principal accountant's engagement were attributed to work performed by persons other than the principal accountant's full-time, permanent employees. |
| (g) | The aggregate non-audit fees billed by the registrant's accountant for services rendered to the registrant, and rendered to the registrant's investment adviser (not including any sub-adviser whose role is primarily portfolio management and is subcontracted with or overseen by another investment adviser), and any entity controlling, controlled by, or under common control with the adviser that provides ongoing services to the registrant: |
2019 – $3,000
2018 – $3,000
(h) The registrant's audit committee has considered whether the provision of non-audit services to the registrant's investment adviser (not including any sub-adviser whose role is primarily portfolio management and is subcontracted with or overseen by another investment adviser), and any entity controlling, controlled by, or under common control with the investment adviser that provides ongoing services to the registrant, that were not pre-approved pursuant to paragraph (c)(7)(ii) of Rule 2-01 of Regulation S-X, is compatible with maintaining the principal accountant's independence.
Item 5. Audit Committee of Listed Companies.Not applicable to open-end investment companies.
Item 6. Schedule of Investments.Schedule of investments in securities of unaffiliated issuers is included under Item 1.
Item 7. Disclosure of Proxy Voting Policies and Procedures for Closed-End Funds. Not applicable to open-end investment companies.
Item 8. Portfolio Managers of Closed-End Management Investment Companies. Not applicable to open-end investment companies.
Item 9. Purchases of Equity Securities by Closed-End Funds. Not applicable to open-end investment companies.
Item 10. Submission of Matters to a Vote of Security Holders. None
Item 11. Controls and Procedures.
(a) Based on an evaluation of the Registrant’s disclosure controls and procedures as of a date within 90 days of filing date of this Form N-CSR, the principal executive officer and principal financial officer of the Registrant have concluded that the disclosure controls and procedures of the Registrant are reasonably designed to ensure that the information required in filings on Form N-CSR is recorded, processed, summarized, and reported by the filing date, including that information required to be disclosed is accumulated and communicated to the Registrant’s management, including the Registrant’s principal executive officer and principal financial officer, as appropriate to allow timely decisions regarding required disclosure.
(b) There were no significant changes in the Registrant’s internal control over financial reporting that occurred during the Registrant’s last fiscal half-year that have materially affected, or are reasonably likely to materially affect, the Registrant’s internal control over financial reporting.
Item 12. Disclosure of Securities Lending Activities for Closed-End Management Investment Companies.Not applicable.
Item 13. Exhibits.
(a)(1) Code of Ethics filed herewith.
(a)(2) Certifications required by Section 302 of the Sarbanes-Oxley Act of 2002 (and Item 11(a)(2) of Form N-CSR) are filed herewith.
(a)(3) Not applicable for open-end investment companies.
(b) Certifications required by Section 906 of the Sarbanes-Oxley Act of 2002 (and Item 11(b) of Form N-CSR) are filed herewith.
SIGNATURES
Pursuant to the requirements of the Securities Exchange Act of 1934 and the Investment Company Act of 1940, the registrant has duly caused this report to be signed on its behalf by the undersigned, thereunto duly authorized.
(Registrant)Northern Lights Fund Trust II
By (Signature and Title)
/s/ Kevin E. Wolf
Kevin E. Wolf, Principal Executive Officer/President
Date 6/6/19
Pursuant to the requirements of the Securities Exchange Act of 1934 and the Investment Company Act of 1940, this report has been signed below by the following persons on behalf of the registrant and in the capacities and on the dates indicated.
By (Signature and Title)
/s/ Kevin E. Wolf
Kevin E. Wolf, Principal Executive Officer/President
Date 6/6/19
By (Signature and Title)
/s/ Erik Naviloff
Erik Naviloff, Principal Financial Officer/Treasurer
Date 6/6/19