united states
securities and exchange commission
washington, d.c. 20549
form n-csr
certified shareholder report of registered management
investment companies
Investment Company Act file number 811-22549
Northern Lights Fund Trust II
(Exact name of registrant as specified in charter)
225 Pictoria Drive, Suite 450 Cincinnati, OH 45246
(Address of principal executive offices) (Zip code)
Kevin Wolf, Gemini Fund Services, LLC.
4221 N 203rd St., Suite 100, Elkhorn, NE 68022-3474
(Name and address of agent for service)
Registrant's telephone number, including area code: 631-470-2619
Date of fiscal year end: 11/30
Date of reporting period:11/30/19
Item 1. Reports to Stockholders.
| |
| |
| |
 |
| |
| |
| |
| |
| |
| |
| |
| |
| |
| FormulaFolios US Equity Fund |
| Annual Report |
| November 30, 2019 |
| |
| |
| |
| |
| |
| |
| |
| |
| |
| |
| |
| |
| |
| |
| |
| |
| 1-855-907-3233 |
| www.formulafoliofunds.com |
| |
| |
| Distributed by Northern Lights Distributors, LLC |
| Member FINRA |
| |
| |
| |
| |
| |
| |
| |
Beginning on January 1, 2021, as permitted by regulations adopted by the Securities and Exchange Commission, paper copies of the Fund’s shareholder reports like this one will no longer be sent by mail, unless you specifically request paper copies of the reports. Instead, the reports will be made available on the Fund’s website www.formulafoliofunds.com, and you will be notified by mail each time a report is posted and provided with a website link to access the report.
If you already elected to receive shareholder reports electronically, you will not be affected by this change and you need not take any action. You may elect to receive shareholder reports and other communications from the Fund electronically or to continue receiving paper copies of shareholder reports, which are available free of charge by contacting your financial intermediary (such as a broker-dealer or bank) or, if you are a direct investor, by following the instructions included with paper Fund documents that have been mailed to you.
FormulaFolio Investments (FormulaFolios) is a Registered Investment Advisor that offers a distinct approach compared to traditional asset management. FormulaFolios uses emotion-free, statistically significant quantitative algorithms to aid in the investment decision making process. Unlike many quantitative investment firms; however, FormulaFolios focuses on longer-term market trends and lower Fund turnover rather than using a high-frequency trading approach. With the ever-changing investment landscape, it is more important than ever to prepare for and adapt to new economic regimes. This is why FormulaFolios focuses time and talents on developing smarter investment formulas. By removing investing prejudices with an algorithmic based approach, FormulaFolios believes investors can substantially increase the statistical probability of successful investment outcomes over time.
Dear FormulaFolios US Equity Fund Shareholder,
The fiscal year ending November 30, 2019 was a prime reminder of just how uncertain markets can be in the short-run.
Following a volatile fiscal-year 2018, US stocks continued to plummet in December. By December 24, 2018, the S&P 500 had dropped almost 20% from its recent high levels set just a few months earlier. Despite a sharp rally to end the month, the S&P 500 booked its worst month of December since the Great Depression.
However, the rally continued through 2019, and major US stock indices closed the fiscal year in positive territory, with large-cap stocks outperforming small-cap stocks.
Helping lead the gains was a strong labor market, continued economic expansion, and an easing monetary policy from the Fed.
The unemployment rate fell to 3.5% - its lowest level since 1969, and wage growth finally started to firm-up. The Fed cut interest rates three times, which stoked optimism for further expansion.
Though broad markets were able to shake off a tough start to the year, it is important to remember the future is largely independent of the past - nobody knows exactly what the future holds. This is why it is so imperative to stay committed to a smart investment strategy over the course of many years.
The following pages of this annual report include information about your Fund, as well as a discussion regarding the global economic environment during the fiscal year ended November 30, 2019 and how recent prevailing economic factors affected Fund performance.
Please remember all securities markets fluctuate, as do Fund prices. Though it is impossible to eliminate all market risk, we believe active investment management can help mitigate the downside risk of investing.
Sincerely,

Jason Wenk
Founder
FormulaFolio Investments
This letter reflects FormulaFolio Investments analysis and opinions as of November 30, 2019. The information is not a complete analysis of every aspect of any market, country, industry, security or Fund.
Global Economic Year In Review
The fiscal year ending November 30, 2019 started on a severely negative note for US stock markets as the volatility experienced in 2018 continued into the new year.
Through December 24, the S&P 500 Index had dropped 14.82% as the Index experienced losses in 11 of its first 15 trading days of the new fiscal year. By the end of the month, it was the worst December for the S&P 500 since the Great Depression.
However, starting December 26, markets began to rally and never looked back. By April, 2019, the S&P 500 had reached a fresh all-time-high, and continued to reach multiple new highs through the end of the year.
Helping boost markets higher were strong labor markets and an easy monetary policy, as the Fed cut rates three times following a sequence of rate increases in the prior year.
While US stocks as a whole trended higher, larger companies outperformed smaller companies. When all was said and done, major US stock indices were positive for the fiscal year with the S&P 500 Index gaining 16.11% and the Russell 2000 Index gaining 7.51%.
Similar to their US counterpart, international stocks started the year in negative territory, but managed to finish the year with positive returns.
However, the consistent theme of international stocks underperforming the US in recent years continued as gains were more muted overseas. Hurting international stocks more specifically was ongoing trade tensions between the US and other major global economies, as tariffs were expected to have more of a negative impact internationally. Furthermore, uncertainty surrounding Brexit added to global geopolitical uncertainties.
The total return for the MSCI EAFE Index was - 12.44% while the total return for the MSCI Emerging Markets Index was 7.28% by fiscal year-end.
Other asset classes such as commodities and bonds experienced positive returns for the year as well.
Despite falling over 16% through December 24, oil prices closed the year positive, gaining 8.33%. Oil prices firmed after a slow start to the year as global economic growth remained mostly positive, despite slowing in general.
Gold prices were positive as investors looked to safe-haven asset classes early in the year, and continued to use the asset class as a hedge against any further potential uncertainties. Also helped by falling interest rates and a relatively stable dollar, the metal closed the year up 17.21%.
Even the Bloomberg Barclays Aggregate US Bond Index closed the year positive, gaining 10.79%, as falling interest rates created a tailwind for the asset class. Contributing to this pressure was three rate cuts by the Fed.
As a whole, it was a relatively positive year for global investment markets.
Fund Performance Summary
For the fiscal year ended November 30, 2019, Institutional Class shares of the FormulaFolios US Equity Fund underperformed its primary benchmark on a total return basis.
The Fund had a cumulative total return of 2.16% for the 12 months ended November 30, 2019. In comparison, the Fund’s primary benchmark, the Russell 3000, which is a broad measure of total US stock market performance, posted a 15.49% cumulative total return.
Some of this underperformance relative to the benchmark can be attributed to the style of
equities held inside the Fund throughout the year. While the Fund can invest its assets in the securities of large capitalization companies, the Fund may also invest in equity securities of small and mid-cap companies.
While the Russell 3000 Index measures the performance of the 3,000 largest publicly traded US companies, the Index is market capitalization weighted, so larger companies account for a greater portion of total performance than smaller companies. The Index also holds a blend of both value and growth-oriented stocks (as oppose to skewing more toward either growth or value companies).
During the most recent fiscal year, the Fund had a higher weight to mid-cap and small-cap companies than the Russell 3000 Index. These smaller sized companies did not perform as well as large-cap stocks during the year. The large-cap S&P 500 Index experienced a 16.11% return for the year while the small-cap Russell 2000 Index experienced a smaller 7.51% return.
Furthermore, the Fund maintained a value bias for its holdings (as oppose to a more growth or blended oriented weighting). During the most recent fiscal year, growth stocks outperformed value stocks as a whole. The Russell 3000 Growth Index experienced a 20.28% return for the year while the Russell 3000 Value Index experienced a smaller 10.81% return.
Relative to the Morningstar mid-cap value category, the current Morningstar category for the Fund based on its most recent underlying holdings, the Fund experienced a more comparable total return of 2.16% compared to 8.48% for the category.
Based on the prevailing market conditions throughout the year, the Fund determined smaller value-oriented companies were more attractive going forward than larger growth-oriented companies which may be
overextended from the ongoing bull market that started in 2009.
Performance data represent past performance, which does not guarantee future results. Investment return and principal value will fluctuate, and you may have a gain or loss when you sell your shares. Current performance may differ from figures shown.
Investment Strategy
At FormulaFolio Investments, we are committed to our methods of asset management with the goal of achieving above-average risk adjusted returns over a long time horizon. We believe by using emotion-free, statistically significant quantitative algorithms to aid in the investment decision making process and help avoid typical investing biases, we can achieve this goal. When selecting investments for the Fund, our models utilize a proprietary three factor model to select up to 50 stocks from the Russell 3000 Index. The three factors are fundamental, technical, and macro-economic. These factors aim to ensure the Fund selects only the most fundamentally sounds companies, only selects companies with positive interest in the markets, and only invests assets when the broad US stock market appears to be favorable for investing.
The Fund does not have targeted industry exposure, but is mindful of industry weightings. The Fund will typically hold 40-50 individual US equities, though the number may vary. Due to the diversity in how markets are measured and how holdings are selected, the Fund has built-in defensive measures that allow it to take defensive positions, including cash, to limit catastrophic losses and preserve capital during poor market conditions, while still seeking long-term participation in equity bull markets. For example, during adverse market, economic, political, or other prevailing conditions, the Fund may invest up to 100% of assets in cash or cash equivalent investments.
Maintaining the ability to seek defensive positions is consistent with the overarching philosophy of FormulaFolio Investments, though it may cause the Fund to temporarily deviate from the objective of holding 40-50 individual US equities. By taking defensive positions, volatility and drawdowns may be minimized while giving the Fund the potential to achieve desirable returns during favorable investment environments.
How Market Conditions Affected Fund
The average capitalization and style of the individual equities held were the largest contributors to Fund performance relative to the benchmark.
Throughout the year, the Fund maintained a higher weight toward smaller companies, with a value bias compared to the Russell 3000 Index benchmark. This skewed returns as larger companies and growth oriented companies outperformed smaller companies and value oriented companies.
While large-cap US stocks indices experienced strong gains (the S&P 500 Index gained 16.11%) last year, small-cap stocks as measured by the Russell 2000 gained only 7.51%.
Similarly, the Russell 3000 Growth Index returned 20.28% for the year while the Russell 3000 Value Index only achieved a total return of 10.81%.
Though many factors affected the Fund and resulted in a smaller company value orientation, relative company valuations and heightened geopolitical risks seemed to be the most prominent.
Broad US Earnings Per Share (EPS) was uninspiring throughout the year and many companies were still “expensive” relative to historical valuation levels. At the end of the year, the S&P 500 Forward Price-to-Earnings level was 17.6; higher than the trailing 10-year
average of 14.9. These inflated levels indicate the market may have been slightly overvalued and would need to see earnings increase, stock prices decrease, or a combination of both to fall back to the trailing averages.
Typically, value stocks are a safer place than growth stocks when markets appear overpriced or when volatility is heightened. However, this value posture resulted in a drag in total returns for the year.
A Look Ahead for Next Year
The Fund is approximately 90% invested in US equities as of the end of the fiscal year ended November 30, 2019, inline with the 80% or higher objective of the Fund.
Despite a relatively strong economy, the Fund has taken a slight defensive position to hedge against heightened valuation levels and geopolitical uncertainties.
Though the economy is likely in the late stages of its expansion, most experts are pointing at a modest level of continued growth.
Furthermore, the Fed has paused rates going into 2020, which could help support continued economic and market growth as interest rates remain relatively low.
Considering the mostly healthy underlying fundamental data and potential for a conclusion of the ongoing trade tension risks, the Fund model remains cautiously optimistic going into Fiscal Year 2020.
It is important to be mindful that markets are always unknown and conditions can change without notice, but under current conditions, we believe equities have the potential for further gains over the next year.
Thank you for your continued investment in the FormulaFolios US Equity Fund. As always, we are committed to working to achieve the most
desirable risk adjusted returns over a full market cycle to continue bringing you value as a shareholder.
The views and opinions expressed within this letter are those of ForumulaFolio Investments. These views and opinions are subject to change at any time based on changes in the economy and financial markets. These views and opinions do not constitute investment advice or recommendations and investors should not act on the information discussed within this letter. The information provided is not a complete analysis of every market, country, industry, security, or the Fund. Statements of fact are from sources considered reliable, but FormulaFolio Investments makes no representation or warranty as to their completeness or accuracy. Although historical performance is no guarantee of future results, these insights may help you understand our investment management philosophy.
The referenced indices are shown for general market comparisons and are not meant to represent the Fund. Investors cannot directly invest in an index; unmanaged index returns do not reflect any fees, expenses or sales charges.
S&P 500 Index- The S&P 500 is a market capitalization weighted equity index and seeks to act as a benchmark for large-cap US stocks. This index measures the performance of 500 large publicly traded US stocks.
MSCI EAFE Index- The MSCI EAFE Index is designed to represent the performance of large and mid-cap securities across 21 developed markets, including countries in Europe, Australasia and the Far East, excluding the U.S. and Canada. The Index is available for a number of regions, market segments/sizes and covers approximately 85% of the free float-adjusted market capitalization in each of the 21 countries.
MSCI Emerging Markets Index- The MSCI Emerging Markets Index captures large and mid-cap representation across 24 Emerging Markets countries (such as Brazil, China, and India). With 846 constituents, the index covers approximately 85% of the free float-adjusted market capitalization in each country
Russell 2000 Index- The Russell 2000 is a market capitalization weighted equity index and seeks to act as a benchmark for small-cap US stocks. This index measures the performance of the 2000 smallest publicly traded US stocks within the larger Russell 3000 Index (the Russell 3000 seeks to benchmark the entire US stock market)
S&P 500 Forward Price-to-Earnings Level- The S&P 500 forward price-to-earnings ratio (forward P/E) is a valuation method used to compare the Index’s current price to its expected combined per-share earnings for the next 12 months.
5086-NLD-1/15/2020
FORMULAFOLIOS US EQUITY FUND |
| PORTFOLIO REVIEW (Unaudited) |
| November 30, 2019 |
| |
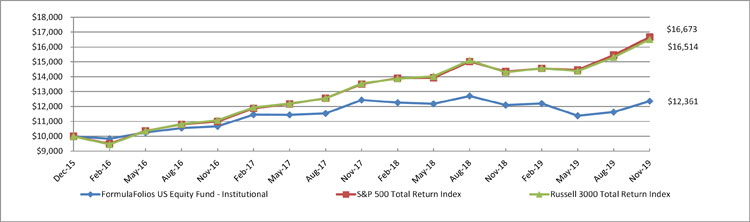
The Fund’s performance figures* for the periods ended November 30, 2019, as compared to its benchmarks:
| | | Annualized | Annualized |
| | One Year | Three Year | Since Inception (1) |
| FormulaFolios US Equity Fund - Institutional Class | 2.16% | 5.02% | 5.50% |
| FormulaFolios US Equity Fund - Investor Class | 1.08% | 3.91% | 4.50% |
| S&P 500 Total Return Index (2) | 16.11% | 14.88% | 13.79% |
| Russell 3000 Total Return Index (3) | 15.49% | 14.22% | 13.52% |
| | | | |
Comparison of the Change in Value of a $10,000 Investment
| * | The Performance data quoted is historical. Past performance is no guarantee of future results. Current performance may be higher or lower than the performance data quoted. The principal value and investment return of an investment will fluctuate so that your shares, when redeemed, may be worth more or less than their original cost. The returns shown do not reflect the deduction of taxes that a shareholder would pay on Fund distributions or on the redemptions of Fund shares. The total operating expenses as stated in the fee table to the Fund’s Prospectus dated April 1, 2019 are 1.19% and 2.19% for the Institutional Class and Investor Class, respectively. After fee waivers, the Fund’s total annual operating expenses are 1.15% and 2.15% for the Institutional Class and Investor Class, respectively. For performance information current to the most recent month-end, please call 1-855-907-3233. |
| (1) | Inception date was December 17, 2015. |
| (2) | The S&P 500 Total Return Index is an unmanaged market capitalization weighted index of 500 of the largest capitalized U.S. domiciled companies. Index returns assume reinvestment of dividends. Investors may not invest in the indexes directly; unlike the Fund’s returns, the indexes do not reflect any fees or expenses. |
| (3) | The Russell 3000 Total Return Index measures the performance of the largest 3,000 U.S. companies determined by total market capitalization. Investors may not invest directly; unlike the Fund’s returns, the indexes do not reflect any fees or expenses. |
| Top Ten Holdings By Industry Sector | | % of Net Assets | |
| Healthcare-Products | | | 12.9 | % |
| Healthcare-Services | | | 8.2 | % |
| Electronics | | | 7.4 | % |
| Insurance | | | 7.0 | % |
| Pharmaceuticals | | | 6.5 | % |
| Biotechnology | | | 5.2 | % |
| Aerospace/Defense | | | 4.7 | % |
| Semiconductors | | | 3.3 | % |
| Airlines | | | 3.3 | % |
| Beverages | | | 3.2 | % |
| Other Assets in excess of Liabilities | | | 38.3 | % |
| | | | 100.0 | % |
| | | | | |
Please refer to the Portfolio of Investments in this annual report for a detailed analysis of the Fund’s holdings.
| FORMULAFOLIOS US EQUITY FUND |
| PORTFOLIO OF INVESTMENTS |
| November 30, 2019 |
| Shares | | | | | Fair Value | |
| | | | | COMMON STOCK - 89.2% | | | | |
| | | | | ADVERTISING - 1.6% | | | | |
| | 60,948 | | | Omnicom Group, Inc. | | $ | 4,844,147 | |
| | | | | | | | | |
| | | | | AEROSPACE/DEFENSE - 4.7% | | | | |
| | 26,183 | | | General Dynamics Corp. | | | 4,758,498 | |
| | 13,307 | | | Lockheed Martin Corp. | | | 5,203,436 | |
| | 13,662 | | | Northrop Grumman Corp. | | | 4,805,882 | |
| | | | | | | | 14,767,816 | |
| | | | | AIRLINES - 3.3% | | | | |
| | 75,664 | | | Alaska Air Group, Inc. | | | 5,221,573 | |
| | 88,434 | | | Southwest Airlines Co. | | | 5,097,336 | |
| | | | | | | | 10,318,909 | |
| | | | | BEVERAGES - 3.2% | | | | |
| | 166,995 | | | Monster Beverage Corp.* | | | 9,989,641 | |
| | | | | | | | | |
| | | | | BIOTECHNOLOGY - 5.2% | | | | |
| | 21,432 | | | Amgen, Inc. | | | 5,030,519 | |
| | 34,394 | | | Illumina, Inc.* | | | 11,032,219 | |
| | | | | | | | 16,062,738 | |
| | | | | BUILDING MATERIALS - 1.8% | | | | |
| | 86,084 | | | Fortune Brands Home & Security, Inc. | | | 5,445,674 | |
| | | | | | | | | |
| | | | | COMMERCIAL SERVICES - 3.2% | | | | |
| | 71,578 | | | Booz Allen Hamilton Holding Corp. | | | 5,208,015 | |
| | 61,084 | | | Insperity, Inc. | | | 4,750,503 | |
| | | | | | | | 9,958,518 | |
| | | | | COMPUTERS - 1.6% | | | | |
| | 19,079 | | | Apple, Inc. | | | 5,098,863 | |
| | | | | | | | | |
| | | | | DIVERSIFIED FINANCIAL SERVICES - 1.4% | | | | |
| | 57,295 | | | Evercore, Inc. | | | 4,433,487 | |
| | | | | | | | | |
| | | | | ELECTRIC - 1.6% | | | | |
| | 77,888 | | | Evergy, Inc. | | | 4,927,974 | |
| | | | | | | | | |
| | | | | ELECTRONICS - 7.4% | | | | |
| | 138,971 | | | Agilent Technologies, Inc. | | | 11,224,688 | |
| | 45,280 | | | Allegion PLC | | | 5,434,958 | |
| | 227,966 | | | Gentex Corp. | | | 6,474,234 | |
| | | | | | | | 23,133,880 | |
| | | | | HEALTHCARE-PRODUCTS - 12.9% | | | | |
| | 128,292 | | | Baxter International, Inc. | | | 10,516,095 | |
| | 29,119 | | | Cooper Cos, Inc. | | | 9,116,868 | |
| | 38,292 | | | IDEXX Laboratories, Inc.* | | | 9,633,501 | |
| | 53,153 | | | Stryker Corp. | | | 10,888,924 | |
| | | | | | | | 40,155,388 | |
| | | | | HEALTHCARE-SERVICES - 8.2% | | | | |
| | 18,127 | | | Anthem, Inc. | | | 5,232,540 | |
| | 74,491 | | | Centene Corp.* | | | 4,504,471 | |
| | 19,458 | | | UnitedHealth Group, Inc. | | | 5,445,710 | |
| | 74,694 | | | Universal Health Services, Inc. | | | 10,419,066 | |
| | | | | | | | 25,601,787 | |
| | | | | HOME BUILDERS - 1.8% | | | | |
| | 134,735 | | | PulteGroup, Inc. | | | 5,342,243 | |
| | 4,632 | | | Thor Industries, Inc. | | | 295,383 | |
| | | | | | | | 5,637,626 | |
| | | | | HOME FURNISHINGS - 3.1% | | | | |
| | 70,332 | | | Dolby Laboratories, Inc. | | | 4,844,468 | |
| | 33,461 | | | Whirlpool Corp. | | | 4,788,269 | |
| | | | | | | | 9,632,737 | |
| | | | | INSURANCE - 7.0% | | | | |
| | 89,168 | | | Aflac, Inc. | | | 4,889,973 | |
| | 49,584 | | | American Financial Group, Inc. | | | 5,439,861 | |
| | 103,948 | | | First American Financial Corp. | | | 6,613,172 | |
| | 65,625 | | | Progressive, Corp. | | | 4,793,906 | |
| | | | | | | | 21,736,912 | |
| | | | | IRON/STEEL - 1.6% | | | | |
| | 42,317 | | | Reliance Steel & Aluminum Co. | | | 4,992,560 | |
| | | | | | | | | |
| | | | | MACHINERY-CONSTRUCTION & MINING - 1.6% | | | | |
| | 53,191 | | | Oshkosh Corp. | | | 4,811,658 | |
| | | | | | | | | |
| | | | | MISCELLANEOUS MANUFACTURING - 1.5% | | | | |
| | 29,611 | | | Carlisle Cos, Inc. | | | 4,618,724 | |
| | | | | | | | | |
| | | | | OIL & GAS - 1.7% | | | | |
| | 45,928 | | | Phillips 66 | | | 5,268,860 | |
| | | | | | | | | |
| | | | | PHARMACEUTICALS - 6.5% | | | | |
| | 68,939 | | | Johnson & Johnson | | | 9,478,423 | |
| | 89,927 | | | Zoetis, Inc. | | | 10,838,002 | |
| | | | | | | | 20,316,425 | |
| | | | | RETAIL - 1.8% | | | | |
| | 67,606 | | | Best Buy Co., Inc. | | | 5,451,748 | |
| | | | | | | | | |
See accompanying notes to financial statements.
| FORMULAFOLIOS US EQUITY FUND |
| PORTFOLIO OF INVESTMENTS (Continued) |
| November 30, 2019 |
| Shares | | | | | Fair Value | |
| | | | | COMMON STOCK - 89.2% (Continued) | | | | |
| | | | | SEMICONDUCTORS - 3.3% | | | | |
| | 100,469 | | | Intel Corp. | | $ | 5,832,225 | |
| | 17,134 | | | Lam Research Corp. | | | 4,571,865 | |
| | | | | | | | 10,404,090 | |
| | | | | SHIPBUILDING - 1.6% | | | | |
| | 19,309 | | | Huntington Ingalls Industries, Inc. | | | 4,859,496 | |
| | | | | | | | | |
| | | | | TRANSPORTATION - 1.6% | | | | |
| | 68,449 | | | Expeditors International of Washington, Inc. | | | 5,117,247 | |
| | | | | | | | | |
| | | | | TOTAL COMMON STOCK (Cost - $266,574,288) | | | 277,586,905 | |
| | | | | | | | | |
| | | | | SHORT-TERM INVESTMENT - 10.6% | | | | |
| | | | | MONEY MARKET FUND - 10.6% | | | | |
| | 33,100,924 | | | Fidelity Investments Money Market Funds - Government Portfolio, Institutional Class, 1.53% ** | | | 33,100,924 | |
| | | | | TOTAL SHORT-TERM INVESTMENT (Cost - $33,100,924) | | | | |
| | | | | | | | | |
| | | | | TOTAL INVESTMENTS - 99.8% (Cost - $299,675,212) | | $ | 310,687,829 | |
| | | | | ASSETS IN EXCESS OF LIABILITIES - 0.2% | | | 528,347 | |
| | | | | NET ASSETS - 100.0% | | $ | 311,216,176 | |
| | | | | | | | | |
PLC - Public Limited Company
| * | Non-Income producing security |
| ** | Interest rate reflects seven-day effective yield on November 30, 2019. |
See accompanying notes to financial statements.
| FORMULAFOLIOS US EQUITY FUND |
| STATEMENT OF ASSETS & LIABILITIES |
| November 30, 2019 |
| ASSETS | | | | |
| Investment securities: | | | | |
| At cost | | $ | 299,675,212 | |
| At value | | $ | 310,687,829 | |
| Dividends and interest receivable | | | 566,321 | |
| Receivable for fund shares sold | | | 451,030 | |
| Receivable for investments sold | | | 372,438 | |
| Prepaid expenses and other assets | | | 38,579 | |
| TOTAL ASSETS | | | 312,116,197 | |
| | | | | |
| LIABILITIES | | | | |
| Payable for investments purchased | | | 355,020 | |
| Payable for fund shares repurchased | | | 235,382 | |
| Investment advisory fees payable | | | 210,274 | |
| Distribution (12b-1) fees payable | | | 13 | |
| Payable to related parties | | | 25,322 | |
| Payable to trustees | | | 4,178 | |
| Accrued expenses and other liabilities | | | 69,832 | |
| TOTAL LIABILITIES | | | 900,021 | |
| NET ASSETS | | $ | 311,216,176 | |
| | | | | |
| NET ASSETS CONSIST OF: | | | | |
| Paid in capital | | $ | 322,166,954 | |
| Accumulated losses | | | (10,950,778 | ) |
| NET ASSETS | | $ | 311,216,176 | |
| | | | | |
| NET ASSET VALUE PER SHARE: | | | | |
| Institutional Class | | | | |
| Net Assets | | $ | 311,199,539 | |
| Shares of beneficial interest outstanding ($0 par value, unlimited shares authorized) | | | 30,124,746 | |
| Net asset value (Net Assets ÷ Shares Outstanding), offering price and redemption price per share (a) | | $ | 10.33 | |
| | | | | |
| Investor Class | | | | |
| Net Assets | | $ | 16,637 | |
| Shares of beneficial interest outstanding ($0 par value, unlimited shares authorized) | | | 1,667 | |
| Net asset value (Net Assets ÷ Shares Outstanding), offering price and redemption price per share (a) | | $ | 9.98 | |
| | | | | |
| (a) | Redemption price per share. The Fund imposes a 1.00% redemption fee for any redemption of fund shares occurring within 30 days of purchase. |
See accompanying notes to financial statements.
| FORMULAFOLIOS US EQUITY FUND |
| STATEMENT OF OPERATIONS |
| For the Year Ended November 30, 2019 |
| INVESTMENT INCOME | | | | |
| Dividends | | $ | 4,474,720 | |
| Interest | | | 718,945 | |
| TOTAL INVESTMENT INCOME | | | 5,193,665 | |
| | | | | |
| EXPENSES | | | | |
| Investment advisory fees | | | 2,779,862 | |
| Distribution (12b-1) fees | | | | |
| Investor Class | | | 210 | |
| Administrative service fees | | | 322,070 | |
| Third party administrative servicing fees | | | 308,097 | |
| Registration fees | | | 53,288 | |
| Printing and postage expenses | | | 51,269 | |
| Custodian fees | | | 38,911 | |
| Insurance expense | | | 28,084 | |
| Trustees fees and expenses | | | 26,311 | |
| Legal fees | | | 26,137 | |
| Interest Expense | | | 26,122 | |
| Chief Compliance Officer fees | | | 19,227 | |
| Audit fees | | | 15,501 | |
| Other expenses | | | 23,483 | |
| TOTAL EXPENSES | | | 3,718,572 | |
| | | | | |
| Less: Fees waived by the Adviser | | | (132,086 | ) |
| | | | | |
| NET EXPENSES | | | 3,586,486 | |
| | | | | |
| NET INVESTMENT INCOME | | | 1,607,179 | |
| | | | | |
| REALIZED AND UNREALIZED GAIN (LOSS) ON INVESTMENTS | | | | |
| Net realized loss on investments | | | (11,074,480 | ) |
| Net change in unrealized appreciation/depreciation of investments | | | 9,914,829 | |
| NET REALIZED AND UNREALIZED LOSS ON INVESTMENTS | | | (1,159,651 | ) |
| | | | | |
| NET INCREASE IN NET ASSETS RESULTING FROM OPERATIONS | | $ | 447,528 | |
| | | | | |
See accompanying notes to financial statements.
| FORMULAFOLIOS US EQUITY FUND |
| STATEMENTS OF CHANGES IN NET ASSETS |
| | | For the | | | For the | |
| | | Year Ended | | | Year Ended | |
| | | November 30, 2019 | | | November 30, 2018 | |
| FROM OPERATIONS: | | | | | | | | |
| Net investment income | | $ | 1,607,179 | | | $ | 3,231,303 | |
| Net realized loss on investments | | | (11,074,480 | ) | | | (7,189,396 | ) |
| Net change in unrealized appreciation/depreciation of investments | | | 9,914,829 | | | | (5,681,837 | ) |
| Net increase (decrease) in net assets resulting from operations | | | 447,528 | | | | (9,639,930 | ) |
| | | | | | | | | |
| DISTRIBUTIONS TO SHAREHOLDERS: | | | | | | | | |
| Total Distributions Paid | | | | | | | | |
| Institutional Shares | | | (7,781,334 | ) | | | (25,378,106 | ) |
| Investor Shares | | | (25 | ) | | | (88 | ) |
| Net decrease in net assets resulting from distributions to shareholders | | | (7,781,359 | ) | | | (25,378,194 | ) |
| | | | | | | | | |
| FROM SHARES OF BENEFICIAL INTEREST: | | | | | | | | |
| Institutional Class Shares: | | | | | | | | |
| Proceeds from shares sold | | | 172,730,137 | | | | 191,111,528 | |
| Reinvestment of distributions | | | 7,035,047 | | | | 22,290,248 | |
| Redemption fee proceeds | | | 26,983 | | | | 19,832 | |
| Payments for shares redeemed | | | (206,707,580 | ) | | | (81,553,075 | ) |
| | | | (26,915,413 | ) | | | 131,868,533 | |
| Investor Class Shares: | | | | | | | | |
| Proceeds from shares sold | | | 265,000 | | | | 601 | |
| Reinvestment of distributions | | | 24 | | | | 87 | |
| Payments for shares redeemed | | | (246,973 | ) | | | — | |
| | | | 18,051 | | | | 688 | |
| | | | | | | | | |
| Net increase (decrease) in net assets resulting from shares of beneficial interest | | | (26,897,362 | ) | | | 131,869,221 | |
| | | | | | | | | |
| TOTAL INCREASE (DECREASE) IN NET ASSETS | | | (34,231,193 | ) | | | 96,851,097 | |
| | | | | | | | | |
| NET ASSETS | | | | | | | | |
| Beginning of Year | | | 345,447,369 | | | | 248,596,272 | |
| End of Year | | $ | 311,216,176 | | | $ | 345,447,369 | |
| | | | | | | | | |
| SHARE ACTIVITY | | | | | | | | |
| Institutional Class Shares: | | | | | | | | |
| Shares Sold | | | 17,324,741 | | | | 17,650,726 | |
| Shares Reinvested | | | 794,023 | | | | 2,072,379 | |
| Shares Redeemed | | | (21,277,718 | ) | | | (7,543,476 | ) |
| Net increase (decrease) in shares of beneficial interest outstanding | | | (3,158,954 | ) | | | 12,179,629 | |
| | | | | | | | | |
| Investor Class Shares: | | | | | | | | |
| Shares Sold | | | 26,756 | | | | 57 | |
| Shares Reinvested | | | 3 | | | | 8 | |
| Shares Redeemed | | | (25,227 | ) | | | — | |
| Net increase in shares of beneficial interest outstanding | | | 1,532 | | | | 65 | |
| | | | | | | | | |
See accompanying notes to financial statements.
| FORMULAFOLIOS US EQUITY FUND |
| FINANCIAL HIGHLIGHTS |
| |
| Per Share Data and Ratios for a Share of Beneficial Interest Outstanding Throughout each Period indicated. |
| | | Institutional Class | |
| | | For the | | | For the | | | For the | | | For the | |
| | | Year Ended | | | Year Ended | | | Year Ended | | | Period Ended | |
| | | November 30, 2019 | | | November 30, 2018 | | | November 30, 2017 | | | November 30, 2016 (1) | |
| | | | | | | | | | | | | | | | | |
| Net asset value, beginning of period | | $ | 10.38 | | | $ | 11.78 | | | $ | 10.67 | | | $ | 10.00 | |
| Income from investment operations: | | | | | | | | | | | | | | | | |
| Net investment income (2) | | | 0.05 | | | | 0.12 | | | | 0.09 | | | | 0.02 | |
| Net realized and unrealized gain (loss) on investments | | | 0.13 | (10) | | | (0.42 | ) | | | 1.61 | | | | 0.64 | |
| Total from investment operations | | | 0.18 | | | | (0.30 | ) | | | 1.70 | | | | 0.66 | |
| Less distributions from: | | | | | | | | | | | | | | | | |
| Net investment income | | | (0.05 | ) | | | (0.08 | ) | | | (0.02 | ) | | | — | |
| Net realized gains | | | (0.18 | ) | | | (1.02 | ) | | | (0.57 | ) | | | — | |
| Total distributions | | | (0.23 | ) | | | (1.10 | ) | | | (0.59 | ) | | | — | |
| Paid-in-Capital From Redemption Fees | | | 0.00 | (9) | | | 0.00 | (9) | | | 0.00 | (9) | | | 0.01 | |
| Net asset value, end of period | | $ | 10.33 | | | $ | 10.38 | | | $ | 11.78 | | | $ | 10.67 | |
| Total return (3) | | | 2.16 | % | | | (2.75 | )% | | | 16.61 | % | | | 6.70 | % (8) |
| Net assets, at end of period (000s) | | $ | 311,200 | | | $ | 345,446 | | | $ | 248,595 | | | $ | 119,780 | |
| Ratio of gross expenses to average net assets (4,5) | | | 1.19 | % | | | 1.22 | % | | | 1.28 | % | | | 1.45 | % (7) |
| Ratio of net expenses to average net assets (5) | | | 1.15 | % (11) | | | 1.18 | % | | | 1.22 | % | | | 1.25 | % (7) |
| Ratio of net investment income to average net assets (6) | | | 0.52 | % | | | 1.08 | % | | | 0.84 | % | | | 0.21 | % (7) |
| Portfolio Turnover Rate | | | 524 | % | | | 367 | % | | | 324 | % | | | 378 | % (8) |
| | | | | | | | | | | | | | | | | |
| (1) | The FormulaFolios US Equity Fund commenced operations on December 17, 2015. |
| (2) | Per share amounts calculated using the average shares method, which more appropriately presents the per share data for the period. |
| (3) | Total returns are historical in nature and assume changes in share price, reinvestment of all dividends and distributions, if any. |
| (4) | Represents the ratio of expenses to average net assets absent fee waivers and/or expense reimbursements by the Adviser. |
| (5) | Does not include the expenses of other investment companies in which the Fund invests. |
| (6) | Recognition of investment income by the Fund is affected by the timing and declaration of dividends by the underlying investment companies in which the Fund invests. |
| (9) | Amount represents less than $0.01 per share. |
| (10) | Realized and unrealized gains and losses per share in this caption are balancing amounts necessary to reconcile the change in net asset value for the period, and may not reconcile with the aggregate gains and losses in the Statement of Operations due to share transactions for the period. |
| (11) | Effective April 1, 2019, the Adviser agreed to waive expenses greater than 1.12% per annum for the Portfolio’s average daily net assets. Prior to April 1, 2019, the agreement was 1.18% per annum for the Portfolio’s average daily net assets. |
See accompanying notes to financial statements.
| FORMULAFOLIOS US EQUITY FUND |
| FINANCIAL HIGHLIGHTS |
| |
| Per Share Data and Ratios for a Share of Beneficial Interest Outstanding Throughout each Period indicated. |
| | | Investor Class | |
| | | For the | | | For the | | | For the | | | For the | |
| | | Year Ended | | | Year Ended | | | Year Ended | | | Period Ended | |
| | | November 30, 2019 | | | November 30, 2018 | | | November 30, 2017 | | | November 30, 2016 (1) | |
| | | | | | | | | | | | | |
| Net asset value, beginning of period | | $ | 10.08 | | | $ | 11.57 | | | $ | 10.61 | | | $ | 10.00 | |
| Income from investment operations: | | | | | | | | | | | | | | | | |
| Net investment income (loss) (2) | | | 0.00 | (10) | | | 0.01 | | | | (0.03 | ) | | | (0.00 | ) (10) |
| Net realized and unrealized gain (loss) on investments | | | 0.08 | (11) | | | (0.41 | ) | | | 1.58 | | | | 0.61 | |
| Total from investment operations | | | 0.08 | | | | (0.40 | ) | | | 1.55 | | | | 0.61 | |
| Less distributions from: | | | | | | | | | | | | | | | | |
| Net investment income | | | — | | | | (0.07 | ) | | | (0.02 | ) | | | — | |
| Net realized gains | | | (0.18 | ) | | | (1.02 | ) | | | (0.57 | ) | | | — | |
| Total distributions | | | (0.18 | ) | | | (1.09 | ) | | | (0.59 | ) | | | — | |
| Paid-in-Capital From Redemption Fees | | | — | | | | — | | | | — | | | | 0.00 | (10) |
| Net asset value, end of period | | $ | 9.98 | | | $ | 10.08 | | | $ | 11.57 | | | $ | 10.61 | |
| Total return (3) | | | 1.08 | % | | | (3.73 | )% | | | 15.29 | % | | | 6.10 | % (8) |
| Net assets, at end of period (000’s) | | $ | 17 | | | $ | 1 | | | $ | 1 | | | $ | 156 | (9) |
| Ratio of gross expenses to average net assets (4,5) | | | 2.19 | % | | | 2.22 | % | | | 2.28 | % | | | 2.45 | % (7) |
| Ratio of net expenses to average net assets (5) | | | 2.15 | % (12) | | | 2.18 | % | | | 2.22 | % | | | 2.25 | % (7) |
| Ratio of net investment income (loss) to average net assets (6) | | | 0.02 | % | | | 0.07 | % | | | (0.16 | )% | | | (0.79 | )% (7) |
| Portfolio Turnover Rate | | | 524 | % | | | 367 | % | | | 324 | % | | | 378 | % (8) |
| | | | | | | | | | | | | | | | | |
| (1) | The FormulaFolios US Equity Fund commenced operations on December 17, 2015. |
| (2) | Per share amounts calculated using the average shares method, which more appropriately presents the per share data for the period. |
| (3) | Total returns are historical in nature and assume changes in share price, reinvestment of all dividends and distributions, if any. |
| (4) | Represents the ratio of expenses to average net assets absent fee waivers and/or expense reimbursements by the Adviser. |
| (5) | Does not include the expenses of other investment companies in which the Fund invests. |
| (6) | Recognition of investment income by the Fund is affected by the timing and declaration of dividends by the underlying investment companies in which the Fund invests. |
| (9) | Actual net assets, not truncated. |
| (10) | Amount represents less than $0.01 per share. |
| (11) | Realized and unrealized gains and losses per share in this caption are balancing amounts necessary to reconcile the change in net asset value for the period, and may not reconcile with the aggregate gains and losses in the Statement of Operations due to share transactions for the period. |
| (12) | Effective April 1, 2019, the Adviser agreed to waive expenses greater than 2.12% per annum for the Portfolio’s average daily net assets. Prior to April 1, 2019, the agreement was 2.18% per annum for the Portfolio’s average daily net assets. |
See accompanying notes to financial statements.
| FORMULAFOLIOS US EQUITY FUND |
| NOTES TO FINANCIAL STATEMENTS |
| November 30, 2019 |
The FormulaFolios US Equity Fund (the “Fund”) is a diversified series of shares of beneficial interest of Northern Lights Fund Trust II (the “Trust”), a statutory trust organized under the laws of the State of Delaware on August 26, 2010, and is registered under the Investment Company Act of 1940, as amended (the “1940 Act”), as an open-end management investment company. The Fund’s investment objective is to seek to achieve long-term capital appreciation. The Fund commenced operations on December 17, 2015.
The Fund offers two classes of shares designated as Institutional Class and Investor Class. Each class represents an interest in the same assets of the Fund and classes are identical except for differences in their ongoing service and distribution charges. All classes of shares have equal voting privileges except that each class has exclusive voting rights with respect to its service and/or distribution plans. The Fund’s income, expenses (other than class specific distribution fees) and realized and unrealized gains and losses are allocated proportionately each day based upon the relative net assets of each class.
| 2. | SIGNIFICANT ACCOUNTING POLICIES |
The following is a summary of significant accounting policies followed by the Fund in preparation of its financial statements. These policies are in conformity with accounting principles generally accepted in the United States of America (“GAAP”). The preparation of financial statements in conformity with GAAP requires management to make estimates and assumptions that affect the reported amounts of assets and liabilities and disclosure of contingent assets and liabilities at the date of the financial statements and the reported amounts of increases and decreases in net assets from operations during the reporting year. Actual results could differ from those estimates. The Fund is an investment company and accordingly follows the investment company accounting and reporting guidance of the Financial Accounting Standards Board (“FASB”) Accounting Standards Codification Topic 946“Financial Services – Investment Companies” including FASB Accounting Standards Update ASU 2013-08.
Securities Valuation –Securities listed on an exchange are valued at the last reported sale price at the close of the regular trading session of the primary exchange on the business day the value is being determined, or in the case of securities listed on NASDAQ at the NASDAQ Official Closing Price. In the absence of a sale such securities shall be valued at the mean between the current bid and ask prices on the day of valuation. Short-term debt obligations having 60 days or less remaining until maturity, at time of purchase, may be valued at amortized cost.
The Fund may hold securities, such as private investments, other non-traded securities or temporarily illiquid securities, for which market quotations are not readily available or are determined to be unreliable. These securities will be valued using the “fair value” procedures approved by the Trust’s Board of Trustees (the “Board”). The Board has delegated execution of these procedures to a fair value committee composed of one or more representatives from each of the (i) Trust, (ii) administrator, and (iii) adviser. The committee may also enlist third party consultants such as a valuation specialist at a public accounting firm, valuation consultant or financial officer of a security issuer on an as-needed basis to assist in determining a security-specific fair value. The Board has also engaged a third party valuation firm to attend valuation meetings held by the Trust, review minutes of such meetings and report to the Board on a quarterly basis. The Board reviews and ratifies the execution of this process and the resultant fair value prices at least quarterly to assure the process produces reliable results.
Fair Valuation Process – As noted above, the fair value committee is composed of one or more representatives from each of the (i) Trust, (ii) administrator, and (iii) adviser. The applicable investments are valued collectively via inputs from each of these groups. For example, fair value determinations are required for the following securities: (i) securities for which market quotations are insufficient or not readily available on a particular business day (including securities for which there is a short and temporary lapse in the provision of a price by the regular pricing source), (ii) securities for which, in the judgment of the adviser, the prices or values available do not represent the fair value of the instrument. Factors which may cause the adviser to make such a judgment include, but are not limited to, the following: only a bid price or an ask price is available; the spread between bid and ask prices is substantial; the frequency of sales; the thinness of the market; the size of reported trades; and
| FORMULAFOLIOS US EQUITY FUND |
| NOTES TO FINANCIAL STATEMENTS (Continued) |
| November 30, 2019 |
actions of the securities markets, such as the suspension or limitation of trading; (iii) securities determined to be illiquid; (iv) securities with respect to which an event that will affect the value thereof has occurred (a “significant event”) since the closing prices were established on the principal exchange on which they are traded, but prior to the Fund’s calculation of its net asset value. Specifically, interests in commodity pools or managed futures pools are valued on a daily basis by reference to the closing market prices of each futures contract or other asset held by a pool, as adjusted for pool expenses. Restricted or illiquid securities, such as private investments or non-traded securities are valued via inputs from the adviser based upon the current bid for the security from two or more independent dealers or other parties reasonably familiar with the facts and circumstances of the security (who should take into consideration all relevant factors as may be appropriate under the circumstances). If the adviser is unable to obtain a current bid from such independent dealers or other independent parties, the fair value committee shall determine the fair value of such security using the following factors: (i) the type of security; (ii) the cost at date of purchase; (iii) the size and nature of the Fund’s holdings; (iv) the discount from market value of unrestricted securities of the same class at the time of purchase and subsequent thereto; (v) information as to any transactions or offers with respect to the security; (vi) the nature and duration of restrictions on disposition of the security and the existence of any registration rights; (vii) how the yield of the security compares to similar securities of companies of similar or equal creditworthiness; (viii) the level of recent trades of similar or comparable securities; (ix) the liquidity characteristics of the security; (x) current market conditions; and (xi) the market value of any securities into which the security is convertible or exchangeable.
The Fund utilizes various methods to measure the fair value of all of its investments on a recurring basis. GAAP establishes a hierarchy that prioritizes inputs to valuation methods. The three levels of input are:
Level 1 –Unadjusted quoted prices in active markets for identical assets and liabilities that the Fund has the ability to access.
Level 2 – Observable inputs other than quoted prices included in level 1 that are observable for the asset or liability, either directly or indirectly. These inputs may include quoted prices for the identical instrument on an inactive market, prices for similar instruments, interest rates, prepayment speeds, credit risk, yield curves, default rates and similar data.
Level 3 –Unobservable inputs for the asset or liability, to the extent relevant observable inputs are not available representing the Fund’s own assumptions about the assumptions a market participant would use in valuing the asset or liability, and would be based on the best information available.
The availability of observable inputs can vary from security to security and is affected by a wide variety of factors, including, for example, the type of security, whether the security is new and not yet established in the marketplace, the liquidity of markets, and other characteristics particular to the security. To the extent that valuation is based on models or inputs that are less observable or unobservable in the market, the determination of fair value requires more judgment. Accordingly, the degree of judgment exercised in determining fair value is greatest for instruments categorized in Level 3.
The inputs used to measure fair value may fall into different levels of the fair value hierarchy. In such cases, for disclosure purposes, the level in the fair value hierarchy within which the fair value measurement falls in its entirety, is determined based on the lowest level input that is significant to the fair value measurement in its entirety.
The inputs or methodology used for valuing securities are not necessarily an indication of the risk associated with investing in those securities. The following tables summarize the inputs used as of November 30, 2019 for the Fund’s investments measured at fair value:
| Assets * | | Level 1 | | | Level 2 | | | Level 3 | | | Total | |
| Common Stock | | $ | 277,586,905 | | | $ | — | | | $ | — | | | $ | 277,586,905 | |
| Short-Term Investment | | | 33,100,924 | | | | — | | | | — | | | | 33,100,924 | |
| Total | | $ | 310,687,829 | | | $ | — | | | $ | — | | | $ | 310,687,829 | |
The Fund did not hold any Level 3 securities during the year.
| * | Refer to the Portfolio of Investments for industry classification. |
| FORMULAFOLIOS US EQUITY FUND |
| NOTES TO FINANCIAL STATEMENTS (Continued) |
| November 30, 2019 |
Security Transactions and Related Income – Security transactions are accounted for on trade date. Interest income is recognized on an accrual basis. Discounts are accreted and premiums are amortized on securities purchased over the lives of the respective securities using the effective interest method. Dividend income is recorded on the ex-dividend date. Realized gains or losses from sales of securities are determined by comparing the identified cost of the security lot sold with the net sales proceeds. Withholding taxes on foreign dividends have been provided for in accordance with the Fund’s understanding of the applicable country’s tax rules and rates.
Dividends and Distributions to Shareholders –Dividends from net investment income, if any, are declared and paid at least annually. Distributable net realized capital gains, if any, are declared and distributed annually. Dividends from net investment income and distributions from net realized gains are determined in accordance with federal income tax regulations, which may differ from GAAP. These “book/tax” differences are considered either temporary (i.e., deferred losses, capital loss carry forwards) or permanent in nature. To the extent these differences are permanent in nature, such amounts are reclassified within the composition of net assets based on their federal tax-basis treatment. These reclassifications have no effect on net assets, results from operations or net asset value per share of the Fund. Temporary differences do not require reclassification. Dividends and distributions to shareholders are recorded on ex-dividend date.
Federal Income Tax –The Fund intends to comply with the requirements of the Internal Revenue Code applicable to regulated investment companies and to distribute all of its taxable income to its shareholders. Therefore, no provision for Federal income tax is required. The Fund recognizes the tax benefits of uncertain tax positions only where the position is “more likely than not” to be sustained assuming examination by tax authorities. Management has analyzed the Fund’s tax positions and has concluded that no liability for unrecognized tax benefits should be recorded related to uncertain tax positions taken on returns filed for open tax years (2016-2018) or expected to be taken in the Fund’s 2019 tax returns. The Fund identifies its major tax jurisdictions as U.S. Federal, Ohio and foreign jurisdictions where the Fund makes significant investments. The Fund is not aware of any tax positions for which it is reasonably possible that the total amounts of unrecognized tax benefits will change materially in the next twelve months. The Fund recognizes interest and penalties, if any, related to unrecognized tax benefits as income tax expense in the Statement of Operations. During the period, the Fund did not incur any interest or penalties.
Expenses – Expenses of the Trust that are directly identifiable to a specific fund are charged to that fund. Expenses which are not readily identifiable to a specific fund are allocated in such a manner as deemed equitable taking into consideration the nature and type of expense and the relative sizes of the funds in the Trust.
Indemnification –The Trust indemnifies its Officers and Trustees for certain liabilities that may arise from the performance of their duties to the Trust. Additionally, in the normal course of business, the Fund enters into contracts that contain a variety of representations and warranties and which provide general indemnities. The Fund’s maximum exposure under these arrangements is unknown, as this would involve future claims that may be made against the Fund that have not yet occurred. However, based on experience, the risk of loss due to these warranties and indemnities appears to be remote.
| 3. | INVESTMENT TRANSACTIONS |
For the year ended November 30, 2019, cost of purchases and proceeds from sales of portfolio securities, other than short-term investments and U.S. Government securities, amounted to $1,461,712,781 and $1,524,893,953, respectively.
| 4. | INVESTMENT ADVISORY AGREEMENT AND TRANSACTIONS WITH RELATED PARTIES |
The business activities of the Fund are overseen by the Board, which is responsible for the overall management of the Fund. FormulaFolio Investments, LLC serves as the Fund’s investment adviser (the “Adviser”).
Pursuant to an Investment Advisory Agreement with the Trust on behalf of the Fund, the Adviser, under the oversight of the Board, directs the daily operations of the Fund and supervises the performance of administrative and professional services provided by others. As compensation for its services and the related expenses borne
| FORMULAFOLIOS US EQUITY FUND |
| NOTES TO FINANCIAL STATEMENTS (Continued) |
| November 30, 2019 |
by the Adviser, the Fund pays the Adviser an investment advisory fee, computed and accrued daily and paid monthly, at an annual rate of 0.87% of the Fund’s average daily net assets. Prior to April 1, 2019, the advisory fee was 0.93% of the Fund’s average daily net assets. For the year ended November 30, 2019, the Fund incurred $2,779,862 of advisory fees.
Pursuant to a written contract (the “Waiver Agreement”), the Adviser has agreed, at least until March 31, 2021, to waive a portion of its advisory fee and has agreed to reimburse the Fund for other expenses to the extent necessary so that the total expenses incurred by the Fund (excluding front-end or contingent deferred loads, taxes, borrowing costs, brokerage fees and commissions, acquired fund fees and expenses, expenses of other investment companies in which the Fund may invest or extraordinary expenses such as litigation) do not exceed 1.12% and 2.12% per annum of the Fund’s average daily net assets for Institutional Class and Investor Class shares, respectively through March 31, 2021. Prior to April 1, 2019 the rates were 1.18% and 2.18% per annum of the Fund’s average daily net assets for Institutional Class and Investor Class shares, respectively.
Fees waived or expenses reimbursed may be recouped by the Adviser from a Fund for a period up to three years from the date the fee or expense was waived or reimbursed. However, no recoupment payment will be made by a Fund if it would result in the Fund exceeding the contractual expense limitation described above. The Board may terminate this expense reimbursement arrangement at any time. For the year ended November 30, 2019, the Adviser waived $132,086 in advisory fees due to the Waiver Agreement.
The following amount are subject to recapture by the Fund until the following dates:
| 11/30/2020 | | | 11/30/2021 | | | 11/30/2022 | |
| $ | 123,984 | | | $ | 119,488 | | | $ | 132,086 | |
Distributor – The Fund has adopted the Trust’s Master Distribution and Shareholder Servicing Plan (the “Plan”) pursuant to Rule 12b-1 under the 1940 Act. The Plan provides that a monthly service and/or distribution fee is paid to Northern Lights Distributors, LLC (the “Distributor” or “NLD”) to provide compensation for ongoing distribution-related activities or services and/or maintenance of the Fund’s shareholder accounts not otherwise required to be provided by the Adviser. The maximum amount of the fee authorized is 1.00% of the Fund’s average daily net assets for Investor Class shares. For the year ended November 30, 2019, the Fund incurred distribution fees of $210 for Investor Class shares.
The Distributor acts as the Fund’s principal underwriter in a continuous public offering of the Fund’s shares. For the year ended November 30, 2019, there were no underwriting commissions paid for sales of Institutional Class or Investor Class shares, respectively.
In addition, certain affiliates of the Distributor provide services to the Fund as follows:
Gemini Fund Services, LLC (“GFS”), an affiliate of the Distributor, provides administration, fund accounting, and transfer agent services to the Trust. Pursuant to separate servicing agreements with GFS, the Fund pays GFS customary fees for providing administration, fund accounting and transfer agency services to the Fund. Certain officers of the Trust are also officers of GFS, and are not paid any fees directly by the Fund for serving in such capacities.
Northern Lights Compliance Services, LLC (“NLCS”), an affiliate of GFS and the Distributor, provides a Chief Compliance Officer to the Trust, as well as related compliance services, pursuant to a consulting agreement between NLCS and the Trust. Under the terms of such agreement, NLCS receives customary fees from the Fund.
Blu Giant, LLC(“Blu Giant”), an affiliate of GFS and the Distributor, provides EDGAR conversion and filing services as well as print management services for the Fund on an ad-hoc basis. For the provision of these services, Blu Giant receives customary fees from the Fund.
| FORMULAFOLIOS US EQUITY FUND |
| NOTES TO FINANCIAL STATEMENTS (Continued) |
| November 30, 2019 |
On February 1, 2019, NorthStar Financial Services Group, LLC, the parent company of GFS and its affiliated companies including NLD, NLCS and Blu Giant (collectively, the “Gemini Companies”), sold its interest in the Gemini Companies to a third party private equity firm that contemporaneously acquired Ultimus Fund Solutions, LLC (an independent mutual fund administration firm) and its affiliates (collectively, the “Ultimus Companies”). As a result of these separate transactions, the Gemini Companies and the Ultimus Companies are now indirectly owned through a common parent entity, The Ultimus Group, LLC.
The Fund may assess a short-term redemption fee of 1.00% of the total redemption amount if a shareholder sells their shares after holding them for less than 30 days. For the year ended November 30, 2019, the Fund assessed $26,983 in redemption fees.
Under an agreement (the “Securities Lending Agreement”) with the Securities Finance Trust Company (“SFTC”), the Fund can lend its portfolio securities to brokers, dealers and other financial institutions approved by the Board to earn additional income. For each securities loan, the borrower shall transfer collateral in an amount determined by applying the margin to the market value of the loaned available securities (102% for same currency and 105% for cross currency). Collateral is invested in highly liquid, short-term instruments such as money market funds in accordance with the Fund’s security lending procedures. The Fund continues to receive interest or dividends on the securities loaned. The Fund has the right under the Securities Lending Agency Agreement to recover the securities from the borrower on demand; if the borrower fails to deliver the securities on a timely basis, the Fund could experience delays or losses on recovery. Additionally, the Fund is subject to the risk of loss from investments made with the cash received as collateral. The Fund manages credit exposure arising from these lending transactions by, in appropriate circumstances, entering into master netting agreements and collateral agreements with third party borrowers that provide in the event of default (such as bankruptcy or a borrower’s failure to pay or perform), the right to net a third-party borrower’s rights and obligations under such agreement and liquidate and set off collateral against the net amount owed by the counterparty. As of November 30, 2019, the Fund has not begun Securities Lending.
| 7. | AGGREGATE UNREALIZED APPRECIATION AND DEPRECIATION TAX BASIS |
The identified cost of investments in securities owned by the Fund for federal income tax purposes, and its respective gross unrealized appreciation and depreciation at November 30, 2019, were as follows:
| | | | | | Gross Unrealized | | | Gross Unrealized | | | Net Appreciation/ | |
| | | Tax Cost | | | Appreciation | | | Depreciation | | | (Depreciation) | |
| FormulaFolios US Equity Fund | | $ | 304,403,757 | | | $ | 14,036,475 | | | $ | (7,752,403 | ) | | $ | 6,284,072 | |
| | | | | | | | | | | | | | | | | |
| 8. | DISTRIBUTIONS TO SHAREHOLDERS AND TAX COMPONENTS OF CAPITAL |
The tax character of distributions paid during the fiscal years ended November 30, 2019 and November 30, 2018 was as follows:
| | | Fiscal Year Ended | | | Fiscal Year Ended | |
| | | November 30, 2019 | | | November 30, 2018 | |
| Ordinary Income | | $ | 7,509,917 | | | $ | 24,485,965 | |
| Long-Term Capital Gain | | | 271,442 | | | | 892,229 | |
| | | $ | 7,781,359 | | | $ | 25,378,194 | |
| FORMULAFOLIOS US EQUITY FUND |
| NOTES TO FINANCIAL STATEMENTS (Continued) |
| November 30, 2019 |
| |
As of November 30, 2019, the components of accumulated earnings/(losses) on a tax basis were as follows:
| Undistributed | | | Undistributed | | | Post October Loss | | | Capital Loss | | | Other | | | Unrealized | | | Total | |
| Ordinary | | | Long-Term | | | and | | | Carry | | | Book/Tax | | | Appreciation/ | | | Accumulated | |
| Income | | | Gains | | | Late Year Loss | | | Forwards | | | Differences | | | (Depreciation) | | | Earnings/(Losses) | |
| $ | 1,167,602 | | | $ | — | | | $ | — | | | $ | (18,402,452 | ) | | $ | — | | | $ | 6,284,072 | | | $ | (10,950,778 | ) |
The difference between book basis and tax basis unrealized appreciation (depreciation) and accumulated net realized losses from security transactions are primarily attributable to the tax deferral of losses on wash sales.
At November 30, 2019, the Fund had capital loss carry forwards for federal income tax purposes available to offset future capital gains as follows:
| Non-Expiring | | | Non-Expiring | | | | |
| Short-Term | | | Long-Term | | | Total | |
| $ | 15,766,459 | | | $ | 2,635,993 | | | $ | 18,402,452 | |
The beneficial ownership, either directly or indirectly, of more than 25% of the voting securities of a Fund creates presumption of the control of the Fund, under section 2(a)(9) of the 1940 Act. As of November 30, 2019, National Financial Services, LLC held 69.2% ownership of the voting securities of the Fund. Persons controlling the Fund can determine the outcome of any proposal submitted to the shareholders for approval, including changes to the Fund’s fundamental policies or the terms of the advisory agreement with the Adviser.
Subsequent events after the date of the Statement of Assets and Liabilities have been evaluated through the date the financial statements were issued.
Distributions: The Fund’s Board of Trustees declared the following distributions:
| Class | | Dividend Per Share | | | Record Date | | Ex-Date | | Payable Date |
| Institutional | | $ | 0.0427 | | | 12/18/2019 | | 12/19/2019 | | 12/19/2019 |
Management has determined that no events or transactions occurred requiring adjustment or disclosure in the financial statements.
REPORT OF INDEPENDENT REGISTERED PUBLIC ACCOUNTING FIRM
To the Shareholders of FormulaFolios US Equity Fund and
Board of Trustees of Northern Lights Fund Trust II
Opinion on the Financial Statements
We have audited the accompanying statement of assets and liabilities, including the portfolio of investments, of FormulaFolios US Equity Fund (the “Fund”), a series of Northern Lights Fund Trust II, as of November 30, 2019, the related statement of operations for the year then ended, the statements of changes in net assets for each of the two years in the period then ended, including the related notes, and the financial highlights for each of the four periods in the period then ended (collectively referred to as the “financial statements”). In our opinion, the financial statements present fairly, in all material respects, the financial position of the Fund as of November 30, 2019, the results of its operations for the year then ended, the changes in its net assets for each of the two years in the period then ended, and the financial highlights for each of the four periods in the period then ended, in conformity with accounting principles generally accepted in the United States of America.
Basis for Opinion
These financial statements are the responsibility of the Fund’s management. Our responsibility is to express an opinion on the Fund’s financial statements based on our audits. We are a public accounting firm registered with the Public Company Accounting Oversight Board (United States) (“PCAOB”) and are required to be independent with respect to the Fund in accordance with the U.S. federal securities laws and the applicable rules and regulations of the Securities and Exchange Commission and the PCAOB.
We conducted our audits in accordance with the standards of the PCAOB. Those standards require that we plan and perform the audit to obtain reasonable assurance about whether the financial statements are free of material misstatement whether due to error or fraud.
Our audits included performing procedures to assess the risks of material misstatement of the financial statements, whether due to error or fraud, and performing procedures that respond to those risks. Such procedures included examining, on a test basis, evidence regarding the amounts and disclosures in the financial statements. Our procedures included confirmation of securities owned as of November 30, 2019, by correspondence with the custodian and brokers or by other appropriate auditing procedures where replies from brokers were not received. Our audits also included evaluating the accounting principles used and significant estimates made by management, as well as evaluating the overall presentation of the financial statements. We believe that our audits provide a reasonable basis for our opinion.
We have served as the auditor of one or more investment companies advised by FormulaFolios Investments LLC since 2015.
COHEN & COMPANY, LTD.
Cleveland, Ohio
January 29, 2020
| FORMULAFOLIOS US EQUITY FUND |
| EXPENSE EXAMPLES (Unaudited) |
| November 30, 2019 |
As a shareholder of the Fund, you incur ongoing costs, including management fees; distribution and/or service (12b-1) fees; and other Fund expenses. This example is intended to help you understand your ongoing costs (in dollars) of investing in the Fund and to compare these costs with the ongoing costs of investing in other mutual funds.
The example is based on an investment of $1,000 invested at the beginning of the period and held for the entire period from June 1, 2019 through November 30, 2019.
Actual Expenses
The “Actual Expenses” line in the table below provides information about actual account values and actual expenses. You may use the information below; together with the amount you invested, to estimate the expenses that you paid over the period. Simply divide your account value by $1,000 (for example, an $8,600 account value divided by $1,000 = 8.6), then multiply the result by the number in the table under the heading entitled “Expenses Paid During Period” to estimate the expenses you paid on your account during this period.
Hypothetical Example for Comparison Purposes
The “Hypothetical” line in the table below provides information about hypothetical account values and hypothetical expenses based on the Fund’s actual expense ratio and an assumed rate of return of 5% per year before expenses, which is not the Fund’s actual return. The hypothetical account values and expenses may not be used to estimate the actual ending account balances or expenses you paid for the period. You may use this information to compare this 5% hypothetical example with the 5% hypothetical examples that appear in the shareholder reports of other funds.
The table is useful in comparing ongoing costs only, and will not help you determine the relative total costs of owning different funds.
| | | | | | | | | | | Hypothetical |
| | | | | | | Actual | | (5% return before expenses) |
| | | Fund’s | | | | Ending | | | | | | |
| | | Annualized | | Beginning | | Account | | Expenses | | Ending | | Expenses |
| | | Expense | | Account Value | | Value | | Paid During | | Account Value | | Paid During |
| | | Ratio | | 6/1/19 | | 11/30/19 | | Period * | | 11/30/19 | | Period * |
| | | | | | | | | | | | | |
| Institutional Class | | 1.12% | | $1,000.00 | | $1,086.20 | | $5.86 | | $1,019.45 | | $5.67 |
| Investor Class | | 2.12% | | $1,000.00 | | $1,080.10 | | $11.05 | | $1,014.44 | | $10.71 |
| * | Expenses are equal to the average account value over the period, multiplied by the Fund’s annualized expense ratio, multiplied by the number of days in the period (183) divided by the number of days in the fiscal year (365). |
| FORMULAFOLIOS US EQUITY FUND |
| SUPPLEMENTAL INFORMATION (Unaudited) |
| November 30, 2019 |
FACTORS CONSIDERED BY THE TRUSTEES IN APPROVAL OF THE RENEWAL OF THE INVESTMENT ADVISORY AGREEMENT
At a Regular meeting (the “Meeting”) of the Board of Trustees (the “Board”) of Northern Lights Fund Trust II (the “Trust”) held on October 14-15, 2019 the Board, including the disinterested Trustees (the “Independent Trustees”), considered the renewal of the Investment Advisory Agreement between the Trust, on behalf of the FormulaFolios US Equity Fund (the “FormulaFolios Fund”) and FormulaFolio Investments, LLC (“FormulaFolio”) (the “FormulaFolio Advisory Agreement”).
Based on their evaluation of the information provided by FormulaFolio, in conjunction with the FormulaFolio Fund’s other service providers, the Board, by a unanimous vote (including a separate vote of the Independent Trustees), approved the FormulaFolio Advisory Agreement with respect to FormulaFolio Fund.
In advance of the Meeting, the Board requested and received materials to assist them in considering the FormulaFolio Advisory Agreement. The materials provided contained information with respect to the factors enumerated below, including the FormulaFolio Advisory Agreement, a memorandum prepared by the Trust’s outside legal counsel discussing in detail the Trustees’ fiduciary obligations and the factors they should assess in considering the continuation of the FormulaFolio Advisory Agreement and comparative information relating to the advisory fee and other expenses of the FormulaFolio Fund. The materials also included due diligence materials relating to FormulaFolio (including due diligence questionnaires completed by FormulaFolio, select financial information of FormulaFolio, bibliographic information regarding FormulaFolio’s key management and investment advisory personnel, and comparative fee information relating to the FormulaFolio Fund) and other pertinent information. At the Meeting, the Independent Trustees were advised by counsel that is experienced in Investment Company Act of 1940 matters and that is independent of fund management and met with such counsel separately from fund management.
The Board then reviewed and discussed the written materials that were provided in advance of the Meeting and deliberated on the approval of the FormulaFolio Advisory Agreement with respect to the FormulaFolio Fund. The Board relied upon the advice of independent legal counsel and their own business judgment in determining the material factors to be considered in evaluating the FormulaFolio Advisory Agreement and the weight to be given to each such factor. The conclusions reached by the Board were based on a comprehensive evaluation of all of the information provided and were not the result of any one factor. Moreover, each Trustee may have afforded different weight to the various factors in reaching his conclusions with respect to the FormulaFolio Advisory Agreement. In considering the approval of the FormulaFolio Advisory Agreement, the Board reviewed and analyzed various factors that they determined were relevant, including the factors enumerated below.
Nature, Extent and Quality of Services.The Board reviewed materials provided by FormulaFolio related to the proposed renewal of the FormulaFolio Advisory Agreement with respect to the FormulaFolios Fund, including FormulaFolio’s Form ADV and related schedules, a description of the manner in which investment decisions were made and executed, a review of the personnel performing services for the FormulaFolios Fund, including the individuals that primarily monitor and execute the investment process. The Board then discussed the extent of FormulaFolios research capabilities, the quality of its compliance infrastructure and the experience of its fund management personnel. The Board considered FormulaFolio’s specific responsibilities in all aspects of the day-to-day management of the FormulaFolios Fund. The Board also noted FormulaFolio’s steady growth, increased personnel and commitment to the algorithm. Additionally, the Board received satisfactory responses from the representative of FormulaFolio with respect to a series of important questions, including: whether FormulaFolio was involved in any lawsuits or pending regulatory actions; whether the management of other accounts would
| FORMULAFOLIOS US EQUITY FUND |
| SUPPLEMENTAL INFORMATION (Unaudited)(Continued) |
| November 30, 2019 |
conflict with its management of the FormulaFolios Fund; and whether FormulaFolio had procedures in place to adequately allocate trades among its respective clients. The Board reviewed the descriptions provided by FormulaFolio of its practices for monitoring compliance with the FormulaFolios Fund’s investment limitations, noting that FormulaFolio’s CCO had processes to review the portfolio managers’ performance of their duties with respect to the FormulaFolios Fund to ensure compliance under FormulaFolio’s compliance program. The Board also noted FormulaFolio’s representation that the prospectus and the statement of additional information for the FormulaFolios Fund accurately describe and disclose the investment strategies of the FormulaFolios Fund. The Board then reviewed the capitalization of FormulaFolio based on financial information and other materials provided and discussed with FormulaFolio and concluded that FormulaFolio was sufficiently well-capitalized in order to meet its obligations to each of the FormulaFolios Funds. The Board also discussed FormulaFolio’s compliance program with the CCO of the Trust. The Board noted that the CCO of the Trust continued to represent that FormulaFolio’s policies and procedures were reasonably designed to prevent violations of applicable securities laws. The Board concluded that FormulaFolio had sufficient quality and depth of personnel, resources, investment methods and compliance policies and procedures necessary to perform its duties under the FormulaFolio Advisory Agreement with respect to the FormulaFolios Fund and that the nature, overall quality and extent of the management services provided by FormulaFolio was satisfactory and reliable.
Performance.The Board discussed the reports prepared by Broadridge and reviewed the performance of the FormulaFolios Fund as compared to its peer group, Morningstar category and benchmark for the one year, three year and since inception periods ended August 31, 2019. The Board noted that the FormulaFolios Fund underperformed its peer group median, Morningstar category median and benchmark for each period although performance was positive for the three year and since inception periods. The Board further noted that the FormulaFolios Fund was at the bottom of its peer group but held significant cash holdings which may have contributed to the underperformance as compared to the peer group and Morningstar category. After further discussion, the Board concluded that performance was acceptable although the Board would continue to monitor the FormulaFolios Fund’s relative performance.
Fees and Expenses. As to the costs of the services provided by FormulaFolio, the Board reviewed and discussed the FormulaFolios Fund’s advisory fee and total operating expenses as compared to its peer group and its Morningstar category as presented in the Broadridge Reports noting that the advisory fee was near the high end of its peer group and Morningstar category, although not the highest. The Board then reviewed the contractual arrangements for the FormulaFolios Fund, which stated that FormulaFolio had agreed to waive or limit its advisory fee and/or reimburse expenses at least until April 30, 2021 in order to limit net annual operating expenses, exclusive of certain fees, so as not to exceed 2.12% and 1.12% of the FormulaFolios Fund’s average annual net assets, for Investor and Institutional Class Shares, respectively and found such arrangements to be beneficial to shareholders. It was the consensus of the Board that, based on FormulaFolio’s experience and expertise, and the services provided by FormulaFolio to the FormulaFolios Fund, the advisory fee charged by FormulaFolio to the FormulaFolios Fund was not unreasonable.
Profitability. The Board also considered the level of profits that could be expected to accrue to FormulaFolio with respect to the FormulaFolios Fund based on break even and profitability reports and analyses reviewed by the Board and the selected financial information provided by FormulaFolio. With respect to the FormulaFolios Fund, the Board noted that profitability appears higher as a result of the automated algorithm developed and used by FormulaFolio and further noted FormulaFolio’s statement that it was making continuing investments in additional personnel and technology. The Board concluded that, based on the services provided and the projected growth of the FormulaFolios Funds, the anticipated profit from FormulaFolio’s relationship with the FormulaFolios Fund was not excessive.
| FORMULAFOLIOS US EQUITY FUND |
| SUPPLEMENTAL INFORMATION (Unaudited)(Continued) |
| November 30, 2019 |
Economies of Scale. As to the extent to which the FormulaFolios Fund will realize economies of scale as it grows, and whether the fee levels reflect these economies of scale for the benefit of investors, the Board discussed FormulaFolio’s expectations for growth of the FormulaFolios Fund. The Board also noted the recent reduction to the advisory fee and expense cap back in March 2019 and discussed with FormulaFolio the possibility of lowering the fees even further at a future date. After discussion, the Board concluded that significant additional economies of scale would likely not be achieved in the near term.
Conclusion. The Board relied upon the advice of counsel, and their own business judgment in determining the material factors to be considered in evaluating the FormulaFolio Advisory Agreement and the weight to be given to each such factor. Accordingly, having requested and received such information from FormulaFolio as the Trustees believed to be reasonably necessary to evaluate the terms of the FormulaFolio Advisory Agreement, and as assisted by the advice of independent counsel, the Board, including a majority of the Independent Trustees, determined that, with respect to the FormulaFolioAdvisory Agreement, (a) the terms of the FormulaFolio Advisory Agreement are reasonable; (b) the advisory fee is reasonable; and (c) the FormulaFolio Advisory Agreement is in the best interests of the FormulaFolio Fund and its shareholders. In considering the approval of the renewal of the FormulaFolio Advisory Agreement, the Board did not identify any one factor as all important, but rather considered these factors collectively and determined that approval of the renewal of the FormulaFolio Advisory Agreement was in the best interest of the FormulaFolio Fund and its shareholders. Moreover, the Board noted that each Trustee may have afforded different weight to the various factors in reaching his conclusions with respect to the FormulaFolio Advisory Agreement.
| FORMULAFOLIOS US EQUITY FUND |
| SUPPLEMENTAL INFORMATION (Unaudited)(Continued) |
| November 30, 2019 |
The Trustees and the officers of the Trust are listed below with their present positions with the Trust and principal occupations over at least the last five years. The business address of each Trustee and Officer is 225 Pictoria Drive, Suite 450, Cincinnati, OH 45246. All correspondence to the Trustees and Officers should be directed to c/o Gemini Fund Services, LLC, P.O. Box 541150, Omaha, Nebraska 68154.
Independent Trustees
Name and
Year of Birth | Position/Term of Office* | Principal Occupation
During the Past Five Years | Number of
Portfolios in
Fund
Complex
Overseen by
Trustee*** | Other Directorships held by
Trustee
During the Past Five Years |
Thomas T. Sarkany
1946 | Trustee Since October 2011 | President, TTS Consultants, LLC (financial services) (since 2010). | 2 | Director, Aquila Distributors; Trustee, Arrow ETF Trust; Trustee, Arrow Investments Trust; Trustee, Northern Lights Fund Trust IV |
Anthony H. Lewis
1946 | Trustee Since May 2011 | Chairman and CEO of The Lewis Group USA (executive consulting firm) (since 2007). | 2 | Director, Member of the Compensation Committee and Member of the Risk Committee of Torotel Inc. (Magnetics, Aerospace and Defense), Trustee, Chairman of the Fair Valuation Committee and Member of the Audit Committee of the Wildermuth Endowment Strategy Fund |
Keith Rhoades
1948 | Trustee Since May 2011 | Retired since 2008. | 2 | NONE |
Randal D. Skalla
1962 | Trustee Since May 2011 | President, L5 Enterprises, Inc. (financial services company) (since 2001). | 2 | Board Member, Orizon Investment Counsel (financial services company) (from 2001 to 2017) |
| FORMULAFOLIOS US EQUITY FUND |
| SUPPLEMENTAL INFORMATION (Unaudited)(Continued) |
| November 30, 2019 |
Interested Trustees and Officers
Name and
Year of Birth | Position/Term of Office* | Principal Occupation
During the Past Five Years | Number of
Portfolios in
Fund
Complex
Overseen
by
Trustee*** | Other Directorships held by
Trustee
During the Past Five Years |
Brian Nielsen**
1972 | Trustee Since May 2011 | Trustee (since 2011) of Northern Lights Fund Trust II; Special Projects Counsel of NorthStar Financial Services Group, LLC (from 2018 to 2019); General Counsel (from 2001 to 2014) and Secretary (from 2001 to 2018) of CLS Investments, LLC; General Counsel (from 2001 to 2014) and Secretary (from 2001 to 2018) of Orion Advisor Services, LLC; Manager (from 2012 to 2015), General Counsel and Secretary (from 2003 to 2018) of NorthStar Financial Services Group, LLC; CEO (from 2012 to 2018), General Counsel (from 2003 to 2014), Secretary (from 2003 to 2018) and Manager (from 2005 to 2018) of Northern Lights Distributors, LLC; Director, Secretary and General Counsel (from 2004 to 2018) of Constellation Trust Company; CEO (from 2015 to 2018), Manager (from 2008 to 2015), General Counsel and Secretary (from 2011 to 2018) of Northern Lights Compliance Services, LLC; General Counsel and Secretary (from 2011 to 2018) of Blu Giant, LLC; General Counsel (from 2012 to 2014) and Secretary (from 2012 to 2018) of Gemini Fund Services, LLC; Manager (from 2012 to 2018) of Arbor Point Advisors, LLC; General Counsel and Secretary (from 2013 to 2014) of Gemini Hedge Fund Services, LLC; General Counsel and Secretary (from 2013 to 2014) of Gemini Alternative Funds, LLC; Secretary and General Counsel of NorthStar Holdings, LLC (from 2013 to 2015); Director, Secretary and General Counsel of NorthStar CTC Holdings, Inc. (from 2015 to 2018) and Secretary and Chief Legal Officer (from 2003 to 2018) of AdvisorOne Funds. | 2 | Manager of Northern Lights Distributors, LLC (from 2005 to 2018); Manager of NorthStar Financial Services Group, LLC (from 2012 to 2015); Manager of Arbor Point Advisors, LLC (from 2012 to 2018); Director of Constellation Trust Company |
Kevin E. Wolf
1969 | President Since January 2013 | Vice President of The Ultimus Group, LLC and Executive Vice President of Gemini Fund Services, LLC (since 2019), President, Gemini Fund Services, LLC (2012 - 2019). | N/A | N/A |
Richard Malinowski
1983 | Secretary Since January 2018 | Senior Vice President Legal Administration, Gemini Fund Services, LLC (since April 2017); Vice President and Counsel (April 2016 to 2017) and AVP and Staff Attorney (September 2012 to March 2016). | N/A | N/A |
Erik Naviloff
1968 | Treasurer Since January 2013 | Vice President of Gemini Fund Services, LLC (since 2011). | N/A | N/A |
Emile R. Molineaux
1962 | Chief Compliance Officer and Anti Money Laundering Officer Since May 2011 | Senior Compliance Officer and CCO of Various clients of Northern Lights Compliance Services, LLC (since 2011). | N/A | N/A |
| * | The term of office for each Trustee and Officer listed above will continue indefinitely. |
| ** | Brian Nielsen is an “interested person” of the Trust as that term is defined under the 1940 Act, because of his former affiliation with Northern Lights Distributors, LLC (the Fund’s Distributor). |
| *** | As of November 30, 2019, the Trust was comprised of 19 active portfolios managed by unaffiliated investment advisers. The term “Fund Complex” applies only to the Fund, and not to any other series of the Trust. The Fund does not hold itself out as related to any other series within the Trust for investment purposes, nor does it share the same investment adviser with any other series. |
Privacy Policy
Rev. May 2019
| FACTS | WHAT DOES NORTHERN LIGHTS FUND TRUST II (“NLFT II”) DO WITH YOUR PERSONAL INFORMATION? |
| Why? | Financial companies choose how they share your personal information. Federal law gives consumers the right to limit some but not all sharing. Federal law also requires us to tell you how we collect, share, and protect your personal information. Please read this notice carefully to understand what we do. |
| What? | The types of personal information we collect and share depend on the product or service you have with us. This information can include:
|
● Social Security number ● Employment information ● Account balances | ● Account transactions ● Income ● Investment experience |
When you are no longer our customer, we continue to share your information as described in this notice. |
| How? | All financial companies need to share a customer’s personal information to run their everyday business - to process transactions, maintain customer accounts, and report to credit bureaus. In the section below, we list the reasons financial companies can share their customer’s personal information; the reasons NLFT II chooses to share; and whether you can limit this sharing. |
| | |
| Reasons we can share your personal information | Does NLFT II
share? | Can you limit
this sharing? |
For our everyday business purposes —
such as to process your transactions, maintain your account(s), respond to court orders and legal investigations, or report to credit bureaus
| Yes | No |
For our marketing purposes —
to offer our products and services to you
| Yes | No |
For joint marketing with other financial companies
| Yes | No |
For our affiliates’ everyday business purposes —
information about your transactions and experiences
| Yes | No |
For our affiliates’ everyday business purposes —
information about your creditworthiness
| No | We don’t share |
For nonaffiliates to market to you
| No | We don’t share |
| Questions? | Call 1-402-493-4603 |
| | |
| Who we are |
| Who is providing this notice? | Northern Lights Fund Trust II |
| What we do |
| How does NLFT II protect my personal information? | To protect your personal information from unauthorized access and use, we use security measures that comply with federal law. These measures include computer safeguards and secured files and buildings.
|
| How does NLFT II collect my personal information? | We collect your personal information, for example, when you
|
● open an account ● give us your income information ● provide employment information | ● provide account information ● give us your contact information |
We also collect your personal information from others, such as credit bureaus, affiliates, or other companies. |
| Why can’t I limit all sharing? | Federal law gives you the right to limit only ● sharing for affiliates’ everyday business purposes—information about your creditworthiness ● affiliates from using your information to market to you ● sharing for nonaffiliates to market to you State laws and individual companies may give you additional rights to limit sharing. |
| Definitions |
| Affiliates | Companies related by common ownership or control. They can be financial and nonfinancial companies. ● Northern Lights Fund Trust II has no affiliates. |
| Nonaffiliates | Companies not related by common ownership or control. They can be financial and nonfinancial companies. ● NLFT II does not share with nonaffiliates so they can market to you. |
| Joint marketing | A formal agreement between nonaffiliated financial companies that together market financial products and services to you. ● Our joint marketing partners include other financial service companies. |
PROXY VOTING POLICY
Information regarding how the Fund voted proxies relating to portfolio securities for the most recent twelve month period ended June 30 as well as a description of the policies and procedures that the Fund uses to determine how to vote proxies is available without charge, upon request, by calling 1-855-907-3233 or by referring to the Securities and Exchange Commission’s (“SEC”) website at http://www.sec.gov.
PORTFOLIO HOLDINGS
The Fund files its complete schedule of portfolio holdings with the SEC for the first and third quarters of each fiscal year on Form N-Q. Form N-Q is available on the SEC’s website at http://www.sec.gov and may be reviewed and copied at the SEC’s Public Reference Room in Washington, DC (1-800-SEC-0330). The information on Form N-Q is available without charge, upon request, by calling 1-855-907-3233.
| INVESTMENT ADVISER |
| FormulaFolio Investments LLC |
| 89 Ionia SW, Suite 600 |
| Grand Rapids, MI 49503 |
| |
| ADMINISTRATOR |
| Gemini Fund Services, LLC |
| 4221 North 203rd Street, Suite 100 |
| Elkhorn, NE 68022-3474 |
Item 2. Code of Ethics.
(a) As of the end of the period covered by this report, the registrant has adopted a code of ethics that applies to the registrant's principal executive officer, principal financial officer, principal accounting officer or controller, or persons performing similar functions, regardless of whether these individuals are employed by the registrant or a third party.
(b) For purposes of this item, “code of ethics” means written standards that are reasonably designed to deter wrongdoing and to promote:
| (1) | Honest and ethical conduct, including the ethical handling of actual or apparent conflicts of interest between personal and professional relationships; |
| (2) | Full, fair, accurate, timely, and understandable disclosure in reports and documents that a registrant files with, or submits to, the Commission and in other public communications made by the registrant; |
(3) Compliance with applicable governmental laws, rules, and regulations;
| (4) | The prompt internal reporting of violations of the code to an appropriate person or persons identified in the code; and |
(5) Accountability for adherence to the code.
(c) Amendments: During the period covered by the report, there have not been any amendments to the provisions of the code of ethics.
(d) Waivers: During the period covered by the report, the registrant has not granted any express or implicit waivers from the provisions of the code of ethics.
(e) The Code of Ethics is not posted on Registrant’ website.
(f) A copy of the Code of Ethics is attached as an exhibit.
Item 3. Audit Committee Financial Expert.
(a) The Registrant’s board of trustees has determined that Keith Rhoades is an audit committee financial expert, as defined in Item 3 of Form N-CSR. Mr. Rhoades is independent for purposes of this Item.
Item 4. Principal Accountant Fees and Services.
2017 – $13,000
2018 – $13,000
2019 -- $13,250
2017 – None
2018 – None
2019 -- None
2017 – $2,500
2018 – $2,500
2019 -- $3,000
Preparation of Federal & State income tax returns, assistance with calculation of required income, capital gain and excise distributions and preparation of Federal excise tax returns.
2016 – None
2017 – None
2018 -- None
| (e) | (1)Audit Committee’s Pre-Approval Policies |
The registrant’s Audit Committee is required to pre-approve all audit services and, when appropriate, any non-audit services (including audit-related, tax and all other services) to the registrant. The registrant’s Audit Committee also is required to pre-approve, when appropriate, any non-audit services (including audit-related, tax and all other services) to its adviser, or any entity controlling, controlled by or under common control with the adviser that provides ongoing services to the registrant, to the extent that the services may be determined to have an impact on the operations or financial reporting of the registrant. Services are reviewed on an engagement by engagement basis by the Audit Committee.
| (2) | Percentages of Services Approved by the Audit Committee |
2018 2017 2016
Audit-Related Fees: 0.00% 0.00% 0.00%
Tax Fees: 0.00% 0.00% 0.00%
All Other Fees: 0.00% 0.00% 0.00%
| (f) | During the audit of registrant's financial statements for the most recent fiscal year, less than 50 percent of the hours expended on the principal accountant's engagement were attributed to work performed by persons other than the principal accountant's full-time, permanent employees. |
| (g) | The aggregate non-audit fees billed by the registrant's accountant for services rendered to the registrant, and rendered to the registrant's investment adviser (not including any sub-adviser whose role is primarily portfolio management and is subcontracted with or overseen by another investment adviser), and any entity controlling, controlled by, or under common control with the adviser that provides ongoing services to the registrant: |
2017 – $2,500
2018 – $2,500
2019 -- $3,000
(h) The registrant's audit committee has considered whether the provision of non-audit services to the registrant's investment adviser (not including any sub-adviser whose role is primarily portfolio management and is subcontracted with or overseen by another investment adviser), and any entity controlling, controlled by, or under common control with the investment adviser that provides ongoing services to the registrant, that were not pre-approved pursuant to paragraph (c)(7)(ii) of Rule 2-01 of Regulation S-X, is compatible with maintaining the principal accountant's independence.
Item 5. Audit Committee of Listed Companies.Not applicable to open-end investment companies.
Item 6. Schedule of Investments.Schedule of investments in securities of unaffiliated issuers is included under Item 1.
Item 7. Disclosure of Proxy Voting Policies and Procedures for Closed-End Funds. Not applicable to open-end investment companies.
Item 8. Portfolio Managers of Closed-End Management Investment Companies. Not applicable to open-end investment companies.
Item 9. Purchases of Equity Securities by Closed-End Funds. Not applicable to open-end investment companies.
Item 10. Submission of Matters to a Vote of Security Holders. None
Item 11. Controls and Procedures.
(a) Based on an evaluation of the Registrant’s disclosure controls and procedures as of a date within 90 days of filing date of this Form N-CSR, the principal executive officer and principal financial officer of the Registrant have concluded that the disclosure controls and procedures of the Registrant are reasonably designed to ensure that the information required in filings on Form N-CSR is recorded, processed, summarized, and reported by the filing date, including that information required to be disclosed is accumulated and communicated to the Registrant’s management, including the Registrant’s principal executive officer and principal financial officer, as appropriate to allow timely decisions regarding required disclosure.
(b) There were no significant changes in the Registrant’s internal control over financial reporting that occurred during the Registrant’s last fiscal half-year that have materially affected, or are reasonably likely to materially affect, the Registrant’s internal control over financial reporting.
Item 12. Disclosure of Securities Lending Activities for Closed-End Management Investment Companies. Not applicable to open-end investment companies.
Item 13. Exhibits.
(a)(1) Code of Ethics filed herewith.
(a)(2) Certifications required by Section 302 of the Sarbanes-Oxley Act of 2002 (and Item 11(a)(2) of Form N-CSR) are filed herewith.
(a)(3) Not applicable for open-end investment companies.
(b) Certifications required by Section 906 of the Sarbanes-Oxley Act of 2002 (and Item 11(b) of Form N-CSR) are filed herewith.
SIGNATURES
Pursuant to the requirements of the Securities Exchange Act of 1934 and the Investment Company Act of 1940, the registrant has duly caused this report to be signed on its behalf by the undersigned, thereunto duly authorized.
(Registrant)Northern Lights Fund Trust II
By (Signature and Title)
/s/ Kevin E. Wolf
Kevin E. Wolf, Principal Executive Officer/President
Date 2/7/20
Pursuant to the requirements of the Securities Exchange Act of 1934 and the Investment Company Act of 1940, this report has been signed below by the following persons on behalf of the registrant and in the capacities and on the dates indicated.
By (Signature and Title)
/s/Kevin E. Wolf
Kevin E. Wolf, Principal Executive Officer/President
Date 2/7/20
By (Signature and Title)
/s/ Erik Naviloff
Erik Naviloff, Principal Financial Officer/Treasurer
Date 2/7/20