UNITED STATES
SECURITIES AND EXCHANGE COMMISSION
WASHINGTON, D.C. 20549
FORM N-CSR
CERTIFIED SHAREHOLDER REPORT OF REGISTERED MANAGEMENT
INVESTMENT COMPANIES
| Investment Company Act file number | 811-22549 |
| Northern Lights Fund Trust II |
| (Exact name of registrant as specified in charter) |
| 225 Pictoria Drive, Suite 450, Cincinnati, Ohio | 45246 |
| (Address of principal executive offices) | (Zip code) |
| Kevin Wolf, Gemini Fund Services, LLC |
| 4221 North 203rd Street, Suite 100, Elkhorn, NE 68022 |
| (Name and address of agent for service) |
| Registrant’s telephone number, including area code: | 631-470-2600 |
| Date of fiscal year end: | 12/31 |
| Date of reporting period: | 06/30/24 |
Item 1. Reports to Stockholders.
| (a) |
Acclivity Mid Cap Multi-Style Fund - Class I (AXMIX )
Class I (AXMIX )
Semi-Annual Shareholder Report - June 30, 2024

Fund Overview
This semi-annual shareholder report contains important information about Acclivity Mid Cap Multi-Style Fund for the period of January 1, 2024 to June 30, 2024. You can find additional information about the Fund at https://www.innealtafunds.com/#front-page-3. You can also request this information by contacting us at 855-873-3837.
What were the Fund’s costs for the last six months?
(based on a hypothetical $10,000 investment)
| Class Name | Costs of a $10,000 investment | Costs paid as a percentage of a $10,000 investment |
|---|---|---|
| Class I | $22 | 0.44% |
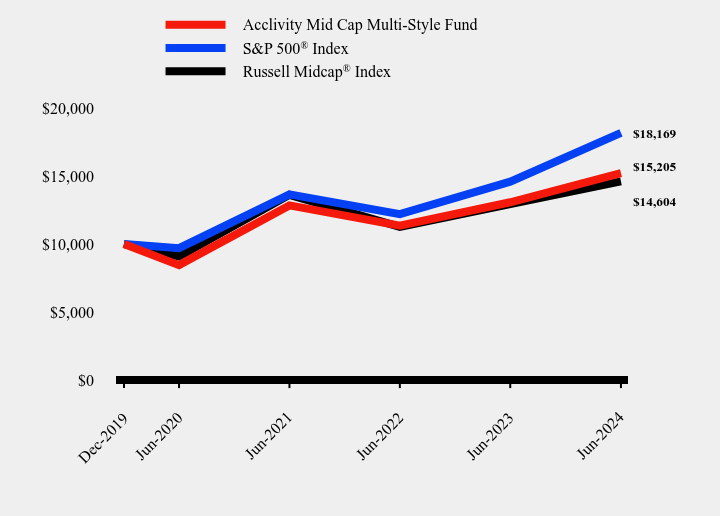
How has the Fund performed since inception?
Total Return Based on $10,000 Investment

| Acclivity Mid Cap Multi-Style Fund | S&P 500® Index | Russell Midcap® Index | |
|---|---|---|---|
| Dec-2019 | $10,000 | $10,000 | $10,000 |
| Jun-2020 | $8,450 | $9,692 | $9,087 |
| Jun-2021 | $12,840 | $13,646 | $13,613 |
| Jun-2022 | $11,342 | $12,197 | $11,258 |
| Jun-2023 | $13,068 | $14,587 | $12,939 |
| Jun-2024 | $15,205 | $18,169 | $14,604 |
Average Annual Total Returns
| 6 Months | 1 Year | Since Inception (12/31/2019) | |
|---|---|---|---|
| Acclivity Mid Cap Multi-Style Fund | 6.88% | 16.35% | 9.76% |
S&P 500® Index | 15.29% | 24.56% | 14.19% |
Russell Midcap® Index | 4.96% | 12.88% | 8.78% |
Fund Statistics
| Net Assets | $3,951,990 |
| Number of Portfolio Holdings | 317 |
| Advisory Fee (net of waivers) | $0 |
| Portfolio Turnover | 58% |
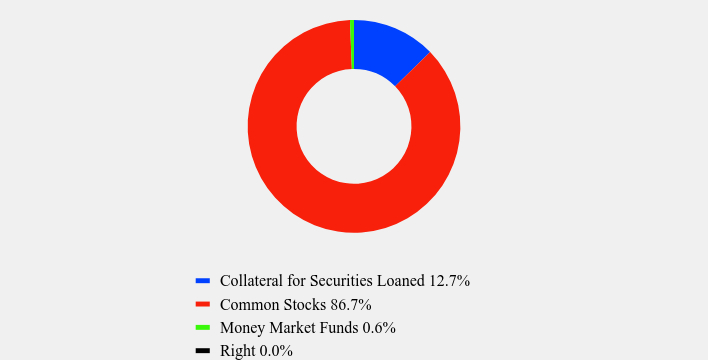
Asset Weighting (% of total investments)
| Value | Value |
|---|---|
| Collateral for Securities Loaned | 12.7% |
| Common Stocks | 86.7% |
| Money Market Funds | 0.6% |
| Right | 0.0% |
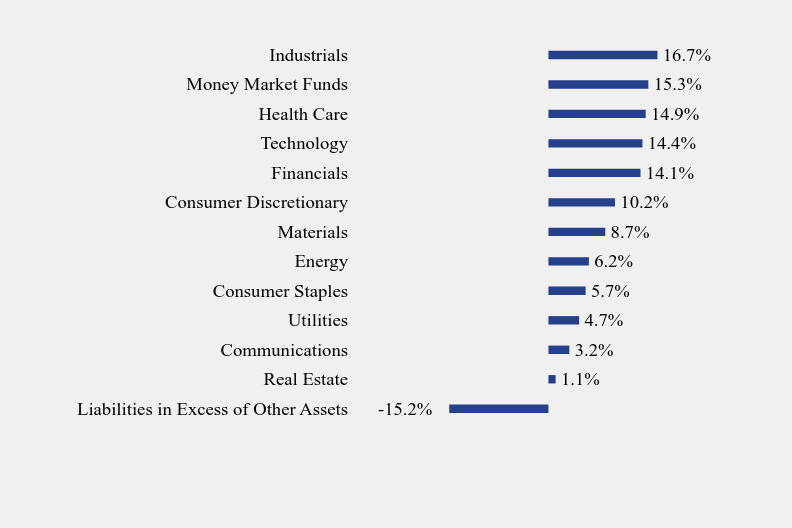
What did the Fund invest in?
Sector Weighting (% of net assets)
| Value | Value |
|---|---|
| Liabilities in Excess of Other Assets | -15.2% |
| Real Estate | 1.1% |
| Communications | 3.2% |
| Utilities | 4.7% |
| Consumer Staples | 5.7% |
| Energy | 6.2% |
| Materials | 8.7% |
| Consumer Discretionary | 10.2% |
| Financials | 14.1% |
| Technology | 14.4% |
| Health Care | 14.9% |
| Money Market Funds | 15.3% |
| Industrials | 16.7% |
Top 10 Holdings (% of net assets)
| Holding Name | % of Net Assets |
| Mount Vernon Liquid Assets Portfolio | 14.6% |
| Synchrony Financial | 1.1% |
| CenterPoint Energy, Inc. | 1.1% |
| Cincinnati Financial Corporation | 1.1% |
| Loews Corporation | 1.1% |
| Principal Financial Group, Inc. | 1.1% |
| News Corporation, Class A | 1.0% |
| Reinsurance Group of America, Inc. | 1.0% |
| CMS Energy Corporation | 1.0% |
| Fidelity National Financial, Inc. | 0.9% |
Material Fund Changes
No material changes occurred during the period ended June 30, 2024.

Acclivity Mid Cap Multi-Style Fund - Class I (AXMIX )
Semi-Annual Shareholder Report - June 30, 2024
Where can I find additional information about the Fund?
Additional information is available on the Fund's website ( https://www.innealtafunds.com/#front-page-3 ), including its:
Prospectus
Financial information
Holdings
Proxy voting information
TSR-Acclivity-MCI-SAR 063024
Acclivity Mid Cap Multi-Style Fund - Class N (AXMNX )
Class N (AXMNX )
Semi-Annual Shareholder Report - June 30, 2024

Fund Overview
This semi-annual shareholder report contains important information about Acclivity Mid Cap Multi-Style Fund for the period of January 1, 2024 to June 30, 2024. You can find additional information about the Fund at https://www.innealtafunds.com/#front-page-3. You can also request this information by contacting us at 855-873-3837.
What were the Fund’s costs for the last six months?
(based on a hypothetical $10,000 investment)
| Class Name | Costs of a $10,000 investment | Costs paid as a percentage of a $10,000 investment |
|---|---|---|
| Class N | $34 | 0.69% |
How has the Fund performed since inception?
Total Return Based on $10,000 Investment
| Acclivity Mid Cap Multi-Style Fund | S&P 500® Index | Russell Midcap® Index | |
|---|---|---|---|
| Dec-2019 | $10,000 | $10,000 | $10,000 |
| Jun-2020 | $8,450 | $9,692 | $9,087 |
| Jun-2021 | $12,840 | $13,646 | $13,613 |
| Jun-2022 | $11,342 | $12,197 | $11,258 |
| Jun-2023 | $13,068 | $14,587 | $12,939 |
| Jun-2024 | $15,205 | $18,169 | $14,604 |
Average Annual Total Returns
| 6 Months | 1 Year | Since Inception (12/31/2019) | |
|---|---|---|---|
| Acclivity Mid Cap Multi-Style Fund | 6.88% | 16.35% | 9.76% |
S&P 500® Index | 15.29% | 24.56% | 14.19% |
Russell Midcap® Index | 4.96% | 12.88% | 8.78% |
Fund Statistics
| Net Assets | $3,951,990 |
| Number of Portfolio Holdings | 317 |
| Advisory Fee (net of waivers) | $0 |
| Portfolio Turnover | 58% |
Asset Weighting (% of total investments)

| Value | Value |
|---|---|
| Collateral for Securities Loaned | 12.7% |
| Common Stocks | 86.7% |
| Money Market Funds | 0.6% |
| Right | 0.0% |
What did the Fund invest in?
Sector Weighting (% of net assets)

| Value | Value |
|---|---|
| Liabilities in Excess of Other Assets | -15.2% |
| Real Estate | 1.1% |
| Communications | 3.2% |
| Utilities | 4.7% |
| Consumer Staples | 5.7% |
| Energy | 6.2% |
| Materials | 8.7% |
| Consumer Discretionary | 10.2% |
| Financials | 14.1% |
| Technology | 14.4% |
| Health Care | 14.9% |
| Money Market Funds | 15.3% |
| Industrials | 16.7% |
Top 10 Holdings (% of net assets)
| Holding Name | % of Net Assets |
| Mount Vernon Liquid Assets Portfolio | 14.6% |
| Synchrony Financial | 1.1% |
| CenterPoint Energy, Inc. | 1.1% |
| Cincinnati Financial Corporation | 1.1% |
| Loews Corporation | 1.1% |
| Principal Financial Group, Inc. | 1.1% |
| News Corporation, Class A | 1.0% |
| Reinsurance Group of America, Inc. | 1.0% |
| CMS Energy Corporation | 1.0% |
| Fidelity National Financial, Inc. | 0.9% |
Material Fund Changes
No material changes occurred during the period ended June 30, 2024.

Acclivity Mid Cap Multi-Style Fund - Class N (AXMNX )
Semi-Annual Shareholder Report - June 30, 2024
Where can I find additional information about the Fund?
Additional information is available on the Fund's website ( https://www.innealtafunds.com/#front-page-3 ), including its:
Prospectus
Financial information
Holdings
Proxy voting information
TSR-Acclivity-MCN-SAR 063024
Acclivity Small Cap Value Fund
Class I (AXVIX )
Semi-Annual Shareholder Report - June 30, 2024
Fund Overview
This semi-annual shareholder report contains important information about Acclivity Small Cap Value Fund for the period of January 1, 2024 to June 30, 2024. You can find additional information about the Fund at https://www.innealtafunds.com/#front-page-3. You can also request this information by contacting us at 855-873-3837.
What were the Fund’s costs for the last six months?
(based on a hypothetical $10,000 investment)
| Class Name | Costs of a $10,000 investment | Costs paid as a percentage of a $10,000 investment |
|---|---|---|
| Class I | $24 | 0.49% |
How has the Fund performed since inception?
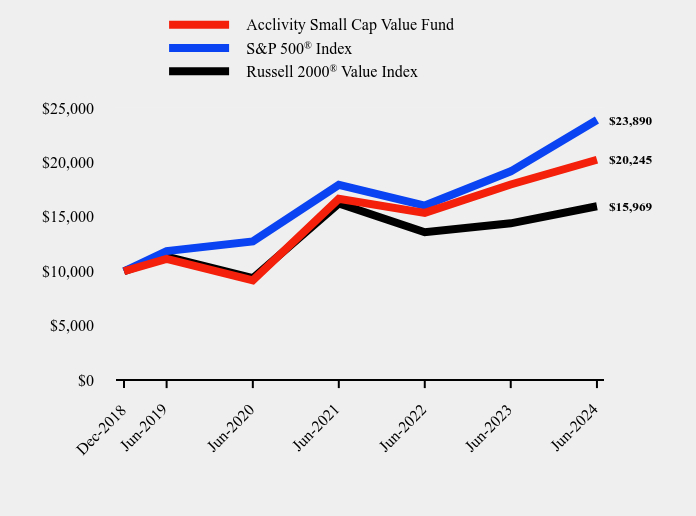
Total Return Based on $10,000 Investment

| Acclivity Small Cap Value Fund | S&P 500® Index | Russell 2000® Value Index | |
|---|---|---|---|
| Dec-2018 | $10,000 | $10,000 | $10,000 |
| Jun-2019 | $11,150 | $11,854 | $11,347 |
| Jun-2020 | $9,165 | $12,744 | $9,364 |
| Jun-2021 | $16,710 | $17,942 | $16,225 |
| Jun-2022 | $15,384 | $16,037 | $13,584 |
| Jun-2023 | $18,028 | $19,180 | $14,400 |
| Jun-2024 | $20,359 | $23,890 | $15,969 |
Average Annual Total Returns
| 6 Months | 1 Year | 5 Years | Since Inception (12/31/2018) | |
|---|---|---|---|---|
| Acclivity Small Cap Value Fund | - 1.61% | 12.93% | 12.80% | 13.81% |
S&P 500® Index | 15.29% | 24.56% | 15.05% | 17.17% |
Russell 2000® Value Index | - 0.85% | 10.90% | 7.07% | 8.89% |
The Fund's past performance is not a good predictor of how the Fund will perform in the future. The graph and table do not reflect the deduction of taxes that a shareholder would pay on fund distributions or redemption of fund shares.
Fund Statistics
| Net Assets | $34,703,619 |
| Number of Portfolio Holdings | 631 |
| Advisory Fee (net of waivers) | $0 |
| Portfolio Turnover | 50% |
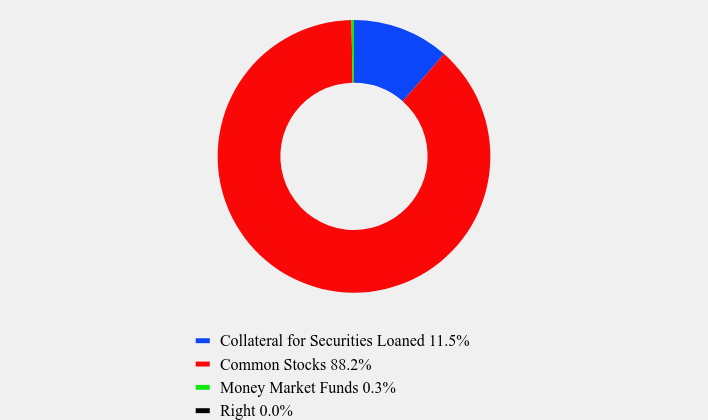
Asset Weighting (% of total investments)

| Value | Value |
|---|---|
| Collateral for Securities Loaned | 11.5% |
| Common Stocks | 88.2% |
| Money Market Funds | 0.3% |
| Right | 0.0% |
What did the Fund invest in?
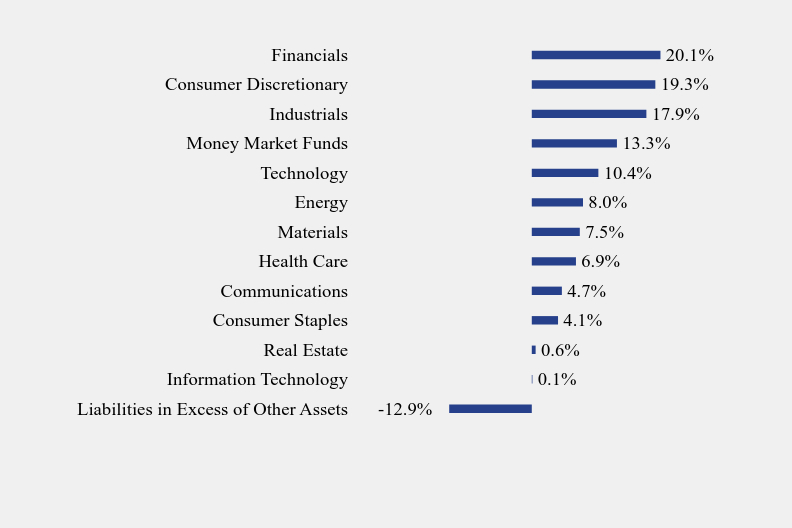
Sector Weighting (% of net assets)

| Value | Value |
|---|---|
| Liabilities in Excess of Other Assets | -12.9% |
| Information Technology | 0.1% |
| Real Estate | 0.6% |
| Consumer Staples | 4.1% |
| Communications | 4.7% |
| Health Care | 6.9% |
| Materials | 7.5% |
| Energy | 8.0% |
| Technology | 10.4% |
| Money Market Funds | 13.3% |
| Industrials | 17.9% |
| Consumer Discretionary | 19.3% |
| Financials | 20.1% |
Top 10 Holdings (% of net assets)
| Holding Name | % of Net Assets |
| Mount Vernon Liquid Assets Portfolio | 13.0% |
| Radian Group, Inc. | 1.0% |
| Oshkosh Corporation | 0.9% |
| Amkor Technology, Inc. | 0.9% |
| Taylor Morrison Home Corporation | 0.9% |
| Lithia Motors, Inc. | 0.8% |
| Macy's, Inc. | 0.8% |
| Genworth Financial, Inc., Class A | 0.8% |
| Topgolf Callaway Brands Corporation | 0.8% |
| Meritage Homes Corporation | 0.8% |
Material Fund Changes
No material changes occurred during the period ended June 30, 2024.

Acclivity Small Cap Value Fund - Class I (AXVIX )
Semi-Annual Shareholder Report - June 30, 2024
Where can I find additional information about the Fund?
Additional information is available on the Fund's website ( https://www.innealtafunds.com/#front-page-3 ), including its:
Prospectus
Financial information
Holdings
Proxy voting information
TSR-Acclivity-SCI-SAR 063024
Acclivity Small Cap Value Fund
Class N (AXVNX )
Semi-Annual Shareholder Report - June 30, 2024

Fund Overview
This semi-annual shareholder report contains important information about Acclivity Small Cap Value Fund for the period of January 1, 2024 to June 30, 2024. You can find additional information about the Fund at https://www.innealtafunds.com/#front-page-3. You can also request this information by contacting us at 855-873-3837.
What were the Fund’s costs for the last six months?
(based on a hypothetical $10,000 investment)
| Class Name | Costs of a $10,000 investment | Costs paid as a percentage of a $10,000 investment |
|---|---|---|
| Class N | $39 | 0.74% |
How has the Fund performed since inception?
Total Return Based on $10,000 Investment
| Acclivity Small Cap Value Fund | S&P 500® Index | Russell 2000® Value Index | |
|---|---|---|---|
| Dec-2018 | $10,000 | $10,000 | $10,000 |
| Jun-2019 | $11,140 | $11,854 | $11,347 |
| Jun-2020 | $9,155 | $12,744 | $9,364 |
| Jun-2021 | $16,659 | $17,942 | $16,225 |
| Jun-2022 | $15,358 | $16,037 | $13,584 |
| Jun-2023 | $17,967 | $19,180 | $14,400 |
| Jun-2024 | $20,245 | $23,890 | $15,969 |
Average Annual Total Returns
| 6 Months | 1 Year | 5 Years | Since Inception (12/31/2018) | |
|---|---|---|---|---|
| Acclivity Small Cap Value Fund | - 1.69% | 12.68% | 12.69% | 13.69% |
S&P 500® Index | 15.29% | 24.56% | 15.05% | 17.17% |
Russell 2000® Value Index | - 0.85% | 10.90% | 7.07% | 8.89% |
The Fund's past performance is not a good predictor of how the Fund will perform in the future. The graph and table do not reflect the deduction of taxes that a shareholder would pay on fund distributions or redemption of fund shares.
Fund Statistics
| Net Assets | $34,703,619 |
| Number of Portfolio Holdings | 631 |
| Advisory Fee (net of waivers) | $0 |
| Portfolio Turnover | 50% |
Asset Weighting (% of total investments)
| Value | Value |
|---|---|
| Collateral for Securities Loaned | 11.5% |
| Common Stocks | 88.2% |
| Money Market Funds | 0.3% |
| Right | 0.0% |
What did the Fund invest in?
Sector Weighting (% of net assets)
| Value | Value |
|---|---|
| Liabilities in Excess of Other Assets | -12.9% |
| Information Technology | 0.1% |
| Real Estate | 0.6% |
| Consumer Staples | 4.1% |
| Communications | 4.7% |
| Health Care | 6.9% |
| Materials | 7.5% |
| Energy | 8.0% |
| Technology | 10.4% |
| Money Market Funds | 13.3% |
| Industrials | 17.9% |
| Consumer Discretionary | 19.3% |
| Financials | 20.1% |
Top 10 Holdings (% of net assets)
| Holding Name | % of Net Assets |
| Mount Vernon Liquid Assets Portfolio | 13.0% |
| Radian Group, Inc. | 1.0% |
| Oshkosh Corporation | 0.9% |
| Amkor Technology, Inc. | 0.9% |
| Taylor Morrison Home Corporation | 0.9% |
| Lithia Motors, Inc. | 0.8% |
| Macy's, Inc. | 0.8% |
| Genworth Financial, Inc., Class A | 0.8% |
| Topgolf Callaway Brands Corporation | 0.8% |
| Meritage Homes Corporation | 0.8% |
Material Fund Changes
No material changes occurred during the period ended June 30, 2024.

Acclivity Small Cap Value Fund - Class N (AXVNX )
Semi-Annual Shareholder Report - June 30, 2024
Where can I find additional information about the Fund?
Additional information is available on the Fund's website ( https://www.innealtafunds.com/#front-page-3 ), including its:
Prospectus
Financial information
Holdings
Proxy voting information
TSR-Acclivity-SCN-SAR 063024
| (b) | Not applicable |
Item 2. Code of Ethics. Not applicable.
Item 3. Audit Committee Financial Expert. Not applicable.
Item 4. Principal Accountant Fees and Services. Not applicable.
Item 5. Audit Committee of Listed Registrants. Not applicable to open-end investment companies.
Item 6. Investments. Schedule of investments in securities of unaffiliated issuers is included under Item 7.
Item 7. Financial Statements and Financial Highlights for Open-End Management Investment Companies.
(a)
Acclivity Mid Cap Multi-Style Fund
Acclivity Small Cap Value Fund
Semi-Annual Report
June 30, 2024
www.acclivityfunds.com
1 (855) 873-3837
Distributed by Northern Lights Distributors, LLC
Member FINRA
| ACCLIVITY MID CAP MULTI-STYLE FUND |
| SCHEDULE OF INVESTMENTS (Unaudited) |
| June 30, 2024 |
| Shares | Value | |||||||
| COMMON STOCKS — 99.9% | ||||||||
| ADVERTISING & MARKETING - 1.1% | ||||||||
| 504 | Interpublic Group of Companies, Inc. (The) | $ | 14,661 | |||||
| 318 | Omnicom Group, Inc. (a) | 28,525 | ||||||
| 43,186 | ||||||||
| AEROSPACE & DEFENSE - 1.7% | ||||||||
| 48 | Huntington Ingalls Industries, Inc. | 11,824 | ||||||
| 61 | Teledyne Technologies, Inc.(b) | 23,667 | ||||||
| 245 | Textron, Inc. | 21,035 | ||||||
| 55 | Woodward, Inc. | 9,591 | ||||||
| 66,117 | ||||||||
| APPAREL & TEXTILE PRODUCTS - 1.1% | ||||||||
| 1 | Columbia Sportswear Company | 79 | ||||||
| 91 | Crocs, Inc.(b) | 13,280 | ||||||
| 1 | PVH Corporation | 106 | ||||||
| 232 | Skechers USA, Inc., Class A(b) | 16,036 | ||||||
| 305 | Tapestry, Inc. | 13,051 | ||||||
| 42,552 | ||||||||
| ASSET MANAGEMENT - 0.8% | ||||||||
| 1 | Ares Management Corporation, Class A | 133 | ||||||
| 469 | Blue Owl Capital, Inc. | 8,325 | ||||||
| 4 | Carlyle Group, Inc. (The) | 160 | ||||||
| 825 | Franklin Resources, Inc.(a) | 18,439 | ||||||
| 1 | Raymond James Financial, Inc. | 124 | ||||||
| 31 | Stifel Financial Corporation | 2,609 | ||||||
| 29,790 | ||||||||
| AUTOMOTIVE - 0.0%(c) | ||||||||
| 2 | BorgWarner, Inc. | 65 | ||||||
| 9 | Gentex Corporation | 303 | ||||||
| 1 | Lear Corporation | 114 | ||||||
| 482 | ||||||||
| BANKING - 1.9% | ||||||||
| 629 | Citizens Financial Group, Inc. | 22,663 | ||||||
| 132 | East West Bancorp, Inc.(a) | 9,666 | ||||||
| 805 | First Horizon Corporation | 12,695 | ||||||
| 201 | Huntington Bancshares, Inc. | 2,649 | ||||||
See accompanying notes to financial statements.
1
| ACCLIVITY MID CAP MULTI-STYLE FUND |
| SCHEDULE OF INVESTMENTS (Unaudited)(Continued) |
| June 30, 2024 |
| Shares | Value | |||||||
| COMMON STOCKS — 99.9% (Continued) | ||||||||
| BANKING - 1.9% (Continued) | ||||||||
| 1,368 | Regions Financial Corporation | $ | 27,415 | |||||
| 1 | SVB Financial Group(b) | — | ||||||
| 2 | Webster Financial Corporation | 87 | ||||||
| 75,175 | ||||||||
| BEVERAGES - 1.2% | ||||||||
| 198 | Celsius Holdings, Inc.(b) | 11,304 | ||||||
| 16 | Coca-Cola Consolidated, Inc. | 17,360 | ||||||
| 334 | Molson Coors Beverage Company, Class B(a) | 16,977 | ||||||
| 45,641 | ||||||||
| BIOTECHNOLOGY & PHARMACEUTICALS - 3.5% | ||||||||
| 1 | ACADIA Pharmaceuticals, Inc.(b) | 16 | ||||||
| 252 | BioMarin Pharmaceutical, Inc.(b) | 20,747 | ||||||
| 1 | Blueprint Medicines Corporation(b) | 108 | ||||||
| 815 | Elanco Animal Health, Inc.(b) | 11,761 | ||||||
| 34 | GRAIL, Inc.(b) | 520 | ||||||
| 440 | Incyte Corporation(b) | 26,673 | ||||||
| 187 | Neurocrine Biosciences, Inc.(b) | 25,744 | ||||||
| 161 | Sarepta Therapeutics, Inc.(b) | 25,438 | ||||||
| 1 | TG Therapeutics, Inc.(b) | 18 | ||||||
| 84 | United Therapeutics Corporation(b) | 26,758 | ||||||
| 137,783 | ||||||||
| CABLE & SATELLITE - 0.0%(c) | ||||||||
| 1 | Liberty Broadband Corporation - Series C(b) | 55 | ||||||
| CHEMICALS - 2.8% | ||||||||
| 172 | Albemarle Corporation | 16,429 | ||||||
| 1 | Ashland, Inc. | 95 | ||||||
| 108 | Avery Dennison Corporation | 23,614 | ||||||
| 148 | Celanese Corporation(a) | 19,964 | ||||||
| 195 | CF Industries Holdings, Inc. (a) | 14,453 | ||||||
| 186 | Eastman Chemical Company | 18,222 | ||||||
| 1 | FMC Corporation | 58 | ||||||
| 1 | International Flavors & Fragrances, Inc. | 95 | ||||||
| 513 | Mosaic Company (The) | 14,826 | ||||||
See accompanying notes to financial statements.
2
| ACCLIVITY MID CAP MULTI-STYLE FUND |
| SCHEDULE OF INVESTMENTS (Unaudited)(Continued) |
| June 30, 2024 |
| Shares | Value | |||||||
| COMMON STOCKS — 99.9% (Continued) | ||||||||
| CHEMICALS - 2.8% (Continued) | ||||||||
| 14 | RPM International, Inc. (a) | $ | 1,508 | |||||
| 1 | Valvoline, Inc.(b) | 43 | ||||||
| 109,307 | ||||||||
| COMMERCIAL SUPPORT SERVICES - 0.7% | ||||||||
| 362 | Aramark | 12,315 | ||||||
| 75 | Clean Harbors, Inc.(b) | 16,961 | ||||||
| 1 | ManpowerGroup, Inc. | 70 | ||||||
| 1 | Robert Half, Inc. | 64 | ||||||
| 1 | Stericycle, Inc.(b) | 58 | ||||||
| 29,468 | ||||||||
| CONSTRUCTION MATERIALS - 1.3% | ||||||||
| 97 | Advanced Drainage Systems, Inc. | 15,558 | ||||||
| 16 | Carlisle Companies, Inc. | 6,483 | ||||||
| 13 | Eagle Materials, Inc. | 2,827 | ||||||
| 1 | Martin Marietta Materials, Inc. | 542 | ||||||
| 151 | Owens Corning | 26,232 | ||||||
| 2 | Simpson Manufacturing Company, Inc. | 337 | ||||||
| 51,979 | ||||||||
| CONSUMER SERVICES - 0.3% | ||||||||
| 193 | Service Corp. International | 13,728 | ||||||
| CONTAINERS & PACKAGING - 2.6% | ||||||||
| 100 | AptarGroup, Inc. | 14,081 | ||||||
| 205 | Crown Holdings, Inc. | 15,250 | ||||||
| 533 | Graphic Packaging Holding Company | 13,970 | ||||||
| 483 | International Paper Company(a) | 20,841 | ||||||
| 106 | Packaging Corporation of America | 19,351 | ||||||
| 375 | Westrock Company | 18,848 | ||||||
| 102,341 | ||||||||
| DIVERSIFIED INDUSTRIALS - 0.3% | ||||||||
| 106 | ITT, Inc. | 13,693 | ||||||
| ELECTRIC UTILITIES - 3.9% | ||||||||
| 248 | Ameren Corporation(a) | 17,635 | ||||||
See accompanying notes to financial statements.
3
| ACCLIVITY MID CAP MULTI-STYLE FUND |
| SCHEDULE OF INVESTMENTS (Unaudited)(Continued) |
| June 30, 2024 |
| Shares | Value | |||||||
| COMMON STOCKS — 99.9% (Continued) | ||||||||
| ELECTRIC UTILITIES - 3.9% (Continued) | ||||||||
| 644 | Avangrid, Inc.(a) | $ | 22,881 | |||||
| 1,417 | CenterPoint Energy, Inc. | 43,899 | ||||||
| 633 | CMS Energy Corporation | 37,683 | ||||||
| 1 | IDACORP, Inc. | 93 | ||||||
| 394 | NRG Energy, Inc. | 30,677 | ||||||
| 152,868 | ||||||||
| ELECTRICAL EQUIPMENT - 2.4% | ||||||||
| 211 | A O Smith Corporation | 17,256 | ||||||
| 256 | API Group Corporation(b) | 9,633 | ||||||
| 113 | BWX Technologies, Inc. | 10,735 | ||||||
| 74 | Generac Holdings, Inc.(b) | 9,784 | ||||||
| 50 | Lennox International, Inc. (a) | 26,749 | ||||||
| 337 | Trimble, Inc.(b) | 18,845 | ||||||
| 4 | Vertiv Holdings Company | 346 | ||||||
| 93,348 | ||||||||
| ENGINEERING & CONSTRUCTION - 3.1% | ||||||||
| 185 | AECOM | 16,306 | ||||||
| 50 | Comfort Systems USA, Inc. | 15,206 | ||||||
| 70 | EMCOR Group, Inc. | 25,556 | ||||||
| 147 | Jacobs Solutions, Inc. | 20,537 | ||||||
| 157 | KBR, Inc. | 10,070 | ||||||
| 124 | MasTec, Inc.(a),(b) | 13,267 | ||||||
| 53 | Tetra Tech, Inc. | 10,837 | ||||||
| 33 | TopBuild Corporation(b) | 12,714 | ||||||
| 1 | WillScot Mobile Mini Holdings Corporation(b) | 38 | ||||||
| 124,531 | ||||||||
| FOOD - 1.6% | ||||||||
| 386 | Campbell Soup Company(a) | 17,443 | ||||||
| 751 | Conagra Brands, Inc. | 21,343 | ||||||
| 92 | Hormel Foods Corporation | 2,805 | ||||||
| 1 | Ingredion, Inc. | 115 | ||||||
| 19 | JM Smucker Company (The) | 2,072 | ||||||
| 211 | Lamb Weston Holdings, Inc. | 17,741 | ||||||
See accompanying notes to financial statements.
4
| ACCLIVITY MID CAP MULTI-STYLE FUND |
| SCHEDULE OF INVESTMENTS (Unaudited)(Continued) |
| June 30, 2024 |
| Shares | Value | |||||||
| COMMON STOCKS — 99.9% (Continued) | ||||||||
| FOOD - 1.6% (Continued) | ||||||||
| 1 | Lancaster Colony Corporation | $ | 189 | |||||
| 61,708 | ||||||||
| FORESTRY, PAPER & WOOD PRODUCTS - 0.3% | ||||||||
| 143 | Trex Company, Inc.(b) | 10,599 | ||||||
| 1 | UFP Industries, Inc. | 112 | ||||||
| 10,711 | ||||||||
| GAS & WATER UTILITIES - 0.8% | ||||||||
| 267 | Atmos Energy Corporation | 31,145 | ||||||
| 22 | NiSource, Inc.(a) | 634 | ||||||
| 31,779 | ||||||||
| HEALTH CARE FACILITIES & SERVICES - 5.4% | ||||||||
| 1 | Acadia Healthcare Company, Inc.(b) | 67 | ||||||
| 1 | Cardinal Health, Inc. | 98 | ||||||
| 186 | Catalent, Inc.(b) | 10,459 | ||||||
| 63 | Charles River Laboratories International, Inc.(a),(b) | 13,015 | ||||||
| 19 | Chemed Corporation | 10,309 | ||||||
| 119 | DaVita, Inc.(b) | 16,490 | ||||||
| 171 | Encompass Health Corporation | 14,670 | ||||||
| 64 | Henry Schein, Inc.(b) | 4,102 | ||||||
| 115 | Labcorp Holdings, Inc. | 23,404 | ||||||
| 38 | Medpace Holdings, Inc.(b) | 15,650 | ||||||
| 102 | Molina Healthcare, Inc.(a),(b) | 30,325 | ||||||
| 149 | Quest Diagnostics, Inc. | 20,395 | ||||||
| 177 | Tenet Healthcare Corporation(b) | 23,546 | ||||||
| 160 | Universal Health Services, Inc., Class B | 29,589 | ||||||
| 212,119 | ||||||||
| HOME & OFFICE PRODUCTS - 0.3% | ||||||||
| 254 | Tempur Sealy International, Inc. | 12,024 | ||||||
| HOME CONSTRUCTION - 0.9% | ||||||||
| 147 | Fortune Brands Innovations, Inc. | 9,546 | ||||||
| 317 | Masco Corporation | 21,135 | ||||||
| 41 | Toll Brothers, Inc. | 4,722 | ||||||
| 35,403 | ||||||||
See accompanying notes to financial statements.
5
| ACCLIVITY MID CAP MULTI-STYLE FUND |
| SCHEDULE OF INVESTMENTS (Unaudited)(Continued) |
| June 30, 2024 |
| Shares | Value | |||||||
| COMMON STOCKS — 99.9% (Continued) | ||||||||
| HOUSEHOLD PRODUCTS - 0.6% | ||||||||
| 182 | Clorox Company (The) | $ | 24,838 | |||||
| 2 | Coty, Inc., Class A(b) | 20 | ||||||
| 24,858 | ||||||||
| INDUSTRIAL INTERMEDIATE PRODUCTS - 0.2% | ||||||||
| 31 | RBC Bearings, Inc.(b) | 8,363 | ||||||
| 1 | Timken Company (The) | 80 | ||||||
| 8,443 | ||||||||
| INDUSTRIAL SUPPORT SERVICES - 0.8% | ||||||||
| 1 | United Rentals, Inc. | 647 | ||||||
| 35 | Watsco, Inc. | 16,213 | ||||||
| 83 | WESCO International, Inc. | 13,157 | ||||||
| 30,017 | ||||||||
| INSTITUTIONAL FINANCIAL SERVICES - 1.5% | ||||||||
| 35 | Houlihan Lokey, Inc. | 4,720 | ||||||
| 346 | Jefferies Financial Group, Inc. | 17,217 | ||||||
| 264 | Northern Trust Corporation | 22,171 | ||||||
| 214 | SEI Investments Company | 13,843 | ||||||
| 2 | Tradeweb Markets, Inc., Class A | 212 | ||||||
| 58,163 | ||||||||
| INSURANCE - 7.9% | ||||||||
| 203 | American Financial Group, Inc. | 24,973 | ||||||
| 159 | Assurant, Inc. | 26,434 | ||||||
| 364 | Cincinnati Financial Corporation | 42,988 | ||||||
| 464 | Equitable Holdings, Inc. | 18,959 | ||||||
| 1 | Globe Life, Inc. | 82 | ||||||
| 40 | Kinsale Capital Group, Inc. | 15,411 | ||||||
| 558 | Loews Corporation | 41,705 | ||||||
| 1 | Markel Group, Inc.(b) | 1,576 | ||||||
| 846 | Old Republic International Corporation | 26,141 | ||||||
| 1 | Primerica, Inc. | 237 | ||||||
| 529 | Principal Financial Group, Inc. | 41,500 | ||||||
| 1 | Radian Group, Inc. | 31 | ||||||
| 184 | Reinsurance Group of America, Inc. | 37,770 | ||||||
See accompanying notes to financial statements.
6
| ACCLIVITY MID CAP MULTI-STYLE FUND |
| SCHEDULE OF INVESTMENTS (Unaudited)(Continued) |
| June 30, 2024 |
| Shares | Value | |||||||
| COMMON STOCKS — 99.9% (Continued) | ||||||||
| INSURANCE - 7.9% (Continued) | ||||||||
| 680 | Unum Group | $ | 34,755 | |||||
| 312,562 | ||||||||
| INTERNET MEDIA & SERVICES - 1.1% | ||||||||
| 177 | Expedia Group, Inc.(a),(b) | 22,300 | ||||||
| 48 | GoDaddy, Inc., Class A(b) | 6,706 | ||||||
| 35 | Match Group, Inc.(b) | 1,063 | ||||||
| 2 | Roku, Inc.(b) | 120 | ||||||
| 50 | Snap, Inc., Class A(a),(b) | 831 | ||||||
| 1 | TripAdvisor, Inc.(b) | 18 | ||||||
| 271 | Zillow Group, Inc., Class C(b) | 12,572 | ||||||
| 43,610 | ||||||||
| LEISURE FACILITIES & SERVICES - 1.9% | ||||||||
| 175 | Darden Restaurants, Inc. | 26,481 | ||||||
| 22 | Domino’s Pizza, Inc. | 11,359 | ||||||
| 15 | DraftKings, Inc., Class A(b) | 573 | ||||||
| 144 | Light & Wonder, Inc.(b) | 15,103 | ||||||
| 89 | Texas Roadhouse, Inc. | 15,282 | ||||||
| 1 | Vail Resorts, Inc. | 180 | ||||||
| 19 | Wingstop, Inc. | 8,030 | ||||||
| 1 | Wyndham Hotels & Resorts, Inc. | 74 | ||||||
| 77,082 | ||||||||
| LEISURE PRODUCTS - 0.3% | ||||||||
| 1 | Axon Enterprise, Inc.(b) | 294 | ||||||
| 182 | Hasbro, Inc. | 10,647 | ||||||
| 1 | Thor Industries, Inc. | 94 | ||||||
| 11,035 | ||||||||
| MACHINERY - 4.3% | ||||||||
| 5 | AGCO Corporation | 490 | ||||||
| 46 | Curtiss-Wright Corporation | 12,465 | ||||||
| 213 | Donaldson Company, Inc. | 15,242 | ||||||
| 1 | Enovis Corporation(b) | 45 | ||||||
| 1 | Flowserve Corporation | 48 | ||||||
| 196 | Graco, Inc. | 15,539 | ||||||
| 83 | IDEX Corporation | 16,700 | ||||||
See accompanying notes to financial statements.
7
| ACCLIVITY MID CAP MULTI-STYLE FUND |
| SCHEDULE OF INVESTMENTS (Unaudited)(Continued) |
| June 30, 2024 |
| Shares | Value | |||||||
| COMMON STOCKS — 99.9% (Continued) | ||||||||
| MACHINERY - 4.3% (Continued) | ||||||||
| 76 | Lincoln Electric Holdings, Inc. | $ | 14,337 | |||||
| 2 | Middleby Corporation (The)(b) | 245 | ||||||
| 66 | Nordson Corporation | 15,308 | ||||||
| 1 | Oshkosh Corporation | 108 | ||||||
| 140 | Regal Rexnord Corporation | 18,931 | ||||||
| 106 | Snap-on, Inc. | 27,707 | ||||||
| 193 | Stanley Black & Decker, Inc. | 15,419 | ||||||
| 167 | Toro Company (The) | 15,616 | ||||||
| 168,200 | ||||||||
| MEDICAL EQUIPMENT & DEVICES - 6.0% | ||||||||
| 93 | Align Technology, Inc.(b) | 22,453 | ||||||
| 756 | Avantor, Inc.(b) | 16,027 | ||||||
| 696 | Baxter International, Inc.(a) | 23,281 | ||||||
| 39 | Bio-Rad Laboratories, Inc., Class A(b) | 10,651 | ||||||
| 85 | Bio-Techne Corporation | 6,090 | ||||||
| 203 | Bruker Corporation | 12,954 | ||||||
| 241 | Cooper Companies, Inc. (The) | 21,040 | ||||||
| 133 | Exact Sciences Corporation(b) | 5,619 | ||||||
| 170 | Globus Medical, Inc., Class A(b) | 11,643 | ||||||
| 288 | Hologic, Inc.(b) | 21,384 | ||||||
| 203 | Illumina, Inc.(b) | 21,189 | ||||||
| 86 | Insulet Corporation(b) | 17,355 | ||||||
| 1 | Penumbra, Inc.(b) | 180 | ||||||
| 36 | Repligen Corporation(a),(b) | 4,538 | ||||||
| 164 | Revvity, Inc. | 17,197 | ||||||
| 57 | Teleflex, Inc. | 11,989 | ||||||
| 47 | Waters Corporation(b) | 13,636 | ||||||
| 237,226 | ||||||||
| METALS & MINING - 0.0%(c) | ||||||||
| 13 | Cleveland-Cliffs, Inc.(b) | 200 | ||||||
| OIL & GAS PRODUCERS - 6.2% | ||||||||
| 418 | Antero Resources Corporation(b) | 13,639 | ||||||
See accompanying notes to financial statements.
8
| ACCLIVITY MID CAP MULTI-STYLE FUND |
| SCHEDULE OF INVESTMENTS (Unaudited)(Continued) |
| June 30, 2024 |
| Shares | Value | |||||||
| COMMON STOCKS — 99.9% (Continued) | ||||||||
| OIL & GAS PRODUCERS - 6.2% (Continued) | ||||||||
| 795 | APA Corporation(a) | $ | 23,405 | |||||
| 191 | Chesapeake Energy Corporation(a) | 15,698 | ||||||
| 98 | Chord Energy Corporation(a) | 16,433 | ||||||
| 519 | Coterra Energy, Inc. | 13,842 | ||||||
| 648 | EQT Corporation(a) | 23,963 | ||||||
| 520 | HF Sinclair Corporation | 27,737 | ||||||
| 764 | Marathon Oil Corporation | 21,904 | ||||||
| 2 | Matador Resources Company | 119 | ||||||
| 31 | Murphy USA, Inc.(a) | 14,553 | ||||||
| 1 | ONEOK, Inc. | 82 | ||||||
| 742 | Ovintiv, Inc. | 34,778 | ||||||
| 1,039 | Permian Resources Corporation(a) | 16,780 | ||||||
| 304 | Range Resources Corporation | 10,193 | ||||||
| 1,961 | Southwestern Energy Company(b) | 13,197 | ||||||
| 246,323 | ||||||||
| OIL & GAS SERVICES & EQUIPMENT - 0.0%(c) | ||||||||
| 1 | NOV, Inc. | 19 | ||||||
| PUBLISHING & BROADCASTING - 1.0% | ||||||||
| 7 | New York Times Company (The), Class A | 358 | ||||||
| 1,375 | News Corporation, Class A | 37,909 | ||||||
| 38,267 | ||||||||
| REAL ESTATE SERVICES - 0.7% | ||||||||
| 137 | Jones Lang LaSalle, Inc.(a),(b) | 28,123 | ||||||
| REIT - 0.4% | ||||||||
| 22 | Texas Pacific Land Corporation | 16,154 | ||||||
| RENEWABLE ENERGY - 0.0%(c) | ||||||||
| 4 | First Solar, Inc.(b) | 902 | ||||||
| RETAIL - CONSUMER STAPLES - 1.3% | ||||||||
| 194 | BJ’s Wholesale Club Holdings, Inc.(b) | 17,041 | ||||||
| 69 | Casey’s General Stores, Inc. (a) | 26,328 | ||||||
See accompanying notes to financial statements.
9
| ACCLIVITY MID CAP MULTI-STYLE FUND |
| SCHEDULE OF INVESTMENTS (Unaudited)(Continued) |
| June 30, 2024 |
| Shares | Value | |||||||
| COMMON STOCKS — 99.9% (Continued) | ||||||||
| RETAIL - CONSUMER STAPLES - 1.3% (Continued) | ||||||||
| 3 | Five Below, Inc.(b) | $ | 327 | |||||
| 1 | Ollie’s Bargain Outlet Holdings, Inc.(b) | 98 | ||||||
| 116 | Sprouts Farmers Market, Inc.(b) | 9,704 | ||||||
| 53,498 | ||||||||
| RETAIL - DISCRETIONARY - 4.5% | ||||||||
| 65 | Abercrombie & Fitch Company, Class A(a),(b) | 11,560 | ||||||
| 161 | Bath & Body Works, Inc. | 6,287 | ||||||
| 309 | Best Buy Company, Inc. | 26,046 | ||||||
| 160 | Builders FirstSource, Inc.(a),(b) | 22,145 | ||||||
| 85 | Burlington Stores, Inc.(a),(b) | 20,400 | ||||||
| 119 | Dick’s Sporting Goods, Inc. | 25,567 | ||||||
| 91 | Floor & Decor Holdings, Inc., Class A(a),(b) | 9,046 | ||||||
| 462 | Gap, Inc. (The) | 11,037 | ||||||
| 105 | Genuine Parts Company | 14,524 | ||||||
| 1 | Tractor Supply Company | 270 | ||||||
| 69 | Ulta Beauty, Inc.(b) | 26,625 | ||||||
| 14 | Williams-Sonoma, Inc.(a) | 3,953 | ||||||
| 177,460 | ||||||||
| SEMICONDUCTORS - 2.8% | ||||||||
| 1 | Azenta, Inc.(b) | 52 | ||||||
| 169 | Coherent Corporation(b) | 12,246 | ||||||
| 157 | Entegris, Inc. | 21,258 | ||||||
| 161 | Lattice Semiconductor Corporation(a),(b) | 9,336 | ||||||
| 89 | MKS Instruments, Inc.(a) | 11,622 | ||||||
| 1 | Monolithic Power Systems, Inc. | 822 | ||||||
| 2 | Onto Innovation, Inc.(b) | 439 | ||||||
| 162 | Qorvo, Inc.(b) | 18,798 | ||||||
| 215 | Skyworks Solutions, Inc. | 22,915 | ||||||
| 18 | Teradyne, Inc. | 2,669 | ||||||
| 55 | Universal Display Corporation | 11,564 | ||||||
| 111,721 | ||||||||
| SOFTWARE - 6.1% | ||||||||
| 1 | ACI Worldwide, Inc.(b) | 40 | ||||||
| 255 | Akamai Technologies, Inc.(a),(b) | 22,970 | ||||||
See accompanying notes to financial statements.
10
| ACCLIVITY MID CAP MULTI-STYLE FUND |
| SCHEDULE OF INVESTMENTS (Unaudited)(Continued) |
| June 30, 2024 |
| Shares | Value | |||||||
| COMMON STOCKS — 99.9% (Continued) | ||||||||
| SOFTWARE - 6.1% (Continued) | ||||||||
| 48 | Appfolio, Inc., Class A(b) | $ | 11,739 | |||||
| 2 | Aspen Technology, Inc.(b) | 397 | ||||||
| 1 | BILL Holdings, Inc.(b) | 53 | ||||||
| 118 | Dayforce, Inc.(a),(b) | 5,853 | ||||||
| 281 | DocuSign, Inc.(b) | 15,034 | ||||||
| 303 | Dynatrace, Inc.(b) | 13,556 | ||||||
| 1 | Five9, Inc.(b) | 44 | ||||||
| 1,185 | Gen Digital, Inc. | 29,601 | ||||||
| 90 | Manhattan Associates, Inc.(b) | 22,201 | ||||||
| 1 | MicroStrategy, Inc., Class A(b) | 1,378 | ||||||
| 56 | Nutanix, Inc., Class A(b) | 3,184 | ||||||
| 194 | Okta, Inc.(b) | 18,160 | ||||||
| 116 | Paycom Software, Inc. | 16,593 | ||||||
| 66 | Paylocity Holding Corporation(a),(b) | 8,702 | ||||||
| 347 | SS&C Technologies Holdings, Inc. | 21,747 | ||||||
| 277 | Twilio, Inc., Class A(b) | 15,736 | ||||||
| 6 | Tyler Technologies, Inc.(a),(b) | 3,017 | ||||||
| 122 | UiPath, Inc., Class A(b) | 1,547 | ||||||
| 27 | Unity Software, Inc.(a),(b) | 439 | ||||||
| 1 | Ziff Davis, Inc.(b) | 55 | ||||||
| 476 | Zoom Video Communications, Inc., Class A(b) | 28,174 | ||||||
| 240,220 | ||||||||
| SPECIALTY FINANCE - 2.0% | ||||||||
| 721 | Fidelity National Financial, Inc.(a) | 35,632 | ||||||
| 1 | MGIC Investment Corporation | 22 | ||||||
| 950 | Synchrony Financial | 44,830 | ||||||
| 80,484 | ||||||||
| STEEL - 1.8% | ||||||||
| 88 | Reliance, Inc.(a) | 25,133 | ||||||
| 243 | Steel Dynamics, Inc. | 31,468 | ||||||
| 355 | United States Steel Corporation(a) | 13,419 | ||||||
| 70,020 | ||||||||
| TECHNOLOGY HARDWARE - 2.0% | ||||||||
| 1 | Ciena Corporation(b) | 48 | ||||||
See accompanying notes to financial statements.
11
| ACCLIVITY MID CAP MULTI-STYLE FUND |
| SCHEDULE OF INVESTMENTS (Unaudited)(Continued) |
| June 30, 2024 |
| Shares | Value | |||||||
| COMMON STOCKS — 99.9% (Continued) | ||||||||
| TECHNOLOGY HARDWARE - 2.0% (Continued) | ||||||||
| 11 | Dolby Laboratories, Inc., Class A | $ | 871 | |||||
| 101 | F5, Inc.(b) | 17,395 | ||||||
| 178 | Jabil, Inc. | 19,365 | ||||||
| 494 | Juniper Networks, Inc. | 18,011 | ||||||
| 1 | Lumentum Holdings, Inc.(b) | 51 | ||||||
| 6 | NetApp, Inc. | 773 | ||||||
| 42 | Pure Storage, Inc., Class A(b) | 2,697 | ||||||
| 1 | Super Micro Computer, Inc.(b) | 819 | ||||||
| 117 | TD SYNNEX Corporation | 13,502 | ||||||
| 2 | Western Digital Corporation(b) | 152 | ||||||
| 16 | Zebra Technologies Corporation, Class A(a),(b) | 4,943 | ||||||
| 78,627 | ||||||||
| TECHNOLOGY SERVICES - 3.5% | ||||||||
| 1 | Affirm Holdings, Inc.(b) | 30 | ||||||
| 188 | Booz Allen Hamilton Holding Corporation | 28,933 | ||||||
| 29 | CACI International, Inc., Class A(b) | 12,474 | ||||||
| 115 | Corpay, Inc.(b) | 30,637 | ||||||
| 70 | EPAM Systems, Inc.(b) | 13,168 | ||||||
| 11 | FactSet Research Systems, Inc. | 4,491 | ||||||
| 12 | Jack Henry & Associates, Inc. | 1,992 | ||||||
| 34 | Leidos Holdings, Inc. | 4,960 | ||||||
| 37 | MarketAxess Holdings, Inc. | 7,420 | ||||||
| 50 | Morningstar, Inc. | 14,793 | ||||||
| 1 | Science Applications International Corporation | 118 | ||||||
| 249 | TransUnion | 18,466 | ||||||
| 1 | WEX, Inc.(b) | 177 | ||||||
| 137,659 | ||||||||
| TRANSPORTATION & LOGISTICS - 3.2% | ||||||||
| 162 | CH Robinson Worldwide, Inc. | 14,276 | ||||||
| 217 | Expeditors International of Washington, Inc. | 27,079 | ||||||
| 168 | JB Hunt Transport Services, Inc. | 26,880 | ||||||
| 45 | Knight-Swift Transportation Holdings, Inc. | 2,246 | ||||||
| 23 | Saia, Inc.(b) | 10,909 | ||||||
| 952 | Southwest Airlines Company | 27,237 | ||||||
See accompanying notes to financial statements.
12
| ACCLIVITY MID CAP MULTI-STYLE FUND |
| SCHEDULE OF INVESTMENTS (Unaudited)(Continued) |
| June 30, 2024 |
| Shares | Value | |||||||
| COMMON STOCKS — 99.9% (Continued) | ||||||||
| TRANSPORTATION & LOGISTICS - 3.2% (Continued) | ||||||||
| 166 | XPO, Inc.(a),(b) | $ | 17,621 | |||||
| 126,248 | ||||||||
| WHOLESALE - CONSUMER STAPLES - 1.0% | ||||||||
| 379 | Performance Food Group Company(b) | 25,056 | ||||||
| 291 | US Foods Holding Corporation(a),(b) | 15,417 | ||||||
| 40,473 | ||||||||
| WHOLESALE - DISCRETIONARY - 0.8% | ||||||||
| 456 | LKQ Corporation | 18,965 | ||||||
| 48 | Pool Corporation(a) | 14,752 | ||||||
| 33,717 | ||||||||
| TOTAL COMMON STOCKS (Cost $3,768,795) | 3,947,099 | |||||||
| RIGHTS — 0.0%(c) | ||||||||
| BIOTECHNOLOGY & PHARMACEUTICALS - 0.0%(c) | ||||||||
| 1 | Bristol-Myers Squibb Company (b)(d) | 1 | ||||||
| MEDICAL EQUIPMENT & DEVICES - 0.0%(c) | ||||||||
| 7 | ABIOMED, Inc. - CVR(b)(d) | 7 | ||||||
| TOTAL RIGHTS (Cost $8) | 8 | |||||||
| SHORT-TERM INVESTMENTS — 15.3% | ||||||||
| COLLATERAL FOR SECURITIES LOANED — 14.6% | ||||||||
| 577,846 | Mount Vernon Liquid Assets Portfolio, 5.46%(e),(f) | 577,846 | ||||||
| MONEY MARKET FUND - 0.7% | ||||||||
| 29,504 | First American Treasury Obligations Fund, Class X, 5.21%(e) | 29,504 | ||||||
| TOTAL SHORT-TERM INVESTMENTS (Cost $607,350) | 607,350 | |||||||
| TOTAL INVESTMENTS - 115.2% (Cost $4,376,153) | $ | 4,554,457 | ||||||
| LIABILITIES IN EXCESS OF OTHER ASSETS - (15.2)% | (602,467 | ) | ||||||
| NET ASSETS - 100.0% | $ | 3,951,990 | ||||||
See accompanying notes to financial statements.
13
| ACCLIVITY MID CAP MULTI-STYLE FUND |
| SCHEDULE OF INVESTMENTS (Unaudited)(Continued) |
| June 30, 2024 |
| (a) | All or a portion of the security is on loan. The total fair value of the securities on loan as of June 30, 2024 was $564,759. |
| (b) | Non-income producing security. |
| (c) | Amount represents less than 0.05%. |
| (d) | Fair value was determined using significant unobservable inputs. See Note 2. |
| (e) | Rate disclosed is the seven day effective yield as of June 30, 2024. |
| (f) | This security was purchased with cash collateral held from securities on loan. The total value of such securities as of June 30, 2024 is $577,846. |
See accompanying notes to financial statements.
14
| ACCLIVITY SMALL CAP VALUE FUND |
| SCHEDULE OF INVESTMENTS (Unaudited) |
| June 30, 2024 |
| Shares | Value | |||||||
| COMMON STOCKS — 99.6% | ||||||||
| AEROSPACE & DEFENSE - 0.2% | ||||||||
| 666 | AAR Corporation(a) | $ | 48,418 | |||||
| 5 | Barnes Group, Inc. | 207 | ||||||
| 3 | Ducommun, Inc.(a) | 174 | ||||||
| 579 | Mercury Systems, Inc.(a) | 15,627 | ||||||
| 63 | Moog, Inc., Class A | 10,540 | ||||||
| 71 | National Presto Industries, Inc. | 5,335 | ||||||
| 80,301 | ||||||||
| APPAREL & TEXTILE PRODUCTS - 0.6% | ||||||||
| 340 | Jerash Holdings US, Inc. | 1,037 | ||||||
| 420 | Lakeland Industries, Inc. | 9,635 | ||||||
| 1,005 | Movado Group, Inc. | 24,984 | ||||||
| 121 | PVH Corporation(b) | 12,810 | ||||||
| 569 | Rocky Brands, Inc. | 21,030 | ||||||
| 607 | Superior Group of Companies, Inc. | 11,478 | ||||||
| 149 | Tandy Leather Factory, Inc.(a) | 670 | ||||||
| 14,158 | Under Armour, Inc., Class A(a),(b) | 94,434 | ||||||
| 784 | Weyco Group, Inc. | 23,771 | ||||||
| 199,849 | ||||||||
| ASSET MANAGEMENT - 0.5% | ||||||||
| 15 | Associated Capital Group, Inc., Class A | 510 | ||||||
| 2,637 | Cannae Holdings, Inc. | 47,835 | ||||||
| 39 | Hennessy Advisors, Inc. | 278 | ||||||
| 27 | Kennedy-Wilson Holdings, Inc.(b) | 263 | ||||||
| 2,600 | Medallion Financial Corporation | 19,968 | ||||||
| 1,654 | ODP Corporation (The)(a) | 64,953 | ||||||
| 1,107 | Oppenheimer Holdings, Inc., Class A | 53,036 | ||||||
| 186,843 | ||||||||
| AUTOMOTIVE - 2.6% | ||||||||
| 3,076 | American Axle & Manufacturing Holdings, Inc.(a) | 21,501 | ||||||
| 7,186 | BorgWarner, Inc. | 231,677 | ||||||
| 14,860 | Goodyear Tire & Rubber Company (The)(a) | 168,661 | ||||||
| 7,462 | Harley-Davidson, Inc.(b) | 250,275 | ||||||
| 1,365 | Lear Corporation | 155,897 | ||||||
| 716 | Methode Electronics, Inc. | 7,411 | ||||||
See accompanying notes to financial statements.
15
| ACCLIVITY SMALL CAP VALUE FUND |
| SCHEDULE OF INVESTMENTS (Unaudited)(Continued) |
| June 30, 2024 |
| Shares | Value | |||||||
| COMMON STOCKS — 99.6% (Continued) | ||||||||
| AUTOMOTIVE - 2.6% (Continued) | ||||||||
| 712 | Miller Industries, Inc. | $ | 39,174 | |||||
| 786 | Motorcar Parts of America, Inc.(a) | 4,850 | ||||||
| 876 | Standard Motor Products, Inc. | 24,291 | ||||||
| 903,737 | ||||||||
| BANKING - 12.1% | ||||||||
| 2,795 | Ameris Bancorp | 140,728 | ||||||
| 18 | Atlantic Union Bankshares Corporation | 591 | ||||||
| 435 | Banc of California, Inc. | 5,559 | ||||||
| 1,120 | Bank OZK | 45,920 | ||||||
| 845 | BankFinancial Corporation | 8,695 | ||||||
| 238 | BankUnited, Inc. | 6,966 | ||||||
| 1,017 | Banner Corporation | 50,484 | ||||||
| 398 | Bar Harbor Bankshares | 10,698 | ||||||
| 512 | BayCom Corporation | 10,419 | ||||||
| 765 | Berkshire Hills Bancorp, Inc. | 17,442 | ||||||
| 12 | Business First Bancshares, Inc. | 261 | ||||||
| 2,014 | Byline Bancorp, Inc. | 47,812 | ||||||
| 443 | C&F Financial Corporation | 21,353 | ||||||
| 4,854 | Cadence Bank | 137,271 | ||||||
| 144 | Camden National Corporation | 4,752 | ||||||
| 426 | Capital City Bank Group, Inc. | 12,115 | ||||||
| 59 | Carter Bankshares, Inc.(a) | 892 | ||||||
| 474 | Cathay General Bancorp | 17,879 | ||||||
| 49 | CB Financial Services, Inc. | 1,110 | ||||||
| 965 | Central Pacific Financial Corporation | 20,458 | ||||||
| 514 | Citizens Community Bancorp, Inc. | 5,947 | ||||||
| 656 | Civista Bancshares, Inc. | 10,161 | ||||||
| 649 | CNB Financial Corporation | 13,246 | ||||||
| 378 | Colony Bankcorp, Inc. | 4,631 | ||||||
| 837 | Community Trust Bancorp, Inc. | 36,543 | ||||||
| 41 | Community West Bancshares | 759 | ||||||
| 1,535 | Customers Bancorp, Inc.(a) | 73,649 | ||||||
| 2,214 | CVB Financial Corporation | 38,169 | ||||||
| 166 | Eagle Bancorp Montana, Inc. | 2,203 | ||||||
See accompanying notes to financial statements.
16
| ACCLIVITY SMALL CAP VALUE FUND |
| SCHEDULE OF INVESTMENTS (Unaudited)(Continued) |
| June 30, 2024 |
| Shares | Value | |||||||
| COMMON STOCKS — 99.6% (Continued) | ||||||||
| BANKING - 12.1% (Continued) | ||||||||
| 5,992 | Eastern Bankshares, Inc.(b) | $ | 83,768 | |||||
| 769 | Enterprise Financial Services Corporation | 31,460 | ||||||
| 1,287 | Financial Institutions, Inc. | 24,865 | ||||||
| 1,364 | First Bancorp | 43,539 | ||||||
| 1,368 | First Bancshares, Inc. (The) | 35,541 | ||||||
| 1,371 | First Busey Corporation | 33,192 | ||||||
| 3,671 | First Commonwealth Financial Corporation | 50,697 | ||||||
| 3,409 | First Financial Bancorp | 75,748 | ||||||
| 563 | First Financial Corporation | 20,763 | ||||||
| 3,261 | First Hawaiian, Inc. | 67,698 | ||||||
| 5,535 | First Horizon Corporation | 87,287 | ||||||
| 3,701 | First Interstate BancSystem, Inc., Class A | 102,777 | ||||||
| 2,371 | First Merchants Corporation | 78,931 | ||||||
| 220 | First Mid Bancshares, Inc. | 7,234 | ||||||
| 10,111 | FNB Corporation(b) | 138,319 | ||||||
| 196 | FS Bancorp, Inc. | 7,144 | ||||||
| 3 | Fulton Financial Corporation | 51 | ||||||
| 121 | Great Southern Bancorp, Inc. | 6,729 | ||||||
| 1,983 | Hancock Whitney Corporation | 94,847 | ||||||
| 1,078 | Hanmi Financial Corporation(b) | 18,024 | ||||||
| 1,836 | Heartland Financial USA, Inc. | 81,610 | ||||||
| 2,595 | Heritage Commerce Corporation | 22,577 | ||||||
| 1,426 | Heritage Financial Corporation | 25,711 | ||||||
| 2,151 | Hilltop Holdings, Inc. | 67,283 | ||||||
| 290 | Home Bancorp, Inc. | 11,603 | ||||||
| 739 | HomeTrust Bancshares, Inc. | 22,192 | ||||||
| 762 | Horizon Bancorp, Inc. | 9,426 | ||||||
| 739 | Independent Bank Corporation | 19,953 | ||||||
| 1,394 | Independent Bank Corporation | 70,704 | ||||||
| 591 | Investar Holding Corporation | 9,101 | ||||||
| 443 | Macatawa Bank Corporation | 6,468 | ||||||
| 3 | Mercantile Bank Corporation | 122 | ||||||
| 828 | Midland States Bancorp, Inc. | 18,754 | ||||||
| 804 | MidWestOne Financial Group, Inc. | 18,082 | ||||||
See accompanying notes to financial statements.
17
| ACCLIVITY SMALL CAP VALUE FUND |
| SCHEDULE OF INVESTMENTS (Unaudited)(Continued) |
| June 30, 2024 |
| Shares | Value | |||||||
| COMMON STOCKS — 99.6% (Continued) | ||||||||
| BANKING - 12.1% (Continued) | ||||||||
| 1,053 | National Bank Holdings Corporation, Class A | $ | 41,120 | |||||
| 964 | Northfield Bancorp, Inc. | 9,139 | ||||||
| 99 | Northrim BanCorp, Inc. | 5,706 | ||||||
| 5,135 | Northwest Bancshares, Inc. | 59,309 | ||||||
| 1,487 | OceanFirst Financial Corporation | 23,628 | ||||||
| 45 | Ohio Valley Banc Corporation | 900 | ||||||
| 8,153 | Old National Bancorp | 140,150 | ||||||
| 6 | Old Point Financial Corporation | 88 | ||||||
| 3,280 | Old Second Bancorp, Inc. | 48,577 | ||||||
| 142 | OP Bancorp | 1,362 | ||||||
| 62 | Orrstown Financial Services, Inc. | 1,696 | ||||||
| 4,121 | Pacific Premier Bancorp, Inc. | 94,659 | ||||||
| 388 | Parke Bancorp, Inc. | 6,751 | ||||||
| 8 | Pathfinder Bancorp, Inc. | 105 | ||||||
| 1,503 | Peoples Bancorp, Inc. | 45,090 | ||||||
| 1,736 | Premier Financial Corporation | 35,519 | ||||||
| 62 | Primis Financial Corporation | 650 | ||||||
| 111 | Princeton Bancorp, Inc. | 3,674 | ||||||
| 2,855 | Prosperity Bancshares, Inc. | 174,555 | ||||||
| 212 | Provident Financial Holdings, Inc. | 2,650 | ||||||
| 1,657 | Provident Financial Services, Inc. | 23,778 | ||||||
| 579 | QCR Holdings, Inc. | 34,740 | ||||||
| 1,529 | Renasant Corporation | 46,696 | ||||||
| 1,246 | Republic Bancorp, Inc., Class A | 66,798 | ||||||
| 3,100 | Republic First Bancorp, Inc.(a) | 19 | ||||||
| 972 | Riverview Bancorp, Inc. | 3,878 | ||||||
| 1,536 | S&T Bancorp, Inc. | 51,287 | ||||||
| 394 | SB Financial Group, Inc. | 5,516 | ||||||
| 2,299 | Seacoast Banking Corporation of Florida | 54,348 | ||||||
| 174 | Sierra Bancorp | 3,894 | ||||||
| 28 | SmartFinancial, Inc. | 663 | ||||||
| 71 | South Plains Financial, Inc. | 1,917 | ||||||
| 1,725 | SouthState Corporation | 131,825 | ||||||
| 2,035 | Stellar Bancorp, Inc. | 46,724 | ||||||
See accompanying notes to financial statements.
18
| ACCLIVITY SMALL CAP VALUE FUND |
| SCHEDULE OF INVESTMENTS (Unaudited)(Continued) |
| June 30, 2024 |
| Shares | Value | |||||||
| COMMON STOCKS — 99.6% (Continued) | ||||||||
| BANKING - 12.1% (Continued) | ||||||||
| 1,065 | Synovus Financial Corporation | $ | 42,802 | |||||
| 9 | Territorial Bancorp, Inc. | 73 | ||||||
| 428 | Texas Capital Bancshares, Inc.(a) | 26,168 | ||||||
| 2,278 | Towne Bank | 62,121 | ||||||
| 783 | TrustCompany Bank Corporation | 22,527 | ||||||
| 2,033 | Trustmark Corporation | 61,071 | ||||||
| 172 | United Bancshares, Inc. | 3,234 | ||||||
| 3,479 | United Bankshares, Inc. | 112,859 | ||||||
| 3,336 | United Community Banks, Inc. | 84,935 | ||||||
| 420 | United Security Bancshares | 3,045 | ||||||
| 1,212 | Univest Financial Corporation | 27,670 | ||||||
| 5,465 | Valley National Bancorp | 38,146 | ||||||
| 671 | WaFd, Inc. | 19,177 | ||||||
| 4,886 | Webster Financial Corporation | 212,981 | ||||||
| 1,873 | WesBanco, Inc. | 52,275 | ||||||
| 666 | Western New England Bancorp, Inc. | 4,582 | ||||||
| 2,406 | WSFS Financial Corporation | 113,082 | ||||||
| 4,193,072 | ||||||||
| BEVERAGES - 0.1% | ||||||||
| 555 | MGP Ingredients, Inc. | 41,292 | ||||||
| BIOTECHNOLOGY & PHARMACEUTICALS - 2.1% | ||||||||
| 808 | Amneal Pharmaceuticals, Inc.(a) | 5,131 | ||||||
| 1,326 | Amphastar Pharmaceuticals, Inc.(a) | 53,040 | ||||||
| 1,019 | ANI Pharmaceuticals, Inc.(a) | 64,890 | ||||||
| 4,203 | Arcus Biosciences, Inc.(a) | 64,012 | ||||||
| 231 | Beam Therapeutics, Inc.(a) | 5,412 | ||||||
| 2,521 | Certara, Inc.(a) | 34,916 | ||||||
| 944 | Cumberland Pharmaceuticals, Inc.(a) | 1,444 | ||||||
| 10,263 | Elanco Animal Health, Inc.(a) | 148,095 | ||||||
| 1,822 | Innoviva, Inc.(a) | 29,881 | ||||||
| 346 | Ligand Pharmaceuticals, Inc.(a) | 29,154 | ||||||
| 6,813 | Organogenesis Holdings, Inc.(a) | 19,076 | ||||||
| 1,701 | Pacira BioSciences, Inc.(a) | 48,666 | ||||||
See accompanying notes to financial statements.
19
| ACCLIVITY SMALL CAP VALUE FUND |
| SCHEDULE OF INVESTMENTS (Unaudited)(Continued) |
| June 30, 2024 |
| Shares | Value | |||||||
| COMMON STOCKS — 99.6% (Continued) | ||||||||
| BIOTECHNOLOGY & PHARMACEUTICALS - 2.1% (Continued) | ||||||||
| 1,683 | Prestige Consumer Healthcare, Inc.(a) | $ | 115,875 | |||||
| 1,822 | Supernus Pharmaceuticals, Inc.(a) | 48,738 | ||||||
| 3,541 | Vir Biotechnology, Inc.(a) | 31,515 | ||||||
| 19 | Xencor, Inc.(a) | 360 | ||||||
| 4,038 | Zentalis Pharmaceuticals, Inc.(a) | 16,515 | ||||||
| 716,720 | ||||||||
| CABLE & SATELLITE - 0.7% | ||||||||
| 179 | Cable One, Inc.(b) | 63,366 | ||||||
| 2,756 | Liberty Broadband Corporation - Series C(a) | 151,084 | ||||||
| 4,483 | WideOpenWest, Inc.(a) | 24,253 | ||||||
| 238,703 | ||||||||
| CHEMICALS - 1.8% | ||||||||
| 529 | American Vanguard Corporation | 4,549 | ||||||
| 713 | Ashland, Inc. | 67,371 | ||||||
| 2,636 | Avient Corporation | 115,061 | ||||||
| 3,877 | Ecovyst, Inc.(a) | 34,777 | ||||||
| 2,233 | FMC Corporation | 128,509 | ||||||
| 2,768 | Huntsman Corporation | 63,027 | ||||||
| 750 | Intrepid Potash, Inc.(a) | 17,573 | ||||||
| 1,203 | Koppers Holdings, Inc. | 44,499 | ||||||
| 884 | Minerals Technologies, Inc. | 73,514 | ||||||
| 3,654 | Rayonier Advanced Materials, Inc.(a) | 19,878 | ||||||
| 684 | Stepan Company | 57,429 | ||||||
| 760 | Valhi, Inc. | 13,551 | ||||||
| 639,738 | ||||||||
| COMMERCIAL SUPPORT SERVICES - 3.8% | ||||||||
| 2,714 | ABM Industries, Inc. | 137,247 | ||||||
| 8,603 | Acacia Research Corporation(a) | 43,101 | ||||||
| 13,329 | ADT, Inc. | 101,300 | ||||||
| 21,569 | Advantage Solutions, Inc.(a) | 69,452 | ||||||
| 1,213 | AMN Healthcare Services, Inc.(a) | 62,142 | ||||||
| 2,208 | ARC Document Solutions, Inc. | 5,829 | ||||||
| 963 | ASGN, Inc.(a) | 84,908 | ||||||
| 252 | BGSF, Inc. | 2,155 | ||||||
See accompanying notes to financial statements.
20
| ACCLIVITY SMALL CAP VALUE FUND |
| SCHEDULE OF INVESTMENTS (Unaudited)(Continued) |
| June 30, 2024 |
| Shares | Value | |||||||
| COMMON STOCKS — 99.6% (Continued) | ||||||||
| COMMERCIAL SUPPORT SERVICES - 3.8% (Continued) | ||||||||
| 7,511 | BrightView Holdings, Inc.(a) | $ | 99,896 | |||||
| 6,439 | CoreCivic, Inc.(a) | 83,578 | ||||||
| 864 | Cross Country Healthcare, Inc.(a) | 11,958 | ||||||
| 1,303 | Deluxe Corporation | 29,265 | ||||||
| 531 | Ennis, Inc. | 11,624 | ||||||
| 2,968 | Enviri Corporation(a) | 25,614 | ||||||
| 9,359 | GEO Group, Inc. (The)(a) | 134,395 | ||||||
| 897 | Heidrick & Struggles International, Inc. | 28,327 | ||||||
| 649 | Information Services Group, Inc. | 1,908 | ||||||
| 1,773 | Kelly Services, Inc., Class A | 37,960 | ||||||
| 1,471 | Korn Ferry | 98,763 | ||||||
| 684 | ManpowerGroup, Inc.(b) | 47,743 | ||||||
| 691 | Radius Recycling, Inc. | 10,552 | ||||||
| 1,061 | Resources Connection, Inc. | 11,713 | ||||||
| 1,060 | Stericycle, Inc.(a),(b) | 61,618 | ||||||
| 983 | TrueBlue, Inc.(a) | 10,125 | ||||||
| 520 | UniFirst Corporation | 89,196 | ||||||
| 504 | V2X, Inc.(a) | 24,172 | ||||||
| 1,324,541 | ||||||||
| CONSTRUCTION MATERIALS - 0.7% | ||||||||
| 2,871 | Concrete Pumping Holdings, Inc.(a) | 17,255 | ||||||
| 9,242 | MDU Resources Group, Inc. | 231,974 | ||||||
| 249,229 | ||||||||
| CONSUMER SERVICES - 0.6% | ||||||||
| 114 | Adtalem Global Education, Inc.(a),(b) | 7,776 | ||||||
| 1,934 | American Public Education, Inc.(a) | 34,000 | ||||||
| 1,697 | Chegg, Inc.(a) | 5,362 | ||||||
| 47 | Graham Holdings Company, Class B(b) | 32,879 | ||||||
| 713 | Matthews International Corporation, Class A | 17,860 | ||||||
| 3,400 | Perdoceo Education Corporation | 72,828 | ||||||
| 333 | Strategic Education, Inc. | 36,850 | ||||||
| 207,555 | ||||||||
| CONTAINERS & PACKAGING - 1.1% | ||||||||
| 1,982 | Berry Global Group, Inc. | 116,641 | ||||||
See accompanying notes to financial statements.
21
| ACCLIVITY SMALL CAP VALUE FUND |
| SCHEDULE OF INVESTMENTS (Unaudited)(Continued) |
| June 30, 2024 |
| Shares | Value | |||||||
| COMMON STOCKS — 99.6% (Continued) | ||||||||
| CONTAINERS & PACKAGING - 1.1% (Continued) | ||||||||
| 1,103 | Greif, Inc., Class A | $ | 63,389 | |||||
| 9,029 | O-I Glass, Inc.(a),(b) | 100,493 | ||||||
| 7,129 | Pactiv Evergreen, Inc. | 80,700 | ||||||
| 1,029 | TriMas Corporation | 26,301 | ||||||
| 387,524 | ||||||||
| E-COMMERCE DISCRETIONARY - 0.0%(c) | ||||||||
| 756 | Lands’ End, Inc.(a) | 10,274 | ||||||
| ELECTRICAL EQUIPMENT - 1.6% | ||||||||
| 979 | Advanced Energy Industries, Inc. | 106,476 | ||||||
| 47 | Argan, Inc. | 3,439 | ||||||
| 990 | Belden, Inc. | 92,862 | ||||||
| 2,385 | Hayward Holdings, Inc.(a) | 29,336 | ||||||
| 676 | Kimball Electronics, Inc.(a) | 14,858 | ||||||
| 575 | Littelfuse, Inc. | 146,964 | ||||||
| 1,133 | LSI Industries, Inc. | 16,395 | ||||||
| 3,564 | Mirion Technologies, Inc.(a) | 38,277 | ||||||
| 581 | OSI Systems, Inc.(a) | 79,899 | ||||||
| 195 | Preformed Line Products Company | 24,285 | ||||||
| 552,791 | ||||||||
| ENGINEERING & CONSTRUCTION - 1.3% | ||||||||
| 796 | Arcosa, Inc. | 66,394 | ||||||
| 3,307 | Great Lakes Dredge & Dock Corporation(a) | 29,036 | ||||||
| 1,344 | MasTec, Inc.(a),(b) | 143,795 | ||||||
| 1,648 | Mistras Group, Inc.(a) | 13,662 | ||||||
| 462 | NV5 Global, Inc.(a) | 42,952 | ||||||
| 2,158 | Primoris Services Corporation | 107,663 | ||||||
| 22 | Tutor Perini Corporation(a) | 479 | ||||||
| 473 | VSE Corporation | 41,756 | ||||||
| 445,737 | ||||||||
| ENTERTAINMENT CONTENT - 0.3% | ||||||||
| 4,841 | AMC Networks, Inc., Class A(a),(b) | 46,764 | ||||||
| 6,199 | Paramount Global, Class B(b) | 64,408 | ||||||
| 111,172 | ||||||||
See accompanying notes to financial statements.
22
| ACCLIVITY SMALL CAP VALUE FUND |
| SCHEDULE OF INVESTMENTS (Unaudited)(Continued) |
| June 30, 2024 |
| Shares | Value | |||||||
| COMMON STOCKS — 99.6% (Continued) | ||||||||
| FOOD - 1.7% | ||||||||
| 169 | Alico, Inc. | $ | 4,379 | |||||
| 4,026 | B&G Foods, Inc. | 32,530 | ||||||
| 4,708 | Darling Ingredients, Inc.(a) | 173,019 | ||||||
| 2,707 | Hain Celestial Group, Inc. (The)(a) | 18,705 | ||||||
| 2 | Ingredion, Inc. | 230 | ||||||
| 56 | JM Smucker Company (The) | 6,106 | ||||||
| 1,643 | Post Holdings, Inc.(a) | 171,135 | ||||||
| 19 | Seaboard Corporation | 60,054 | ||||||
| 106 | Seneca Foods Corporation, Class A(a) | 6,084 | ||||||
| 1,832 | Simply Good Foods Company (The)(a) | 66,190 | ||||||
| 1,156 | TreeHouse Foods, Inc.(a) | 42,356 | ||||||
| 580,788 | ||||||||
| FORESTRY, PAPER & WOOD PRODUCTS - 0.1% | ||||||||
| 2 | Boise Cascade Company | 238 | ||||||
| 191 | UFP Industries, Inc. | 21,392 | ||||||
| 21,630 | ||||||||
| HEALTH CARE FACILITIES & SERVICES - 2.7% | ||||||||
| 2,363 | Acadia Healthcare Company, Inc.(a) | 159,597 | ||||||
| 10,067 | AdaptHealth Corporation(a) | 100,670 | ||||||
| 379 | Addus HomeCare Corporation(a) | 44,006 | ||||||
| 688 | Amedisys, Inc.(a) | 63,158 | ||||||
| 7,458 | Brookdale Senior Living, Inc.(a) | 50,938 | ||||||
| 24 | Fulgent Genetics, Inc.(a) | 471 | ||||||
| 3,224 | LifeStance Health Group, Inc.(a) | 15,830 | ||||||
| 863 | National HealthCare Corporation | 93,549 | ||||||
| 3,147 | Owens & Minor, Inc.(a) | 42,485 | ||||||
| 2,598 | Patterson Companies, Inc. (b) | 62,664 | ||||||
| 4,302 | Pediatrix Medical Group, Inc.(a) | 32,480 | ||||||
| 481 | Premier, Inc., Class A | 8,980 | ||||||
| 3,232 | Select Medical Holdings Corporation | 113,314 | ||||||
| 10,937 | Teladoc Health, Inc.(a) | 106,964 | ||||||
| 308 | US Physical Therapy, Inc. | 28,465 | ||||||
| 923,571 | ||||||||
See accompanying notes to financial statements.
23
| ACCLIVITY SMALL CAP VALUE FUND |
| SCHEDULE OF INVESTMENTS (Unaudited)(Continued) |
| June 30, 2024 |
| Shares | Value | |||||||
| COMMON STOCKS — 99.6% (Continued) | ||||||||
| HOME & OFFICE PRODUCTS - 1.1% | ||||||||
| 11,166 | ACCO Brands Corporation | $ | 52,480 | |||||
| 297 | Hooker Furnishings Corporation | 4,301 | ||||||
| 200 | Kewaunee Scientific Corporation(a) | 9,440 | ||||||
| 4,588 | Leggett & Platt, Inc. | 52,578 | ||||||
| 1,568 | Lifetime Brands, Inc. | 13,469 | ||||||
| 3,212 | MillerKnoll, Inc. | 85,086 | ||||||
| 8,946 | Newell Brands, Inc. | 57,344 | ||||||
| 7,024 | Steelcase, Inc., Class A | 91,031 | ||||||
| 37 | Virco Mfg. Corporation | 516 | ||||||
| 366,245 | ||||||||
| HOME CONSTRUCTION - 5.3% | ||||||||
| 812 | American Woodmark Corporation(a) | 63,823 | ||||||
| 3,076 | Beazer Homes USA, Inc.(a) | 84,529 | ||||||
| 1,926 | Century Communities, Inc. | 157,277 | ||||||
| 3,459 | Forestar Group, Inc.(a) | 110,653 | ||||||
| 2 | Green Brick Partners, Inc.(a) | 114 | ||||||
| 256 | Hovnanian Enterprises, Inc.(a) | 36,332 | ||||||
| 2,179 | Interface, Inc. | 31,988 | ||||||
| 2,201 | JELD-WEN Holding, Inc.(a) | 29,647 | ||||||
| 3,571 | KB Home | 250,613 | ||||||
| 426 | LGI Homes, Inc.(a) | 38,123 | ||||||
| 1,388 | M/I Homes, Inc.(a) | 169,530 | ||||||
| 1,688 | Meritage Homes Corporation(b) | 273,203 | ||||||
| 1,323 | Mohawk Industries, Inc.(a) | 150,280 | ||||||
| 5,453 | Taylor Morrison Home Corporation(a) | 302,314 | ||||||
| 3,822 | Tri Pointe Homes, Inc.(a) | 142,370 | ||||||
| 1,840,796 | ||||||||
| HOUSEHOLD PRODUCTS - 0.9% | ||||||||
| 2,504 | Central Garden & Pet Company, Class A(a) | 82,707 | ||||||
| 1,037 | Clearwater Paper Corporation(a) | 50,263 | ||||||
| 313 | Crown Crafts, Inc. | 1,637 | ||||||
| 1,843 | Edgewell Personal Care Company | 74,070 | ||||||
| 1 | Nu Skin Enterprises, Inc., Class A | 11 | ||||||
| 1,636 | Quanex Building Products Corporation | 45,236 | ||||||
See accompanying notes to financial statements.
24
| ACCLIVITY SMALL CAP VALUE FUND |
| SCHEDULE OF INVESTMENTS (Unaudited)(Continued) |
| June 30, 2024 |
| Shares | Value | |||||||
| COMMON STOCKS — 99.6% (Continued) | ||||||||
| HOUSEHOLD PRODUCTS - 0.9% (Continued) | ||||||||
| 685 | Spectrum Brands Holdings, Inc.(b) | $ | 58,862 | |||||
| 312,786 | ||||||||
| INDUSTRIAL INTERMEDIATE PRODUCTS - 1.2% | ||||||||
| 251 | Core Molding Technologies, Inc.(a) | 4,001 | ||||||
| 189 | Eastern Company (The) | 4,814 | ||||||
| 330 | Enpro, Inc. | 48,038 | ||||||
| 564 | Gibraltar Industries, Inc.(a) | 38,662 | ||||||
| 466 | Insteel Industries, Inc. | 14,427 | ||||||
| 345 | L B Foster Company, Class A(a) | 7,424 | ||||||
| 1,973 | Mueller Industries, Inc. | 112,343 | ||||||
| 788 | Park-Ohio Holdings Corporation | 20,401 | ||||||
| 1,276 | Proto Labs, Inc.(a) | 39,416 | ||||||
| 430 | Strattec Security Corporation(a) | 10,750 | ||||||
| 1,648 | Timken Company (The) | 132,054 | ||||||
| 6 | Tredegar Corporation | 29 | ||||||
| 432,359 | ||||||||
| INDUSTRIAL SUPPORT SERVICES - 1.2% | ||||||||
| 5,203 | Custom Truck One Source, Inc.(a) | 22,633 | ||||||
| 638 | DXP Enterprises, Inc.(a) | 29,246 | ||||||
| 9,465 | Resideo Technologies, Inc.(a) | 185,135 | ||||||
| 2,189 | Titan Machinery, Inc.(a) | 34,805 | ||||||
| 853 | WESCO International, Inc. | 135,218 | ||||||
| 407,037 | ||||||||
| INSTITUTIONAL FINANCIAL SERVICES - 0.1% | ||||||||
| 2,047 | Virtu Financial, Inc., Class A | 45,955 | ||||||
| INSURANCE - 4.1% | ||||||||
| 1,647 | Ambac Financial Group, Inc.(a) | 21,115 | ||||||
| 5,557 | Brighthouse Financial, Inc.(a) | 240,840 | ||||||
| 1,997 | Donegal Group, Inc., Class A | 25,721 | ||||||
| 14 | eHealth, Inc.(a) | 63 | ||||||
| 1,882 | Employers Holdings, Inc. | 80,230 | ||||||
| 47,495 | Genworth Financial, Inc., Class A(a) | 286,870 | ||||||
| 1,716 | Global Indemnity Group, LLC | 53,343 | ||||||
See accompanying notes to financial statements.
25
| ACCLIVITY SMALL CAP VALUE FUND |
| SCHEDULE OF INVESTMENTS (Unaudited)(Continued) |
| June 30, 2024 |
| Shares | Value | |||||||
| COMMON STOCKS — 99.6% (Continued) | ||||||||
| INSURANCE - 4.1% (Continued) | ||||||||
| 4,222 | Heritage Insurance Holdings, Inc.(a) | $ | 29,892 | |||||
| 364 | Kingstone Companies, Inc.(a) | 1,820 | ||||||
| 1,034 | Lincoln National Corporation | 32,157 | ||||||
| 276 | National Western Life Group, Inc., Class A | 137,156 | ||||||
| 255 | NMI Holdings, Inc., Class A(a) | 8,680 | ||||||
| 5,370 | ProAssurance Corporation(a) | 65,621 | ||||||
| 10,910 | Radian Group, Inc. | 339,301 | ||||||
| 2,585 | Security National Financial Corporation, Class A(a) | 20,654 | ||||||
| 222 | Tiptree, Inc. | 3,661 | ||||||
| 246 | Unico American Corporation(a) | 12 | ||||||
| 2,961 | United Fire Group, Inc. | 63,632 | ||||||
| 1 | Universal Insurance Holdings, Inc. | 19 | ||||||
| 1,410,787 | ||||||||
| INTERNET MEDIA & SERVICES - 0.7% | ||||||||
| 48 | Cars.com, Inc.(a) | 945 | ||||||
| 744 | DHI Group, Inc.(a) | 1,555 | ||||||
| 13,555 | GoodRx Holdings, Inc.(a) | 105,729 | ||||||
| 2,992 | IAC, Inc.(a) | 140,175 | ||||||
| 5 | TrueCar, Inc.(a) | 16 | ||||||
| 248,420 | ||||||||
| LEISURE FACILITIES & SERVICES - 0.7% | ||||||||
| 10 | Ark Restaurants Corporation | 130 | ||||||
| 128 | Biglari Holdings, Inc.(a) | 24,753 | ||||||
| 12 | Chuy’s Holdings, Inc.(a) | 311 | ||||||
| 1,994 | El Pollo Loco Holdings, Inc.(a) | 22,552 | ||||||
| 1,106 | Golden Entertainment, Inc. | 34,408 | ||||||
| 834 | Good Times Restaurants, Inc.(a) | 2,110 | ||||||
| 2,641 | Marcus Corporation (The) | 30,028 | ||||||
| 955 | Marriott Vacations Worldwide Corporation(b) | 83,390 | ||||||
| 532 | Penn Entertainment, Inc.(a) | 10,297 | ||||||
| 419 | RCI Hospitality Holdings, Inc. | 18,252 | ||||||
| 226,231 | ||||||||
| LEISURE PRODUCTS - 1.7% | ||||||||
| 481 | Escalade, Inc. | 6,633 | ||||||
See accompanying notes to financial statements.
26
| ACCLIVITY SMALL CAP VALUE FUND |
| SCHEDULE OF INVESTMENTS (Unaudited)(Continued) |
| June 30, 2024 |
| Shares | Value | |||||||
| COMMON STOCKS — 99.6% (Continued) | ||||||||
| LEISURE PRODUCTS - 1.7% (Continued) | ||||||||
| 4 | LCI Industries | $ | 413 | |||||
| 409 | MasterCraft Boat Holdings, Inc.(a) | 7,722 | ||||||
| 1,240 | Smith & Wesson Brands, Inc. | 17,782 | ||||||
| 1,747 | Thor Industries, Inc.(b) | 163,257 | ||||||
| 18,563 | Topgolf Callaway Brands Corporation(a),(b) | 284,014 | ||||||
| 1,973 | Vista Outdoor, Inc.(a) | 74,283 | ||||||
| 824 | Winnebago Industries, Inc.(b) | 44,661 | ||||||
| 598,765 | ||||||||
| MACHINERY - 3.7% | ||||||||
| 959 | AGCO Corporation | 93,867 | ||||||
| 73 | Astec Industries, Inc. | 2,165 | ||||||
| 1,165 | Columbus McKinnon Corporation | 40,239 | ||||||
| 1,377 | Enovis Corporation(a) | 62,240 | ||||||
| 471 | ESCO Technologies, Inc. | 49,474 | ||||||
| 676 | Gencor Industries, Inc.(a) | 13,074 | ||||||
| 713 | Helios Technologies, Inc. | 34,046 | ||||||
| 2,300 | Hillenbrand, Inc. | 92,046 | ||||||
| 225 | Hurco Companies, Inc. | 3,433 | ||||||
| 761 | John Bean Technologies Corporation | 72,272 | ||||||
| 3,688 | Kennametal, Inc. | 86,816 | ||||||
| 2,227 | Manitowoc Company, Inc. (The)(a) | 25,677 | ||||||
| 1,581 | Middleby Corporation (The)(a) | 193,846 | ||||||
| 941 | NN, Inc.(a) | 2,823 | ||||||
| 2,849 | Oshkosh Corporation | 308,262 | ||||||
| 4,763 | Ranpak Holdings Corporation(a) | 30,626 | ||||||
| 2,365 | Terex Corporation | 129,697 | ||||||
| 3,678 | Titan International, Inc.(a) | 27,254 | ||||||
| 1,267,857 | ||||||||
| MEDICAL EQUIPMENT & DEVICES - 2.1% | ||||||||
| 632 | Alpha Pro Tech Ltd.(a) | 3,476 | ||||||
| 2,410 | AngioDynamics, Inc.(a) | 14,580 | ||||||
| 1,053 | Avanos Medical, Inc.(a) | 20,976 | ||||||
| 326 | Bio-Rad Laboratories, Inc., Class A(a) | 89,034 | ||||||
| 586 | CONMED Corporation(b) | 40,622 | ||||||
See accompanying notes to financial statements.
27
| ACCLIVITY SMALL CAP VALUE FUND |
| SCHEDULE OF INVESTMENTS (Unaudited)(Continued) |
| June 30, 2024 |
| Shares | Value | |||||||
| COMMON STOCKS — 99.6% (Continued) | ||||||||
| MEDICAL EQUIPMENT & DEVICES - 2.1% (Continued) | ||||||||
| 3,610 | DENTSPLY SIRONA, Inc. | $ | 89,925 | |||||
| 4,589 | Envista Holdings Corporation(a) | 76,315 | ||||||
| 811 | FONAR Corporation(a) | 12,976 | ||||||
| 1,650 | Harvard Bioscience, Inc.(a) | 4,702 | ||||||
| 256 | ICU Medical, Inc.(a) | 30,400 | ||||||
| 942 | Integer Holdings Corporation(a) | 109,074 | ||||||
| 752 | Integra LifeSciences Holdings Corporation(a) | 21,913 | ||||||
| 1,466 | Myriad Genetics, Inc.(a) | 35,858 | ||||||
| 2,970 | Neogen Corporation(a) | 46,421 | ||||||
| 4,326 | OraSure Technologies, Inc.(a) | 18,429 | ||||||
| 2,980 | QuidelOrtho Corporation(a) | 98,996 | ||||||
| 60 | Utah Medical Products, Inc. | 4,009 | ||||||
| 1,722 | Varex Imaging Corporation(a) | 25,365 | ||||||
| 743,071 | ||||||||
| METALS & MINING - 2.9% | ||||||||
| 4,055 | Alcoa Corporation(b) | 161,308 | ||||||
| 37 | Alpha Metallurgical Resources, Inc.(b) | 10,380 | ||||||
| 354 | Arch Resources, Inc.(b) | 53,889 | ||||||
| 13,997 | Cleveland-Cliffs, Inc.(a),(b) | 215,414 | ||||||
| 1,291 | Coeur Mining, Inc.(a) | 7,255 | ||||||
| 1,664 | Compass Minerals International, Inc. | 17,189 | ||||||
| 343 | Encore Wire Corporation | 99,412 | ||||||
| 8,329 | Hecla Mining Company | 40,396 | ||||||
| 2,097 | McEwen Mining, Inc.(a) | 19,251 | ||||||
| 6,536 | Peabody Energy Corporation(b) | 144,576 | ||||||
| 2,172 | Ramaco Resources, Inc. | 27,041 | ||||||
| 6,950 | SunCoke Energy, Inc. | 68,110 | ||||||
| 2,503 | Warrior Met Coal, Inc. (b) | 157,113 | ||||||
| 1,021,334 | ||||||||
| OIL & GAS PRODUCERS - 5.5% | ||||||||
| 3,775 | Amplify Energy Corporation(a) | 25,595 | ||||||
| 3,752 | Antero Resources Corporation(a) | 122,428 | ||||||
| 2,380 | APA Corporation(b) | 70,067 | ||||||
| 7,401 | Berry Corporation | 47,810 | ||||||
See accompanying notes to financial statements.
28
| ACCLIVITY SMALL CAP VALUE FUND |
| SCHEDULE OF INVESTMENTS (Unaudited)(Continued) |
| June 30, 2024 |
| Shares | Value | |||||||
| COMMON STOCKS — 99.6% (Continued) | ||||||||
| OIL & GAS PRODUCERS - 5.5% (Continued) | ||||||||
| 3,821 | Civitas Resources, Inc. (b) | $ | 263,649 | |||||
| 5,182 | CNX Resources Corporation(a),(b) | 125,923 | ||||||
| 6,130 | HighPeak Energy, Inc. | 86,188 | ||||||
| 6,353 | Murphy Oil Corporation | 261,998 | ||||||
| 3,960 | Par Pacific Holdings, Inc.(a) | 99,990 | ||||||
| 5,553 | PBF Energy, Inc., Class A | 255,549 | ||||||
| 481 | Permian Resources Corporation(b) | 7,768 | ||||||
| 334 | Ring Energy, Inc.(a) | 564 | ||||||
| 1,833 | SandRidge Energy, Inc. | 23,701 | ||||||
| 2,674 | SilverBow Resources, Inc.(a) | 101,157 | ||||||
| 22,521 | Southwestern Energy Company(a) | 151,566 | ||||||
| 9,273 | VAALCO Energy, Inc. | 58,142 | ||||||
| 3,151 | Vital Energy, Inc.(a),(b) | 141,228 | ||||||
| 2,405 | World Kinect Corporation | 62,049 | ||||||
| 1,905,372 | ||||||||
| OIL & GAS SERVICES & EQUIPMENT - 2.5% | ||||||||
| 1,465 | DMC Global, Inc.(a) | 21,125 | ||||||
| 4,834 | DNOW, Inc.(a) | 66,371 | ||||||
| 583 | Dril-Quip, Inc.(a) | 10,844 | ||||||
| 805 | Geospace Technologies Corporation(a) | 7,229 | ||||||
| 687 | Helix Energy Solutions Group, Inc.(a) | 8,203 | ||||||
| 4,990 | Helmerich & Payne, Inc. | 180,339 | ||||||
| 3,492 | MRC Global, Inc.(a) | 45,082 | ||||||
| 32 | Natural Gas Services Group, Inc.(a) | 644 | ||||||
| 10,251 | NOV, Inc. (b) | 194,871 | ||||||
| 9,073 | Patterson-UTI Energy, Inc. | 93,996 | ||||||
| 8,404 | ProPetro Holding Corporation(a) | 72,863 | ||||||
| 1,989 | Ranger Energy Services, Inc. | 20,924 | ||||||
| 7,065 | RPC, Inc. | 44,156 | ||||||
| 3,143 | Select Water Solutions, Inc., Class A | 33,630 | ||||||
| 1,387 | Solaris Oilfield Infrastructure, Inc., Class A | 11,900 | ||||||
| 4,259 | US Silica Holdings, Inc.(a) | 65,802 | ||||||
| 877,979 | ||||||||
See accompanying notes to financial statements.
29
| ACCLIVITY SMALL CAP VALUE FUND |
| SCHEDULE OF INVESTMENTS (Unaudited)(Continued) |
| June 30, 2024 |
| Shares | Value | |||||||
| COMMON STOCKS — 99.6% (Continued) | ||||||||
| PUBLISHING & BROADCASTING - 0.8% | ||||||||
| 1,054 | Entravision Communications Corporation, Class A | $ | 2,140 | |||||
| 5,588 | EW Scripps Company (The), Class A(a) | 17,546 | ||||||
| 11,313 | Gray Television, Inc. | 58,827 | ||||||
| 342 | Saga Communications, Inc., Class A | 5,386 | ||||||
| 1,793 | Scholastic Corporation | 63,598 | ||||||
| 18 | Sinclair, Inc. | 240 | ||||||
| 8,006 | TEGNA, Inc. | 111,604 | ||||||
| 259,341 | ||||||||
| REAL ESTATE OWNERS & DEVELOPERS - 0.4% | ||||||||
| 3,755 | Five Point Holdings, LLC(a) | 11,002 | ||||||
| 1,778 | Howard Hughes Holdings, Inc.(a) | 115,250 | ||||||
| 1,167 | Legacy Housing Corporation(a) | 26,771 | ||||||
| 153,023 | ||||||||
| REAL ESTATE SERVICES - 0.2% | ||||||||
| 16,204 | Anywhere Real Estate, Inc.(a) | 53,635 | ||||||
| 1,262 | Newmark Group, Inc., Class A | 12,911 | ||||||
| 66,546 | ||||||||
| RENEWABLE ENERGY - 0.4% | ||||||||
| 1,237 | EnerSys | 128,054 | ||||||
| 743 | Ultralife Corporation(a) | 7,891 | ||||||
| 135,945 | ||||||||
| RETAIL - CONSUMER STAPLES - 0.6% | ||||||||
| 1,043 | Ingles Markets, Inc., Class A | 71,560 | ||||||
| 342 | PriceSmart, Inc. | 27,770 | ||||||
| 1,114 | SpartanNash Company | 20,899 | ||||||
| 1,480 | Village Super Market, Inc., Class A | 39,087 | ||||||
| 772 | Weis Markets, Inc. | 48,459 | ||||||
| 207,775 | ||||||||
| RETAIL - DISCRETIONARY - 5.6% | ||||||||
| 2,099 | Aaron’s Company, Inc. (The) | 20,948 | ||||||
| 78 | Advance Auto Parts, Inc. | 4,940 | ||||||
| 3,691 | American Eagle Outfitters, Inc.(b) | 73,672 | ||||||
| 319 | America’s Car-Mart, Inc.(a) | 19,207 | ||||||
| 825 | Asbury Automotive Group, Inc.(a),(b) | 187,993 | ||||||
See accompanying notes to financial statements.
30
| ACCLIVITY SMALL CAP VALUE FUND |
| SCHEDULE OF INVESTMENTS (Unaudited)(Continued) |
| June 30, 2024 |
| Shares | Value | |||||||
| COMMON STOCKS — 99.6% (Continued) | ||||||||
| RETAIL - DISCRETIONARY - 5.6% (Continued) | ||||||||
| 156 | Bassett Furniture Industries, Inc. | $ | 2,217 | |||||
| 387 | BlueLinx Holdings, Inc.(a) | 36,026 | ||||||
| 110 | Citi Trends, Inc.(a) | 2,339 | ||||||
| 3,517 | Designer Brands, Inc., Class A | 24,021 | ||||||
| 6,683 | Driven Brands Holdings, Inc.(a) | 85,075 | ||||||
| 715 | Ethan Allen Interiors, Inc. | 19,941 | ||||||
| 3,425 | Foot Locker, Inc. | 85,351 | ||||||
| 306 | Gap, Inc. (The) (b) | 7,310 | ||||||
| 290 | Genesco, Inc.(a) | 7,499 | ||||||
| 553 | Group 1 Automotive, Inc. (b) | 164,396 | ||||||
| 550 | Haverty Furniture Companies, Inc. | 13,909 | ||||||
| 268 | Hibbett, Inc. | 23,372 | ||||||
| 8,126 | Kohl’s Corporation | 186,817 | ||||||
| 1,803 | La-Z-Boy, Inc.(b) | 67,216 | ||||||
| 1,158 | Lithia Motors, Inc. | 292,337 | ||||||
| 15,005 | Macy’s, Inc. | 288,096 | ||||||
| 19 | MarineMax, Inc.(a) | 615 | ||||||
| 1,537 | Monro, Inc. | 36,673 | ||||||
| 2,139 | National Vision Holdings, Inc.(a) | 27,999 | ||||||
| 2,660 | Rush Enterprises, Inc., Class A | 111,374 | ||||||
| 1,068 | Shoe Carnival, Inc. | 39,399 | ||||||
| 735 | Sonic Automotive, Inc., Class A | 40,035 | ||||||
| 57 | Tilly’s, Inc., Class A(a) | 344 | ||||||
| 1,666 | Urban Outfitters, Inc.(a) | 68,389 | ||||||
| 945 | Vera Bradley, Inc.(a) | 5,916 | ||||||
| 427 | Zumiez, Inc.(a) | 8,318 | ||||||
| 1,951,744 | ||||||||
| SEMICONDUCTORS - 4.2% | ||||||||
| 7,571 | Amkor Technology, Inc. | 302,991 | ||||||
| 1,034 | CEVA, Inc.(a) | 19,946 | ||||||
| 1,465 | Cirrus Logic, Inc.(a) | 187,022 | ||||||
| 1,847 | Coherent Corporation(a) | 133,834 | ||||||
| 462 | Cohu, Inc.(a) | 15,292 | ||||||
| 499 | CTS Corporation | 25,264 | ||||||
See accompanying notes to financial statements.
31
| ACCLIVITY SMALL CAP VALUE FUND |
| SCHEDULE OF INVESTMENTS (Unaudited)(Continued) |
| June 30, 2024 |
| Shares | Value | |||||||
| COMMON STOCKS — 99.6% (Continued) | ||||||||
| SEMICONDUCTORS - 4.2% (Continued) | ||||||||
| 459 | Data I/O Corporation(a) | $ | 1,267 | |||||
| 1,178 | Diodes, Inc.(a) | 84,734 | ||||||
| 576 | FormFactor, Inc.(a) | 34,865 | ||||||
| 982 | IPG Photonics Corporation(a) | 82,871 | ||||||
| 1,351 | Kulicke & Soffa Industries, Inc. | 66,456 | ||||||
| 1,480 | MaxLinear, Inc.(a) | 29,807 | ||||||
| 1,238 | MKS Instruments, Inc.(b) | 161,658 | ||||||
| 2,964 | Photronics, Inc.(a) | 73,122 | ||||||
| 24 | Richardson Electronics Ltd. | 285 | ||||||
| 889 | Synaptics, Inc.(a) | 78,410 | ||||||
| 147 | Trio-Tech International(a) | 895 | ||||||
| 819 | Ultra Clean Holdings, Inc.(a) | 40,131 | ||||||
| 4,824 | Vishay Intertechnology, Inc. | 107,575 | ||||||
| 1,446,425 | ||||||||
| SOFTWARE - 2.0% | ||||||||
| 3,785 | ACI Worldwide, Inc.(a) | 149,848 | ||||||
| 4,172 | Adeia, Inc. | 46,664 | ||||||
| 1,799 | Bandwidth, Inc., Class A(a) | 30,367 | ||||||
| 5,938 | Bumble, Inc., Class A(a) | 62,408 | ||||||
| 3,861 | Cerence, Inc.(a) | 10,927 | ||||||
| 162 | Concentrix Corporation | 10,251 | ||||||
| 622 | Digi International, Inc.(a) | 14,263 | ||||||
| 7,465 | E2open Parent Holdings, Inc.(a) | 33,518 | ||||||
| 717 | Envestnet, Inc.(a) | 44,877 | ||||||
| 2,791 | Mitek Systems, Inc.(a) | 31,203 | ||||||
| 520 | Omnicell, Inc.(a) | 14,077 | ||||||
| 926 | OneSpan, Inc.(a) | 11,871 | ||||||
| 6,345 | SolarWinds Corporation | 76,457 | ||||||
| 374 | TruBridge, Inc.(a) | 3,740 | ||||||
| 3,974 | Veradigm, Inc.(a) | 37,753 | ||||||
| 1,046 | Verint Systems, Inc.(a) | 33,681 | ||||||
| 900 | Vimeo, Inc.(a) | 3,357 | ||||||
| 1,349 | Ziff Davis, Inc.(a) | 74,263 | ||||||
| 689,525 | ||||||||
See accompanying notes to financial statements.
32
| ACCLIVITY SMALL CAP VALUE FUND |
| SCHEDULE OF INVESTMENTS (Unaudited)(Continued) |
| June 30, 2024 |
| Shares | Value | |||||||
| COMMON STOCKS — 99.6% (Continued) | ||||||||
| SPECIALTY FINANCE - 3.2% | ||||||||
| 5,573 | Air Lease Corporation | $ | 264,885 | |||||
| 4,813 | Bread Financial Holdings, Inc. | 214,467 | ||||||
| 1,378 | Encore Capital Group, Inc.(a),(b) | 57,504 | ||||||
| 222 | Enova International, Inc.(a) | 13,820 | ||||||
| 6,464 | EZCORP, Inc., Class A(a) | 67,678 | ||||||
| 154 | First American Financial Corporation(b) | 8,308 | ||||||
| 612 | GATX Corporation | 81,004 | ||||||
| 1 | Investors Title Company | 180 | ||||||
| 8,250 | LendingClub Corporation(a) | 69,795 | ||||||
| 9,079 | MGIC Investment Corporation | 195,653 | ||||||
| 1,278 | Navient Corporation | 18,608 | ||||||
| 71 | Nelnet, Inc., Class A | 7,161 | ||||||
| 48 | PennyMac Financial Services, Inc. | 4,541 | ||||||
| 2,708 | PRA Group, Inc.(a) | 53,239 | ||||||
| 660 | Regional Management Corporation | 18,968 | ||||||
| 121 | Stewart Information Services Corporation | 7,512 | ||||||
| 627 | Willis Lease Finance Corporation | 43,451 | ||||||
| 1,126,774 | ||||||||
| STEEL - 0.9% | ||||||||
| 3,503 | Commercial Metals Company(b) | 192,630 | ||||||
| 519 | Friedman Industries, Inc. | 7,837 | ||||||
| 1,018 | Metallus, Inc.(a) | 20,635 | ||||||
| 297 | Northwest Pipe Company(a) | 10,089 | ||||||
| 1,260 | Olympic Steel, Inc.(b) | 56,486 | ||||||
| 518 | Ryerson Holding Corporation | 10,101 | ||||||
| 85 | United States Steel Corporation(b) | 3,213 | ||||||
| 4 | Worthington Enterprises, Inc. | 189 | ||||||
| 301,180 | ||||||||
| TECHNOLOGY HARDWARE - 3.6% | ||||||||
| 7,178 | 3D Systems Corporation(a) | 22,036 | ||||||
| 96 | ADTRAN Holdings, Inc. | 505 | ||||||
| 1,377 | Arrow Electronics, Inc.(a) | 166,286 | ||||||
| 204 | AstroNova, Inc.(a) | 3,150 | ||||||
| 214 | Aviat Networks, Inc.(a) | 6,140 | ||||||
See accompanying notes to financial statements.
33
| ACCLIVITY SMALL CAP VALUE FUND |
| SCHEDULE OF INVESTMENTS (Unaudited)(Continued) |
| June 30, 2024 |
| Shares | Value | |||||||
| COMMON STOCKS — 99.6% (Continued) | ||||||||
| TECHNOLOGY HARDWARE - 3.6% (Continued) | ||||||||
| 4,467 | Avnet, Inc. | $ | 230,006 | |||||
| 469 | Aware, Inc.(a) | 924 | ||||||
| 1,497 | Benchmark Electronics, Inc. | 59,072 | ||||||
| 3,335 | Ciena Corporation(a) | 160,680 | ||||||
| 10,362 | GoPro, Inc., Class A(a) | 14,714 | ||||||
| 3,907 | Harmonic, Inc.(a) | 45,985 | ||||||
| 392 | Key Tronic Corporation(a) | 1,587 | ||||||
| 2,599 | Knowles Corporation(a) | 44,859 | ||||||
| 402 | Lumentum Holdings, Inc.(a) | 20,470 | ||||||
| 1,217 | NETGEAR, Inc.(a) | 18,620 | ||||||
| 3,170 | NetScout Systems, Inc.(a) | 57,979 | ||||||
| 470 | Plexus Corporation(a) | 48,495 | ||||||
| 8,952 | Ribbon Communications, Inc.(a) | 29,452 | ||||||
| 1,700 | Sanmina Corporation(a) | 112,625 | ||||||
| 3,162 | TTM Technologies, Inc.(a) | 61,438 | ||||||
| 5,355 | Viavi Solutions, Inc.(a),(b) | 36,789 | ||||||
| 284 | Vishay Precision Group, Inc.(a) | 8,645 | ||||||
| 1,032 | VOXX International Corporation(a) | 3,261 | ||||||
| 9,537 | Xerox Holdings Corporation(b) | 110,820 | ||||||
| 1,264,538 | ||||||||
| TECHNOLOGY SERVICES - 0.7% | ||||||||
| 11,618 | Conduent, Inc.(a) | 37,875 | ||||||
| 10,851 | Dun & Bradstreet Holdings, Inc. | 100,480 | ||||||
| 4,749 | DXC Technology Company(a) | 90,659 | ||||||
| 2 | ICF International, Inc. | 297 | ||||||
| 11 | Insight Enterprises, Inc.(a),(b) | 2,182 | ||||||
| 108 | NetSol Technologies, Inc.(a) | 274 | ||||||
| 15 | Repay Holdings Corporation(a) | 158 | ||||||
| 1,268 | TTEC Holdings, Inc. | 7,456 | ||||||
| 239,381 | ||||||||
| TELECOMMUNICATIONS - 2.2% | ||||||||
| 1,153 | ATN International, Inc. | 26,288 | ||||||
| 11,814 | Consolidated Communications Holdings, Inc.(a) | 51,981 | ||||||
| 38 | EchoStar Corporation, Class A(a) | 677 | ||||||
See accompanying notes to financial statements.
34
| ACCLIVITY SMALL CAP VALUE FUND |
| SCHEDULE OF INVESTMENTS (Unaudited)(Continued) |
| June 30, 2024 |
| Shares | Value | |||||||
| COMMON STOCKS — 99.6% (Continued) | ||||||||
| TELECOMMUNICATIONS - 2.2% (Continued) | ||||||||
| 8,437 | Frontier Communications Parent, Inc.(a) | $ | 220,881 | |||||
| 372 | KVH Industries, Inc.(a) | 1,730 | ||||||
| 593 | Shenandoah Telecommunications Company | 9,684 | ||||||
| 10,135 | Telephone and Data Systems, Inc. | 210,098 | ||||||
| 4,217 | United States Cellular Corporation(a),(b) | 235,393 | ||||||
| 756,732 | ||||||||
| TOBACCO & CANNABIS - 0.3% | ||||||||
| 2,123 | Universal Corporation | 102,307 | ||||||
| TRANSPORTATION & LOGISTICS - 4.1% | ||||||||
| 5,001 | Air Transport Services Group, Inc.(a),(b) | 69,364 | ||||||
| 3,689 | Alaska Air Group, Inc.(a) | 149,036 | ||||||
| 683 | Allegiant Travel Company | 34,307 | ||||||
| 304 | ArcBest Corporation | 32,552 | ||||||
| 2,138 | Bristow Group, Inc.(a) | 71,687 | ||||||
| 517 | Covenant Logistics Group, Inc. | 25,483 | ||||||
| 1,014 | Heartland Express, Inc. | 12,503 | ||||||
| 1,553 | Hub Group, Inc., Class A | 66,857 | ||||||
| 38,596 | JetBlue Airways Corporation(a),(b) | 235,050 | ||||||
| 917 | Marten Transport Ltd. | 16,919 | ||||||
| 1,148 | Matson, Inc. | 150,353 | ||||||
| 4,909 | Overseas Shipholding Group, Inc., Class A | 41,628 | ||||||
| 854 | Radiant Logistics, Inc.(a) | 4,859 | ||||||
| 1,558 | Ryder System, Inc. | 193,005 | ||||||
| 2,108 | Schneider National, Inc., Class B | 50,929 | ||||||
| 1,519 | SkyWest, Inc.(a) | 124,664 | ||||||
| 3,203 | Sun Country Airlines Holdings, Inc.(a),(b) | 40,230 | ||||||
| 1,171 | Universal Logistics Holdings, Inc. | 47,531 | ||||||
| 1,308 | Werner Enterprises, Inc. | 46,866 | ||||||
| 1,413,823 | ||||||||
| TRANSPORTATION EQUIPMENT - 0.5% | ||||||||
| 1,453 | Commercial Vehicle Group, Inc.(a) | 7,120 | ||||||
| 1,611 | Greenbrier Companies, Inc. (The)(b) | 79,825 | ||||||
| 805 | REV Group, Inc. | 20,036 | ||||||
See accompanying notes to financial statements.
35
| ACCLIVITY SMALL CAP VALUE FUND |
| SCHEDULE OF INVESTMENTS (Unaudited)(Continued) |
| June 30, 2024 |
| Shares | Value | |||||||
| COMMON STOCKS — 99.6% (Continued) | ||||||||
| TRANSPORTATION EQUIPMENT - 0.5% (Continued) | ||||||||
| 1,032 | Trinity Industries, Inc. | $ | 30,877 | |||||
| 1,515 | Wabash National Corporation | 33,088 | ||||||
| 170,946 | ||||||||
| WHOLESALE - CONSUMER STAPLES - 0.5% | ||||||||
| 1,011 | Andersons, Inc. (The) | 50,145 | ||||||
| 1,715 | Grocery Outlet Holding Corporation(a) | 37,936 | ||||||
| 7,008 | United Natural Foods, Inc.(a) | 91,805 | ||||||
| 179,886 | ||||||||
| WHOLESALE - DISCRETIONARY - 1.1% | ||||||||
| 107 | Acme United Corporation | 3,752 | ||||||
| 866 | ePlus, Inc.(a) | 63,807 | ||||||
| 4,431 | G-III Apparel Group Ltd.(a) | 119,947 | ||||||
| 4,762 | OPENLANE, Inc.(a) | 79,002 | ||||||
| 904 | PC Connection, Inc. | 58,037 | ||||||
| 1,272 | ScanSource, Inc.(a) | 56,362 | ||||||
| 380,907 | ||||||||
| TOTAL COMMON STOCKS (Cost $32,508,438) | 34,566,859 | |||||||
| RIGHTS — 0.0%(c) | ||||||||
| FORESTRY, PAPER & WOOD PRODUCTS - 0.0%(c) | ||||||||
| 3,718 | Resolute Forest Products, Inc. - CVR(d) | 5,280 | ||||||
| RENEWABLE ENERGY - 0.0%(c) | ||||||||
| 2 | Pineapple Energy, Inc.(d) | 4 | ||||||
| TOTAL RIGHTS (Cost $5,280) | 5,284 | |||||||
See accompanying notes to financial statements.
36
| ACCLIVITY SMALL CAP VALUE FUND |
| SCHEDULE OF INVESTMENTS (Unaudited)(Continued) |
| June 30, 2024 |
| Shares | Value | |||||||
| SHORT-TERM INVESTMENTS — 13.3% | ||||||||
| COLLATERAL FOR SECURITIES LOANED — 13.0% | ||||||||
| 4,508,474 | Mount Vernon Liquid Assets Portfolio, 5.46%(e),(f) | $ | 4,508,474 | |||||
| MONEY MARKET FUND - 0.3% | ||||||||
| 105,321 | First American Treasury Obligations Fund, Class X, 5.21%(e) | 105,321 | ||||||
| TOTAL SHORT-TERM INVESTMENTS (Cost $4,613,795) | 4,613,795 | |||||||
| TOTAL INVESTMENTS - 112.9% (Cost $37,127,513) | $ | 39,185,938 | ||||||
| LIABILITIES IN EXCESS OF OTHER ASSETS - (12.9)% | (4,482,319 | ) | ||||||
| NET ASSETS - 100.0% | $ | 34,703,619 | ||||||
| (a) | Non-income producing security. |
| (b) | All or a portion of the security is on loan. The total fair value of the securities on loan as of June 30, 2024 was $4,419,550. |
| (c) | Amount represents less than 0.05%. |
| (d) | Fair value was determined using significant unobservable inputs. See Note 2. |
| (e) | Rate disclosed is the seven day effective yield as of June 30, 2024 |
| (f) | This security was purchased with cash collateral held from securities on loan. The total value of such securities as of June 30, 2024 is $4,508,474. |
See accompanying notes to financial statements.
37
| Acclivity Funds |
| STATEMENTS OF ASSETS AND LIABILITIES (Unaudited) |
| June 30, 2024 |
| Acclivity Mid Cap | Acclivity Small Cap | |||||||
| Multi-Style Fund | Value Fund | |||||||
| ASSETS | ||||||||
| Investment securities: | ||||||||
| At cost | $ | 4,376,153 | $ | 37,127,513 | ||||
| At value | $ | 4,554,457 | $ | 39,185,938 | ||||
| Receivable for investments sold | 20,197 | 145,683 | ||||||
| Receivable for Fund shares sold | — | 55,010 | ||||||
| Receivable for securities lending income | 53 | 639 | ||||||
| Dividends and interest receivable | 3,200 | 29,422 | ||||||
| Receivable due from Adviser | 16,764 | 21,236 | ||||||
| Prepaid expenses and other assets | 2,457 | 16,039 | ||||||
| TOTAL ASSETS | 4,597,128 | 39,453,967 | ||||||
| LIABILITIES | ||||||||
| Collateral on securities loaned (see note 4) | 577,846 | 4,508,474 | ||||||
| Payable for investments purchased | 44,642 | 212,717 | ||||||
| Payable for Fund shares redeemed | — | 6,746 | ||||||
| Payable to related parties | 7,603 | 7,783 | ||||||
| Accrued expenses and other liabilities | 15,047 | 14,628 | ||||||
| TOTAL LIABILITIES | 645,138 | 4,750,348 | ||||||
| NET ASSETS | $ | 3,951,990 | $ | 34,703,619 | ||||
| Net Assets Consist Of: | ||||||||
| Paid in capital | $ | 3,653,093 | $ | 30,791,376 | ||||
| Accumulated earnings | 298,897 | 3,912,243 | ||||||
| NET ASSETS | $ | 3,951,990 | $ | 34,703,619 | ||||
| Net Asset Value Per Share: | ||||||||
| Class I Shares: | ||||||||
| Net Assets | $ | 3,951,975 | $ | 34,697,908 | ||||
| Shares of beneficial interest outstanding ($0 par value, unlimited shares authorized) | 273,539 | 1,892,506 | ||||||
| Net asset value (Net Assets ÷ Shares Outstanding), offering price and redemption price per share | $ | 14.45 | $ | 18.33 | ||||
| Class N Shares: | ||||||||
| Net Assets | $ | 15 | $ | 5,711 | ||||
| Shares of beneficial interest outstanding ($0 par value, unlimited shares authorized) | 1 | 308 | ||||||
| Net asset value (Net Assets ÷ Shares Outstanding), offering price and redemption price per share | $ | 14.45 | (a) | $ | 18.56 | (a) | ||
| (a) | Net asset value may not recalculate due to the rounding of net assets and/or shares outstanding. |
See accompanying notes to financial statements.
38
| Acclivity Funds |
| STATEMENTS OF OPERATIONS (Unaudited) |
| For the Six Months Ended June 30, 2024 |
| Acclivity Mid Cap Multi | Acclivity Small Cap | |||||||
| Style Fund | Value Fund | |||||||
| INVESTMENT INCOME | ||||||||
| Dividends | $ | 17,222 | $ | 269,972 | ||||
| Interest | 911 | 5,165 | ||||||
| Securities Lending - Net of fees | 280 | 3,828 | ||||||
| TOTAL INVESTMENT INCOME | 18,413 | 278,965 | ||||||
| EXPENSES | ||||||||
| Investment advisory fees | 4,103 | 61,889 | ||||||
| Distribution (12b-1) fees: | ||||||||
| Class N | — | 7 | ||||||
| Administration fees | 14,555 | 23,229 | ||||||
| Transfer agent fees | 14,744 | 15,410 | ||||||
| Trustees’ fees | 14,582 | 14,554 | ||||||
| Legal fees | 11,442 | 11,446 | ||||||
| Audit fees | 7,458 | 7,436 | ||||||
| Registration fees | 1,301 | 12,991 | ||||||
| Shareholder reporting expense | 1,989 | 7,453 | ||||||
| Insurance expense | 4,044 | 4,290 | ||||||
| Compliance officer fees | 2,834 | 3,693 | ||||||
| Custody fees | 2,694 | 2,554 | ||||||
| Third party administrative servicing fees | — | 4,927 | ||||||
| Fund accounting fees | 188 | 3,935 | ||||||
| Other expenses | 1,503 | 1,500 | ||||||
| TOTAL EXPENSES | 81,437 | 175,314 | ||||||
| Less: Fees waived/reimbursed by the Adviser | (76,250 | ) | (97,284 | ) | ||||
| NET EXPENSES | 5,187 | 78,030 | ||||||
| NET INVESTMENT INCOME | 13,226 | 200,935 | ||||||
| REALIZED AND UNREALIZED GAIN/(LOSS) ON INVESTMENTS | ||||||||
| Net realized gain from investments | 142,853 | 1,594,644 | ||||||
| Net change in unrealized depreciation on investments | (15,797 | ) | (2,209,714 | ) | ||||
| NET REALIZED AND UNREALIZED GAIN/(LOSS) ON INVESTMENTS | 127,056 | (615,070 | ) | |||||
| NET INCREASE/(DECREASE) IN NET ASSETS RESULTING FROM OPERATIONS | $ | 140,282 | $ | (414,135 | ) | |||
See accompanying notes to financial statements.
39
| Acclivity Mid Cap Multi-Style Fund |
| STATEMENTS OF CHANGES IN NET ASSETS |
| For the Six Months Ended | For the Year Ended | |||||||
| June 30, 2024 | December 31, | |||||||
| (Unaudited) | 2023 | |||||||
| FROM OPERATIONS | ||||||||
| Net investment income | $ | 13,226 | $ | 9,379 | ||||
| Net realized gain/(loss) from investments | 142,853 | (31,895 | ) | |||||
| Net change in unrealized appreciation/(depreciation) of investments | (15,797 | ) | 173,463 | |||||
| Net increase in net assets resulting from operations | 140,282 | 150,947 | ||||||
| DISTRIBUTIONS TO SHAREHOLDERS | ||||||||
| Total Distributions Paid | ||||||||
| Class I | — | (8,541 | ) | |||||
| Class N | — | (0 | ) ^ | |||||
| Net decrease in net assets from distributions to shareholders | — | (8,541 | ) | |||||
| FROM SHARES OF BENEFICIAL INTEREST | ||||||||
| Proceeds from shares sold | ||||||||
| Class I | 2,247,307 | 950,000 | ||||||
| Net asset value of shares issued in reinvestment of distributions | ||||||||
| Class I | — | 8,541 | ||||||
| Class N | — | 0 | ^ | |||||
| Net increase in net assets from shares of beneficial interest | 2,247,307 | 958,541 | ||||||
| TOTAL INCREASE IN NET ASSETS | 2,387,589 | 1,100,947 | ||||||
| NET ASSETS | ||||||||
| Beginning of Year/Period | 1,564,401 | 463,454 | ||||||
| End of Year/Period | $ | 3,951,990 | $ | 1,564,401 | ||||
| SHARE ACTIVITY - CLASS I | ||||||||
| Shares sold | 157,787 | 75,423 | ||||||
| Shares reinvested | — | 675 | ||||||
| Net increase in shares of beneficial interest outstanding | 157,787 | 76,098 | ||||||
| SHARE ACTIVITY - CLASS N | ||||||||
| Shares reinvested | — | 0 | # | |||||
| Net increase in shares of beneficial interest outstanding | — | 0 | # | |||||
| ^ | Amount represents less than $0.50. |
| # | Amount represents less than 0.50 shares. |
See accompanying notes to financial statements.
40
| Acclivity Small Cap Value Fund |
| STATEMENTS OF CHANGES IN NET ASSETS |
| For the Six Months Ended | For the Year Ended | |||||||
| June 30, 2024 | December 31, | |||||||
| (Unaudited) | 2023 | |||||||
| FROM OPERATIONS | ||||||||
| Net investment income | $ | 200,935 | $ | 269,591 | ||||
| Net realized gain from investments | 1,594,644 | 222,890 | ||||||
| Net change in unrealized appreciation/(depreciation) of investments | (2,209,714 | ) | 3,852,107 | |||||
| Net increase/(decrease) in net assets resulting from operations | (414,135 | ) | 4,344,588 | |||||
| DISTRIBUTIONS TO SHAREHOLDERS | ||||||||
| Class I | — | (264,315 | ) | |||||
| Class N | — | (31 | ) | |||||
| Net decrease in net assets from distributions to shareholders | — | (264,346 | ) | |||||
| FROM SHARES OF BENEFICIAL INTEREST | ||||||||
| Proceeds from shares sold | ||||||||
| Class I | 11,528,612 | 13,062,929 | ||||||
| Class N | — | 5,200 | ||||||
| Net asset value of shares issued in reinvestment of distributions | ||||||||
| Class I | — | 215,943 | ||||||
| Class N | — | 31 | ||||||
| Payments for shares redeemed | ||||||||
| Class I | (4,381,528 | ) | (4,828,768 | ) | ||||
| Class N | — | (11,999 | ) | |||||
| Net increase in net assets from shares of beneficial interest | 7,147,084 | 8,443,336 | ||||||
| TOTAL INCREASE IN NET ASSETS | 6,732,949 | 12,523,578 | ||||||
| NET ASSETS | ||||||||
| Beginning of Year/Period | 27,970,670 | 15,447,092 | ||||||
| End of Year/Period | $ | 34,703,619 | $ | 27,970,670 | ||||
| SHARE ACTIVITY - CLASS I | ||||||||
| Shares sold | 627,622 | 786,115 | ||||||
| Shares reinvested | — | 12,763 | ||||||
| Shares redeemed | (236,420 | ) | (302,358 | ) | ||||
| Net increase in shares of beneficial interest outstanding | 391,202 | 496,520 | ||||||
| SHARE ACTIVITY - CLASS N | ||||||||
| Shares sold | — | 318 | ||||||
| Shares reinvested | — | 2 | ||||||
| Shares redeemed | — | (702 | ) | |||||
| Net decrease in shares of beneficial interest outstanding | — | (382 | ) | |||||
See accompanying notes to financial statements.
41
| Acclivity Mid Cap Multi-Style Fund |
| FINANCIAL HIGHLIGHTS |
Per Share Data and Ratios for a Share of Beneficial Interest Outstanding Throughout Each Year/Period
| Class I | ||||||||||||||||||||
| Six Months Ended | Year Ended | Year Ended | Year Ended | Period* Ended | ||||||||||||||||
| June 30, 2024 | December 31, | December 31, | December 31, | December 31, | ||||||||||||||||
| (Unaudited) | 2023 | 2022 | 2021 | 2020 | ||||||||||||||||
| Net asset value, beginning of year/period | $ | 13.51 | $ | 11.69 | $ | 13.39 | $ | 11.04 | $ | 10.00 | ||||||||||
| Activity from investment operations: | ||||||||||||||||||||
| Net investment income (1) | 0.08 | 0.15 | 0.17 | 0.13 | 0.10 | |||||||||||||||
| Net realized and unrealized gain/(loss) on investments | 0.86 | 1.75 | (1.49 | ) | 2.40 | 0.94 | ||||||||||||||
| Total from investment operations | 0.94 | 1.90 | (1.32 | ) | 2.53 | 1.04 | ||||||||||||||
| Less distributions from: | ||||||||||||||||||||
| Net investment income | — | (0.08 | ) | (0.15 | ) | (0.18 | ) | — | ||||||||||||
| Net realized gains | — | — | (0.23 | ) | (0.00 | ) (8) | — | |||||||||||||
| Total distributions | — | (0.08 | ) | (0.38 | ) | (0.18 | ) | — | ||||||||||||
| Net asset value, end of year/period | $ | 14.45 | $ | 13.51 | $ | 11.69 | $ | 13.39 | $ | 11.04 | ||||||||||
| Total return (2) | 6.96 | % (3)(9) | 16.32 | % (9) | (9.95 | )% | 22.93 | % | 10.40 | % (3) | ||||||||||
| Net assets, at end of year/period (000s) | $ | 3,952 | $ | 1,564 | $ | 463 | $ | 296 | $ | 142 | ||||||||||
| Ratio of gross expenses to average net assets (4)(5) | 6.91 | % (6) | 19.15 | % | 35.65 | % | 53.69 | % | 97.49 | % (6) | ||||||||||
| Ratio of net expenses to average net assets (5) | 0.44 | % (6) | 0.44 | % | 0.44 | % | 0.44 | % | 0.47 | % (6) | ||||||||||
| Ratio of net investment income to average net assets (5)(7) | 1.12 | % (6) | 1.21 | % | 1.38 | % | 1.05 | % | 1.07 | % (6) | ||||||||||
| Portfolio turnover rate | 58 | % (3) | 53 | % | 27 | % | 40 | % | 47 | % (3) | ||||||||||
| * | The inception date of the Acclivity Mid Cap Multi-Style Fund was December 31, 2019 and the Fund commenced operations on January 2, 2020. |
| (1) | Per share amounts calculated using the average shares method, which more appropriately presents the per share data for the year/period. |
| (2) | Had the Adviser not waived a portion of the Fund’s expenses, total returns would have been lower. |
| (3) | Not annualized. |
| (4) | Represents the ratio of expenses to average net assets absent fee waivers and/or expense reimbursements by the Adviser. |
| (5) | Does not include the expenses of other investment companies in which the Fund invests. |
| (6) | Annualized. |
| (7) | Recognition of net investment income by the Fund is affected by the timing of declaration of dividends by underlying investment companies in which the Fund invests. |
| (8) | Amount represents less than $0.005 per share. |
| (9) | Includes adjustments in accordance with accounting principles generally accepted in the United States and consequently, the net asset value for financial statement reporting purposes and the returns based upon those net assets may differ from the net asset values and returns for shareholder processing. |
See accompanying notes to financial statements.
42
| Acclivity Mid Cap Multi-Style Fund |
| FINANCIAL HIGHLIGHTS |
Per Share Data and Ratios for a Share of Beneficial Interest Outstanding Throughout Each Year/Period
| Class N | ||||||||||||||||||||
| Six Months Ended | Year Ended | Year Ended | Year Ended | Period* Ended | ||||||||||||||||
| June 30, 2024 | December 31, | December 31, | December 31, | December 31, | ||||||||||||||||
| (Unaudited) | 2023 | 2022 | 2021 | 2020 | ||||||||||||||||
| Net asset value, beginning of year/period | $ | 13.52 | $ | 11.69 | $ | 13.39 | $ | 11.04 | $ | 10.00 | ||||||||||
| Activity from investment operations: | ||||||||||||||||||||
| Net investment income (1) | 0.08 | 0.15 | 0.17 | 0.13 | 0.10 | |||||||||||||||
| Net realized and unrealized gain/(loss) on investments | 0.85 | 1.76 | (1.49 | ) | 2.40 | 0.94 | ||||||||||||||
| Total from investment operations | 0.93 | 1.91 | (1.32 | ) | 2.53 | 1.04 | ||||||||||||||
| Less distributions from: | ||||||||||||||||||||
| Net investment income | — | (0.08 | ) | (0.15 | ) | (0.18 | ) | — | ||||||||||||
| Net realized gains | — | — | (0.23 | ) | (0.00 | ) (9) | — | |||||||||||||
| Total distributions | — | (0.08 | ) | (0.38 | ) | (0.18 | ) | — | ||||||||||||
| Net asset value, end of year/period | $ | 14.45 | $ | 13.52 | $ | 11.69 | $ | 13.39 | $ | 11.04 | ||||||||||
| Total return (2) | 6.88 | % (3) | 16.41 | % | (9.95 | )% | 22.93 | % | 10.40 | % (3) | ||||||||||
| Net assets, at end of year/period (4) | $ | 15 | $ | 14 | $ | 12 | $ | 14 | $ | 11 | ||||||||||
| Ratio of gross expenses to average net assets (5)(6) | 7.16 | % (7) | 19.40 | % | 35.90 | % | 53.94 | % | 97.74 | % (7) | ||||||||||
| Ratio of net expenses to average net assets (6) | 0.69 | % (7) | 0.69 | % | 0.69 | % | 0.69 | % | 0.72 | % (7) | ||||||||||
| Ratio of net investment income to average net assets (6)(8) | 0.87 | % (7) | 0.96 | % | 1.13 | % | 0.80 | % | 0.82 | % (7) | ||||||||||
| Portfolio turnover rate | 58 | % (3) | 53 | % | 27 | % | 40 | % | 47 | % (3) | ||||||||||
| * | The inception date of the Acclivity Mid Cap Multi-Style Fund was December 31, 2019 and the Fund commenced operations on January 2, 2020. |
| (1) | Per share amounts calculated using the average shares method, which more appropriately presents the per share data for the year/period. |
| (2) | Had the Adviser not waived a portion of the Fund’s expenses, total returns would have been lower. |
| (3) | Not annualized. |
| (4) | Represents actual net assets. |
| (5) | Represents the ratio of expenses to average net assets absent fee waivers and/or expense reimbursements by the Adviser. |
| (6) | Does not include the expenses of other investment companies in which the Fund invests. |
| (7) | Annualized. |
| (8) | Recognition of net investment income by the Fund is affected by the timing of declaration of dividends by underlying investment companies in which the Fund invests. |
| (9) | Amount represents less than $0.005 per share. |
See accompanying notes to financial statements.
43
| Acclivity Small Cap Value Fund |
| FINANCIAL HIGHLIGHTS |
Per Share Data and Ratios for a Share of Beneficial Interest Outstanding Throughout Each Year/Period
| Class I | ||||||||||||||||||||||||
| Six Months Ended | Year Ended | Year Ended | Year Ended | Year Ended | Period* Ended | |||||||||||||||||||
| June 30, 2024 | December 31, | December 31, | December 31, | December 31, | December 31, | |||||||||||||||||||
| (Unaudited) | 2023 | 2022 | 2021 | 2020 | 2019 | |||||||||||||||||||
| Net asset value, beginning of year/period | $ | 18.63 | $ | 15.36 | $ | 16.76 | $ | 12.39 | $ | 11.76 | $ | 10.00 | ||||||||||||
| Activity from investment operations: | ||||||||||||||||||||||||
| Net investment income (1) | 0.12 | 0.23 | 0.22 | 0.25 | 0.21 | 0.15 | ||||||||||||||||||
| Net realized and unrealized gain/(loss) on investments | (0.42 | ) | 3.23 | (0.94 | ) | 4.53 | 0.67 | 1.69 | ||||||||||||||||
| Total from investment operations | (0.30 | ) | 3.46 | (0.72 | ) | 4.78 | 0.88 | 1.84 | ||||||||||||||||
| Less distributions from: | ||||||||||||||||||||||||
| Net investment income | — | (0.19 | ) | (0.17 | ) | (0.20 | ) | (0.01 | ) | (0.08 | ) | |||||||||||||
| Net realized gains | — | — | (0.51 | ) | (0.21 | ) | (0.24 | ) | — | |||||||||||||||
| Total distributions | — | (0.19 | ) | (0.68 | ) | (0.41 | ) | (0.25 | ) | (0.08 | ) | |||||||||||||
| Net asset value, end of year/period | $ | 18.33 | $ | 18.63 | $ | 15.36 | $ | 16.76 | $ | 12.39 | $ | 11.76 | ||||||||||||
| Total return (2) | (1.61 | )% (6) | 22.62 | % | (4.38 | )% | 38.60 | % | 7.51 | % | 18.44 | % (6) | ||||||||||||
| Net assets, at end of year/period (000s) | $ | 34,698 | $ | 27,965 | $ | 15,436 | $ | 10,648 | $ | 2,825 | $ | 2,827 | ||||||||||||
| Ratio of gross expenses to average net assets (3)(4) | 1.10 | % (5) | 1.57 | % | 1.99 | % | 3.63 | % | 5.62 | % | 14.59 | % (5) | ||||||||||||
| Ratio of net expenses to average net assets (4) | 0.49 | % (5) | 0.48 | % | 0.48 | % | 0.48 | % | 0.54 | % | 0.67 | % (5) | ||||||||||||
| Ratio of net investment income to average net assets (4)(7) | 1.26 | % (5) | 1.42 | % | 1.38 | % | 1.53 | % | 2.12 | % | 1.34 | % (5) | ||||||||||||
| Portfolio turnover rate | 50 | % (6) | 56 | % | 59 | % | 60 | % | 65 | % | 166 | % (6) | ||||||||||||
| * | The inception date of the Acclivity Small Cap Value Fund was December 31, 2018 and the Fund commenced operations on January 2, 2019. |
| (1) | Per share amounts calculated using the average shares method, which more appropriately presents the per share data for the year/period. |
| (2) | Had the Adviser not waived a portion of the Fund’s expenses, total returns would have been lower. |
| (3) | Represents the ratio of expenses to average net assets absent fee waivers and/or expense reimbursements by the Adviser. |
| (4) | Does not include the expenses of other investment companies in which the Fund invests. |
| (5) | Annualized. |
| (6) | Not annualized. |
| (7) | Recognition of net investment income by the Fund is affected by the timing of declaration of dividends by the underlying investment companies in which the Fund invests. |
See accompanying notes to financial statements.
44
| Acclivity Small Cap Value Fund |
| FINANCIAL HIGHLIGHTS |
Per Share Data and Ratios for a Share of Beneficial Interest Outstanding Throughout Each Year/Period
| Class N | ||||||||||||||||||||||||
| Six Months Ended | Year Ended | Year Ended | Year Ended | Year Ended | Period* Ended | |||||||||||||||||||
| June 30, 2024 | December 31, | December 31, | December 31, | December 31, | December 31, | |||||||||||||||||||
| (Unaudited) | 2023 | 2022 | 2021 | 2020 | 2019 | |||||||||||||||||||
| Net asset value, beginning of year/period | $ | 18.87 | $ | 15.52 | $ | 16.91 | $ | 12.37 | $ | 11.75 | $ | 10.00 | ||||||||||||
| Activity from investment operations: | ||||||||||||||||||||||||
| Net investment income (1) | 0.09 | 0.17 | 0.20 | 0.16 | 0.26 | 0.16 | ||||||||||||||||||
| Net realized and unrealized gain/(loss) on investments | (0.40 | ) | 3.28 | (0.92 | ) | 4.59 | 0.61 | 1.67 | ||||||||||||||||
| Total from investment operations | (0.31 | ) | 3.45 | (0.72 | ) | 4.75 | 0.87 | 1.83 | ||||||||||||||||
| Less distributions from: | ||||||||||||||||||||||||
| Net investment income | — | (0.10 | ) | (0.16 | ) | — | (0.01 | ) | (0.08 | ) | ||||||||||||||
| Net realized gains | — | — | (0.51 | ) | (0.21 | ) | (0.24 | ) | — | |||||||||||||||
| Total distributions | — | (0.10 | ) | (0.67 | ) | (0.21 | ) | (0.25 | ) | (0.08 | ) | |||||||||||||
| Net asset value, end of year/period | $ | 18.56 | $ | 18.87 | $ | 15.52 | $ | 16.91 | $ | 12.37 | $ | 11.75 | ||||||||||||
| Total return (2) | (1.64 | )% (6)(9) | 22.31 | % (9) | (4.35 | )% | 38.40 | % | 7.43 | % | 18.34 | % (6) | ||||||||||||
| Net assets, at end of year/period (000s) | $ | 6 | $ | 6 | $ | 11 | $ | 18 | (7) | $ | 10 | $ | 12 | (7) | ||||||||||
| Ratio of gross expenses to average net assets (3)(4) | 1.35 | % (5) | 1.85 | % | 1.54 | % | 3.88 | % | 5.87 | % | 81.62 | % (5) | ||||||||||||
| Ratio of net expenses to average net assets (4) | 0.74 | % (5) | 0.73 | % | 0.73 | % | 0.73 | % | 0.79 | % | 0.92 | % (5) | ||||||||||||
| Ratio of net investment income to average net assets (4)(8) | 0.99 | % (5) | 1.07 | % | 1.25 | % | 1.28 | % | 1.87 | % | 1.44 | % (5) | ||||||||||||
| Portfolio turnover rate | 50 | % (6) | 56 | % | 59 | % | 60 | % | 65 | % | 166 | % (6) | ||||||||||||
| * | The inception date of the Acclivity Small Cap Value Fund was December 31, 2018 and the Fund commenced operations on January 2, 2019. |
| (1) | Per share amounts calculated using the average shares method, which more appropriately presents the per share data for the year/period. |
| (2) | Had the Adviser not waived a portion of the Fund’s expenses, total returns would have been lower. |
| (3) | Represents the ratio of expenses to average net assets absent fee waivers and/or expense reimbursements by the Adviser. |
| (4) | Does not include the expenses of other investment companies in which the Fund invests. |
| (5) | Annualized. |
| (6) | Not annualized. |
| (7) | Represents actual net assets. |
| (8) | Recognition of net investment income by the Fund is affected by the timing of declaration of dividends by the underlying investment companies in which the Fund invests. |
| (9) | Includes adjustments in accordance with accounting principles generally accepted in the United States and consequently, the net asset value for financial statement reporting purposes and the returns based upon those net assets may differ from the net asset values and returns for shareholder processing. |
See accompanying notes to financial statements.
45
| Acclivity Funds |
| NOTES TO FINANCIAL STATEMENTS (Unaudited) |
| June 30, 2024 |
| 1. | ORGANIZATION |
The Acclivity Mid Cap Multi-Style Fund (the “Mid Cap Fund”) and Acclivity Small Cap Value Fund (the “Small Cap Fund”) (each a “Fund,” collectively the “Funds”) are each a diversified series of shares of beneficial interest of Northern Lights Fund Trust II (the “Trust”), a statutory trust organized under the laws of the State of Delaware on August 26, 2010, and are registered under the Investment Company Act of 1940, as amended (the “1940 Act”), as open-end management investment companies. The inception date of the Mid Cap Fund was December 31, 2019, and the Mid Cap Fund commenced operations on January 2, 2020. The inception date of the Small Cap Fund was December 31, 2018, and the Small Cap Fund commenced operations on January 2, 2019. The Funds seek long term capital appreciation.
The Funds currently offer Class I shares and Class N shares. Class I and Class N shares are offered at net asset value without an initial sales charge. Class N shares are subject to a 0.25% Rule 12b-1 distribution and shareholder servicing fee. Each class represents an interest in the same assets of a Fund and classes are identical except for differences in ongoing service and distribution charges. All classes of shares have equal voting privileges except that each class has exclusive voting rights with respect to its shareholder service and/or distribution plans.
| 2. | SIGNIFICANT ACCOUNTING POLICIES |
The following is a summary of significant accounting policies followed by the Funds in preparation of their financial statements. The policies are in conformity with accounting principles generally accepted in the United States of America (“GAAP”). The preparation of financial statements requires management to make estimates and assumptions that affect the reported amounts of assets and liabilities and disclosure of contingent assets and liabilities at the date of the financial statements and the reported amounts of income and expenses for the period. Actual results could differ from those estimates. The Funds are each an investment company and accordingly follow the investment company accounting and reporting guidance of the Financial Accounting Standards Board (“FASB”) Accounting Standard Codification Topic 946 “Financial Services – Investment Companies”.
Security Valuation – Securities listed on an exchange are valued at the last reported sale price at the close of the regular trading session of the primary exchange on the business day the value is being determined, or in the case of securities listed on NASDAQ at the NASDAQ Official Closing Price (“NOCP”). In the absence of a sale, such securities shall be valued at the mean between the current bid and ask prices on the day of valuation. Investments valued in currencies other than the U.S. dollar are converted to U.S. dollars using exchange rates obtained from pricing services. Short-term debt obligations having 60 days or less remaining until maturity, at time of purchase, may be valued at amortized cost.
The Fund may hold securities, such as private investments, interests in commodity pools, other non- traded securities or temporarily illiquid securities, for which market quotations are not readily available or are determined to be unreliable. These securities are valued using the “fair value” procedures approved by the Board. The Board has designated the adviser as its valuation designee (the “Valuation Designee”) to execute these procedures. The Board may also enlist third party consultants such as
46
| Acclivity Funds |
| NOTES TO FINANCIAL STATEMENTS (Unaudited)(Continued) |
| June 30, 2024 |
valuation specialist at a public accounting firm, valuation consultant or financial officer of a security issuer on an as-needed basis to assist the Valuation Designee in determining a security-specific fair value. The Board is responsible for reviewing and approving fair value methodologies utilized by the Valuation Designee, approval of which shall be based upon whether the Valuation Designee followed the valuation procedures established by the Board.
Fair Valuation Process – The applicable investments are valued by the Valuation Designee pursuant to valuation procedures established by the Board. For example, fair value determinations are required for the following securities: (i) securities for which market quotations are insufficient or not readily available on a particular business day (including securities for which there is a short and temporary lapse in the provision of a price by the regular pricing source); (ii) securities for which, in the judgment of the Valuation Designee, the prices or values available do not represent the fair value of the instrument; factors which may cause the Valuation Designee to make such a judgment include, but are not limited to, the following: only a bid price or an asked price is available; the spread between bid and asked prices is substantial; the frequency of sales; the thinness of the market; the size of reported trades; and actions of the securities markets, such as the suspension or limitation of trading; (iii) securities determined to be illiquid; and (iv) securities with respect to which an event that affects the value thereof has occurred (a “significant event”) since the closing prices were established on the principal exchange on which they are traded, but prior to a Fund’s calculation of its net asset value. Specifically, interests in commodity pools or managed futures pools are valued on a daily basis by reference to the closing market prices of each futures contract or other asset held by a pool, as adjusted for pool expenses. Restricted or illiquid securities, such as private investments or non-traded securities are valued based upon the current bid for the security from two or more independent dealers or other parties reasonably familiar with the facts and circumstances of the security (who should take into consideration all relevant factors as may be appropriate under the circumstances). If a current bid from such independent dealers or other independent parties is unavailable, the Valuation Designee shall determine the fair value of such security using the following factors: (i) the type of security; (ii) the cost at date of purchase; (iii) the size and nature of the Fund’s holdings; (iv) the discount from market value of unrestricted securities of the same class at the time of purchase and subsequent thereto; (v) information as to any transactions or offers with respect to the security; (vi) the nature and duration of restrictions on disposition of the security and the existence of any registration rights; (vii) how the yield of the security compares to similar securities of companies of similar or equal creditworthiness; (viii) the level of recent trades of similar or comparable securities; (ix) the liquidity characteristics of the security; (x) current market conditions; and (xi) the market value of any securities into which the security is convertible or exchangeable.
Each Fund utilizes various methods to measure fair value of all of its investments on a recurring basis. GAAP establishes the hierarchy that prioritizes inputs to valuation methods. The three levels of input are:
Level 1 – Unadjusted quoted prices in active markets for identical assets and liabilities that each Fund has the ability to access.
Level 2 – Observable inputs other than quoted prices included in Level 1 that are observable for the asset or liability, either directly or indirectly. These inputs may include quoted prices for the identical
47
| Acclivity Funds |
| NOTES TO FINANCIAL STATEMENTS (Unaudited)(Continued) |
| June 30, 2024 |
instrument in an inactive market, prices for similar instruments, interest rates, prepayment speeds, credit risk, yield curves, default rates and similar data.
Level 3 – Unobservable inputs for the asset or liability, to the extent relevant observable inputs are not available, representing a Fund’s own assumptions about the assumptions a market participant would use in valuing the asset or liability, and would be based on the best information available.
The availability of observable inputs can vary from security to security and is affected by a wide variety of factors, including, for example, the type of security, whether the security is new and not yet established in the marketplace, the liquidity of markets, and other characteristics particular to the security. To the extent that valuation is based on models or inputs that are less observable or unobservable in the market, the determination of fair value requires more judgment. Accordingly, the degree of judgment exercised in determining fair value is greatest for instruments categorized in Level 3.
The inputs used to measure fair value may fall into different levels of the fair value hierarchy. In such cases, for disclosure purposes, the level in the fair value hierarchy within which the fair value measurement falls in its entirety, is determined based on the lowest level input that is significant to the fair value measurement in its entirety.
The inputs or methodology used for valuing securities are not necessarily an indication of the risk associated with investing in those securities. The following tables summarize the inputs used as of June 30, 2024 for each Fund’s assets measured at fair value:
| Mid Cap Fund | ||||||||||||||||
| Assets * | Level 1 | Level 2 | Level 3 | Total | ||||||||||||
| Common Stocks | $ | 3,947,099 | $ | — | $ | — | $ | 3,947,099 | ||||||||
| Rights | — | — | 8 | 8 | ||||||||||||
| Short-Term Investments | 607,350 | — | — | 607,350 | ||||||||||||
| Total | $ | 4,554,449 | $ | — | $ | 8 | $ | 4,554,457 | ||||||||
| Small Cap Fund | ||||||||||||||||
| Assets * | Level 1 | Level 2 | Level 3 | Total | ||||||||||||
| Common Stocks | $ | 34,566,859 | $ | — | $ | — | $ | 34,566,859 | ||||||||
| Rights | — | — | 5,284 | 5,284 | ||||||||||||
| Short-Term Investments | 4,613,795 | — | — | 4,613,795 | ||||||||||||
| Total | $ | 39,180,654 | $ | — | $ | 5,284 | $ | 39,185,938 | ||||||||
| * | See each Fund’s Schedule of Investments for classification. |
48
| Acclivity Funds |
| NOTES TO FINANCIAL STATEMENTS (Unaudited)(Continued) |
| June 30, 2024 |
The following table is a reconciliation of assets in which Level 3 inputs were used in determining value for the Mid Cap Fund:
| Bristol-Meyers | ||||||||
| ABIOMED, Inc. | Squibb Company | |||||||
| Beginning Balance | $ | 7 | $ | — | ||||
| Total realized gain/(loss) | — | — | ||||||
| Unrealized Appreciation/(Depreciation) | — | — | ||||||
| Cost of Purchases | — | $ | 1 | |||||
| Proceeds from Sales | — | — | ||||||
| Proceeds from Principal | — | — | ||||||
| Accrued Interest | — | — | ||||||
| Net transfers in/out of level 3 | — | — | ||||||
| Ending Balance | $ | 7 | $ | 1 | ||||
The following table is a reconciliation of assets in which Level 3 inputs were used in determining value for the Small Cap Fund:
| Pineapple Energy, | Resolute Forest | |||||||
| Inc. | Products, Inc. - CVR | |||||||
| Beginning Balance | $ | 4 | $ | 5,280 | ||||
| Total realized gain/(loss) | — | — | ||||||
| Unrealized Appreciation/(Depreciation) | — | — | ||||||
| Cost of Purchases | — | — | ||||||
| Proceeds from Sales | — | — | ||||||
| Proceeds from Principal | — | — | ||||||
| Accrued Interest | — | — | ||||||
| Net transfers in/out of level 3 | — | — | ||||||
| Ending Balance | $ | 4 | $ | 5,280 | ||||
Security Transactions and Related Income – Security transactions are accounted for on trade date. Interest income is recognized on an accrual basis. Discounts are accreted and premiums are amortized on securities purchased over the lives of the respective securities. Dividend income is recorded on the ex-dividend date. Realized gains or losses from sales of securities are determined by comparing the identified cost of the security lot sold with the net sales proceeds. Each Fund’s income, expenses (other than class specific distribution fees) and realized and unrealized gains and losses are allocated proportionately each day based upon the relative net assets of each class.
Dividends and Distributions to Shareholders – Dividends from net investment income, if any, are declared and paid annually. Distributable net realized capital gains, if any, are declared and distributed annually in December. Dividends from net investment income and distributions from net realized gains are determined in accordance with federal income tax regulations, which may differ from GAAP. These “book/tax” differences are considered either temporary (i.e., deferred losses) or permanent in nature.
49
| Acclivity Funds |
| NOTES TO FINANCIAL STATEMENTS (Unaudited)(Continued) |
| June 30, 2024 |
To the extent these differences are permanent in nature, such amounts are reclassified within the composition of net assets based on their Federal tax-basis treatment; temporary differences do not require reclassification. Dividends and distributions to shareholders are recorded on ex-dividend date.
Federal Income Taxes – Each Fund intends to continue to comply with the requirements of the Internal Revenue Code applicable to regulated investment companies and to distribute all of their taxable income to their shareholders. Therefore, no provision for federal income tax is required. The Funds recognize the tax benefits of uncertain tax positions only where the position is “more likely than not” to be sustained assuming examination by tax authorities. Management has analyzed each Fund’s tax positions and has concluded that no liability for unrecognized tax benefits should be recorded related to uncertain tax positions taken on returns filed for open tax years December 31, 2020- December 31, 2022 year end, or expected to be taken in the Funds’ December 31, 2023 tax returns. Each Fund has identified its major tax jurisdictions as U.S. Federal, Ohio, and foreign jurisdictions where the Funds make significant investments. The Funds are not aware of any tax positions for which it is reasonably possible that the total amounts of unrecognized tax benefits will change materially in the next twelve months.
Expenses – Expenses of the Trust that are directly identifiable to a specific fund are charged to that fund. Expenses, which are not readily identifiable to a specific fund, are allocated in such a manner as deemed equitable, taking into consideration the nature and type of expense and the relative sizes of the funds in the Trust.
Indemnification – The Trust indemnifies its officers and Trustees for certain liabilities that may arise from the performance of their duties to the Trust. Additionally, in the normal course of business, the Funds enter into contracts that contain a variety of representations and warranties and which provide general indemnities. Each Fund’s maximum exposure under these arrangements is unknown, as this would involve future claims that may be made against a Fund that have not yet occurred. However, based on experience, the Funds expect the risk of loss due to these warranties and indemnities to be remote.
| 3. | INVESTMENT TRANSACTIONS |
For the six months ended June 30, 2024, cost of purchases and proceeds from sales of portfolio securities, other than short-term investments, amounted to:
| Purchases | Sales | |||||||
| Mid Cap | $ | 3,619,263 | $ | 1,363,636 | ||||
| Small Cap | 23,085,130 | 15,771,462 | ||||||
50
| Acclivity Funds |
| NOTES TO FINANCIAL STATEMENTS (Unaudited)(Continued) |
| June 30, 2024 |
| 4. | SECURITIES LENDING |
The Funds have entered into a securities lending arrangement with U.S. Bank National Association (the “Borrower”). Under the terms of the agreement, the Funds were authorized to loan securities to the Borrower. In exchange, the Funds received cash collateral in the amount of at least 102% of the value of the securities loaned. Securities lending income is disclosed in the Funds’ Statements of Operations. Although risk was mitigated by the collateral, the Funds could have experienced a delay in recovering their securities and possible loss of income or value if the Borrower failed to return such securities on loan.
Gain or loss in the fair value of securities loaned that may occur during the term of the loan will be recognized by the Funds. The Funds have the right under the securities lending agreement to recover the securities from the Borrower on demand. If the fair value of the collateral falls below 102% plus accrued interest of the loaned securities, the lender’s agent shall request additional collateral from the Borrower to bring the collateralization back to 102%. Under the terms of the securities lending agreement, the Funds are indemnified for such losses by the security lending agreement. Should the borrower of the securities fail financially, the Funds have the right to repurchase the securities using the collateral in the open market.
The following table represents financial instruments that are subject to enforceable netting arrangements as of June 30, 2024:
| Gross Amounts not Offset in the | ||||||||||||||||||||||||
| Statements of Assets and Liabilities | ||||||||||||||||||||||||
| Gross Amounts | Net Amounts of | |||||||||||||||||||||||
| offset in the | Assets Presented | |||||||||||||||||||||||
| Gross Amount of | Statements of | in the Statements | ||||||||||||||||||||||
| Recognized | Assets and | of Assets and | Financial | Cash Collateral | ||||||||||||||||||||
| Assets | Liabilities | Liabilities | Instruments | Pledged | Net Amount | |||||||||||||||||||
| Mid Cap | $ | 577,846 | $ | — | $ | 577,846 | $ | 577,846 | $ | — | $ | 577,846 | ||||||||||||
| Small Cap | $ | 4,508,474 | $ | — | $ | 4,508,474 | $ | 4,508,474 | $ | — | $ | 4,508,474 | ||||||||||||
The following table breaks out the holdings pledged as collateral as of December 31, 2023:
| Secured Borrowings | ||||
| Securities Lending Transactions | ||||
| Overnight and Continuous | ||||
| Mid Cap | ||||
| Mount Vernon Liquid Assets Portfolio | $ | 577,846 | ||
| $ | 577,846 | |||
| Small Cap | ||||
| Mount Vernon Liquid Assets Portfolio | $ | 4,508,474 | ||
| $ | 4,508,474 |
51
| Acclivity Funds |
| NOTES TO FINANCIAL STATEMENTS (Unaudited)(Continued) |
| June 30, 2024 |
| 5. | INVESTMENT ADVISORY AGREEMENT AND TRANSACTIONS WITH RELATED PARTIES |
Innealta Capital, LLC (the “Adviser”) serves as investment adviser to the Funds. Pursuant to an Advisory Agreement with the Funds, the Adviser, under the oversight of the Board, directs the daily operations of the Funds and supervises the performance of administrative and professional services provided by others. The Funds pay the Adviser a management fee at an annual rate of 0.35% and 0.39% of the Mid Cap Fund’s and Small Cap Fund’s average daily net assets, respectively. For the six months ended June 30, 2024, the Adviser earned $4,103 and $61,889 from the Mid Cap Fund and Small Cap Fund, respectively.
Pursuant to a written contract (the “Waiver Agreement”), the Adviser has agreed, at least until April 30, 2025, to waive a portion of its advisory fee and has agreed to reimburse each Fund for other expenses to the extent necessary so that the total expenses incurred by each Fund (excluding any front-end or contingent deferred sales loads, brokerage fees and commissions, acquired fund fees and expenses, borrowing costs (such as interest and dividend expense on securities sold short), taxes and extraordinary expenses such as litigation) do not exceed 0.44% and 0.69% for Class I and Class N shares of the Mid Cap Fund, respectively, and 0.48% and 0.73% for Class I and Class N shares of the Small Cap Fund, respectively.
If the Adviser waives any fee or reimburses any expenses pursuant to the Waiver Agreement for a Fund, and a Fund’s operating expenses are subsequently lower than its respective expense limitation, the Adviser shall be entitled to reimbursement by a Fund provided that such reimbursement does not cause a Fund’s operating expenses to exceed its expense limitation. If a Fund’s operating expenses subsequently exceed its expense limitation, the reimbursements for a Fund shall be suspended. The Adviser may seek reimbursement only for expenses waived or paid by it during the rolling three years prior to such reimbursement; provided, however, that such expenses may only be reimbursed to the extent they were waived or paid after the date of the Waiver Agreement (or any similar agreement). The Board may terminate this expense reimbursement arrangement at any time. For the six months ended June 30, 2024, the Adviser waived advisory fees and reimbursed the Mid Cap Fund and Small Cap Fund for expenses in the amounts of $76,250 and $97,284, respectively.
The following amounts are subject to recapture by the Funds by the following date:
| 12/31/2024 | 12/31/2025 | 12/31/2026 | ||||||||||
| Mid Cap | $ | 142,515 | $ | 139,862 | $ | 145,240 | ||||||
| Small Cap | $ | 161,991 | $ | 182,812 | $ | 206,945 | ||||||
As of December 31, 2023, $107,373 and 117,329 in waived fees expired unrecouped for the Mid Cap Fund and Small Cap Fund, respectively.
Distributor – The distributor for the Funds is Northern Lights Distributors, LLC (the “Distributor”). The Board has adopted the Trust’s Master Distribution and Shareholder Servicing Plans for Class N shares (the “Plan”) pursuant to Rule 12b-1 under the 1940 Act to pay for ongoing distribution-related activities or shareholder services. Under the Plan, the Funds are permitted to pay a fee at an annual
52
| Acclivity Funds |
| NOTES TO FINANCIAL STATEMENTS (Unaudited)(Continued) |
| June 30, 2024 |
rate of 0.25% of the average daily net assets of Class N shares. For the six months ended June 30, 2024, pursuant to the Class N Plan, the Mid Cap Fund and Small Cap Fund incurred $0 and $7 in 12b-1 fees, respectively.
The Distributor acts as the Funds’ principal underwriter in a continuous public offering of each Fund’s shares. For the six months ended June 30, 2024, the Funds did not pay the Distributor any underwriting fees.
In addition, certain affiliates of the Distributor provide services to the Funds as follows:
Ultimus Fund Solutions, LLC (“UFS”) – UFS, an affiliate of the Distributor, provides administration, fund accounting, and transfer agent services to the Trust. Pursuant to separate servicing agreements with UFS, the Funds pay UFS customary fees for providing administration, fund accounting, and transfer agency services to the Funds. Certain officers of the Trust are also officers of UFS and are not paid any fees directly by the Funds for serving in such capacities.
Northern Lights Compliance Services, LLC (“NLCS”) – NLCS, an affiliate of UFS and the Distributor, provides a Chief Compliance Officer to the Trust, as well as related compliance services, pursuant to a consulting agreement between NLCS and the Trust. Under the terms of such agreement, NLCS receives customary fees from the Funds.
Blu Giant, LLC (“Blu Giant”) – Blu Giant, an affiliate of UFS and the Distributor, provides EDGAR conversion and filing services as well as print management services for the Funds on an ad-hoc basis. For the provision of these services, Blu Giant receives customary fees from the Funds.
| 6. | AGGREGATE UNREALIZED APPRECIATION AND DEPRECIATION – TAX BASIS |
The identified cost of investments in securities owned by each Fund for federal income tax purposes, and its respective gross unrealized appreciation and depreciation at June 30, 2024, were as follows:
| Tax | Gross Unrealized | Gross Unrealized | Net Unrealized | |||||||||||||
| Cost | Appreciation | Depreciation | Appreciation | |||||||||||||
| Mid Cap Fund | $ | 4,376,084 | $ | 256,592 | $ | (78,219 | ) | $ | 178,373 | |||||||
| Small Cap Fund | 37,135,292 | 4,066,826 | (2,016,180 | ) | 2,050,646 | |||||||||||
53
| Acclivity Funds |
| NOTES TO FINANCIAL STATEMENTS (Unaudited)(Continued) |
| June 30, 2024 |
| 6. | SHAREHOLDERS & TAX COMPONENTS OF CAPITAL |
The tax character of fund distributions paid for the period ended December 31, 2023 and December 31, 2022 was as follows:
| For fiscal year ended | Ordinary | Long-Term | ||||||||||
| 12/31/2023 | Income | Capital Gains | Total | |||||||||
| Mid Cap Fund | $ | 8,541 | $ | — | $ | 8,541 | ||||||
| Small Cap Fund | 251,554 | 12,792 | 264,346 | |||||||||
| For fiscal year ended | Ordinary | Long-Term | ||||||||||
| 12/31/2022 | Income | Capital Gains | Total | |||||||||
| Mid Cap Fund | $ | 5,654 | $ | 8,663 | $ | 14,317 | ||||||
| Small Cap Fund | 157,254 | 477,958 | 635,212 | |||||||||
As of December 31, 2023, the components of accumulated earnings/(deficit) on a tax basis were as follows:
| Undistributed | Undistributed | Post October Loss | Capital Loss | Other | Unrealized | Total | ||||||||||||||||||||||
| Ordinary | Long-Term | and | Carry | Book/Tax | Appreciation/ | Accumulated | ||||||||||||||||||||||
| Income | Capital Gains | Late Year Loss | Forwards | Differences | (Depreciation) | Earnings/(Deficits) | ||||||||||||||||||||||
| Mid Cap Fund | $ | 471 | $ | — | $ | (2,721 | ) | $ | (33,305 | ) | $ | — | $ | 194,170 | $ | 158,615 | ||||||||||||
| Small Cap Fund | — | 66,018 | — | — | — | 4,260,360 | 4,326,378 | |||||||||||||||||||||
The difference between book basis and tax basis undistributed net investment income/(loss), accumulated net realized gain/(loss), and unrealized appreciation/(depreciation) from investments is primarily attributable to the tax deferral of losses on wash sales and C-Corporation return of capital distributions.
Capital losses incurred after October 31 within the fiscal year are deemed to arise on the first business day of the following fiscal year for tax purposes. The Funds incurred and elected to defer such capital losses as follows:
| Post October | ||||
| Losses | ||||
| Mid Cap Fund | $ | 2,721 | ||
| Small Cap Fund | — | |||
54
| Acclivity Funds |
| NOTES TO FINANCIAL STATEMENTS (Unaudited)(Continued) |
| June 30, 2024 |
At December 31, 2023, the Funds had capital loss carry forwards for federal income tax purposes available to offset future capital gains as follows:
| Non-Expiring | ||||||||||||||||
| Short-Term | Long-Term | Total | CLCF Utilized | |||||||||||||
| Mid Cap Fund | $ | 22,223 | $ | 11,082 | $ | 33,305 | $ | — | ||||||||
| Small Cap Fund | — | — | — | — | ||||||||||||
Permanent book and tax differences, primarily attributable to the book/tax basis treatment adjustments for prior year tax returns, resulted in reclassifications for the Funds for the fiscal year ended December 31, 2023, as follows:
| Paid In | Accumulated | |||||||
| Capital | Earnings (Losses) | |||||||
| Mid Cap Fund | $ | (64 | ) | $ | 64 | |||
| Small Cap Fund | 7,042 | (7,042 | ) | |||||
| 7. | CONTROL OWNERSHIP |
The beneficial ownership, either directly or indirectly, of more than 25% of the voting securities of a Fund creates presumption of control of the Fund, under Section 2(a)(9) of the 1940 Act. As of June 30, 2024, beneficial ownership in excess of 25% for the Funds is as follows:
| % of | ||||
| Outstanding | ||||
| Beneficial Owner | Shares | |||
| Mid Cap Fund | National Financial Services, LLC | 41% | ||
| Innealta Capital, LLC | 29% | |||
| Riomaggiore Investments, LLC | 29% | |||
| Small Cap Fund | National Financial Services, LLC | 37% | ||
| Charles Schwab & Co. | 25% |
The Trust has no knowledge as to whether all or any portion of the shares owned of record are also owned beneficially.
| 8. | SUBSEQUENT EVENTS |
Subsequent events after the date of the Statements of Assets and Liabilities have been evaluated through the date the financial statements were issued. Management has determined that no events or transactions occurred requiring adjustment or disclosure in the financial statements.
55
| Acclivity Funds |
| SUPPLEMENTAL INFORMATION (Unaudited) |
| June 30, 2024 |
FACTORS CONSIDERED BY THE TRUSTEES IN THE APPROVAL OF THE RENEWAL OF THE INVESTMENT ADVISORY AGREEMENT
At a Regular meeting (the Meeting ) of the Board of Trustees (the Board ) of Northern Lights Fund Trust II (the Trust ) held on October 25, 2023, the Board, including the disinterested Trustees (the Independent Trustees ), considered the renewal of the Investment Advisory Agreement between the Trust, on behalf of the Acclivity Mid Cap Multi-Style Fund ( Acclivity Mid-Cap ) and the Acclivity Small Cap Value Fund ( Acclivity Small Cap Value , and collectively with Acclivity Mid-Cap, the Acclivity Funds ) and Innealta Capital, LLC ( Innealta ) (the Innealta Advisory Agreement ).
Based on their evaluation of the information provided by Innealta in conjunction with Acclivity Small Cap Value s and Acclivity Mid-Cap s other service providers, the Board, by a unanimous vote (including a separate vote of the Independent Trustees), approved the renewal of the Innealta Advisory Agreement with respect to Acclivity Small Cap Value and Acclivity Mid- Cap.
In advance of the Meeting, the Board requested and received materials to assist them in considering the renewal of the Innealta Advisory Agreement. The materials provided contained information with respect to the factors enumerated below, including the Innealta Advisory Agreement, a memorandum prepared by the Trust s outside legal counsel discussing in detail the Trustees fiduciary obligations and the factors they should assess in considering the continuation of the Innealta Advisory Agreement and comparative information relating to the advisory fee and other expenses of Acclivity Small Cap Value and Acclivity Mid-Cap. The materials also included due diligence materials relating to Innealta (including due diligence questionnaires completed by Innealta, select financial information of Innealta, bibliographic information regarding Innealta s key management and investment advisory personnel, and comparative fee information relating to Acclivity Small Cap Value and Acclivity Mid-Cap) and other pertinent information. At the Meeting, the Independent Trustees were advised by counsel that is experienced in Investment Company Act of 1940 matters and that is independent of fund management and met with such counsel separately from fund management.
The Board reviewed and discussed the written materials that were provided in advance of the Meeting and deliberated on the renewal of the Innealta Advisory Agreement with respect to Acclivity Small Cap Value and Acclivity Mid-Cap. The Board relied upon the advice of independent legal counsel and their own business judgment in determining the material factors to be considered in evaluating the Innealta Advisory Agreement and the weight to be given to each such factor. The conclusions reached by the Board were based on a comprehensive evaluation of all of the information provided and were not the result of any one factor. Moreover, each Trustee may have afforded different weight to the various factors in reaching his conclusions with respect to the Innealta Advisory Agreement. In considering the approval of the renewal of the Innealta Advisory Agreement, the Board reviewed and analyzed various factors that they determined were relevant, including the factors enumerated below.
56
| Acclivity Funds |
| SUPPLEMENTAL INFORMATION (Unaudited)(Continued) |
| June 30, 2024 |
Nature, Extent and Quality of Services. The Board reviewed materials provided by Innealta related to the proposed renewal of the Innealta Advisory Agreement, including Innealta s Form ADV and related schedules, a description of the manner in which investment decisions are made and executed, a review of the personnel performing services for each of Acclivity Small Cap Value and Acclivity Mid-Cap, including the team of individuals that primarily monitor and execute the investment process. The Board discussed Innealta s research capabilities, the quality of Innealta s compliance infrastructure and the experience of its management personnel. Additionally, the Board received satisfactory responses from the representative of Innealta with respect to a series of important questions, including: whether Innealta was involved in any lawsuits or pending regulatory actions; whether the management of other accounts would conflict with its management of Acclivity Small Cap Value and Acclivity Mid-Cap; whether there were procedures in place to adequately allocate trades among Innealta s respective clients; and whether Innealta s CCO would routinely review the portfolio managers performance of their duties to ensure compliance under Innealta s compliance program. The Board also reviewed the information provided on the practices for monitoring compliance with each of Acclivity Small Cap Value and Acclivity Mid-Cap s investment limitations. The Board also discussed details of Innealta s compliance program with the CCO of the Trust. The Board noted that the CCO of the Trust continued to represent that Innealta s policies and procedures were reasonably designed to prevent violations of applicable federal securities laws. The Board also noted Innealta s representation that the prospectus and statement of additional information for Acclivity Small Cap Value and Acclivity Mid-Cap accurately describe such Acclivity Fund s investment strategies. The Board then reviewed the capitalization of Innealta based on financial information provided, and representations made by Innealta and its representatives, and concluded that Innealta was sufficiently well-capitalized, or Innealta s owners had the ability to make additional contributions, in order to meet its obligations to each of Acclivity Small Cap Value and Acclivity Mid-Cap. The Board concluded that Innealta had sufficient quality and depth of personnel, resources, investment methods and compliance policies and procedures essential to performing its duties under the Innealta Advisory Agreement and that the nature, overall quality and extent of the management services to be provided by Innealta to each of Acclivity Small Cap Value and Acclivity Mid-Cap were satisfactory.
Performance. The Board then discussed the report prepared by Broadridge and reviewed the performance of Acclivity Small Cap Value and Acclivity Mid-Cap as compared to its respective peer group, Morningstar category and benchmark for the one-year, three-year and since inception periods ended September 30, 2023. With respect to Acclivity Small Cap Value, the Board noted that Acclivity Small Cap Value outperformed its peer group median and Morningstar category median, but underperformed its benchmark (the S&P 500 Total Return Index) for the one-year and since inception periods, and outperformed its peer group median, Morningstar category median, and benchmark for the three-year period. With respect to Acclivity Mid-Cap, the Board noted that Acclivity Mid-Cap outperformed its peer group median, and Morningstar category median (Mid-Cap blend category), but underperformed its benchmark (the S&P 500 Total Return Index) for the one-year and since inception periods, and outperformed its peer group median, Morningstar category median, and benchmark for the three-year period The Board noted the portfolio managers ability to manage risk and the
57
| Acclivity Funds |
| SUPPLEMENTAL INFORMATION (Unaudited)(Continued) |
| June 30, 2024 |
robust investment team. After further discussion, the Board concluded that each of Acclivity Mid-Cap and Acclivity Small Cap Value s past performance was acceptable and generally in line with its risk level.
Fees and Expenses. As to the costs of the services to be provided by Innealta, the Board reviewed and discussed each of Acclivity Small Cap Value and Acclivity Mid-Cap s advisory fee and total operating expenses as compared to its respective peer group and Morningstar category as presented in the Broadridge Report. The Board reviewed the contractual arrangements, noting that Innealta charges an advisory fee at an annual rate of 0.39% and 0.35% of the average daily net assets of Acclivity Small Cap Value and Acclivity Mid-Cap, respectively, under the Innealta Advisory Agreement. The Board noted the advisory fee for Acclivity Small Cap Value and Acclivity Mid-Cap was significantly lower than the peer group median and Morningstar category median. The Board also reviewed the net expenses for each of Acclivity Small Cap Value and Acclivity Mid-Cap as compared to its peer group and Morningstar category. The Board then reviewed the Operating Expenses Limitation Agreement noting that Innealta had agreed to waive or limit its advisory fee and/or reimburse expenses at least until April 30, 2025, in order to limit net annual operating expenses, exclusive of certain fees, so as not to exceed 0.48% and 0.73% of Acclivity Small Cap Value s average net assets for Class I and Class N shares, respectively, and 0.44% and 0.69% of Acclivity Mid-Cap s average net assets for Class I and Class N shares, respectively, and found such arrangements to be beneficial to shareholders. The Board concluded that, based on Innealta s experience, expertise and services provided to each of Acclivity Small Cap Value and Acclivity Mid-Cap, the advisory fee charged by Innealta for each of Acclivity Small Cap Value and Acclivity Mid-Cap was not unreasonable.
Profitability. The Board also considered the level of profits that could be expected to accrue to Innealta with respect to each of Acclivity Small Cap Value and Acclivity Mid-Cap based on profitability reports and analyses prepared by Innealta and reviewed by the Board and the selected financial information of Innealta provided by Innealta. After review and discussion, the Board concluded that the profit from Innealta s relationship with each of Acclivity Small Cap Value and Acclivity Mid-Cap was not excessive.
Economies of Scale. As to the extent to which each of Acclivity Small Cap Value and Acclivity Mid-Cap would realize economies of scale as it grew, and whether the fee levels reflect these economies of scale for the benefit of investors, the Board discussed the current size of each of Acclivity Small Cap Value and Acclivity Mid-Cap, and Innealta s expectations for growth, and concluded that any material economies of scale would likely not be achieved in the near term.
Conclusion. The Board relied upon the advice of counsel, and their own business judgment in determining the material factors to be considered in evaluating the Innealta Advisory Agreement and the weight to be given to each such factor. Accordingly, having requested and received such information from Innealta as the Board believed to be reasonably necessary to evaluate the terms of the Innealta Advisory Agreement, and as assisted by the advice of independent counsel, the Board, including a majority of the Independent Trustees voting separately, determined that with respect to each of the Acclivity Funds separately, (a) the terms of the Innealta Advisory Agreement are not unreasonable; (b) the investment advisory fee is not unreasonable; and (c)
58
| Acclivity Funds |
| SUPPLEMENTAL INFORMATION (Unaudited)(Continued) |
| June 30, 2024 |
the Innealta Advisory Agreement is in the best interests of each of the Acclivity Funds and its shareholders. In considering the renewal of the Innealta Advisory Agreement, the Board did not identify any one factor as all important, but rather considered these factors collectively and determined that renewal of the Innealta Advisory Agreement was in the best interest of each of the Acclivity Funds and its shareholders. Moreover, the Board noted that each Trustee may have afforded different weight to the various factors in reaching his conclusions with respect to the Innealta Advisory Agreement.
59
PROXY VOTING POLICY
Information regarding how the Funds voted proxies relating to portfolio securities for the most recent twelve month period ended June 30 as well as a description of the policies and procedures that the Funds use to determine how to vote proxies is available without charge, upon request, by calling 1-855-873-3837 or by referring to the Securities and Exchange Commission s ( SEC ) website at http://www.sec.gov.
PORTFOLIO HOLDINGS
Funds file a complete schedule of portfolio holdings with the Securities and Exchange Commission (the SEC ) for the first and third quarters of each fiscal year as an exhibit to its reports on Form N-PORT, within sixty days after the end of the period. Form N-PORT reports are available at the SEC s website at www.sec.gov.
| INVESTMENT ADVISER |
| Innealta Capital, LLC |
| 13215 Bee Cave Pkwy, Bldg A, Suite 240 |
| Austin, Texas 78738 |
| ADMINISTRATOR |
| Ultimus Fund Solutions, LLC |
| 225 Pictoria Drive, Suite 450 |
| Cincinnati, OH 45246 |
Item 8. Changes in and Disagreements with Accountants for Open-End Management Investment Companies. Not applicable.
Item 9. Proxy Disclosures for Open-End Management Investment Companies.
Not applicable
Item 10. Remuneration Paid to Directors, Officers, and Others of Open-End Management Investment Companies.
Included under Item 7
Item 11. Statement Regarding Basis for Approval of Investment Advisory Contract.
Not applicable
Item 12. Disclosure of Proxy Voting Policies and Procedures for Closed-End Management Investment Companies.
Not applicable
Item 13. Portfolio Managers of Closed-End Management Investment Companies.
Not applicable
Item 14. Purchases of Equity Securities by Closed-End Management Investment Company and Affiliated Purchasers.
Not applicable
Item 15. Submission of Matters to a Vote of Security Holders.
None
Item 16. Controls and Procedures
(a) The registrant’s Principal Executive Officer and Principal Financial Officer have concluded that the registrant’s disclosure controls and procedures (as defined in Rule 30a-3(c) under the Act) are effective in design and operation and are sufficient to form the basis of the certifications required by Rule 30a-(2) under the Act, based on their evaluation of these disclosure controls and procedures as of a date within 90 days of this report on Form N-CSR.
(b) There were no changes in the registrant’s internal control over financial reporting (as defined in Rule 30a-3(d) under the Act) during the period covered by this report that have materially affected, or are reasonably likely to materially affect, the registrant’s internal control over financial reporting.
Item 17. Disclosure of Securities Lending Activities for Closed-End Management Investment Companies.
Not applicable
Item 18. Recovery of Erroneously Awarded Compensation.
(a) Not applicable
(b) Not applicable
Item 19. Exhibits.
(a)(1) Not applicable
(a)(2) Not applicable
(a)(3) A separate certification for each principal executive officer and principal financial officer of the registrant as required by Rule 30a-2(a) under the Act (17 CFR 270.30a-2(a)): Attached hereto.
(a)(4) Not applicable
(b) Certifications required by Rule 30a-2(b) under the Act (17 CFR 270.30a-2(b)): Attached hereto
SIGNATURES
Pursuant to the requirements of the Securities Exchange Act of 1934 and the Investment Company Act of 1940, the registrant has duly caused this report to be signed on its behalf by the undersigned, thereunto duly authorized.
| (Registrant) | Northern Lights Fund Trust II |
By (Signature and Title)
| /s/ Kevin E. Wolf |
| Kevin E. Wolf, Principal Executive Officer/President |
| Date | 09/05/24 |
Pursuant to the requirements of the Securities Exchange Act of 1934 and the Investment Company Act of 1940, this report has been signed below by the following persons on behalf of the registrant and in the capacities and on the dates indicated.
By (Signature and Title)
| /s/ Kevin E. Wolf |
| Kevin E. Wolf, Principal Executive Officer/President |
| Date | 09/05/24 |
By (Signature and Title)
| /s/ Erik Naviloff |
| Erik Naviloff, Principal Financial Officer/ Treasurer |
| Date | 09/05/24 |