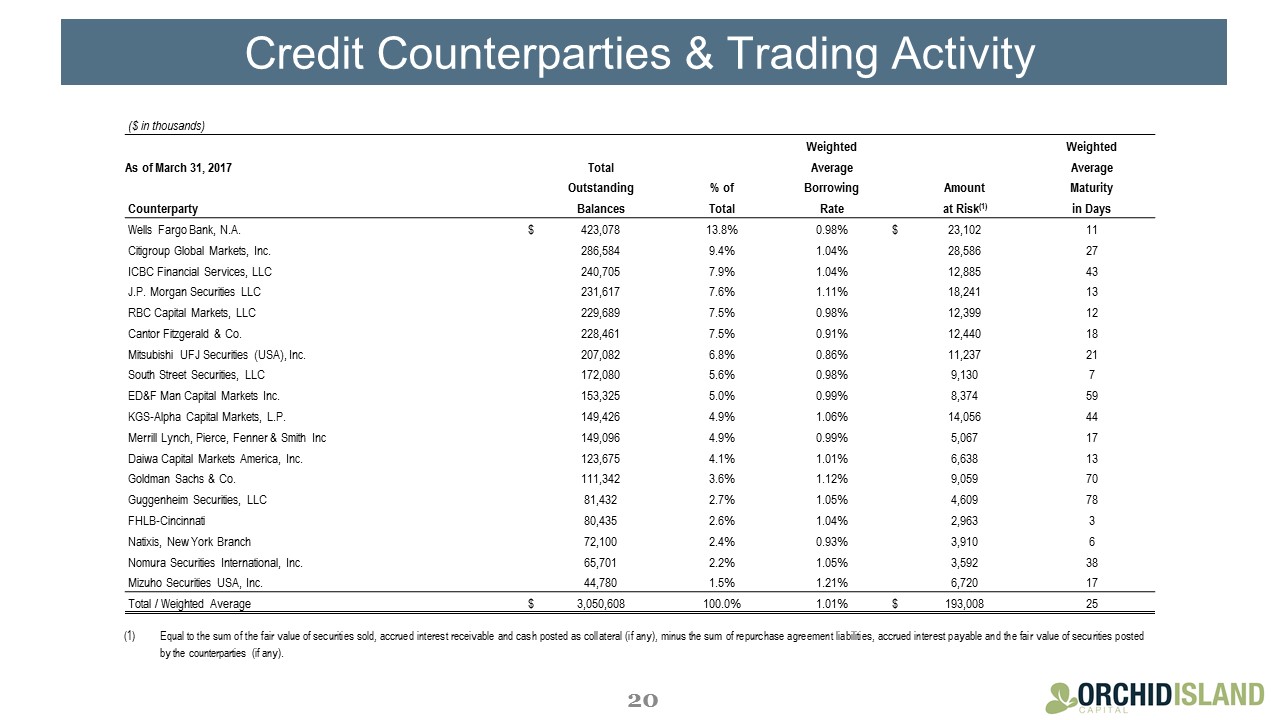
Credit Counterparties & Trading Activity ($ in thousands) Weighted Weighted As of March 31, 2017 Total Average Average Outstanding % of Borrowing Amount Maturity Counterparty Balances Total Rate at Risk(1) in Days Wells Fargo Bank, N.A. $ 423,078 13.8% 0.98% $ 23,102 11 Citigroup Global Markets, Inc. 286,584 9.4% 1.04% 28,586 27 ICBC Financial Services, LLC 240,705 7.9% 1.04% 12,885 43 J.P. Morgan Securities LLC 231,617 7.6% 1.11% 18,241 13 RBC Capital Markets, LLC 229,689 7.5% 0.98% 12,399 12 Cantor Fitzgerald & Co. 228,461 7.5% 0.91% 12,440 18 Mitsubishi UFJ Securities (USA), Inc. 207,082 6.8% 0.86% 11,237 21 South Street Securities, LLC 172,080 5.6% 0.98% 9,130 7 ED&F Man Capital Markets Inc. 153,325 5.0% 0.99% 8,374 59 KGS-Alpha Capital Markets, L.P. 149,426 4.9% 1.06% 14,056 44 Merrill Lynch, Pierce, Fenner & Smith Inc 149,096 4.9% 0.99% 5,067 17 Daiwa Capital Markets America, Inc. 123,675 4.1% 1.01% 6,638 13 Goldman Sachs & Co. 111,342 3.6% 1.12% 9,059 70 Guggenheim Securities, LLC 81,432 2.7% 1.05% 4,609 78 FHLB-Cincinnati 80,435 2.6% 1.04% 2,963 3 Natixis, New York Branch 72,100 2.4% 0.93% 3,910 6 Nomura Securities International, Inc. 65,701 2.2% 1.05% 3,592 38 Mizuho Securities USA, Inc. 44,780 1.5% 1.21% 6,720 17 Total / Weighted Average $ 3,050,608 100.0% 1.01% $ 193,008 25 20 Equal to the sum of the fair value of securities sold, accrued interest receivable and cash posted as collateral (if any), minus the sum of repurchase agreement liabilities, accrued interest payable and the fair value of securities posted by the counterparties (if any).