
Annual Meeting of Shareholders June 20, 2019 Nasdaq: HMST
Items of Business I. The election of three Class II directors to serve on the Company’s board of directors (the “Board”) until the 2022 annual meeting of shareholders, or until their respective successors are elected and qualified; II. The approval on an advisory (non-binding) basis of the compensation of the Company’s named executive officers; III. The ratification on advisory (non-binding) basis of the appointment of Deloitte & Touche, LLP as the Company’s independent registered public accounting firm for the year ending December 31, 2019; IV. The ratification of a bylaw amendment adopted by the Company in 2018, providing that Washington State shall be the exclusive forum for shareholder actions against the Company; V. The approval of amendment to the Second Amended and Restated Articles of Incorporation of the Company, as amended (the “Articles of Incorporation”) to declassify the Board and provide for the annual election of directors; VI. The approval of an amendment to the Articles of Incorporation to eliminate the supermajority shareholder vote requirement to approve major corporate changes; VII. Approval of a shareholder proposal related to the Company’s bylaws; and VIII. Approval of a shareholder proposal related to the independence of the Chairman of the Board p. 1

Report on 2018 Mark K. Mason Chairman, President, & CEO p. 2

Important Disclosures Forward-Looking Statements This presentation, as well as other information provided from time to time by the Company or its employees, may contain forward-looking statements that involve risks and uncertainties that could cause actual results to differ materially from those anticipated in the forward-looking statements. Forward-looking statements give the Company’s current beliefs, expectations and intentions regarding future events. You can identify forward-looking statements by the fact that they do not relate strictly to historical or current facts. These statements may include words such as “anticipate,” “believe,” “could,” “estimate,” “expect,” “intend,” “may,” “plan,” “potential,” “should,” “will” and “would” and similar expressions (including the negative of these terms). These forward-looking statements involve risks, uncertainties (some of which are beyond the Company’s control) and assumptions. Although we believe that expectations reflected in the forward-looking statements are reasonable, we cannot guarantee future results, levels of activity, performance or achievements. The Company intends these forward-looking statements to speak only at the time of this presentation and the Company does not undertake to update or revise these statements as more information becomes available, except as required under federal securities laws and the rules and regulations of the SEC. Please refer to the risk factors discussed in the Company’s Quarterly Report on Form 10-Q for the quarter ended March 31, 2019 and subsequent periodic and current reports filed with the SEC (each of which can be found at the SEC’s website www.sec.gov), as well as other factors described from time to time in the Company’s filings with the SEC. Any forward-looking statement made by the Company in this presentation speaks only as of the date on which it is made. Basis of Presentation of Financial Data Unless noted otherwise in this presentation, all reported financial data is being presented as of the year ended December 31, 2018. All financial data should be read in conjunction with our audited consolidated financial statements and the notes thereto. Non-GAAP Financial Measures This presentation contains financial measures such as core measures or tangible measures that are not prepared in accordance with U.S. generally accepted accounting principles (“GAAP”). Definitions of such non-GAAP financial measures and reconciliations of those measures to their GAAP equivalents may be found in the appendix. p. 3

Important Additional Information Important Additional Information The Company has filed a definitive proxy statement on Schedule 14A and accompanying WHITE proxy card with the Securities and Exchange Commission (the “SEC”) in connection with the solicitation of proxies for its 2019 Annual Meeting of Shareholders. SHAREHOLDERS ARE STRONGLY ADVISED TO READ THE COMPANY’S DEFINITIVE PROXY STATEMENT (INCLUDING ANY AMENDMENTS OR SUPPLEMENTS THERETO) AND ANY OTHER DOCUMENTS FILED WITH THE SEC WHEN THEY BECOME AVAILABLE BECAUSE THEY WILL CONTAIN IMPORTANT INFORMATION. Shareholders may obtain a free copy of the proxy statement and accompanying WHITE proxy card, any amendments or supplements to the proxy statement and other documents that the Company files with the SEC from the SEC’s website at www.sec.gov or the Company’s website at http://ir.homestreet.com as soon as reasonably practicable after such materials are electronically filed with, or furnished to, the SEC. p. 4
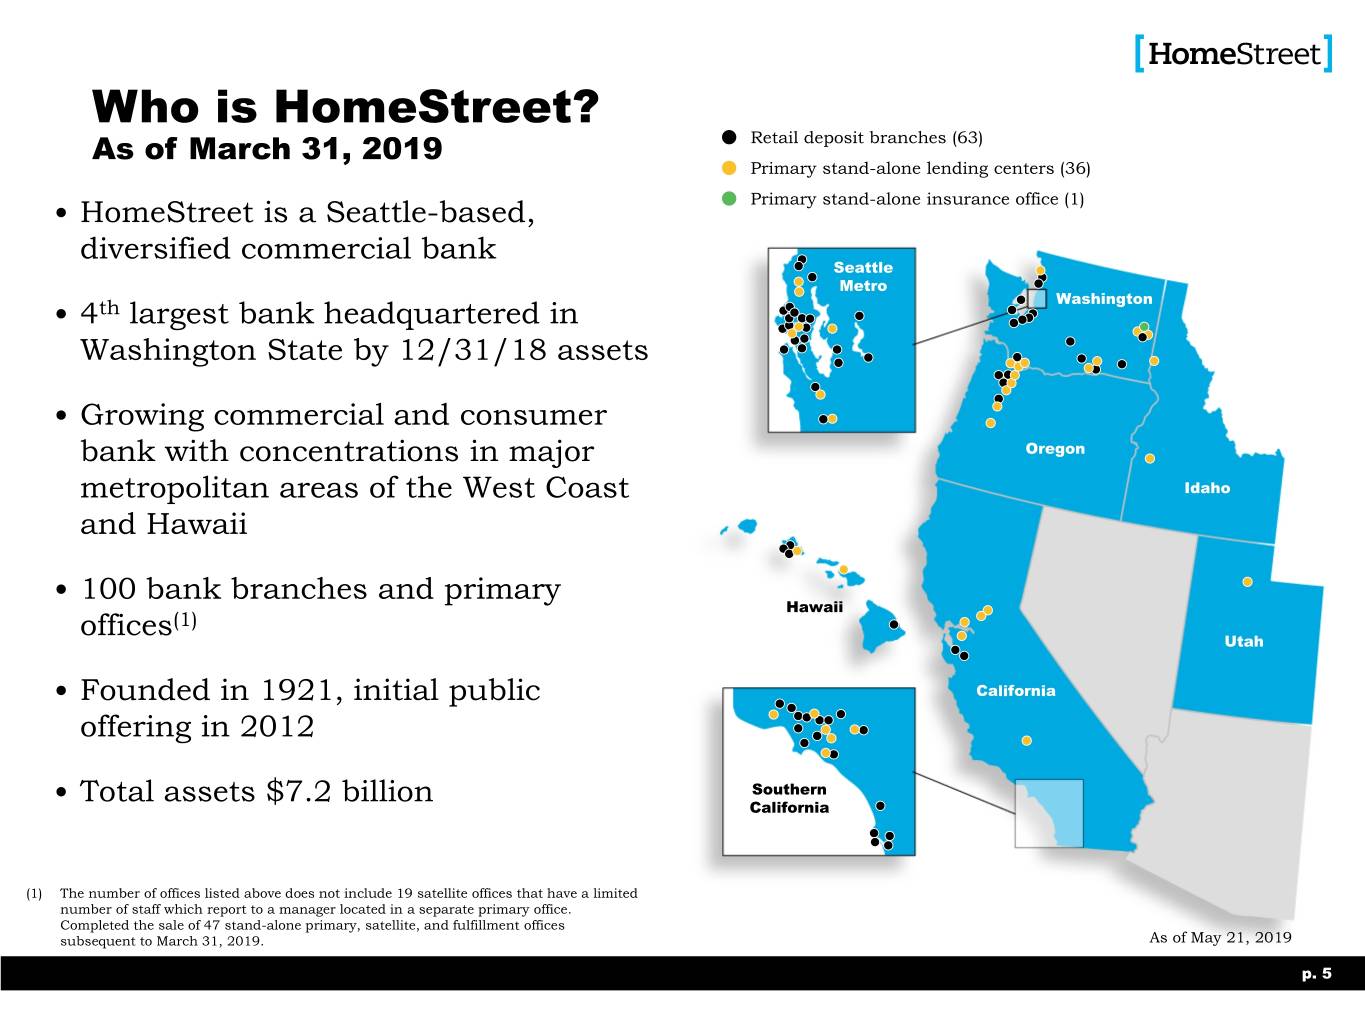
Who is HomeStreet? As of March 31, 2019 Retail deposit branches (63) Primary stand-alone lending centers (36) • HomeStreet is a Seattle-based, Primary stand-alone insurance office (1) diversified commercial bank Seattle Metro Washington • 4th largest bank headquartered in Washington State by 12/31/18 assets • Growing commercial and consumer bank with concentrations in major Oregon metropolitan areas of the West Coast Idaho and Hawaii • 100 bank branches and primary Hawaii offices(1) Utah • Founded in 1921, initial public California offering in 2012 Total assets $7.2 billion Southern • California (1) The number of offices listed above does not include 19 satellite offices that have a limited number of staff which report to a manager located in a separate primary office. Completed the sale of 47 stand-alone primary, satellite, and fulfillment offices subsequent to March 31, 2019. As of May 21, 2019 p. 5

Consistent Asset Growth Compound annual growth rate of 19% & compound organic growth rate of 14% Total Assets Bank & Branch M&A $ Millions Organic Growth March 2019: November 2016: 1 Branch ($117M) February 2016: 2 Branches ($105M) $8,000 OCCB ($200M) September 2017: August 2016: 1 Branch ($22M) $7,000 The Bank of December 2015: Oswego ($42M) 1 Branch ($26M) $6,000 March 2015: Simplicity ($879M) $5,000 November 2013: Fortune ($142M) Yakima ($125M) $4,000 December 2013 2 Branches ($32M) $3,000 $2,000 1Q13 2Q13 3Q13 4Q13 1Q14 2Q14 3Q14 4Q14 1Q15 2Q15 3Q15 4Q15 1Q16 2Q16 3Q16 4Q16 1Q17 2Q17 3Q17 4Q17 1Q18 2Q18 3Q18 4Q18 1Q19 p. 6

Consistent Deposit Growth Compound annual growth rate of 19% & compound organic growth rate of 13% Total Deposits $ Millions De Novo Branch Openings San Jose Santa Clara Riverside Mill Creek Point Loma Lake City $6,000 Gig Harbor Kaimuki Kennewick $5,500 Mission Gorge Kearny Mesa Baldwin Park Spokane Redmond $5,000 University $4,500 Issaquah $4,000 Phinney Ridge $3,500 Greenlake Madison PK $3,000 Ballard Everett $2,500 Capitol Hill $2,000 $1,500 $1,000 1Q13 2Q13 3Q13 4Q13 1Q14 2Q14 3Q14 4Q14 1Q15 2Q15 3Q15 4Q15 1Q16 2Q16 3Q16 4Q16 1Q17 2Q17 3Q17 4Q17 1Q18 2Q18 3Q18 4Q18 1Q19 p. 7
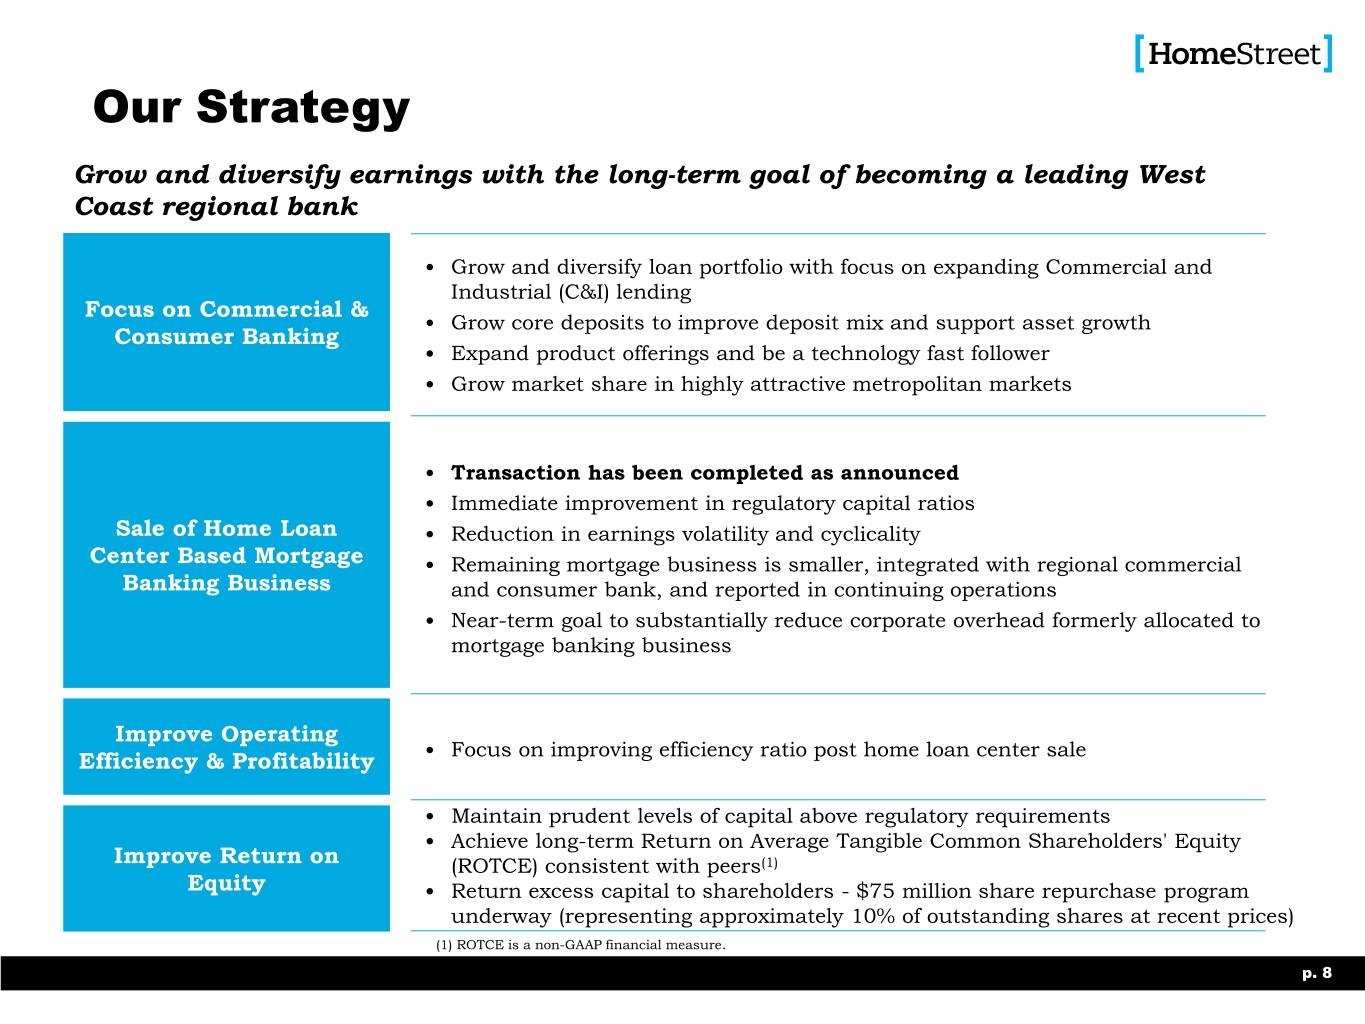
Our Strategy Grow and diversify earnings with the long-term goal of becoming a leading West Coast regional bank • Grow and diversify loan portfolio with focus on expanding Commercial and Industrial (C&I) lending Focus on Commercial & • Grow core deposits to improve deposit mix and support asset growth Consumer Banking • Expand product offerings and be a technology fast follower • Grow market share in highly attractive metropolitan markets • Transaction has been completed as announced • Immediate improvement in regulatory capital ratios Sale of Home Loan • Reduction in earnings volatility and cyclicality Center Based Mortgage • Remaining mortgage business is smaller, integrated with regional commercial Banking Business and consumer bank, and reported in continuing operations • Near-term goal to substantially reduce corporate overhead formerly allocated to mortgage banking business Improve Operating Focus on improving efficiency ratio post home loan center sale Efficiency & Profitability • • Maintain prudent levels of capital above regulatory requirements • Achieve long-term Return on Average Tangible Common Shareholders' Equity Improve Return on (ROTCE) consistent with peers(1) Equity • Return excess capital to shareholders - $75 million share repurchase program underway (representing approximately 10% of outstanding shares at recent prices) (1) ROTCE is a non-GAAP financial measure. p. 8

Commercial & Consumer Bank Traditional banking services with a full suite of deposit products, including cash management, treasury services and mobile banking Product Offerings Commercial real Commercial & estate loans C&I Industrial (C&I) loans Small Business Construction lending Administration (SBA) Lending Non-deposit investment products and insurance $226 $5.1 million billion 63 2018 Segment 2018 Loans Held Retail Branches Revenue(1) for Investment (1) 2018 total net revenue was $439 million. Total net revenue is net interest income and noninterest income. p. 9
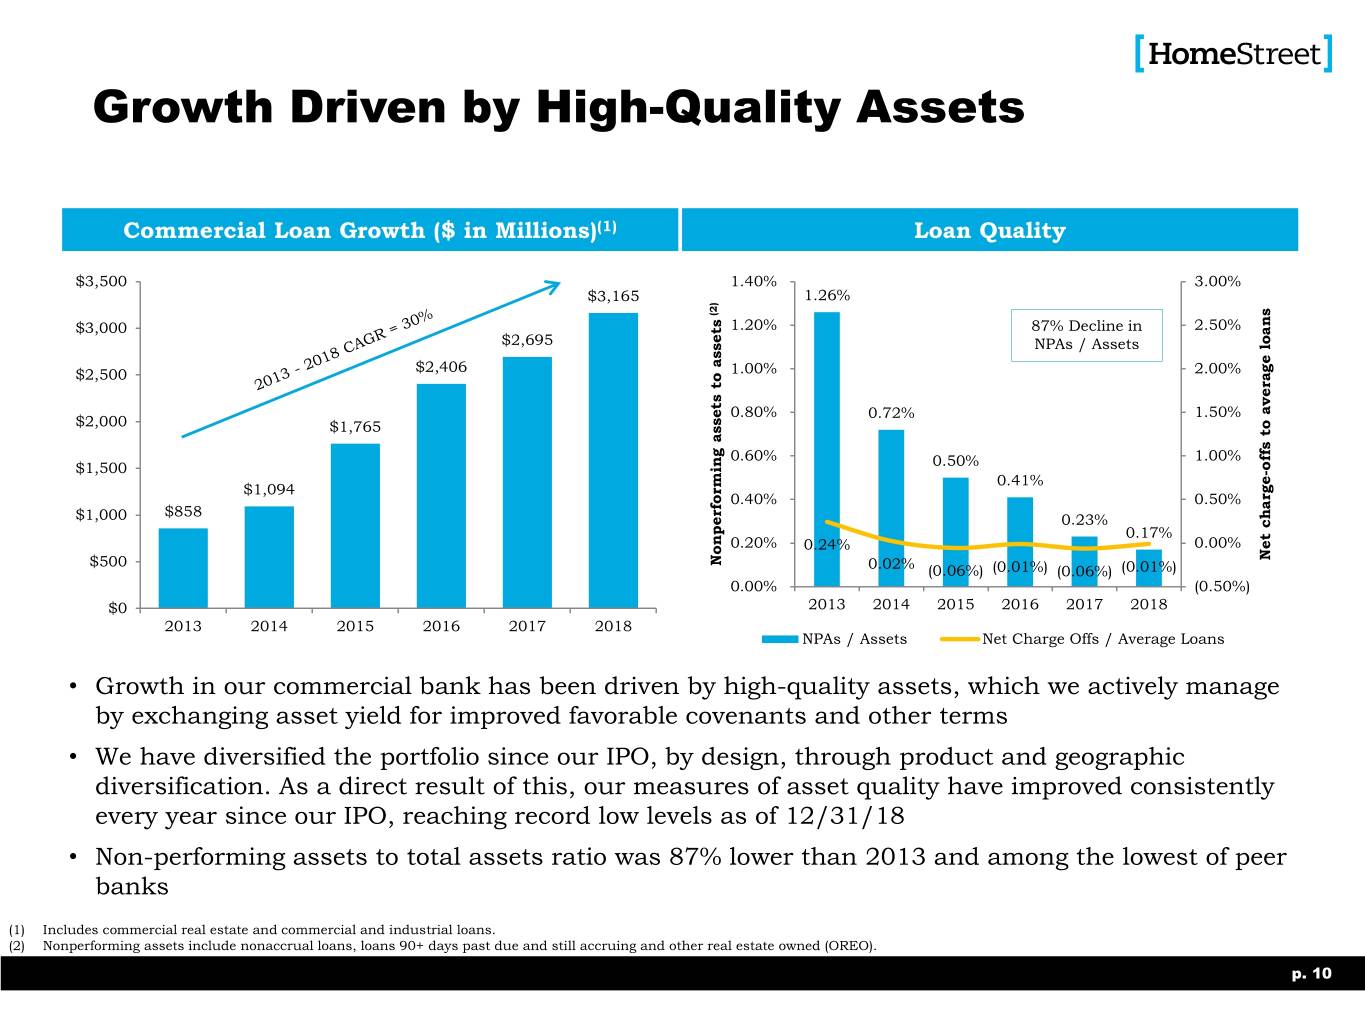
Growth Driven by High-Quality Assets Commercial Loan Growth ($ in Millions)(1) Loan Quality $3,500 1.40% 3.00% $3,165 1.26% (2) $3,000 1.20% 87% Decline in 2.50% $2,695 NPAs / Assets $2,406 $2,500 1.00% 2.00% 0.80% 0.72% 1.50% $2,000 $1,765 0.60% 0.50% 1.00% offs average to loans $1,500 - 0.41% $1,094 0.40% 0.50% $858 $1,000 0.23% 0.17% 0.20% 0.24% 0.00% Net Net charge $500 Nonperforming assets assets to 0.02% (0.06%) (0.01%) (0.06%) (0.01%) 0.00% (0.50%) $0 2013 2014 2015 2016 2017 2018 2013 2014 2015 2016 2017 2018 NPAs / Assets Net Charge Offs / Average Loans • Growth in our commercial bank has been driven by high-quality assets, which we actively manage by exchanging asset yield for improved favorable covenants and other terms • We have diversified the portfolio since our IPO, by design, through product and geographic diversification. As a direct result of this, our measures of asset quality have improved consistently every year since our IPO, reaching record low levels as of 12/31/18 • Non-performing assets to total assets ratio was 87% lower than 2013 and among the lowest of peer banks (1) Includes commercial real estate and commercial and industrial loans. (2) Nonperforming assets include nonaccrual loans, loans 90+ days past due and still accruing and other real estate owned (OREO). p. 10

Decision Process: Eliminating the Mortgage Banking Business Segment The Company grew the mortgage banking business significantly coming out of the recession to HomeStreet was founded as provide capital to address problem Continental Mortgage and Loan assets and in 2012, the year of the Company and is Fannie Mae’s 1921 Company’s IPO, the Company oldest customer returned 39% on equity and was the second best performing IPO in the US, all due to profit of the mortgage banking business. After 2010- the recession, mortgage banking profit provided non-dilutive capital 2012 to grow and expand our Commercial and Consumer banking business In 2016 HomeStreet’s return on capital invested in this business substantially exceeded our cost of 2017 capital. However, industry In 2018 industry conditions conditions deteriorated and 2017 worsened and HomeStreet was a near breakeven year for the experienced even lower loan segment. Later that same year the volume, continued low housing regulators proposed rules to ease inventory and falling profit the capital burden on MSRs 2018 margins as competitors sought to capture remaining loan volume. Additionally, a flattening yield curve reduced hedging results for mortgage servicing rights and regulatory capital relief for Given the 2018 results, and the mortgage servicing rights did not absence of a near term catalyst for 2019 materialize as expected change, our Board of Directors made the difficult decision to explore the potential sale of much of our Mortgage Banking Business, ultimately concluding that this change would be in the best long- term interests of the Company and its shareholders p. 11

Total Shareholder Return HomeStreet has Outperformed Since Last Year’s Annual Meeting 1-Year Total Shareholder Returns – Since Last Year’s AGM (May 24, 2018) 20% 15% 10% 0% (10%) (8%) (16%) (20%) (30%) (40%) May 2018 Aug 2018 Nov 2018 Feb 2019 May 2019 TSR at a Glance Since IPO* 5-Year to June 14 3-Year to June 14 1-Year to June 14 Since 2018 AGM* 2019 YTD* HomeStreet 194% 73% 57% 10% 15% 49% KBW Regional Banking Index (KRX) 114% 44% 32% (16%) (16%) 11% SNL U.S. Bank and Thrift Index (SNL) 152% 54% 53% (7%) (8%) 13% Above / (Below) KRX ** +80 PPT +28 PPT +25 PPT +26 PPT +30 PPT +38 PPT *As of June 14, 2019 **Numbers may not add due to rounding Sources: Bloomberg Finance LP and S&P Global. Total return includes stock price appreciation and dividends. Year-to-date returns through June 14, 2019. KBW Regional Bank Index is comprised of 50 publicly traded, regionally diversified midcap banking institutions, and is calculated using equal float-adjusted market-capitalization weighted methodology. SNL U.S. Bank and Thrift includes all major exchange-listed (NYSE, NYSE MKT and NASDAQ) banks and thrifts in SNL Financial’s coverage universe. p. 12

Tangible Book Value Per Share (TBVPS) • HomeStreet’s Tangible Book Value Per Share increased by an average of 10.1% per year, above average of both Blue Lion-selected peer groups and higher than most of our peers • 2018 Tangible Book Value Per Share of $26.36 represents a 55% increase compared to 2013 TBVPS Compound Annual Growth Rate (CAGR) Q1 2012 – Q1 2019 TBVPS Expansion Over Time Pacific Northwest Peers California Peers Average: 3.2% Average: 6.5% 11.0% $26.36 10.1% $25.09 $22.33 $19.39 $20.16 6.6% $17.00 4.8% 4.7% 4.4% 3.9% 1.8% 1.6% HMST BANR GBCI HFWA COLB PPBI TCBK WABC CBVF 2013 2014 2015 2016 2017 2018 Source: S&P Global. Pacific Northwest Peers include BANR, COLB, GBCI, and HFWA. California Peers include CVBF, PPBI, TCBK, and WABC. p. 13
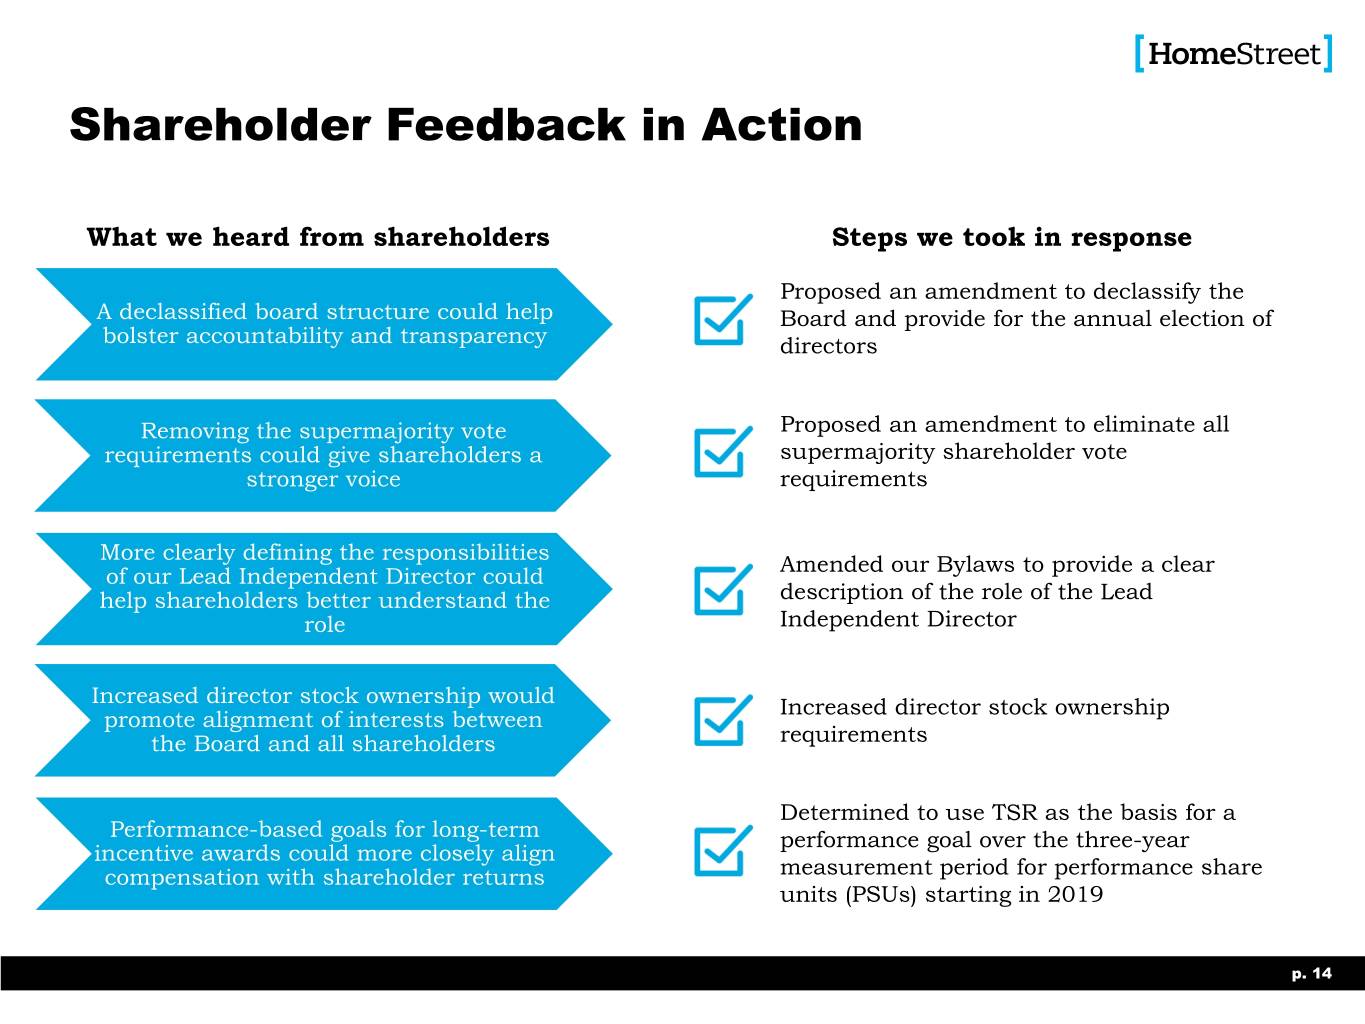
Shareholder Feedback in Action What we heard from shareholders Steps we took in response Proposed an amendment to declassify the A declassified board structure could help Board and provide for the annual election of bolster accountability and transparency directors Removing the supermajority vote Proposed an amendment to eliminate all requirements could give shareholders a supermajority shareholder vote stronger voice requirements More clearly defining the responsibilities Amended our Bylaws to provide a clear of our Lead Independent Director could help shareholders better understand the description of the role of the Lead role Independent Director Increased director stock ownership would Increased director stock ownership promote alignment of interests between the Board and all shareholders requirements Determined to use TSR as the basis for a Performance-based goals for long-term performance goal over the three-year incentive awards could more closely align compensation with shareholder returns measurement period for performance share units (PSUs) starting in 2019 p. 14

Financial Highlights p. 15

Operating Highlights 2018 Highlights • Achieved record net income in our former Commercial and Consumer Banking Segment of $56.8 million • Grew loans held for investment by $564.1 million, or 12%, to $5.1 billion • Increased deposits $290.5 million, or 6%, to $5.1 billion • Implemented costs savings initiatives that reduced expenses by: – $14.0 million in bases salaries – $11.3 million in general and administrative expenses – $2.6 million in occupancy expenses • Reduced head count 16% from 2,419 FTE to 2,036 FTE during 2018 • Maintained strong asset quality, ending the year at 0.17% non-performing assets to total assets 2019 and Beyond • Completed the sale and transfer of 47 stand-alone home loan centers and fulfillment offices, and 452 related origination and support staff • Identified approximately 100 additional corporate overhead positions for elimination as part of the home loan center sale • Engaged a well known banking consultant to identify opportunities for additional cost reductions and process improvements to further improve our overall efficiency • Sold $14.3 billion in UPB of single family mortgage servicing rights • Began a $75 million common stock repurchase program • Completed the acquisition of a retail deposit branch in San Marcos, CA along with a commercial lending team • Opened two de novo branches in Northern California, San Jose and Santa Clara p.p. 1618

Results of Operations – 2018 Year End 12 Months Ended $ Thousands Dec. 31, 2018 Dec. 31, 2017 Net Interest Income $202,479 $194,438 Provision for Credit Losses 3,000 750 Noninterest Income 236,959 312,154 Noninterest Expense 390,573 439,653 Net Income Before Taxes 45,865 66,189 Income Taxes 5,838 (2,757) Net Income 40,027 68,946 Core Net Income(1) $40,118 $48,429 Diluted EPS $1.47 $2.54 Core EPS(1) $1.48 $1.79 Tangible BV/Share(2) $26.36 $25.09 Core ROAA(1) 0.57% 0.73% Core ROAE(1) 5.41% 7.17% Core ROATE(1) 5.63% 7.50% Net Interest Margin 3.23% 3.31% Core Efficiency Ratio(2) 87.5% 85.9% Tier 1 Leverage Ratio (Bank) 10.15% 9.67% Total Risk-Based Capital (Bank) 14.69% 14.02% Tier 1 Leverage Ratio (Company) 9.51% 9.12% Total Risk-Based Capital (Company) 13.20% 11.61% (1) Excludes impact of income tax reform-related benefit and restructuring and acquisition-related expenses, net of tax. See appendix for reconciliation of non-GAAP financial measures. (2) See appendix for reconciliation of non-GAAP financial measures. p. 17
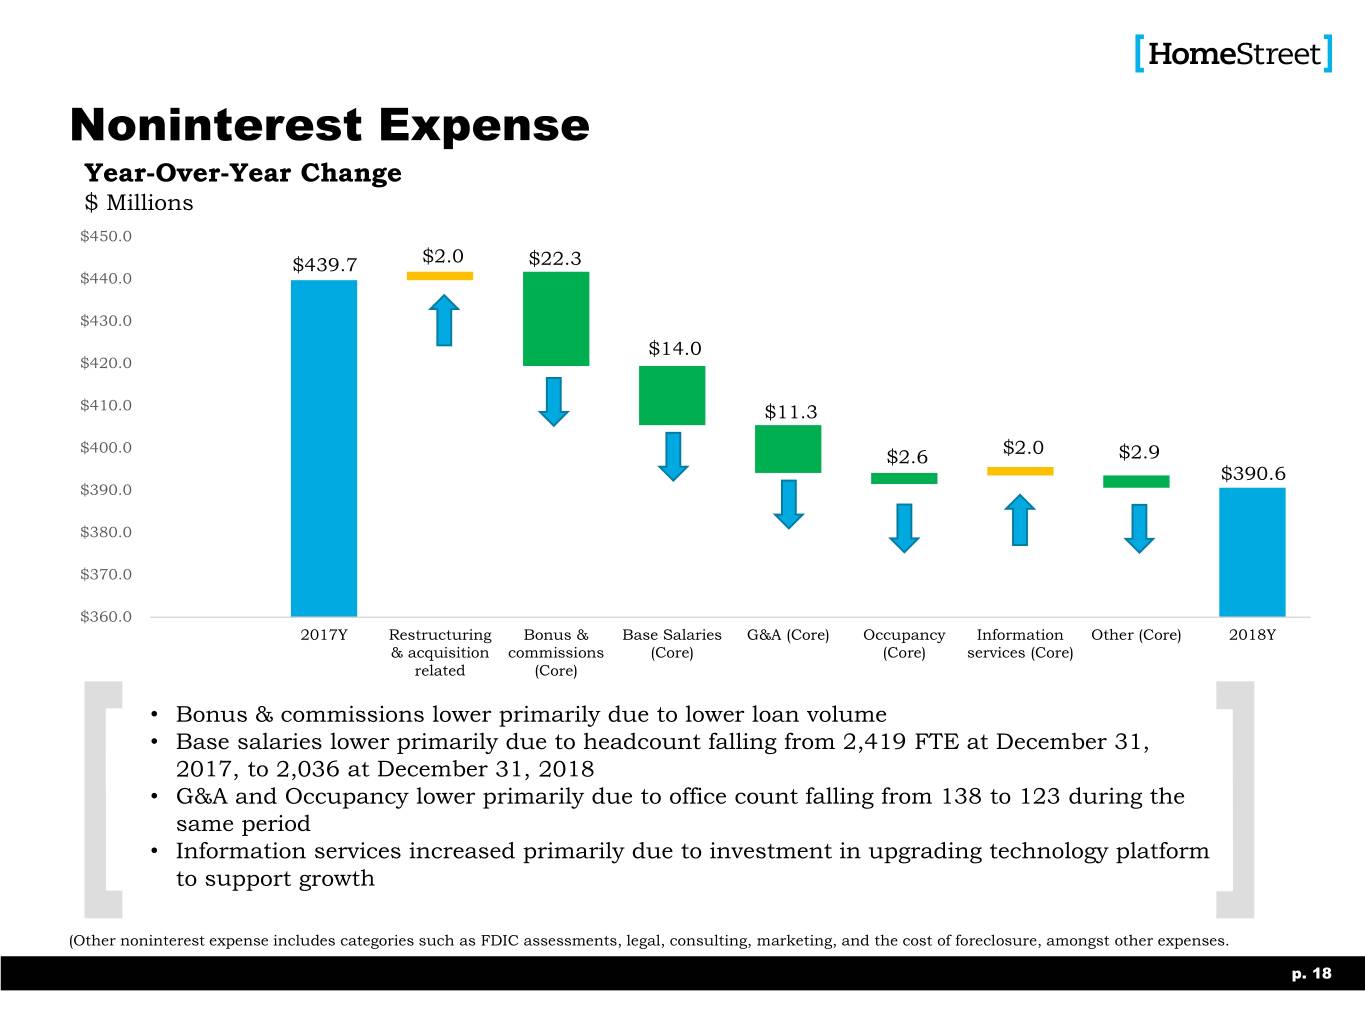
Noninterest Expense Year-Over-Year Change $ Millions $450.0 $439.7 $2.0 $22.3 $440.0 $430.0 $14.0 $420.0 $410.0 $11.3 $400.0 $2.6 $2.0 $2.9 $390.6 $390.0 $380.0 $370.0 $360.0 2017Y Restructuring Bonus & Base Salaries G&A (Core) Occupancy Information Other (Core) 2018Y & acquisition commissions (Core) (Core) services (Core) related (Core) • Bonus & commissions lower primarily due to lower loan volume • Base salaries lower primarily due to headcount falling from 2,419 FTE at December 31, 2017, to 2,036 at December 31, 2018 • G&A and Occupancy lower primarily due to office count falling from 138 to 123 during the same period • Information services increased primarily due to investment in upgrading technology platform to support growth (Other noninterest expense includes categories such as FDIC assessments, legal, consulting, marketing, and the cost of foreclosure, amongst other expenses. p. 18

Questions? p. 19
Thank you for Attending HomeStreet, Inc. Nasdaq: HMST http://ir.homestreet.com (Electronic copies of this presentation available upon request) p. 20
Appendix p. 21

Segment Core Earnings Contribution Average 12 Months Ended Earnings and Returns Dec. 31, Dec. 31, Dec. 31, Dec. 31, Dec. 31, Dec. 31, Dec. 31, 1/1/2012- $ in Thousands 2012 2013 2014 2015 2016 2017 2018 12/31/2018 Commercial & Consumer Banking Core Net Income (Loss)(1) (12,703) 8,930 16,734 21,035 35,438 46,612 52,923 24,139 Core ROATE(1) (7.74%) 4.65% 8.21% 7.07% 8.14% 9.19% 9.86% 7.23% Core ROAA(1) (0.67%) 0.42% 0.65% 0.59% 0.74% 0.82% 0.84% 0.63% Core Efficiency Ratio(1) 107.6% 82.9% 76.3% 74.9% 69.2% 68.4% 67.9% 73.5% Mortgage Banking Core Net Income (Loss)(1) 94,829 17,836 7,510 23,302 27,351 1,817 (12,806) 22,834 Core ROATE(1) 200.77% 32.79% 10.54% 18.68% 26.78% 1.31% (8.09%) 22.95% Core ROAA(1) 18.83% 2.97% 1.19% 2.35% 2.79% 0.20% (1.78%) 2.99% Core Efficiency Ratio(1) 50.1% 85.6% 93.8% 87.1% 87.5% 99.1% 108.3% 87.2% HomeStreet Consolidated Core Net Income (Loss)(1) 82,126 26,766 24,245 44,337 62,789 48,429 40,118 46,973 Core ROATE(1) 38.86% 10.87% 8.81% 10.50% 11.68% 7.50% 5.63% 10.78% Core ROAA(1) 3.42% 0.98% 0.76% 0.97% 1.09% 0.73% 0.57% 1.02% Core Efficiency Ratio(1) 61.5% 84.8% 87.6% 83.0% 81.1% 85.9% 87.5% 82.2% (1) Core measures are non-GAAP financial measures. They exclude impact of income tax reform-related (benefit ) expense and restructuring and acquisition-related expenses, net of tax. p. 22

Non-GAAP Financial Measures Core Net Income 12 Months Ended $ Thousands, except per share data Dec. 31, Dec. 31, 2018 2017 Net Income 40,027 68,946 Impact of Income Tax Reform-related Benefit (4,884) (23,326) Impact of Restructuring-related Items (Net of Tax) 4,953 2,418 Impact of Acquisition-related Items (Net of Tax) 22 391 Net Income, Excluding Income Tax Reform-related Benefit, Restructuring (Net of Tax) and Acquisition- 40,118 48,429 related Items (Net of Tax) Noninterest Expense 390,573 439,653 Impact of Restructuring-related Expenses (6,269) (3,720) Impact of Acquisition-related Expenses (27) (602) Noninterest Expense, Excluding Restructuring and 384,277 435,331 Acquisition-related Expenses Diluted Earnings Per Common Share 1.47 2.54 Impact of Income Tax Reform-related Benefit (0.18) (0.86) Impact of Restructuring-related Items (Net of Tax) 0.19 0.09 Impact Of Acquisition-related Items (Net of Tax) - 0.02 Diluted Earnings Per Common Share, Excluding Income Tax Reform-related Benefit, Restructuring 1.48 1.79 (Net of Tax) and Acquisition-related Items (Net of Tax) Return On Average Assets 0.57% 1.05% Impact of Income Tax Reform-related Benefit (0.07)% (0.35)% Impact of Restructuring-related Items (Net Of Tax) 0.07% 0.04% Impact of Acquisition-related Items (Net of Tax) 0.00% (0.01)% Return On Average Assets, Excluding Income Tax Reform-related Benefit, Restructuring (Net of Tax) 0.57% 0.73% and Acquisition-related Items (Net of Tax) p. 23

Non-GAAP Financial Measures Core Net Income (cont.) 12 Months Ended $ Thousands Dec. 31, Dec. 31, 2018 2017 Return On Average Shareholders' Equity 5.40% 10.20% Impact of Goodwill and Other Intangibles 0.22% 0.48% Return On Average Tangible Shareholders’ 5.62% 10.68% Equity Return On Average Shareholders' Equity 5.40% 10.20% Impact of Income Tax Reform-related (0.66)% (3.45)% Benefit Impact of Restructuring-related Items (Net 0.67% 0.36% of Tax) Impact of Acquisition-related Items (Net of 0.00% 0.06% Tax) Return On Average Shareholders' Equity, Excluding Income Tax Reform-related 5.41% 7.17% Benefit, Restructuring (Net of Tax) And Acquisition-related Items (Net of Tax) Efficiency Ratio 88.88% 86.79% Impact of Restructuring-related Items (1.43)% (0.73)% Impact of Acquisition-related Items 0.00% (0.13)% Efficiency Ratio, Excluding Restructuring 87.45% 85.93% and Acquisition-related Items p. 24
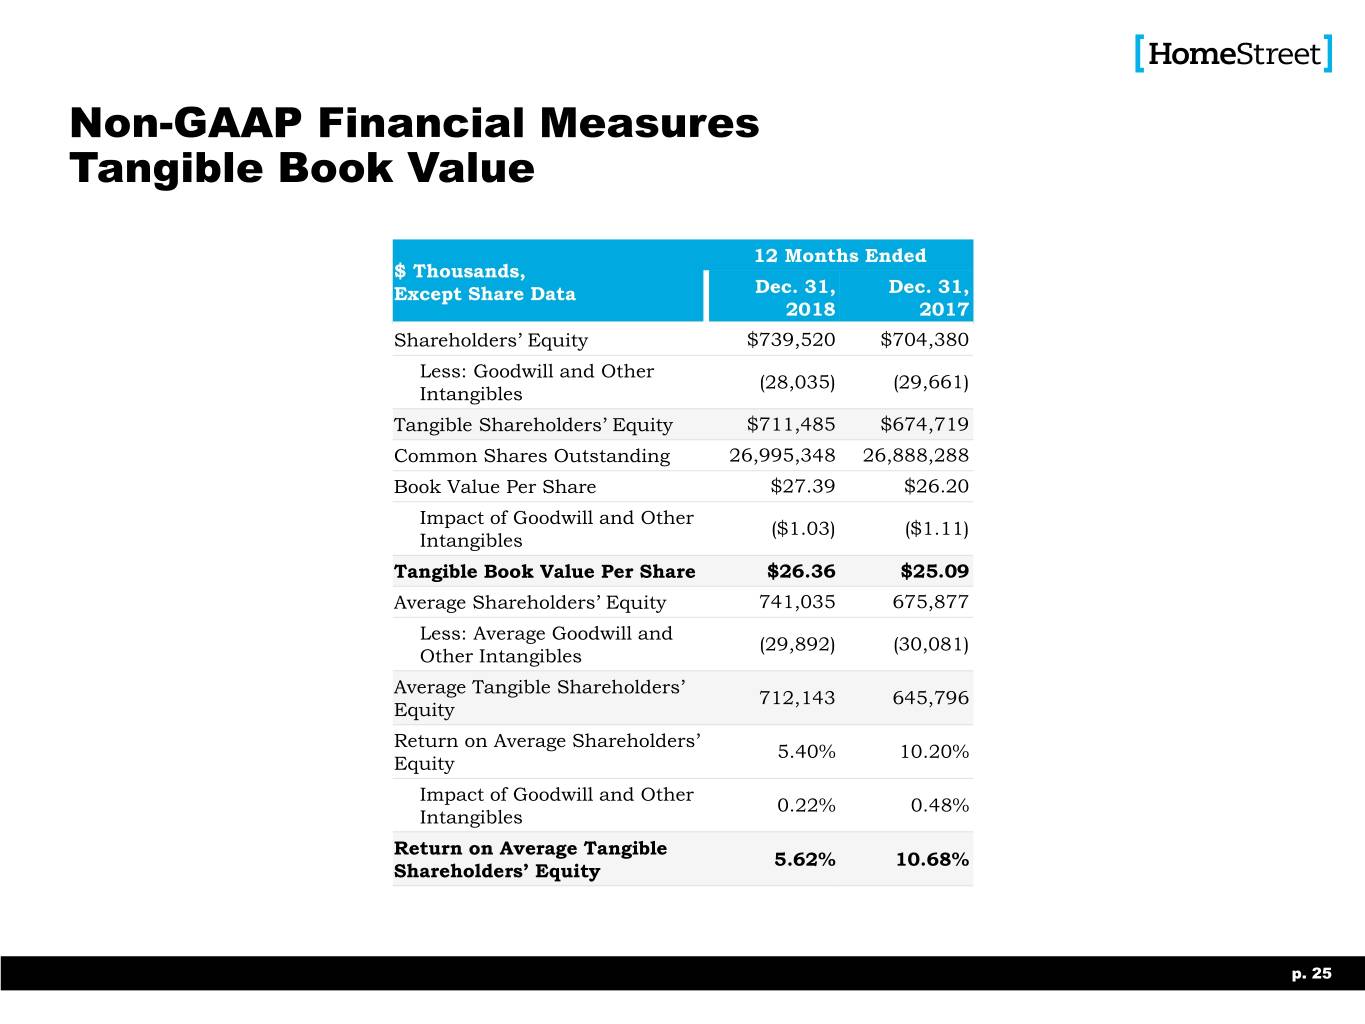
Non-GAAP Financial Measures Tangible Book Value 12 Months Ended $ Thousands, Except Share Data Dec. 31, Dec. 31, 2018 2017 Shareholders’ Equity $739,520 $704,380 Less: Goodwill and Other (28,035) (29,661) Intangibles Tangible Shareholders’ Equity $711,485 $674,719 Common Shares Outstanding 26,995,348 26,888,288 Book Value Per Share $27.39 $26.20 Impact of Goodwill and Other ($1.03) ($1.11) Intangibles Tangible Book Value Per Share $26.36 $25.09 Average Shareholders’ Equity 741,035 675,877 Less: Average Goodwill and (29,892) (30,081) Other Intangibles Average Tangible Shareholders’ 712,143 645,796 Equity Return on Average Shareholders’ 5.40% 10.20% Equity Impact of Goodwill and Other 0.22% 0.48% Intangibles Return on Average Tangible 5.62% 10.68% Shareholders’ Equity p. 25

Non-GAAP Financial Measures Segment Core Earnings Contribution For the twelve months ended For the twelve months ended Dec. 31, Dec. 31, Dec. 31, Dec. 31, Dec. 31, Dec. 31, Dec. 31, Dec. 31, Dec. 31, Dec. 31, Dec. 31, Dec. 31, Dec. 31, Dec. 31, (dollars in thousands, except share data) 2012 2013 2014 2015 2016 2017 2018 2012 2013 2014 2015 2016 2017 2018 Commercial and Consumer Banking Segment: Net income (loss) (12,703) 5,973 14,748 18,017 30,800 42,061 56,765 82,126 23,809 22,259 41,319 58,151 68,946 40,027 Impact of income tax reform-related expense - - - - - 4,160 (3,881) - - - - - (23,326) (4,884) Impact of acquisition-related items (net of tax) - 2,957 1,986 3,018 4,638 391 22 - - - - - 2,418 4,953 Impact of restructuring-related items (net of tax) - - - - - - 17 - 2,957 1,986 3,018 4,638 391 22 Core Net income (loss), excluding income tax reform-related (12,703) 8,930 16,734 21,035 35,438 46,612 52,923 82,126 26,766 24,245 44,337 62,789 48,429 40,118 expense and acquisition-related items (net of tax) ROATE (7.74)% 3.11% 6.86% 6.09% 7.08% 8.27% 10.57% 38.86% 9.67% 8.09% 9.78% 10.82% 10.68% 5.62% Impact of income tax reform-related expense 0.00% 0.00% 0.00% 0.00% 0.00% 0.82% (0.72)% 0.00% 0.00% 0.00% 0.00% 0.00% (3.61)% (0.69)% Impact of acquisition-related items (net of tax) 0.00% 1.54% 1.35% 0.98% 1.06% 0.10% 0.01% 0.00% 1.20% 0.72% 0.72% 0.86% 0.37% 0.70% Impact of restructuring-related items (net of tax) 0.00% 0.00% 0.00% 0.00% 0.00% 0.00% 0.00% 0.00% 0.00% 0.00% 0.00% 0.00% 0.06% 0.00% Core ROATE, excluding income tax reform-related expense and (7.74)% 4.65% 8.21% 7.07% 8.14% 9.19% 9.86% 38.86% 10.87% 8.81% 10.50% 11.68% 7.50% 5.63% acquisition-related items (net of tax) ROAA (0.67)% 0.27% 0.57% 0.51% 0.64% 0.74% 0.90% 3.42% 0.88% 0.69% 0.91% 1.01% 1.05% 0.57% Impact of income tax reform-related expense 0.00% 0.00% 0.00% 0.00% 0.00% 0.07% (0.06)% 0.00% 0.00% 0.00% 0.00% 0.00% (0.35)% (0.07)% Impact of acquisition-related items (net of tax) 0.00% 0.15% 0.08% 0.08% 0.10% 0.01% 0.00% 0.00% 0.00% 0.00% 0.00% 0.00% 0.04% 0.07% Impact of restructuring-related items (net of tax) 0.00% 0.00% 0.00% 0.00% 0.00% 0.00% 0.00% 0.00% 0.10% 0.07% 0.06% 0.08% (0.01)% 0.00% Core ROAA, excluding income tax reform-related expense and (0.67)% 0.42% 0.65% 0.59% 0.74% 0.82% 0.84% 3.42% 0.98% 0.76% 0.97% 1.09% 0.73% 0.57% acquisition-related items (net of tax) Efficiency ratio 107.65% 89.06% 79.29% 82.07% 72.95% 68.68% 67.89% 61.45% 86.54% 88.63% 85.33% 82.40% 86.79% 88.88% Impact of acquisition-related items 0.00% (6.12)% (3.03)% (7.22)% (3.76)% (0.27)% (0.01)% 0.00% 0.00% 0.00% 0.00% 0.00% (0.73)% (1.43)% Impact of restructuring-related items 0.00% 0.00% 0.00% 0.00% 0.00% 0.00% (0.01)% 0.00% (1.72)% (1.07)% (2.36)% (1.32)% (0.13)% (0.00)% Core Efficiency ratio, excluding income tax reform-related expense 107.65% 82.94% 76.26% 74.85% 69.19% 68.41% 67.87% 61.45% 84.82% 87.56% 82.97% 81.08% 85.93% 87.45% and acquisition-related items Mortgage Banking Segment: Net income (loss) 94,829 17,836 7,511 23,302 27,351 26,885 (16,738) Impact of income tax reform-related expense - - - - - (27,486) (1,003) Impact of restructuring-related items (net of tax) - - - - - 2,418 4,935 Core Net income (loss), excluding income tax reform-related 94,829 17,836 7,511 23,302 27,351 1,817 (12,806) expense and acquisition-related items (net of tax) ROATE 200.77% 32.79% 10.54% 18.68% 26.78% 19.45% (10.57)% Impact of income tax reform-related expense 0.00% 0.00% 0.00% 0.00% 0.00% (19.89)% (0.63)% Impact of restructuring-related items (net of tax) 0.00% 0.00% 0.00% 0.00% 0.00% 1.75% 3.11% Core ROATE, excluding income tax reform-related expense and 200.77% 32.79% 10.54% 18.68% 26.78% 1.31% (8.09)% acquisition-related items (net of tax) ROAA 18.83% 2.97% 1.19% 2.35% 2.79% 2.91% (2.33)% Impact of income tax reform-related expense 0.00% 0.00% 0.00% 0.00% 0.00% (2.97)% (0.14)% Impact of restructuring-related items (net of tax) 0.00% 0.00% 0.00% 0.00% 0.00% 0.26% 0.69% Core ROAA, excluding income tax reform-related expense and 18.83% 2.97% 1.19% 2.35% 2.79% 0.20% (1.78)% acquisition-related items (net of tax) Efficiency ratio 50.06% 85.56% 93.75% 87.07% 87.54% 100.34% 111.21% Impact of restructuring-related items 0.00% 0.00% 0.00% 0.00% 0.00% (1.28)% (2.94)% Core Efficiency ratio, excluding income tax reform-related expense 50.06% 85.56% 93.75% 87.07% 87.54% 99.06% 108.27% and acquisition-related items p. 26


