As filed with the Securities and Exchange Commission on July 28, 2011
Registration No. 333-—
SECURITIES AND EXCHANGE COMMISSION
Washington, D.C. 20549
FORM F-1
REGISTRATION STATEMENT
UNDER
THE SECURITIES ACT OF 1933
TIM W.E. SGPS, S.A.
(Exact name of Registrant as specified in its charter)
Not Applicable
(Translation of Registrant’s name into English)
| | | | |
| Republic of Portugal | | 7372 | | Not Applicable |
(State or other jurisdiction of incorporation or organization) | | (Primary Standard Industrial Classification Code Number) | | (I.R.S. Employer Identification Number) |
Avenida Infante Santo
2H, 3º 1350-178
Lisbon, Portugal
+351-212-487-800
(Address, Including Zip Code, and Telephone Number, Including Area Code, of Registrant’s Principal Executive Offices)
CT Corporation System
111 Eighth Avenue, 13th Floor
New York, NY 10011
(212) 590-9200
(Name, Address, Including Zip Code, and Telephone Number, Including Area Code, of Agent For Service)
| | |
| Copies to: |
Michael J. Willisch, Esq. Davis Polk & Wardwell LLP Paseo de la Castellana 41 Madrid, Spain 28046 Phone: (34) 91 768-9610 Fax: (34) 91-768-9710 | | Sebastian R. Sperber, Esq. Cleary Gottlieb Steen & Hamilton LLP City Place House, 55 Basinghall Street London EC2V 5EH Phone: (44) 20 7614-2200 Fax: (44) 20 7600-1698 |
Approximate date of commencement of proposed sale to the public: As soon as practicable after the effective date of this registration statement.
If any of the securities being registered on this form are to be offered on a delayed or continuous basis pursuant to Rule 415 under the Securities Act of 1933, check the following box. ¨
If this form is filed to register additional securities for an offering pursuant to Rule 462(b) under the Securities Act, check the following box and list the Securities Act registration statement number of the earlier effective registration statement for the same offering. ¨
If this form is a post-effective amendment filed pursuant to Rule 462(c) under the Securities Act, check the following box and list the Securities Act registration statement number of the earlier effective registration statement for the same offering. ¨
If this form is a post-effective amendment filed pursuant to Rule 462(d) under the Securities Act, check the following box and list the Securities Act registration statement number of the earlier effective registration statement for the same offering. ¨
CALCULATION OF REGISTRATION FEE
| | | | | | | | |
| Title of each class of securities to be registered | | Amount to be
registered(1) | | Proposed maximum
aggregate offering
price per share | | Proposed maximum
aggregate offering
price(2) | | Amount of
registration fee |
Common shares, par value €0.03 per common share | | 12,937,500 | | $14.00 | | $181,125,000 | | $21,028.61 |
| (1) | Includes common shares that the underwriters may purchase solely to cover over allotments, if any. |
| (2) | Estimated solely for the purpose of determining the amount of registration fee in accordance with Rule 457(a) under the Securities Act of 1933, as amended. |
The Registrant hereby amends this registration statement on such date or dates as may be necessary to delay its effective date until the Registrant shall file a further amendment which specifically states that this registration statement shall thereafter become effective in accordance with Section 8(a) of the Securities Act of 1933, as amended, or until the registration statement shall become effective on such date as the Commission, acting pursuant to such Section 8(a), may determine.
The information in this prospectus is not complete and may be changed. We may not sell these securities until the registration statement filed with the Securities and Exchange Commission is effective. This prospectus is not an offer to sell these securities and is not soliciting an offer to buy these securities in any state where the offer or sale is not permitted.
SUBJECT TO COMPLETION, DATED JULY 28, 2011
PROSPECTUS
11,250,000 Common Shares

TIM W.E. SGPS, S.A.
(incorporated in the Republic of Portugal)
We are offering 7,500,000 of our common shares, and the selling shareholders are offering an additional 3,750,000 common shares. We expect that the initial public offering price will be between $12.00 and $14.00 per common share.
Prior to the offering, there has been no public market for our common shares. We have applied to list the common shares on The NASDAQ Stock Market under the symbol “TMWE”.
Neither the Securities and Exchange Commission nor any state securities commission has approved or disapproved of these securities or passed on the adequacy or accuracy of this prospectus. Any representation to the contrary is a criminal offense.
| | | | | | | | |
| | | Per common
share | | | Total | |
Initial public offering price | | $ | | | | $ | | |
Underwriting discount | | $ | | | | $ | | |
Proceeds to us (before expenses) | | $ | | | | $ | | |
Proceeds to the selling shareholders (before expenses) | | $ | | | | $ | | |
We and the selling shareholders have granted to the underwriters a 30-day option to purchase on a pro rata basis up to 843,750 additional shares from us and an aggregate of 843,750 additional outstanding shares from the selling shareholders at the initial public offering price less the underwriting discounts and commissions. The option may be exercised only to cover any overallotments of common shares. If the underwriters exercise the option in full, the total underwriting discounts and commissions payable by us will be $ and the total underwriting discounts and commissions payable by the selling shareholders will be $ , and the total proceeds to us, before expenses, will be $ million, and the total proceeds to the selling shareholders, before expenses, will be $ million.
Immediately following the offering, the selling shareholders will continue to own, in the aggregate, 80.4% of our common shares. The selling shareholders are members of our management and will continue to exercise significant influence over us. See “Principal and Selling Shareholders” on page 114 of this prospectus.
Investing in the common shares involves a high degree of risk. See“Risk Factors” beginning on page 13 of this prospectus for certain factors you should consider before investing in the common shares.
Delivery of the common shares will be made against payment in New York, New York on or about , 2011.
| | | | |
| | |
| Needham & Company, LLC | | Pacific Crest Securities | | Piper Jaffray |
| | |
| |
| Santander | | ThinkEquity LLC |
, 2011

TABLE OF CONTENTS
We and the selling shareholders have not, and the underwriters have not, authorized anyone to provide any information other than that contained in this prospectus or in any free writing prospectus prepared by or on behalf of us or to which we may refer you. We take no responsibility for, and can provide no assurance as to the reliability of, any other information that others may give you. We, the selling shareholders and the underwriters have not authorized any other person to provide you with different or additional information. If anyone provides you with different or additional information, you should not rely on it. Neither we nor the underwriters are making an offer to sell the common shares in any jurisdiction where their offer or sale is not permitted. You should assume that the information appearing in this prospectus is accurate only as of the date on the front cover of this prospectus, regardless of the time of delivery of this prospectus or any sale of the common shares. Our business, financial condition, results of operations and prospects may have changed since the date on the front cover of this prospectus.
No offer or sale of the common shares may be made to the public in Portugal except in circumstances that do not constitute a public offer or distribution under Portuguese laws and regulations. Persons outside the United States who come into possession of this prospectus must inform themselves about and observe any restrictions relating to the offering of the securities and the distribution of the prospectus outside the United States.
Until 25 days after the date of this prospectus, all dealers that buy, sell, or trade the common shares, whether or not participating in this offering, may be required to deliver a prospectus. This is in addition to the dealers’ obligation to deliver a prospectus when acting as underwriters and with respect to their unsold allotments or subscriptions.
i
SUMMARY
This summary highlights selected information about us and the common shares that we and the selling shareholders are offering. It may not contain all of the information that may be important to you. Before investing in our common shares, you should read this entire prospectus carefully for a more complete understanding of our business and this offering, including our audited consolidated financial statements and the related notes, and the sections entitled “Risk Factors” and “Management’s Discussion and Analysis of Financial Condition and Results of Operations” included in this prospectus.
Overview
We are a global provider of mobile monetization solutions to mobile carriers, media groups, governments, nongovernmental organizations (“NGOs”), brand owners and content owners. We provide mobile marketing, mobile entertainment and mobile money services through our proprietary platform, which incorporates software-as-a-service technologies. We have connections to more than 280 mobile carriers, giving our clients access to a network of nearly three billion end users worldwide. We leverage this broad reach, along with our in-depth knowledge of local markets to facilitate the monetization and distribution of content and services that are tailored to local preferences. Our services allow end users to consume mobile entertainment, such as music and video, receive marketing and advertising messages and make mobile payments on-the-go and free from the constraints of traditional content, marketing and payment channels. We believe, based on feedback our regional managers receive from local mobile carriers, that we are the leading provider of these services in our core markets, including Brazil, Argentina, Colombia and Mexico. We have a proven track record of execution, growth and diversification, evidenced by both the double-digit organic revenue growth and the profitability we have achieved in each year since 2006.
Our primary focus is delivering our services in high-growth, emerging markets. We have grown 100% organically to become, based on feedback our regional managers receive from local mobile carriers, what we believe to be one of the largest providers of mobile solutions in Latin America and a global participant with 25 local offices and offerings in more than 75 different countries. Our core market is Latin America, where we generated 79% of our 2010 revenues and have local offices in 11 countries. Brazil is our largest market, accounting for 44% of our 2010 revenues. We also have offices and are rapidly expanding in a number of countries in Africa, the Asia Pacific region, Europe and the Middle East.
Our platform is used by clients and end users in connection with three principal activities: mobile marketing, mobile entertainment and mobile money. For the year ended December 31, 2010, we derived €101.3 million, €116.2 million and €16.3 million in revenues from mobile marketing, mobile entertainment and mobile money activities, respectively. In mobile marketing, mobile carriers, media groups, governments, NGOs and brand owners use our platform to leverage the convenience, prevalence and targeting capabilities of mobile telephones for marketing and communications purposes. Next, in mobile entertainment, our connections with mobile carriers and our highly scalable, easily adaptable technology platform give end users access to a broad array of third-party and proprietary mobile entertainment services and allow content owners to connect to a large end user base, which included nearly 20 million mobile entertainment subscribers as of December 31, 2010. Finally, mobile money clients and end users use our platform to leverage our connections with mobile carriers to facilitate easy, mobile-based billing solutions and micropayments for goods and services sold online.
Our business model puts us at the center of the mobile ecosystem, as we facilitate communications and transactions between mobile carriers, media groups, governments, NGOs, brand owners, online merchants, content owners and mobile end users. We believe that our central role allows us to leverage our scale and knowledge to deliver value to these stakeholders. Furthermore, we believe it positions us to benefit from the growth and evolution of this ecosystem as a whole.
1
Our Strengths
High-growth, emerging markets focus
We provide mobile monetization solutions in emerging markets and have a strong presence in Latin America, including large countries such as Brazil, Argentina, Mexico and Colombia. Our expansion into Latin America began in 2005 when we opened offices in Colombia and Argentina, and since then we have expanded within Latin America, where we currently operate in 18 countries through 11 local offices. In 2010, 79% of our revenues were generated in Latin America, with Brazil, our largest market, accounting for 44% of our 2010 revenues. Our extensive footprint and experience in Latin America has made us a partner of choice for mobile carriers in the region, and our deeply embedded local relationships, including those with leading carriers such as Vivo, Movistar and Claro, give us access to a user base of more than 529 million end users throughout Latin America. More recently, we have leveraged our existing assets to expand into other emerging markets, such as those in Africa, the Middle East, the Asia Pacific region and Eastern Europe.
The emerging markets that we target have generally experienced faster economic growth in recent years than those of developed countries. For example, the Economist Intelligence Unit (2011) reported that GDP per capita in Latin America grew at a compound average rate of 5.7% during 2010, compared with just 2% in Western Europe during the same period. Such growth is expected to facilitate the growth of a middle class with more disposable income, contributing to a greater overall demand for mobile services. For example, the number of cellular connections in Central and Latin America is expected to grow by 145 million between 2011 and 2016, according to Analysys Mason Research (2011). The number of cellular connections in the Middle East and Africa is expected to grow by an even greater amount—531 million phones—over this same period. We anticipate that a rapidly growing subscriber base will generate demand for new mobile services and increase demand for existing mobile services. Moreover, individuals in emerging markets tend to rely more upon mobile channels for the delivery of and payment for mobile services such as ours than do people in more developed countries who have greater access to computers, broadband Internet and credit card and banking services. Thus, we believe that our focus on these emerging markets and our experience monetizing mobile channels puts us in a position to service this expected increase in demand and is one of the fundamental strengths of our business.
Dynamic and fast-growing mobile market
The market for mobile services is growing rapidly. For example, Macquarie Equities Research (2010) estimates that worldwide spending on mobile advertising will grow to $14 billion in 2015, compared with $3.5 billion spent on mobile ads in 2010. Similarly, the demand for mobile payment services is expected to increase significantly. For example, Gartner (2011) calculates that approximately $49 billion worth of mobile payment transactions were made worldwide in 2010 and estimates that that figure will increase to approximately $426 billion for 2015. We believe our experience in the mobile market and numerous connections with mobile carriers put us in a unique position to capitalize on this significant opportunity.
A global leader in mobile marketing and monetization
We believe we are one of the largest participants in the mobile marketing and monetization market worldwide, based on feedback our regional managers receive from local mobile carriers. With €233.9 million in total revenues in 2010 and organic revenue growth since our formation in 2002, we have grown with the mobile market and we now provide solutions that leverage our position as a market leader. We have billing connections with more than 280 mobile carriers, many of which have been in place for several years. Our global reach—with access to a network of nearly three billion end users—and our positioning in between mobile carriers, media groups, governments, NGOs, brand owners, content owners and end users, give us unique insights into industry trends and end user demands. We leverage these insights in order to deliver targeted and customized mobile marketing, mobile entertainment and mobile money services to end users, and we draw upon our local market
2
insight, technological platform and experience to offer tailored strategies to our broad range of clients. We believe that these factors combine to create a self-reinforcing cycle that has contributed to the strong growth of our business: our large end user base tends to attract more content owners and marketers; more content owners and marketers tend to drive greater monetization; greater monetization tends to attract more mobile carriers; and more mobile carriers, in turn, tends to increase our end user base.
Scalable, cloud-based technology platform
Every area of our business draws upon our platform, which incorporates flexible, cloud-based, software-as-a-service technologies and spans multiple customer segments and channels. Proprietary technology powers our platform, allowing us to offer unique and differentiated solutions to our clients. In addition to being deeply integrated with the systems of more than 280 mobile carriers worldwide, our platform modules are also integrated with one another, across all our business activities and customer segments. Finally, with its highly scalable and modular architecture, our proprietary platform has given us the flexibility and agility we need to respond to the rapid growth and change that have been hallmarks of the mobile market. This design allows us to leverage our existing platform assets to build our business according to local demands and to deliver significant benefits to our advertiser, content owner and media group clients, including time savings, revenue enhancement, ease of use and risk reduction, even within an evolving mobile ecosystem.
Local presence provides unique market insight and sustainable leadership
Our local presence enables us to deliver location-specific solutions along with targeted services. We have on-the-ground teams in 25 local offices and have created more than 50 local legal entities, each structurally tailored to meet local requirements. This presence provides firsthand insights into local culture, business practices and demographics and allows us to identify up-to-the-minute trends and evolving end user demand, which influence our marketing and targeting strategies in each of our distinct markets. Correspondingly, our ties to these markets enable us to respond to demands and trends we identify by sourcing and then delivering local content, tailored to the particular location, taking into account such factors as language and the predominant handsets used in the area. Additionally, our local focus has played a crucial role in the development and maintenance of lasting connections with mobile carriers, media groups, including broadcasters, as well as advertising agencies and media buyers who, themselves, frequently refer us to their own partners or affiliates in other regions, providing growth opportunities and broadening our reach. We draw on all these benefits to provide a range of monetization solutions to our clients that we believe only a company with such an extensive local knowledge and expertise could provide.
Multiple solutions provide value across the entire mobile value chain
Our cloud-based technology platform, our billing connections to mobile carriers worldwide and corresponding global presence, our local client and carrier relationships and our marketing and sales expertise are common features of each of our mobile marketing, mobile entertainment and mobile money activities. As we grow and devote resources to enhancing any one of these business activities, we also enhance the other business activities by virtue of strengthening our core assets and building upon our mobile monetization solutions platform.
Additionally, by drawing upon resources across our different business activities, we are able to create valuable synergies. For example, end user insights and industry trends that we learned as a providers of mobile entertainment have proven extremely useful to the design of mobile marketing campaigns. Similarly, the close relationships we maintain with mobile carriers in connection with both our mobile entertainment and mobile marketing business activities drive our mobile money activities.
3
We believe our portfolio presents an attractive value proposition to clients, whether for a single monetization solution or as a one-stop shop for multiple solutions in the mobile value chain.
Best-in-class management with an outstanding track record of organic growth
We believe that our success can be traced to the experience and capabilities of our management team. With rich mobile market expertise, nuanced knowledge of local markets, a solid network of business relationships and a proven track record of diversification, internationalization and financial results, our management team has led TIMWE from an idea in 2002, to a large, innovative, global participant in the fast-moving and highly competitive mobile industry.
Our close relationships with key clients give us early insights into new business opportunities and facilitate our expansion into new markets. By drawing on our existing assets—our relationships, adaptable technology and experience—our management team has guided our expansion into new geographical and service markets effectively and without resorting to acquisitions.
Business Strategy
Reinforce our leading position in current, attractive markets
We believe, based on feedback our regional managers receive from local mobile carriers, that we are one of the leading providers of mobile entertainment and mobile marketing services in Latin America, and our historical presence there dates back to 2005. We intend to continue to reinforce our position in our historic stronghold and use our market position to capitalize upon new opportunities, whether in the form of increasing the penetration of our existing monetization solutions or strategically rolling out new services. For example, with Brazil slated to host the World Cup in 2014 and the Olympic Games in 2016, we believe we are ideally positioned to take advantage of the media attention, growth and related opportunities these events are expected to bring, and we are already working with clients to develop related strategies. In addition, we have identified what we believe to be strong growth prospects in each of our business areas that we intend to pursue in our effort to sustain our leading position in Latin America. For example, we have already developed initiatives to capitalize upon location-based chat in our mobile entertainment area, we are focusing on creative solutions for media group and government clients in mobile marketing and in mobile money we are preparing to participate in the expected growth of in-app payments.
Expand into new geographies
We intend to follow our historical business model and expand our current offerings into new, emerging markets where we see high-growth potential. By focusing on geographies such as Africa and the Middle East in particular, and also Asia and Central and Eastern Europe, we can leverage our scalable, cloud-based distribution platform technology and participate in the anticipated growth in demand for mobile services in these markets. In Latin America, we aim to draw upon the experience we have in successfully establishing a strong presence in countries such as Brazil, Argentina and Mexico in order to pursue parallel growth opportunities in smaller markets in Latin America where we do not yet have a footprint, as well as enhance our presence in markets such as Puerto Rico, Ecuador and Nicaragua. We see opportunities in Africa and the Middle East—regions that are characterized by low mobile services penetration—and particularly, in countries such as Nigeria and Pakistan, to build a strong leadership position and participate in the expected rapid growth in these markets. Finally, in Asia, we intend to work to grow our existing operations in countries such as Malaysia, Indonesia and Vietnam.
4
Increase penetration of high-potential customer verticals
In addition to capitalizing upon existing offerings and territories, we believe we have a substantial opportunity to increase our penetration into new verticals, namely those of government/NGO and consumer brand clients.
We currently provide services to government entities and NGOs and we see significant potential for future growth in partnering with government entities and NGOs who wish to leverage the cost-effectiveness, convenience and targeting capability of mobile, digital channels to offer solutions such as awareness campaigns, information services, surveys, support to remote populations and information requests. For instance, in 2010 we worked with the ColombianAgencia Presidencial para la Acción Social y la Cooperación Internacional(“Acción Social”) to design a campaign aimed toward fostering the economic development and social inclusion of vulnerable groups in Colombia who were plagued by poverty, drugs and violence. Leveraging the mobile communication channel, we created a bulk SMS and SMS-based chat service to enhance interactivity between Acción Social and these target groups. End users in these groups were delivered important information concerning government services while Acción Social employed social workers to respond to SMS-based queries in real time. Acción Social was able to communicate with more than 1.2 million individuals—many of whom reside in remote locations—and register their information in its database in order to continue fostering the development of these groups.
We also see significant potential in continuing to work with and develop solutions for consumer brand clients. Consumer brand owners invest considerable amounts in marketing efforts and communicating with existing and potential customers. We believe that consumer brand clients who work with us can differentiate themselves from their competitors by delivering customized, targeted solutions—electronic coupons, loyalty-based discounts and pricing or other key information services—to a narrowly defined audience and exploring new ways that mobile channels can facilitate interaction with their customers. For example, in 2010 we worked with Kellogg’s to develop a campaign for its Special K brand cereal. Leveraging our connections with several mobile carriers in Mexico, we created a Calorie Counter application to supplement Special K’s 15 Day Program initiative to connect with customers and underscore its image as a promoter of healthy lifestyles. More than 120,000 end users in Mexico downloaded the Calorie Counter application, increasing awareness of the Special K initiative and enhancing Kellogg’s relationships with its customers.
Deepen relationships with carriers and media groups
In addition to our numerous, solid relationships with mobile carriers, we have strong existing relationships with media groups, particularly television broadcasters and programmers. We see the potential to develop these relationships through loyalty programs and other innovative solutions that draw on our expertise and combine the power of the broad-reaching mobile and media channels. For example, by combining television advertisements with mobile text-based trivia and other games, we are developing with mobile carriers and media groups joint “anti-zapping” campaigns aimed at reducing the likelihood of viewers skipping or ignoring advertisements and at increasing traffic across the carriers’ networks. Given media groups’ and carriers’ relative lack of mobile marketing experience and scale, we believe that such partnerships could leverage our mobile monetization platform and the wide appeal of television in our markets and deliver significant benefits to our partners and us.
Exploit significant opportunity in the mobile money market
We see significant growth prospects in the mobile money market, and we believe that, with our billing solutions and micropayment services, we are well positioned to participate in such growth. For instance, Gartner (2011) calculated that the total volume of mobile money payments was approximately $49 billion worldwide in 2010 and estimates that such volume will grow to approximately $426 billion in 2015. With our worldwide presence, numerous connections with mobile carriers in our territories and technological expertise, we believe
5
that we can move up the value chain and offer our own brand of compelling micropayment solutions to capitalize upon growth in the mobile money market. By providing both billing and payment services, we can streamline the value chain for online merchants who wish to leverage our direct access to mobile carriers around the world and improve their economics.
Capitalize upon smartphone app opportunity
Our mobile carrier connections and access to a network of nearly three billion end users together with our mobile marketing and sales expertise lay the foundation for our initiative to use our existing technology platform to monetize and distribute mobile apps under our own brand—App Republic Plus—and as a white label service to mobile carrier and other clients. With App Republic Plus and our white label initiatives, we believe that we can offer advantages to each link in the smartphone app distribution value chain. Our ability to offer payment solutions benefits end users who, like the substantial majority of individuals in our target geographies, do not have access to credit cards or banking services. The billing connections we have with mobile carriers and our local presence in our markets, which allows us to service those carriers, provide the global footprint, large-scale access to end users and mobile payment solutions that are important to content owners and aggregators. Lastly, our capabilities address what we believe is a growing concern among mobile carriers that credit-card based app stores, such as those operated by Apple and Google, will cut them out of the app distribution value chain. We believe that our model for App Republic Plus and white label stores combined with our deep relationships with mobile carriers and expertise in developing and operating mobile monetization platforms positions us to monetize and distribute smartphone apps while delivering value.
Recent Developments
Based on our preliminary results of operations, our revenues for the three months ended June 30, 2011 grew approximately in the high teens in percentage terms compared with the same period of 2010, with growth across most geographies, particularly in Brazil and Africa. Revenues for the three months ended June 30, 2010 and the subsequent three month period of 2010 were particularly strong as a result of large and successful campaigns in Brazil, which straddled such periods of 2010. Margins were broadly stable in the three months ended June 30, 2011 compared with the same period of the prior year based on our preliminary results of operations, with certain operating expense line items to some degree varying as a percentage of revenues due to changes in our revenue and geographic mix. The preliminary results discussed in this paragraph are not yet final, are subject to ongoing review and may differ from our final results.
Risk Factors
We face numerous risks and uncertainties that may affect our future financial and operating performance, including, among others, the following: risks related to our reliance on mobile carriers, risks relating to a substantial portion of our business being concentrated in Brazil, risks related to the housing of our technology platform in a single datacenter facility, risks relating to the fluctuation of our quarterly results, risks related to the competitive industry in which we operate and risks related to the global nature of our business. One or more of these matters could negatively affect our business or financial performance as well as our ability to successfully implement our strategy. This list of risks is not comprehensive, and you should see the section entitled “Risk Factors” for a more detailed discussion of the risks associated with an investment in our common shares.
Our registered and principal executive offices are located at Avenida Infante Santo, 2H, 3º 1350-178, Lisbon, Portugal, and our general telephone number is +351-212-487-800. We maintain a number of web sites, including www.timwe.com. The information on, or accessible through, our web sites, including those web sites listed in “Business—Intellectual Property—Proprietary” is not part of this prospectus.
6
THE OFFERING
Issuer
Common shares offered by us
Common shares offered by the selling shareholders
Selling shareholders
| | The selling shareholders, who are also members of our management, will in the aggregate own 80.4% of our common shares upon completion of the offering and will continue to exercise significant influence over us. See “Principal and Selling Shareholders.” |
Overallotment option
| | We and the selling shareholders have granted to the underwriters a 30-day option to purchase on a pro rata basis up to 843,750 additional shares from us and an aggregate of 843,750 additional outstanding shares from the selling shareholders at the initial public offering price less the underwriting discounts and commissions. The option may be exercised only to cover any overallotments of common stock. |
Common shares to be outstanding immediately after this offering
Proposed NASDAQ Stock Market symbol
Lockup agreements
| | We have agreed with the underwriters, subject to certain exceptions, not to sell or dispose of any common shares or securities convertible into or exchangeable or exercisable for any common shares during the period commencing on the date of this prospectus until 180 days after the completion of this offering. Our shareholders, executive officers and directors have agreed to similar lockup restrictions for a period of 180 days. See “Underwriting.” |
Use of proceeds
| | We expect to receive total estimated net proceeds from this offering of approximately $77.9 million, after deducting estimated underwriting discounts and expenses and assuming no exercise of the overallotment option by the underwriters. We will not receive any proceeds from the sale of common shares by the selling shareholders. We intend to use the proceeds from this offering to accelerate expansion into new markets, enhance our monetization solutions portfolio through new developments and strengthen our capacity to pursue strategic acquisitions. |
Corporate governance
| | We rely on NASDAQ rules that exempt us, as a “foreign private issuer,” from certain NASDAQ corporate governance requirements applicable to U.S. issuers. See “Risk Factors—Risks Related to our Common Shares—Our status as a foreign private issuer exempts us from certain of the corporate governance standards of the NASDAQ Stock Market (“NASDAQ”), limiting the protections afforded to investors.” |
7
Risk factors
| | You should carefully read the information set forth under “Risk Factors” and the other information set forth in this prospectus before investing in the common shares. |
Unless otherwise indicated, all information contained in this prospectus:
| | • | | assumes no exercise of the underwriters’ option to purchase up to 1,687,500 additional common shares to cover overallotments of common shares, if any; |
| | • | | assumes the common shares to be sold in this offering will be sold at $13.00, which is the midpoint of the range set forth on the cover page of this prospectus, and the resulting amount will be translated into euro at the rate of $1.4366 per €1.00, the noon buying rate for the euro on July 22, 2011, the most recent practicable date prior to the date of this prospectus. The “noon buying rate” is the noon buying rate in New York City for cable transfers in foreign currencies as certified for customs purposes by the Federal Reserve Bank of New York. No representation is made that euro could have been, or could be, converted into U.S. dollars at that rate or at any other rate; |
| | • | | gives effect to certain common share splits we have effected in advance of the offering, the most recent of which was a 1.667-for-1 common share split effective as of July 15, 2011 and which increased the number of common shares outstanding from 30,000,000 to 50,000,000 immediately prior to the offering; and |
| | • | | does not give effect to (i) the proposed incentive plan involving up to a maximum of 10% of our capital stock following the offering described under “Management—Incentive Plan” or (ii) the award by us to one of our executive officers of rights to receive approximately 134,000 common shares from us in connection with the offering which will vest over a three year period, as described under “Management—Compensation.” |
8
SUMMARY FINANCIAL AND OPERATING DATA
The following financial data of TIMWE at March 31, 2011 and for the three months ended March 31, 2011 and March 31, 2010 and at December 31, 2010 and 2009 and for the years ended December 31, 2010, 2009 and 2008 have been derived from the consolidated financial statements prepared in accordance with International Financial Reporting Standards as issued by the International Accounting Standards Board (or “IFRS-IASB”). The financial data of TIMWE at December 31, 2007 and 2006 and for the years ended December 31, 2007 and 2006 have been prepared in accordance with IFRS-IASB, using as a basis our consolidated financial statements prepared in accordance with IFRS as adopted by the European Union (or “EU-IFRS”) for those years, which are not included herein. There are no differences, applicable to TIMWE, between IFRS-IASB and EU-IFRS for any of the periods presented. Our historical results are not necessarily indicative of results to be expected for future periods.
This financial data should be read in conjunction with our audited consolidated financial statements and the related notes and “Selected Financial and Operating Data,” and “Management’s Discussion and Analysis of Financial Condition and Results of Operations” included in this prospectus.
| | | | | | | | | | | | | | | | | | | | | | | | | | | | | | | | | | | | |
| | | Three Months Ended March 31, | | | Year Ended December 31, | |
| | | 2011(1) | | | 2011 | | | 2010 | | | 2010(1) | | | 2010 | | | 2009 | | | 2008 | | | 2007 | | | 2006 | |
| | | (in thousands, except share and per share data) | |
| Income Statement Data | | | | |
Revenues | | $ | 67,205 | | | € | 47,384 | | | € | 34,600 | | | $ | 331,671 | | | € | 233,851 | | | € | 166,241 | | | € | 125,339 | | | € | 67,813 | | | € | 43,548 | |
Operating Expenses: | | | | | | | | | | | | | | | | | | | | | | | | | | | | | | | | | | | | |
Cost of service delivery | | | 34,202 | | | | 24,115 | | | | 18,798 | | | | 166,392 | | | | 117,318 | | | | 97,056 | | | | 65,059 | | | | 32,118 | | | | 15,660 | |
Commercial and production costs | | | 22,999 | | | | 16,216 | | | | 10,237 | | | | 107,826 | | | | 76,025 | | | | 37,130 | | | | 35,292 | | | | 21,511 | | | | 19,918 | |
Personnel costs | | | 4,059 | | | | 2,862 | | | | 2,269 | | | | 13,594 | | | | 9,585 | | | | 8,758 | | | | 6,519 | | | | 4,430 | | | | 1,435 | |
General and administrative | | | 2,926 | | | | 2,063 | | | | 1,631 | | | | 10,674 | | | | 7,526 | | | | 6,980 | | | | 6,162 | | | | 3,258 | | | | 1,791 | |
Tax expenses | | | 472 | | | | 333 | | | | 445 | | | | 4,628 | | | | 3,263 | | | | 2,306 | | | | 2,150 | | | | 420 | | | | 93 | |
Amortization and depreciation | | | 1,879 | | | | 1,325 | | | | 932 | | | | 5,992 | | | | 4,225 | | | | 2,490 | | | | 1,605 | | | | 517 | | | | 129 | |
Provisions expense | | | 129 | | | | 91 | | | | 46 | | | | 835 | | | | 589 | | | | 405 | | | | 116 | | | | 853 | | | | 20 | |
| | | | | | | | | | | | | | | | | | | | | | | | | | | | | | | | | | | | |
Total operating expense | | | 66,667 | | | | 47,005 | | | | 34,358 | | | | 309,943 | | | | 218,531 | | | | 155,125 | | | | 116,903 | | | | 63,107 | | | | 39,046 | |
| | | | | | | | | | | | | | | | | | | | | | | | | | | | | | | | | | | | |
Operating profit | | | 538 | | | | 379 | | | | 242 | | | | 21,728 | | | | 15,320 | | | | 11,116 | | | | 8,436 | | | | 4,706 | | | | 4,502 | |
| | | | | | | | | | | | | | | | | | | | | | | | | | | | | | | | | | | | |
Finance income | | | 153 | | | | 108 | | | | 314 | | | | 2,340 | | | | 1,650 | | | | 139 | | | | 570 | | | | 511 | | | | 484 | |
Finance costs | | | (600 | ) | | | (423 | ) | | | (440 | ) | | | (3,654 | ) | | | (2,576 | ) | | | (2,415 | ) | | | (1,500 | ) | | | (687 | ) | | | (618 | ) |
| | | | | | | | | | | | | | | | | | | | | | | | | | | | | | | | | | | | |
Net finance income (costs) | | | (447 | ) | | | (315 | ) | | | (126 | ) | | | (1,313 | ) | | | (926 | ) | | | (2,276 | ) | | | (930 | ) | | | (176 | ) | | | (134 | ) |
| | | | | | | | | | | | | | | | | | | | | | | | | | | | | | | | | | | | |
Profit before income taxes | | | 91 | | | | 64 | | | | 116 | | | | 20,415 | | | | 14,394 | | | | 8,840 | | | | 7,506 | | | | 4,530 | | | | 4,368 | |
| | | | | | | | | | | | | | | | | | | | | | | | | | | | | | | | | | | | |
Income tax expenses | | | (254 | ) | | | (179 | ) | | | 25 | | | | 4,807 | | | | 3,389 | | | | 1,676 | | | | 2,119 | | | | 1,973 | | | | 1,691 | |
| | | | | | | | | | | | | | | | | | | | | | | | | | | | | | | | | | | | |
Net income | | | 345 | | | | 243 | | | | 91 | | | | 15,608 | | | | 11,005 | | | | 7,164 | | | | 5,387 | | | | 2,557 | | | | 2,677 | |
| | | | | | | | | | | | | | | | | | | | | | | | | | | | | | | | | | | | |
Profit attributable to non-controlling interests | | | (31 | ) | | | (22 | ) | | | (120 | ) | | | 1,513 | | | | 1,067 | | | | 930 | | | | (26 | ) | | | 46 | | | | 50 | |
| | | | | | | | | | | | | | | | | | | | | | | | | | | | | | | | | | | | |
Profit attributable to controlling interests | | $ | 376 | | | € | 265 | | | € | 211 | | | $ | 14,095 | | | € | 9,938 | | | € | 6,234 | | | € | 5,413 | | | € | 2,511 | | | € | 2,627 | |
| | | | | | | | | | | | | | | | | | | | | | | | | | | | | | | | | | | | |
Earnings per share (basic and diluted) | | | — | | | | — | | | | — | | | $ | 0.17 | | | € | 0.12 | | | € | 0.08 | | | € | 0.07 | | | € | 0.03 | | | € | 0.03 | |
| | | | | | | | | | | | | | | | | | | | | | | | | | | | | | | | | | | | |
Weighted average shares used to compute earnings per share | | | 65,319 | | | | 65,319 | | | | 82,917 | | | | 82,917 | | | | 82,917 | | | | 82,917 | | | | 82,917 | | | | 83,333 | | | | 83,333 | |
| | | | | | | | | | | | | | | | | | | | | | | | | | | | | | | | | | | | |
9
| | | | | | | | | | | | | | | | | | | | | | | | | | | | | | | | |
| | | At March 31, | | | At December 31, | |
| | | 2011
(Pro Forma)(2) | | | 2011(1) | | | 2011 | | | 2010 | | | 2009 | | | 2008 | | | 2007 | | | 2006 | |
| | | (in thousands, except share and per share data) | |
| Balance Sheet Data | | | | |
Cash and cash equivalents | | € | 62,225 | | | $ | 10,349 | | | € | 7,297 | | | € | 8,610 | | | € | 5,667 | | | € | 4,456 | | | € | 3,886 | | | € | 2,671 | |
Net working capital(3) | | | 70,738 | | | | 22,423 | | | | 15,811 | | | | 19,032 | | | | 11,284 | | | | 14,222 | | | | 5,725 | | | | 4,039 | |
Total assets | | | 115,080 | | | | 85,186 | | | | 60,153 | | | | 59,576 | | | | 46,738 | | | | 40,049 | | | | 24,000 | | | | 14,074 | |
Total liabilities | | | 40,630 | | | | 57,308 | | | | 40,630 | | | | 35,564 | | | | 32,729 | | | | 31,684 | | | | 16,923 | | | | 9,005 | |
Total debt | | | 13,724 | | | | 19,465 | | | | 13,724 | | | | 9,835 | | | | 10,204 | | | | 15,973 | | | | 4,329 | | | | 1,117 | |
Total stockholders’ equity | | | 74,451 | | | | 27,689 | | | | 19,524 | | | | 24,012 | | | | 14,009 | | | | 8,366 | | | | 7,078 | | | | 5,068 | |
| | | | | | | | | | | | | | | | | | | | | | | | | | |
| | | Three Months Ended
March 31, | | | Year Ended December 31, | |
| | | 2011 | | | 2010 | | | 2010 | | | 2009 | | | 2008 | | | 2007 | |
| Other Operating Data | | | | | | | | | | | | | | | | | | | | | | | |
Mobile Marketing | | | | | | | | | | | | | | | | | | | | | | | |
Number of mobile marketing campaigns | | | 30 | | | | 28 | | | | 93 | | | 115 | | | | 51 | | | | — | |
Average revenue per campaign (€ thousands) | | | 420.6 | | | | 134.8 | | | | 1,089.5 | | | 470.9 | | | | 741.8 | | | | — | |
Mobile Entertainment | | | | | | | | | | | | | | | | | | | | | | | |
Number of mobile entertainment subscribers (4)(thousands) | | | 18,190 | | | | 18,765 | | | | 19,334 | | | 19,175 | | | | 11,675 | | | | — | |
Average revenue per mobile entertainment subscriber (monthly)(€) | | | 0.48 | | | | 0.48 | | | | 0.48 | | | 0.45 | | | | 0.61 | | | | — | |
Mobile Money | | | | | | | | | | | | | | | | | | | | | | | |
Number of mobile money clients(5)(6) | | | 49 | | | | 30 | | | | 44 | | | 19 | | | | 1 | | | | — | |
Average revenue per client (monthly) (€ thousands) | | | 45.0 | | | | 32.2 | | | | 31.0 | | | 20.0 | | | | 19.4 | | | | — | |
| |
| | | (in thousands) | |
Total revenues | | € | 47,384 | | | € | 34,600 | | | | €233,851 | | € | 166,241 | | | € | 125,339 | | | € | 67,813 | |
Mobile marketing revenues | | | 13,499 | | | | 3,774 | | | | 101,320 | | | 54,154 | | | | 37,832 | | | | — | |
Mobile entertainment revenues | | | 27,264 | | | | 27,931 | | | | 116,185 | | | 107,534 | | | | 87,274 | | | | 67,813 | |
Mobile money revenues | | | 6,621 | | | | 2,895 | | | | 16,346 | | | 4,552 | | | | 233 | | | | — | |
Adjusted EBITDA(7) | | | 2,128 | | | | 1,665 | | | | 23,397 | | | 16,317 | | | | 12,307 | | | | 6,496 | |
Net income | | | 243 | | | | 91 | | | | 11,005 | | | 7,164 | | | | 5,387 | | | | 2,557 | |
| (1) | Certain euro amounts are translated into U.S. dollars at specified rates solely for the convenience of the reader. Unless otherwise indicated, such euro amounts have been translated at the rate of $1.4183 per €1.00, which corresponds to the noon buying rate for the euro calculated on March 31, 2011. |
| (2) | Pro forma reflects the issuance by us of 7,500,000 common shares at an offering price of $13.00 per share, the midpoint of the range set forth on the cover page of this prospectus, after deducting estimated underwriting discounts and estimated expenses for the offering payable by us, translated into euro at $1.4183 per €1.00, the noon buying rate on March 31, 2011. |
| (3) | Calculated as total current assets, which includes inventories, trade receivables, other receivables, current tax assets, other public entities, cash and cash equivalents and assets as held for sale; less total current liabilities, which includes loans and borrowings, financial lease obligations, suppliers and other current liabilities, current tax liabilities and other public entities. |
| (5) | Represents the number of clients with whom mobile money contracts have been signed. |
| (7) | We define Adjusted EBITDA as net income plus income tax expenses, finance costs, finance income, provisions expense, amortization and depreciation and tax expenses. Please see “—Adjusted EBITDA” for more information and for a reconciliation of Adjusted EBITDA to our net income calculated in accordance IFRS-IASB. |
10
Adjusted EBITDA
We include Adjusted EBITDA in this prospectus because (i) we seek to manage our business to a consistent level of Adjusted EBITDA as a percentage of total revenue, (ii) it is a key basis upon which our management assesses our operating performance, (iii) it is one of the primary metrics investors use in evaluating technology companies, and (iv) it is a factor in the evaluation of the performance of our management in determining compensation. We define Adjusted EBITDA as net income plus income tax expenses, finance costs, finance income, provisions expense, amortization and depreciation and tax expenses.
We use Adjusted EBITDA as a key performance measure because we believe it facilitates operating performance comparisons from period to period by excluding potential differences caused by variations in capital structures (affecting interest expense), tax positions (such as the impact on periods or subsidiaries of changes in effective tax rates or fluctuations in permanent differences or discrete quarterly items) and the impact of depreciation and amortization expense on definite-lived intangible assets. Because Adjusted EBITDA facilitates internal comparisons of our historical operating performance on a more consistent basis, we also use Adjusted EBITDA for business planning purposes, to incentivize and compensate our management personnel and in evaluating acquisition opportunities.
In addition, we believe Adjusted EBITDA and similar measures are widely used by investors, securities analysts, ratings agencies and other interested parties in our industry as a measure of financial performance and debt-service capabilities. Our use of Adjusted EBITDA has limitations as an analytical tool, and you should not consider it in isolation from, or as a substitute for, analysis of our results as reported under IFRS-IASB. Some of these limitations are:
| | • | | Adjusted EBITDA does not reflect our cash expenditures for capital equipment or other contractual commitments; |
| | • | | although depreciation and amortization are non-cash charges, the assets being depreciated and amortized may have to be replaced in the future, and Adjusted EBITDA does not reflect cash capital expenditure requirements for such replacements; |
| | • | | Adjusted EBITDA does not reflect changes in, or cash requirements for, our working capital needs; |
| | • | | Adjusted EBITDA does not consider the potentially dilutive impact of issuing equity-based compensation to our management team and employees; |
| | • | | Adjusted EBITDA does not reflect the interest expense or the cash requirements necessary to service interest or principal payments on our indebtedness; |
| | • | | Adjusted EBITDA does not reflect certain tax payments that may represent a reduction in cash available to us; and |
| | • | | other companies, including companies in our industry, may calculate Adjusted EBITDA measures differently, which reduces their usefulness as a comparative measure. |
Because of these limitations, Adjusted EBITDA should not be considered as a measure of discretionary cash available to us to invest in the growth of our business. When evaluating our performance, you should consider Adjusted EBITDA alongside other financial performance measures, including various cash flow metrics, net income and our other IFRS-IASB financial results.
11
The following table presents a reconciliation of Adjusted EBITDA to net income, the most comparable IFRS-IASB measure, for each of the periods indicated:
| | | | | | | | | | | | | | | | | | | | | | | | | | | | |
| | | Three Months Ended
March 31, | | | Year Ended December 31, | |
| | | 2011 | | | 2010 | | | 2010 | | | 2009 | | | 2008 | | | 2007 | | | 2006 | |
| | | (in thousands) | |
Net income | | € | 243 | | | € | 91 | | | € | 11,005 | | | € | 7,164 | | | € | 5,387 | | | € | 2,557 | | | € | 2,677 | |
Income tax expenses | | | (179 | ) | | | 25 | | | | 3,389 | | | | 1,676 | | | | 2,119 | | | | 1,973 | | | | 1,691 | |
Finance costs | | | 423 | | | | 440 | | | | 2,576 | | | | 2,415 | | | | 1,500 | | | | 687 | | | | 618 | |
Finance income | | | (108 | ) | | | (314 | ) | | | (1,650 | ) | | | (139 | ) | | | (570 | ) | | | (511 | ) | | | (484 | ) |
Provisions expense | | | 91 | | | | 46 | | | | 589 | | | | 405 | | | | 116 | | | | 853 | | | | 20 | |
Amortization and depreciation | | | 1,325 | | | | 932 | | | | 4,225 | | | | 2,490 | | | | 1,605 | | | | 517 | | | | 129 | |
Tax expenses | | | 333 | | | | 445 | | | | 3,263 | | | | 2,306 | | | | 2,150 | | | | 420 | | | | 93 | |
| | | | | | | | | | | | | | | | | | | | | | | | | | | | |
Adjusted EBITDA | | € | 2,128 | | | € | 1,665 | | | € | 23,397 | | | € | 16,317 | | | € | 12,307 | | | € | 6,496 | | | € | 4,744 | |
| | | | | | | | | | | | | | | | | | | | | | | | | | | | |
12
RISK FACTORS
You should carefully consider the risks and uncertainties described below, as well as the other information in this prospectus, before deciding to purchase the common shares offered hereby. Our business, results of operations, financial condition or prospects could be adversely affected by any of these risks and uncertainties, and as a result, the market price of the common shares could decline and you could lose part or all of your investment. The risks and uncertainties described below are those that are known to us and that we currently believe may materially affect us.
Risks Relating to our Business
We rely on mobile carriers for the delivery and billing of most of our mobile marketing, mobile entertainment and mobile money services and, therefore, we may experience a material adverse effect on our business, results of operations or financial condition if our relationship with any key mobile carrier ceases or deteriorates.
We deliver most of our mobile marketing, mobile entertainment and mobile money services to clients and end users through mobile carriers, and we are therefore dependent on these mobile carriers to a significant degree. During the year ended December 31, 2010 as well as the three months ended March 31, 2011, we received nearly all of our revenue via mobile carriers, which remit to us an agreed portion of the sales price of the services we offer to clients and end users through these carriers’ respective networks and retain the remainder as compensation for the delivery of our services as well as the carrier’s billing and collection efforts. If our contracts with any of the mobile carriers through which we offer our services are terminated or adversely altered, whether as to fee structure or otherwise, it may be difficult to find appropriate replacement operators with the requisite licenses and permits, infrastructure and customer base to offer our services profitably, or at all, and as a result, our business would suffer. Even if available, securing and negotiating alternative delivery and billing channels could cause interruptions to our business, and such alternative channels could greatly limit the usability of our services, all of which could materially and adversely impact our business, results of operations or financial condition.
The terms of our contracts with mobile carriers vary, but generally allow for termination by either party with one to three months’ notice at the discretion of the terminating party, and generally allow for unilateral modification of the contract by the mobile carrier at any time. Except in the instances where our relationship with mobile carriers is arranged through an agreement with a third-party connectivity service provider, all of our contracts with mobile carriers are negotiated directly between the carrier and us.
We provide our services through a network of more than 280 mobile carriers in more than 75 countries. In 2010, 77% of our revenues were generated through the billing systems of our top ten mobile carriers, with approximately a quarter of our revenue in such year being generated through the billing system of our largest carrier in terms of revenues, Vivo (Brazil). The termination of or failure to renew any of the agreements we have with any large mobile carrier, and particularly with Vivo, could have a material adverse effect on our business, results of operations or financial condition.
Additionally, we rely on mobile carriers’ networks to deliver our services to our clients and end users and on their billing systems to track and account for the downloading of our services. Any failure of, or technical problem with, the mobile carriers’ billing and delivery systems, information systems or communications networks could result in the inability of our clients and end users to access our services or prevent the completion of billing for our services. Any failure of, or technical problem with, the mobile carriers’ systems could cause us to lose clients, end users or revenues or incur substantial repair costs and distract management from operating our business. From time to time, we have experienced limited failures with mobile carriers’ billing and delivery systems and communication networks. If any such billing and delivery failures or technical problems were to continue for a prolonged period of time, it could reduce our sales, increase costs or result in a loss of clients or end users, which could have a material adverse effect on our business, results of operations and financial condition.
13
Factors beyond our control could cause our relationship with one or more key mobile carriers to deteriorate or terminate, which could severly disrupt our operations and result in the loss of a significant portion of our revenues.
We are substantially dependent upon our relationships with mobile carriers for the delivery and billing of most of our services. There are a number of factors beyond our control that could impair our relationship with mobile carriers, including the following:
| | • | | a carrier’s decision to offer its own, competing mobile entertainment, mobile marketing or mobile money services to its customers; |
| | • | | a carrier’s decision to discontinue or suspend the sale of our services, or altogether discontinue sales of services such as ours; |
| | • | | a carrier’s decision to withdraw a short number allocated to us; |
| | • | | a carrier’s decision to change the terms under which it arranges the delivery and billing of our services; |
| | • | | a carrier’s decision not to approve our desired pricing or other terms for the services we offer through such carrier’s network or its failure to approve a price range within which we can profitably offer our services; |
| | • | | a carrier’s decision to increase the fees it charges to distribute our services or to invoice and collect on our behalf amounts owed by end users, thereby increasing its own revenues and decreasing our share of revenues; or |
| | • | | a carrier’s preference for the services of our competitors, which could affect our ability to maintain an existing agreement or enter into a new agreement with that carrier. For important information concerning competition in our market, see “Risk Factors—Risks Relating to our Industry—We operate in a highly dynamic and competitive industry. If we are unable to compete effectively with our existing or any new competitors, our business, results of operations or financial condition could be materially and adversely affected.” |
Generally, the deterioration of our relationship with any of the mobile carriers through which we offer our services may severely disrupt our operations and result in the loss of a significant portion of our revenues, and may have a material adverse effect on our business, results of operations or financial condition.
A substantial portion of our revenues is derived from our operations in Brazil, and the termination or alteration of our contracts with the mobile carriers in Brazil could have a particularly adverse effect on our results of operations and overall financial condition.
For the year ended December 31, 2010, our operations in Brazil accounted for 44% of our total revenues. No other single country accounted for more than 10% of our total revenues in 2010. Accordingly, if we lose a significant amount of clients or end users in Brazil because of the termination of mobile carrier contracts, the deterioration of important strategic relationships, unexpected government regulation, competitors entering or improving their market share in the Brazilian market, any natural disaster, war or terrorist attack of which Brazil is a victim or for any other reason, our revenue could be substantially reduced, which could materially adversely affect our overall business, results of operations and financial condition.
Because a substantial portion of our revenues is derived from our operations in Brazil, our business is particularly sensitive to economic and political conditions in Brazil. Any economic downturn or adverse political changes in Brazil could have a material, adverse effect on our business, results of operations and financial condition.
A material portion of our business, results of operations and financial condition could be influenced by general economic conditions in Brazil, namely economic growth and its impact on mobile services. Major factors that could have a material adverse effect on our business and results of operations in Brazil include:
Adverse political and economic conditions. The Brazilian government has exercised, and continues to exercise, significant influence over the Brazilian economy. The Brazilian government has utilized salary and
14
price controls, currency devaluation, capital controls and limits on imports, among other things, as tools in its previous attempts to stabilize the Brazilian economy and control inflation. Changes in the Brazilian government’s exchange control policy, or in general economic conditions in Brazil, could have a material adverse effect on the results of our operations in Brazil. Deterioration in economic and market conditions in other countries (mainly in other Latin American and emerging market countries) may adversely affect the Brazilian economy and our business. Past political crises in Brazil have affected the confidence of investors and the public in general, as well as the development of the economy. Future political crises could have an adverse impact on the Brazilian economy and our business, financial condition and results of operations.
Fluctuations in the Real and increases in interest rates. The Brazilian currency historically has experienced frequent fluctuations relative to the Euro and other currencies. In 2005, 2007 and 2009 the Real appreciated against the Euro by 23.5%, 7.5% and 22.6%, respectively, and in 2006, 2008 and 2010 depreciated against the Euro by 1.8%, 24.1% and 12.3%, respectively. Any substantial negative reaction to the policies of the Brazilian government could have a negative impact, including devaluation. The devaluation of the Real could negatively affect the stability of the Brazilian economy and accordingly could negatively affect the profitability and results of our operations. It also would increase costs associated with financing our operations in Brazil.
In response to the global economic and financial crisis, the Brazilian government increased the Banco Central do Brasil’s Special System for Settlement and Custody’s, or “SELIC,” basic interest rate to 13.75% as of December 31, 2008. In 2009, the Brazilian Central Bank reduced the SELIC once more to 8.75%. In 2010, the SELIC was increased to 10.75%. An increase in interest rates could negatively affect our profitability and results of operations and would increase the costs associated with financing our operations in Brazil.
Inflation in Brazil. Brazil historically has experienced high rates of inflation. Inflation, as well as governmental measures put in place to combat inflation, have had a material adverse effect on the Brazilian economy. Since the implementation of the Real Plan in 1994, the rate of inflation has been substantially lower than in previous periods. However, inflationary pressures persist, and actions taken in an effort to curb inflation, coupled with public speculation about possible future governmental actions, have in the past contributed to economic uncertainty in Brazil and heightened volatility in the Brazilian securities market. The Consumer Prices Index (Índice de Preços ao Consumidor), published byInstituto Brasileiro de Geografia e Estatística, rose 5.91% in 2010. The inflation rate was 4.3% in 2009, 5.9% in 2008, 4.5% in 2007 and 3.1% in 2006.
We use a single, leased datacenter to house our information technology, telecommunications and other infrastructure systems and to deliver our services. Any failure of these systems or disruption of service at this datacenter facility could materially and adversely affect our business, financial condition and results of operations.
Our information technology, telecommunications and other infrastructure systems face the risk of failure, which could seriously damage our operations. A significant disruption in the availability of these systems could cause interruptions in our service, loss of or delays in our research and development work or affect our relationships with mobile carriers, clients or end users and present potential liability vis-à-vis end users.
Additionally, we deliver nearly all of our services from a single datacenter facility leased from Mainroad and located in Lisbon, Portugal. This datacenter facility is vulnerable to damage or interruption from earthquakes, hurricanes, floods, fires, terrorist attacks, power losses, telecommunications and Internet failures and similar events. It also could be subject to break-ins, computer viruses, denial of service attacks, sabotage, intentional acts of vandalism and other misconduct. Because we lease our datacenter, we have little control over the physical security of the site and are substantially dependent upon Mainroad to protect the datacenter from physical security threats. The occurrence of a natural disaster or an act of terrorism or other unanticipated problems could result in lengthy interruptions in our services. Although we implement redundancy programs in our platform, maintain off-site backups of our data and have a disaster recovery program in place, we do not currently operate or maintain a backup datacenter for any of our services. This increases our vulnerability to
15
interruptions or delays in the delivery of our services, which could harm our reputation, cause us to incur financial penalties, subject us to potential liability, cause clients to terminate their contracts and materially and adversely affect our business, results of operations or financial condition.
Our quarterly results of operations may fluctuate significantly due to several factors, some of which are not within our control. Fluctuations in our quarterly results may make period-to-period comparisons of our results of operations and financial condition difficult and could affect the market price of our common shares in a manner unrelated to our long-term operating performance.
Our quarterly results of operations have fluctuated significantly in the past and are expected to fluctuate significantly in the future based on a number of factors, some of which are not in our control. Our business is seasonal, with revenues generally lowest in the first quarter of the year and gradually building throughout the year, prior to beginning to level off or decline toward the end of the fourth quarter of the year as a result of the termination of seasonal campaigns, cash conservation and reduced activity around the Christmas and New Year holidays, which tends to carry over into the subsequent year as a result of Carnival holidays in Brazil and the summer season throughout Latin America, our primary market. Next, our operating expenses do not increase or decrease in direct proportion to our generation of revenue, affecting the period-to-period comparability of our results. For example, in some cases we will have incurred significant commercial and production costs relating to client acquisition efforts and must recognize such costs as expenses in the period when incurred despite the fact that related revenues might be recognized in a subsequent period. As a result of this and our commercial strategy, which usually involves higher spending during the first half of the year, in general terms our operating profit tends to increase throughout the year and is significantly weighted toward the end of the year. Finally, some quarters may be exceptionally strong (or weak) due to the effectiveness of a particular marketing campaign. For example, we had particularly strong second and third quarters in 2010 in terms of revenue growth as a result of particularly large and successful campaigns in Brazil, which straddled the two periods. Similarly, in 2009 we completed a number of large and successful campaigns in the third and fourth quarters, which drove comparably stronger fourth quarter revenues for the year. Our operating expenses, which include general and administrative expenses, are relatively fixed in the short term. If our revenues are lower than we expect because end users or clients reduce the use of our services, our mobile marketing campaigns are not successful, we lose our connections with mobile carriers or for other reasons, we may not be able to quickly reduce our spending in response. These factors are difficult to forecast, and these or other factors could adversely affect our business. Any shortfall in our revenues would have a direct impact on our business. To the extent that we disclose information on a quarterly basis, fluctuations in our quarterly results could affect the market price of our common shares in a manner unrelated to our long-term operating performance. See “—Risks Related to our Common Shares—As a foreign private issuer we are not subject to all of the reporting requirements and other rules applicable to domestic companies.”
The success of our businesses is dependent upon effective advertising and marketing, and any failure by us to design and position effective and cost-efficient advertising and marketing, or to do so at sufficient levels, could have a material adverse effect on our business, results of operations or financial condition.
We rely on advertising and marketing that is effectively designed and positioned to make end users aware of our services. In addition to heightening awareness, our advertisements also provide end users with useful information—typically a telephone or SMS number—which they need to purchase a particular service. Currently, we make advertising and marketing decisions such as media mix planning and audience targeting based on the deep experience of our marketing and sales personnel. Because we offer services in more than 75 different countries, we face the challenge of identifying how tastes vary from region to region, end user to end user, and employing this knowledge to create appealing advertising and marketing campaigns. We cannot guarantee that we can continue to effectively design and position advertising and marketing campaigns.
Additionally, for the year ended December 31, 2010, we spent approximately €57.1 million on commercial costs relating to direct media costs for the placement of our advertising on television, the Internet and other media, with advertising costs accounting for €27.7 million of such amount. Given the importance of effective
16
advertising and marketing to our business and to our client acquisition efforts, and given the substantial share of our operating expenses that commercial and production costs represent, our business depends on our ability to deploy client acquisition resources—including commercial costs relating to advertising—effectively and cost-efficiently. We cannot accurately predict the future costs associated with our advertising efforts, including the costs of purchasing media space, and if these costs were to increase, we could be forced to reduce the amount of advertising and marketing we do or opt for less effective media, which could detrimentally affect our client acquisition efforts. Finally, the timing of our commercial costs may be influenced by our available cash levels at any time and whether such costs are likely to lead to revenues in the current period or subsequent periods. Any failure by us to design and position effective and cost-efficient advertising and marketing, or to do so at sufficient levels, could have a material adverse effect on our business, results of operations or financial condition.
Our services currently are designed primarily for use with basic phones. If we fail to capture opportunities in the expected growth of the smartphone market, our growth prospects may be materially and adversely affected.
Our services are designed primarily for use with basic phones, which currently have a substantially larger market share in Latin America and the other countries in which we operate compared with smartphones. Smartphones are already popular in developed countries, however, and may also gain popularity in our target geographies.
Smartphones are higher-priced, technologically advanced devices with personal computer-level versatility that operate advanced operating systems such as Android, Apple’s iOS, BlackBerry OS, Linux, Palm WebOS, Symbian and Windows Phone 7. Smartphones are usually characterized by more powerful processors, larger screens and higher data storage capacity than basic phones, and are able to easily install and run high-performance multimedia content and applications. As smartphones are gaining market share around the world, some of our users may migrate to smartphones, which can deliver mobile marketing, mobile entertainment and mobile money services with enhanced functionalities and additional features that may not be available on basic phones.
We currently offer some services for use with smartphones and plan to actively pursue new services for use with smartphones. However, there is no assurance that we can successfully establish new relationships with smartphone companies and application providers and increase or maintain the volume and/or market share of mobile handsets with our future smartphone services. In addition, many manufacturers of smartphones and companies that design operating systems for smartphones have developed their own content distribution systems and application stores. Even if we develop a complete portfolio of services designed to be compatible with smartphones, we will face significant competition and cannot guarantee that users of smartphones will use our services at the same level as basic phone users do. If we fail to adapt our service offerings for use with smartphones or if we fail to attract end users in the smartphone market, our growth prospects, business, results of operations and financial condition could be materially and adversely affected.
If we are unable to protect our intellectual property and proprietary rights, our competitive position and our business could be harmed.
We rely on a combination of trademarks, trade names, confidentiality and nondisclosure clauses and agreements, copyrights and licenses to define and protect our rights to the intellectual property in our platform and services. However, we cannot assure you that any of our registered or unregistered intellectual property rights, or claims to such rights, will now or in the future successfully protect what we consider to be our intellectual property from third-party use in any or all of the jurisdictions in which we do business, or that our registered or unregistered rights will not be successfully challenged.
To the extent that our innovations, platform and services are not protected by copyrights or other intellectual property rights in any of our key markets, third parties (including competitors) may be able to commercialize our innovations or services or use our know-how. In addition, to the extent we do not register, have not registered or
17
have not been granted trademarks or other intellectual property rights in certain jurisdictions, it may be possible for third parties to obtain conflicting trademarks or other intellectual property rights that would otherwise be limited or blocked by our applications and registration. Further, legal protection of our intellectual property rights in one country may not provide protection in other countries where we operate. We need to secure copyrights or other registrable intellectual property rights in all countries in which we intend to operate in order to have such protection.
The laws of many countries do not protect intellectual property rights to so great an extent as those of the United States or the member states of the European Union. Thus, effective protection of our intellectual property rights may be unavailable or limited in certain foreign countries. For example, many countries, particularly certain developing countries, do not favor the aggressive enforcement of trademarks and other measures to protect intellectual property. Limited intellectual property rights (whether because we do not have a registration or because the laws of some countries are limited) make piracy and misappropriation more difficult to prevent. Moreover, even when we have adequate intellectual property rights to stop an infringer, we may lack the resources to detect all infringements or to trace the source of the infringement. Finally, and despite agreements we have with certain employees prohibiting their disclosure of confidential or proprietary information, or laws in certain jurisdictions that prevent such disclosure, these agreements and laws may not effectively prevent the disclosure of our confidential or proprietary information.
We also claim rights in our trademarks and service marks. Certain of our marks are registered in Portugal, Brazil and other countries and we have filed applications to register certain other marks in these jurisdictions. We cannot assure you that we will be able to continue using all of our marks or that certain of our marks do not infringe the marks of others.
We operate in an industry with extensive intellectual property litigation. Claims of infringement against us may cause our business, results of operations and financial condition to suffer.
We have faced in the past and may in the future face claims for the infringement of the intellectual property rights of others. We may face claims or encounter situations and allegations which will require us to determine whether we need to license a technology or face the risk of defending an infringement claim. Even when we do license third-party technology, such license agreements customarily contain manner of use and scope of use provisions that restrict our use of the licensed technology to certain applications and geographic regions. Despite our efforts to comply with such restrictions, the increasingly global nature of the Internet and telecommunications technology and the ease with which digital media may be duplicated and transmitted can make it difficult to ensure that the licensed material that we distribute is not subsequently used in a manner or place that is restricted by the relevant license agreement. If our platform or any of our services is found to infringe the patents or other intellectual property rights of others, our development and sale of such services could be severely restricted or prohibited.
Patent and other intellectual property litigation can involve complex factual and legal questions, and its outcome is uncertain. Any claim relating to infringement of patents or other intellectual property that is successfully asserted against us may require us to pay substantial damages. Even if we were to prevail, any litigation could be costly and time-consuming and would divert the attention of our management and key personnel from our business operations. Furthermore, an intellectual property infringement suit brought against us or our licensees may force us or our licensees to stop or delay developing or selling services that are claimed to infringe a third party’s intellectual property rights unless that party grants us or our licensees rights of use. In such cases, we may be required to obtain licenses to patents or proprietary rights of others, which may not be available on acceptable terms or at all, or alternatively to modify our services to avoid incorporating such patents or proprietary rights, which may not be possible. Even if we or our licensees were able to obtain rights to the third party’s intellectual property, these rights may be nonexclusive, thereby giving our competitors access to the same intellectual property. Ultimately, we may incur significant additional costs or be unable to develop and market some of our services or we may have to cease some of our business operations as a result of patent or other intellectual property rights infringement claims, which could severely harm our business. We currently use
18
the trade names “TIM w.e.” and “TIMWE,” though we do not currently own trademark rights in connection with such names. We are aware that Telecom Italia Mobile owns trademark rights in connection with its “TIM” trade name in Italy and that it also owns trademark rights in connection with the same trade name in Brazil, where its subsidiary operates under the name “TIM Brazil.” We have not faced any intellectual property infringement suits based on the similarity of our trade name with the registered marks owned by Telecom Italia Mobile, but as we continue to expand and people become more familiar with our company, we face the risk of such disputes, which could force us to change our trade name or incur substantial litigation costs and/or penalties. See “Business—Legal and Administrative Proceedings.”
In addition, we may have to pay compensation for the proprietary rights of employees in certain circumstances. Under Portuguese law, we have rights to exploit the inventions created by employees in the normal course of their duties, and to the patrimonial rights in works covered by intellectual property rights, unless otherwise agreed between the parties. Nevertheless, in certain circumstances, we may be obliged to pay compensation to the employee for such inventions or works. Until now, we have not received any requests for compensation on these grounds, but we cannot assure you that this will continue to be the case.
Our content or the third-party content we license may give rise to liability and expose us to significant costs.
We face possible liability for defamation, negligence and other claims, such as product or service liability, based on the nature and content of the services that we provide. Such claims have been brought, sometimes successfully, against mobile entertainment and mobile marketing companies in the past. The law in these areas is unclear, and, accordingly, we are unable to predict the possible existence or extent of our liability in this area or related areas. Further, we do not verify the accuracy of the information supplied by third-party content owners for which we may be liable. While we carry general liability insurance, our insurance may not cover potential claims of this type in some or all of the markets in which we operate, or may not be adequate to indemnify us for all liability that may be imposed. Additionally, while we are entitled to indemnity rights in certain contracts we have with third parties, some claims may not be covered by these indemnity provisions or the third party may be unwilling or unable to indemnify us. Any imposition of liability that is not covered by insurance or other contractual indemnity rights or is in excess of insurance or other contractual indemnity coverage could have a material adverse effect on our business, results of operations or financial condition.
We depend on our ability to license attractive content from third parties and to continue to develop our own attractive content, and if we are unable to do so, our business could be jeopardized.
Our future success depends to a certain extent on our ability to license or produce and then aggregate, integrate and syndicate content of broad appeal to our end user base. For the year ended December 31, 2010, we derived a majority of our mobile entertainment revenues from third-party content. Our ability to maintain our relationships with such content owners and to build new relationships with additional content owners is critical to the success of our business. Content owners may in the future decide to produce and sell their own mobile entertainment services and may therefore refuse to license their content to companies such as ours. Our inability to secure licenses from content owners or the termination of a significant number of content owner agreements, would decrease the attractiveness of our service offerings to our end users, which could result in decreased revenues and, in turn, have a material adverse effect on our business, results of operations or financial condition.
In general, our license agreements with third-party content owners contain one-year terms and provide for payment of an initial fee for copying the licensed content onto our system as well as for payment of a portion of the revenues we generate from the sale of that particular content, measured by the number of actual downloads of the services relating to that particular licensed content. Our business, results of operations or financial condition could be materially adversely affected if content owners demand more favorable license agreement terms in the future.
We also develop our own content, such as texts and graphics. For the year ended December 31, 2010, approximately 59% of total mobile entertainment downloads were downloads of our proprietary content.
19
Developing an attractive portfolio of proprietary content requires significant investment in research and development personnel and technology. Moreover, as we offer services in more than 75 different countries, we face the challenge of offering services to individuals whose languages, cultures and tastes vary tremendously.
Additionally, in fast-paced digital industries, content is trending toward having a shorter useful life. In this challenging environment we cannot guarantee you that we can continue to successfully develop content that will be appealing to our end users or that in so doing we can keep pace with our competitors or market demands. Our failure to develop and maintain an attractive content portfolio could increase our reliance on third-party content owners and could have a material adverse affect on our business, results of operations or financial condition.
Capacity constraints could disrupt access to our services, which could materially and adversely affect our business, financial condition and results of operations.
Our service goals of performance, reliability and availability require that we have adequate capacity in our computer systems to cope with the volume of traffic through our mobile entertainment, mobile marketing and mobile money services delivery platform. As our operations grow in size and scope, we will need to improve and upgrade our systems and infrastructure to offer our clients and end users enhanced services, capacity, features and functionality. The expansion of our systems and infrastructure will require us to commit financial, operational and technical resources before the volume of our business rises, with no assurance that our revenues will grow. If our systems cannot be expanded in a timely manner to cope with increased traffic, we could experience disruptions in service, lower client and end user satisfaction and delays in the introduction of new services. Any of these problems could impair our reputation, cause our revenue to decline or otherwise materially and adversely affect our business, financial condition and results of operations.
We may not be able to sustain or improve our reputation, and we may consequently experience difficulty in sustaining or gaining market acceptance.
An important part of our strategy is to continue to establish and reinforce our reputation for consistently offering high-quality services in all our markets and exceeding our clients’ expectations. Maintaining and strengthening our reputation will depend in part upon our success in continuing to offer and deliver high-quality services that are favorably received by our clients and end users, and we cannot assure you that we will be successful in this regard.
Furthermore, continuing to expand internationally presents challenges. With operations in more than 75 different countries, not only are we subject to vastly different regulations restricting the time, manner, place and nature of the advertisements and services we distribute, but also we cater to end users with vastly different sensibilities. The increasingly global nature of the Internet and telecommunications technology and the ease with which digital media may be duplicated and transmitted can make it difficult to ensure that the advertisements and content that we distribute remain within the scope of their intended audience. The transmission of our advertisements or content into regions where, due to its time, manner, place or nature, such dissemination violates local regulations or offends local sensibilities could damage our reputation with our clients, end users, mobile carriers, regulators or other parties and threaten our ability to maintain or grow our end user base.
Additionally, some of our competitors have a stronger reputation in some of the markets in which we operate. Also, a potential market entry by an established, highly visible telecommunications provider or other well-known technology company could overshadow our reputation in the mobile marketing, mobile entertainment and mobile money services markets.
If we fail to strengthen our reputation for providing superior, useful, innovative, easy-to-use and high-quality mobile marketing, mobile entertainment and mobile money services, or if any other factor negatively affects our reputation or our image, such as adverse consumer or regulatory publicity, our business, results of operations or financial condition could be materially and adversely affected.
20
Our agreements with mobile carriers and other clients provide that, in the event of inconsistencies between their reports of receivables and our own, their reports will prevail, which may limit our ability to collect payment of the full amounts we believe to be due to us under such agreements.
Our agreements with mobile carriers, television broadcasters and other clients generally calculate fees payable to us monthly on the basis of the reported volume of revenues generated by the sale of a particular service that is successfully delivered. Although we can independently monitor the level of successful service deliveries from our platform, the terms and conditions of the contracts we have negotiated with these clients effectively require us to rely on them to accurately record sales and the corresponding amount of revenues they owe us. Furthermore, in the case of mobile carriers, our contracts typically stipulate that, with respect to the revenue sharing portions of such agreements, the carriers pay us fees only for those services for which the carrier has successfully been able to collect payment from its subscriber. And since we are unable to monitor the level of customer collections that the mobile carriers have been able to accomplish, in this respect we must rely solely on their reports of “successful deliveries” for which we are entitled to a share in the amount collected.
Under some of our agreements we have the contractual right to request an inspection by an independent auditor of the mobile carriers’ books to verify the information they provide us. However, this inspection process can be expensive and time-consuming and could possibly undermine the relationships we have with these mobile carriers. In addition, there is no assurance that the amounts recovered will cover the costs of undertaking those investigations. Moreover, there may be accounting disputes associated with such investigations which can make resolving any such discrepancies time-consuming and costly. As a result, to date, we have generally relied on the accuracy of reports supplied by mobile carriers as compared with our own records. Historically, from time to time, we have disputed the total amounts due to us from mobile carriers. As a result, and in accordance with IFRS-IASB, our financial statements present revenues net of amounts which we estimate—based on the historical information tracked by our platform—we will not be able to collect from mobile carriers. Nevertheless, mobile carriers may determine that the amounts due to us are lower than what we have estimated, and our ability to collect payment of the full amounts we believe to be due to us may be limited.
Our client contracts lack uniformity and often are complex, which subjects us to business and other risks.
Our clients include a diverse set of some of the largest mobile carriers and media groups, which have substantial purchasing power and negotiating leverage. As a result, we typically negotiate contracts on a client-by-client basis and sometimes accept contract terms not favorable to us in order to close a transaction, including indemnity, limitation of liability, refund, penalty or other terms that could expose us to significant financial or operating risk. If we are unable to effectively negotiate and enforce our contracts with our key clients, our business, financial condition and results of operations may be materially adversely affected.
In addition, we have contractual indemnification obligations to our clients, many of which are unlimited in nature. If we are required to fulfill our indemnification obligations relating to third-party content that we provide to our end users, we intend to seek indemnification from our suppliers, vendors, and content owners to the full extent of their responsibility. Even if the agreement with such supplier, vendor or content owner contains an indemnity provision, it may not cover a particular claim or type of claim, may be limited in amount or scope or may be unenforceable. As a result, we may or may not have sufficient indemnification from third parties to cover fully the amounts or types of claims that might be made against us. Any significant indemnification obligation to our end users could have a material adverse effect on our business, operating results and financial condition.
Several of our larger clients require us to maintain specified levels of service commitments and failure to meet these levels would both adversely impact our client relationships as well as our overall business.
Many of our clients require us to contractually commit to maintain specified levels of service under agreements commonly referred to as service level agreements. In particular, because of the importance that mobile end users in general attach to the reliability of a mobile network, mobile carriers frequently employ rigorous service level requirements. We are a rapidly growing company and, although to date we have not
21
experienced any significant interruption of service, if we are unable to meet our contractually committed service level obligations, we could be subject to civil liability as well as adverse reputational consequences. These, in turn, would materially and adversely affect our business, financial condition and results of operations.
Failure to maintain effective customer care could harm our reputation or decrease market acceptance of our services, which would materially and adversely affect our business, financial condition and results of operations.
Customer care is critical to retain current clients and end users and attract potential clients and end users, and we may not be able to maintain and continuously improve the quality of our customer care to meet expectations. If we fail to provide effective customer care, our clients or end users may be less inclined to use or recommend our services to others and may switch to our competitors’ services. Additionally, in some regions in which we operate, we are subject to consumer rights-related regulations that implicate customer care functions. In these jurisdictions we could be subject to fines or other sanctions if we do not maintain an adequate level of customer care.
Moreover, in several countries where we operate, we outsource customer care functions to contracted third parties. These arrangements can make it more difficult for us to monitor the standard of customer care our clients and end users receive. Unsatisfactory customer care can disrupt our operations, adversely affect the user experience, harm our reputation, cause our clients and end users to stop using our services, result in government penalties and delay market acceptance of our brand and/or the mobile content and other services offered through our platform, any of which could materially and adversely affect our business, financial condition and results of operations.
Finally, the digital services we offer are subject to frequent improvement and updates, and as such, may contain errors or flaws that may only become apparent when the updated service is accessed by end users, particularly as we launch new features and updates under tight time constraints. We rely primarily on our users to inform us of programming flaws affecting their experience, and we are typically able to resolve such flaws promptly. However, if for any reason, programming errors or flaws are not resolved in a timely fashion, we may lose some of our clients or end users, and our reputation, business, results of operations and financial condition could be materially and adversely affected.
Our position as an intermediary in several of our business activities introduces risks associated with third-party actions.
In some of our business activities we act in the capacity of an intermediary, facilitating an interaction between a third party (our client) and a mobile carrier. These arrangements introduce the risk that the third party beyond our control would engage in activities that are inappropriate, illegal, or that would subject us to regulatory penalties or reputational harm. Particularly in our mobile money business, we face the risk that the activities of a third-party client or the nature of that client’s business violate certain regulatory restrictions, which could result in a sanction being imposed upon us, our payment channel being closed down or our relationship with the mobile carrier being terminated. The success of our business in all areas where we act as an intermediary is dependent upon our implementation of measures to prevent, identify and stop problematic third-party activities to ensure that they do not subject us to financial or reputational risks. Failure to do so could have a material adverse effect on our business, results of operations or financial condition.
We cannot assure you that the growth we have experienced recently will continue.
We have achieved rapid growth in a relatively short period of time. Our revenues have increased from €67.8 million in the year ended December 31, 2007 to €233.9 million in the year ended December 31, 2010. The future development and success of our business depend in large part on the future level of demand for mobile marketing, mobile entertainment and mobile money services in general and our services specifically. It is difficult to predict both the future growth of demand and the future size of our client base and end user base in the mobile marketing, mobile entertainment and mobile money markets. Demand for mobile marketing, mobile
22
entertainment and mobile money services in general, or for our services specifically, may fail to grow at anticipated rates. In addition, we may experience decreases in demand for our services due to increased competition from existing competitors or new market entrants. It is possible that we will experience declining rates of revenue growth in the future. If demand for mobile marketing, mobile entertainment and mobile money services generally, or for our services specifically, does not grow as anticipated, or if we lose market share for any reason, our business, results of operations or financial condition would be materially and adversely affected.
Growth and expansion may place significant demands on our resources, systems, internal controls and senior management, which may materially and adversely affect our business, financial condition and results of operations.
Our rapid growth in a relatively short period of time has placed, and may continue to place, significant demands and strains on our resources, systems, internal controls and senior management. Our growth and international expansion, which commenced with the opening of Latin American offices in 2005, has required us to increase the size of our staff, which consisted of approximately 335 full- and part-time employees as of December 31, 2010. We expect to continue to expand our staff, in particular to hire additional managers, service and content developers and sales, marketing and operations personnel at our various regional offices and headquarters in the future. Managing growth will require, among other things:
| | • | | further developing operational, financial, management, legal and information technology systems and controls; |
| | • | | further developing resources, both legal and otherwise, to comply with additional and increasingly complex regulations; |
| | • | | managing relationships with existing and new mobile carriers and other clients; |
| | • | | hiring, training, motivating and retaining qualified personnel; |
| | • | | maintaining quality standards and client and end user satisfaction levels; and |
| | • | | ensuring close and effective coordination among our management, sales, marketing, operations, customer care, finance and accounting personnel in all of the countries in which we operate. |
If we are unable to successfully integrate new personnel or systems, or if we otherwise fail to successfully manage our growth, our business, results of operations or financial condition could be materially and adversely affected.
The global nature of our business and our continued expansion into emerging markets presents business, political, regulatory, operational, financial and economic risks, any of which could increase our costs and hinder our growth.
We are an international business, with approximately 79% of our operations currently concentrated in Latin America, and an important element of our growth strategy is the further expansion of our international sales to new emerging markets, namely in Africa, the Middle East and Asia, which we believe to have growth potential for mobile marketing, mobile entertainment and mobile money services. We expect sales in emerging markets, and particularly Latin America, to continue to be the dominant component of our revenues. Risks affecting our Latin American and other international operations include:
| | • | | multiple, conflicting and changing consumer, tax and other laws and regulations, including complications due to unexpected changes in legal and regulatory requirements; |
| | • | | difficulties stemming from different interpretations of the same law across multiple jurisdictions and adhering to such differing interpretations; |
| | • | | challenges caused by distance, language and cultural differences; |
| | • | | the need to adapt our content for local tastes or the possibility that local end users will demand services that favor our competitors; |
23
| | • | | difficulties incorporating, investing money or receiving the necessary licenses to conduct and sustain business; |
| | • | | difficulties in enforcing our existing intellectual property rights and obtaining all the third-party intellectual property rights that are necessary to offer our services; |
| | • | | difficulties in staffing and managing international operations; |
| | • | | difficulties in ensuring adequate oversight of and regulatory compliance by employees stationed worldwide and in differing political, social and regulatory environments; |
| | • | | difficulties in maintaining a system of effective internal controls and managing the accounting and tax complexities of a growing, worldwide business; |
| | • | | protectionist laws and business practices that favor local businesses, subject foreign companies to a higher level of regulatory scrutiny or restrict the transfer of technology in certain countries; |
| | • | | foreign tax consequences; |
| | • | | foreign exchange controls that might prevent us from paying dividends or repatriating income; |
| | • | | bank regulations that could impact our mobile money business; |
| | • | | imposition of public sector controls; |
| | • | | fluctuations in currency exchange rates; |
| | • | | economic, legal and political instability, including the risk of nationalization of our own or our strategic partners’ assets in certain countries; |
| | • | | higher costs associated with doing business internationally; |
| | • | | tariffs, quotas, taxes and other market barriers; and |
| | • | | longer payment cycles and greater difficulty collecting accounts receivable, particularly in developing countries. |
All of the foregoing risks could harm our international expansion efforts, which could, in turn, materially and adversely affect our business, results of operations or financial condition.
We are subject to multiple, different tax regimes. Maintaining compliance with and keeping up to date with the changes in the tax laws in the various jurisdictions in which we operate can be difficult and costly.
We operate in multiple different countries, and as such we are subject to a multitude of different tax regimes. Maintaining compliance with many different tax laws and keeping current with changes to the tax laws in all the jurisdictions in which we operate demands significant energy and resources. Though we have developed an internal system to identify and adhere to tax regulations across our entire business, we have faced in the past and may in the future face administrative proceedings in connection with discrepancies in our tax returns in certain jurisdictions. See “Business—Legal and Administrative Proceedings.” Failure to maintain compliance with tax laws in any of the jurisdictions in which we operate could result in significant fines or other regulatory action, which could materially and adversely affect our business, results of operations and financial condition.
Our revenues, gross margins or results of operations may fluctuate due to a number of factors, which could materially and adversely affect our business.
Our revenues, gross margins or results of operations may fluctuate unpredictably due to a number of factors, including:
| | • | | changing end user demand; |
| | • | | our ability to successfully develop and commercialize new services; |
24
| | • | | the timing of releases of our new services or those of our competitors; |
| | • | | changes in our pricing policies or those of our competitors; |
| | • | | our failure to create the necessary demand for our services through targeted advertising; |
| | • | | the timing of significant media purchases in connection with advertising campaigns, and the timing of any related revenues generated therefrom, which frequently lags the timing of such campaigns; |
| | • | | the mix of our services sold, the mix of our target end user base and the mix of our sales channels; |
| | • | | changes in the pricing policies of mobile carriers, content owners or others; |
| | • | | the availability and cost of third-party content, which we license or seek to license; |
| | • | | the potential for service obsolescence in the face of rapid technological change; and |
| | • | | fluctuations in the exchange rate between the euro and other currencies. |
Furthermore, given the fixed nature of certain of our operating expenses, a decrease in our revenues for a given year could materially affect our results of operations for that year. In addition, as more competitors enter the mobile marketing, mobile entertainment and mobile money markets, the average selling price of a given service in the corresponding market might decline, thereby decreasing the price that we will be able to charge our clients or end users for our services. Such a decrease in the average selling price of any of our services could cause a decline in our revenues, gross margins or results of operations if we are unable to offset any such price decline with upgrades or new service innovations that could be sold at a higher average selling price. Given the wide range of mobile marketing, mobile entertainment and mobile money services providers in the market, it is crucial that we maintain customer levels by providing a high-quality range of services and managing customer churn, and failure to do so could materially and adversely effect our business, results of operations and financial condition.
Because we may not receive revenue from our clients in the period in which we incur costs associated with generating client agreements, including commercial and production costs associated with client acquisition, our expenses may not increase or decrease in direct proportion to our generation of revenue.
Our expenses may not increase or decrease in direct proportion to our generation of revenue. For example, in some cases we will have incurred significant commercial costs relating to the placement of our advertising on TV, Internet and other media in connection with a client’s campaign and must recognize such costs as expenses in the period when incurred despite the fact that related revenues might be recognized in a subsequent period. Furthermore, these payments, in certain instances, may exceed the amount that we ultimately receive in connection with the particular arrangement, resulting in a net loss with respect to the specific project. Additionally, such up-front payments may have the effect of forcing us to forego certain marketing or other investments that we might otherwise make. If we fail to accurately forecast our expenses or are unable to accurately estimate the revenue-generating potential of specific projects, we could suffer losses that could materially affect our business, operating results and financial condition.
Continuing unfavorable global economic conditions, as well as continuing uncertainties and volatility relating to the Portuguese economy specifically, could have a material adverse effect on our business, results of operations and financial condition.
The crisis in worldwide financial and credit markets has led to a global economic slowdown, with many economies around the world showing significant signs of weakness, which may be exacerbated further by any failure of the U.S. government to raise its debt ceiling. Our services can be viewed as discretionary services, the demand for which is likely to be affected more seriously by economic downturns than that for essential goods and services. If worldwide economies weaken further or fail to improve, our end users may reduce or postpone their spending significantly, and particularly spending on discretionary services, which would materially adversely affect our business, operating results and financial condition.
25
Several credit rating agencies in recent months have downgraded the credit rating of Portuguese government debt, prompting additional investor concerns with respect to macroeconomic issues. Despite our relatively small amount of debt financing to date, we have sourced all of this financing from Portugal, as opposed to from the emerging markets in which we operate where debt financing has historically been more expensive. As of March 31, 2011 we had a total of €7.3 million in cash and cash equivalents and €13.7 million in debt, €8.4 million (or 61.4%) of which was sourced from Portuguese financial institutions. Additionally, for the year ended December 31, 2010, 2.6% of our total revenues was derived from operations in Portugal. On March 23, 2011 the Portuguese Prime Minister, José Sócrates, resigned amid pressures to implement new fiscal austerity measures. Government elections were held on June 5, 2011 and Pedro Passos Coelho of the Social Democratic Party was elected Prime Minister. On April 7, 2011 the Portuguese government requested a bailout package of approximately €115 billion from the European Central Bank. The terms of the bailout remain unclear and it is difficult to form a reasonable estimate concerning the impact these events will have on the Portuguese economy. Were the Portuguese economy to be impacted by a severe economic crisis our ability to borrow from Portuguese banks may be impaired. In addition, our ability to continue to receive grants under the EU programs administered by the Government of Portugal to aid our technology development efforts could be jeopardized, which could materially adversely affect our business, operating results and financial condition. We have been approved for government grants amounting to approximately €0.3 million for current projects, of which amount we have already received approximately €0.2 million; additionally, we have recently preapplied to another grant for approximately €0.6 million, which concession is yet to be decided. Additionally, we have been granted a subsidized low-interest loan in the amount of €4.5 million under the credit line “PME Invest.” Finally, under the program SIFIDE (Tax Incentives for R&D Program) we have been granted an incentive amounting to approximately €1.4 million in connection with the 2006, 2007 and 2008 fiscal years, of which amount €0.1 million has already been deducted from our 2009 income tax return. We have submitted a request for additional incentives of approximately €2.2 million under the SIFIDE program in connection with research and development investments made during 2009 and expect to submit a request for additional tax incentives relating to our 2010 research and development investments. If the Government of Portugal reduces or eliminates research and development-related grants in response to the current challenging economic environment, our financial condition could be adversely affected.
The growth of our business may be adversely affected due to our failure to ensure the security and privacy of confidential user information.
In each of our business activities, a significant barrier to the development of our business is the secure transmission of confidential information over the mobile network. For example, as part of our mobile marketing business, we may collect personal information from end users of our mobile content or targets of marketing campaigns. Additionally, as we grow our mobile money business we are likely to collect large amounts of sensitive personal and financial information from these users. We rely on proprietary encryption and authentication technology standards to provide the security and authentication necessary to effect secure transmission of confidential user information. While we have not experienced any material breach of our security measures to date, there can be no assurance that advances in technology capabilities, new discoveries in the field of cryptography, or other events or developments will not result in a compromise or breach of the algorithms used by us to protect user information. A party who is able to circumvent these security measures could misappropriate proprietary information or cause interruptions in our operations. We may be required to expend significant capital and other resources to protect against such security breaches or to alleviate problems caused by such breaches. Concerns over the security and privacy of user information may inhibit the mobile marketing, mobile entertainment or mobile money business generally, and our mobile services in particular. To the extent that our activities involve the storage and transmission of proprietary information, security breaches could damage our reputation and expose us to a risk of loss or litigation and possible liability. We cannot assure you that our security measures will prevent security breaches, and failure to prevent such security breaches may have a material adverse effect on our business, prospects, financial condition and results of operations.
26
We may fail to effectively identify or execute strategic acquisitions, joint ventures, strategic partnerships or investments, and if we do pursue such transactions we may fail to successfully integrate them, fail to realize their anticipated benefits to our business in a timely manner or discover contingent liabilities of which we were not aware prior to the transaction.
We may selectively pursue opportunities to acquire, form joint ventures with or make investments in businesses, services, technologies or innovations which complement or enhance our business and growth strategy. We may not be able to identify suitable candidates for such acquisitions, joint ventures or investments, or if we do identify suitable candidates, we may not be able to complete any particular transaction on acceptable terms, or at all. Any acquisition, strategic partnership, joint venture or investment we may pursue in the future could entail risks including:
| | • | | difficulties in realizing cost-related, revenue-related or other anticipated benefits from the acquired entity or investment, including the loss of key employees or intellectual property from the acquired entity, joint venture or investment; |
| | • | | costs of executing the acquisition, joint venture or investment, both in terms of capital expenditure and increased management attention; |
| | • | | potential for undermining our growth strategy, our client relationships or other elements critical to the success of our business; |
| | • | | liabilities or losses resulting from our control of the acquired entity, joint venture or investment; and |
| | • | | difficulties in adapting acquired technology to our own systems. |
We may also fail to integrate successfully any acquisition, partnership or investment we may pursue in the future. In addition, although we expect to conduct legal and financial due diligence prior to consummating any acquisition, partnership or investment, the companies we may acquire, and their assets, may have liabilities or be subject to risks of which we do not become aware through our due diligence investigations, and such liabilities and risks may be significant. If we fail to identify, execute or successfully integrate any acquisitions, partnerships or investments into our operations or if we acquire significant liabilities or risks as a result of any acquisitions, partnerships or investments, our business, results of operations or financial condition could be materially and adversely affected.
Mergers or other strategic transactions by our competitors or by mobile carriers could weaken our competitive position or reduce our revenue.
If two or more of our competitors or two or more mobile carriers in our target markets were to merge or partner, the change in the competitive landscape could adversely affect our ability to compete effectively. In addition, consolidation could result in new, larger entrants in the market. For example, in November 2009, Google, Inc. announced that it has entered into a contract to acquire Admob, Inc. Similarly, in January 2010, Apple, Inc. announced that it had acquired Quattro Wireless, Inc. Although neither Admob nor Quattro Wireless directly compete with us, the transactions are indicative of the level of interest among potential acquirers in the mobile industry generally, and in the mobile marketing industry specifically. Our direct competitors may also establish or strengthen cooperative relationships with their mobile carrier partners, sales channel partners or other parties with whom we have strategic relationships, thereby limiting our ability to promote our services. Additionally, mobile carriers themselves in our target markets may merge, which could affect our existing relationships with such carriers and force us to renegotiate cost of service delivery fees with such newly formed entities, which would have greater negotiating leverage. Such entities may also decide to offer services that compete with ours, which could significantly affect our ability to promote and offer our services and could materially affect our financial success in such markets. Disruptions in our business caused by these or similar events could reduce revenue and adversely affect our business, operating results and financial condition.
27
Our business depends on our ability to attract, integrate and retain key managerial, content and service development and sales and marketing personnel.
The success of our business depends upon attracting, integrating and retaining qualified personnel in senior management, content and service development, sales and marketing and operations. Competition for qualified personnel in these fields is intense, and there may be a limited number of persons with the requisite skills to serve in those positions. The loss of any of the members of our senior management, in particular of our CEO, Diogo Salvi, or our Managing Partner, Ricardo Carvalho, or delay in recruiting new members, could materially and adversely affect our business. In addition, if we are unable to retain senior research and development or sales and marketing personnel, or to increase our pool of talented personnel to keep pace with our overall rate of growth, our business, results of operations or financial condition could be materially and adversely affected.
We are exposed to risks associated with operations in multiple currencies.
We prepare our consolidated financial statements in euro. However, we conduct our business in multiple currencies, including the euro, the Brazilian real, several other Latin American currencies and other currencies that pertain to the multiple different countries in which we operate. We currently sell our services in Brazil, in European countries that have adopted the euro and various other countries throughout the rest of the world that use other currencies. In 2010, approximately 12% of our revenue was in euro.
We have several different types of currency risks. First, we face a currency translation risk that arises from the fact that the financial records of our subsidiaries located outside the Eurozone are maintained in currencies other than the euro. Upon preparing consolidated financial statements, our euro-denominated consolidated reported financial results can be affected by changes in the relative value of such currencies against the euro. Moreover, fluctuations in currency values may distort period-to-period comparisons of our financial performance.
In some countries, our revenues are denominated in a different currency than our cost base. In addition, we have currency risks with respect to our operations in certain countries that use currencies that are pegged to the U.S. dollar. We are thus affected by fluctuations in the U.S. dollar/euro exchange rate. Also we face the risk that any one or more of these countries could float its currency, which could cause rapid devaluation of any of our assets denominated in such currency.
Given the volatility of currency exchange rates, we cannot assure you that we will be able to effectively manage our currency risk to minimize its impact on our business. Our exposure to currency transaction and translation risks could in the future have a material adverse effect on our business, results of operations or financial condition.
We may require additional capital in the future, which may not be available to us. Future equity financings to provide this capital may dilute your ownership in us, while future debt financings may impose burdensome terms with which we may not be able to comply or which interfere with our business plan.
Based on our current cash balances and projected revenues, and taking into account the additional capital we expect to receive from this offering, we believe that we will have sufficient capital to execute our near-term business plans and maintain positive cash flow. Nevertheless, in the near term or in the future we may require additional capital, which we may raise through public or private debt or equity financings by issuing additional shares or other preferred financing shares, debt or equity securities convertible into our shares, or rights to acquire these securities. We may need to raise this additional capital in order to:
| | • | | take advantage of growth opportunities; |
| | • | | extend our marketing and sales efforts; |
28
| | • | | upgrade our services or develop new services; or |
| | • | | respond to competitive pressures. |
Any additional capital for these or other purposes raised through the sale of additional shares may dilute your percentage ownership interest in us. Furthermore, if we engage in debt financing, we may be required to accept terms that impose liquidity ratios or restrict our ability to incur future indebtedness.
We may not be able to raise additional capital on terms acceptable to us, or at all. If we cannot raise additional capital when needed, or raise it on commercially reasonable terms, we may not be able to pursue our business plan and achieve our strategic and financial goals.
We rely on connectivity service providers to provide certain critical services to our operations and any disruption in the services provided by these connectivity service providers, including a disruption caused by a deterioration in the relationship between the connectivity service provider and the relevant mobile carrier, or inappropriate activity on the part of the connectivity service provider could have a material adverse effect on our ability to deliver our services to clients and end users.
In certain countries in which we operate where we do not have a direct connection to a mobile carrier, we rely on connectivity service providers to connect the technological platform through which our services are transmitted to mobile carriers for delivery to end users. We rely on connectivity service providers predominantly in countries in which we operate that are located outside of Latin America. The connectivity service providers provide continuous monitoring of the interconnection and are responsible for the correction of any technical failures that may affect the connectivity platform. If our connectivity service providers interrupt or discontinue service and we cannot secure alternative services, or secure them on commercially reasonable terms, we could face a significant interruption in our business, which could have a material adverse effect on our reputation, business, results of operations or financial condition. Additionally, even when our connectivity service providers do not interrupt or discontinue service, we cannot control or anticipate their actions, some of which may be illegal or offend certain of our end users. Though we cannot control or anticipate these activities, they may nevertheless expose us to regulatory sanctions or reputational damage. Finally, any deterioration in the relationship between a connectivity service provider and the mobile carrier to which it provides a connection could result in our losing our connection with such mobile carrier, which could decrease our end user base and have a material adverse affect on our business, results of operations and financial condition.
Risks Relating to our Industry
We operate in a highly dynamic and competitive industry. If we are unable to compete effectively with our existing or any new competitors, our business, results of operations or financial condition could be materially and adversely affected.
The market for mobile marketing, mobile entertainment and mobile money services in each of the geographic markets in which we operate is highly dynamic and competitive, and we expect competition to increase as new companies target these markets in response to the perceived high growth potential of mobile entertainment, mobile marketing and mobile money services in certain markets, such as Latin America, Africa and Asia. We compete principally on the basis of the popularity, effectiveness and impact of our services.
Many of the potential competitors for our services are large, well-known companies with greater financial, technical and human resources than our own and stronger reputations. Companies with more resources and larger research and development expenditures also have a greater ability to pursue research and development and capitalize on potential market opportunities, greater negotiating leverage with mobile carriers and third-party content owners, more resources to fund and integrate acquisitions and greater distribution capability. Our services may also face competition in key markets from service offerings from the mobile carriers themselves, handset manufacturers, content owners and online merchants. In addition, a potential market entry by established global telecom companies, Internet service providers or technology companies would significantly increase
29
competition in the mobile marketing, mobile entertainment and mobile money services markets. Established mobile carriers also may decide to go directly to advertisers, third-party content owners or online merchants to provide to clients and end users the services that we currently offer.
We face different market dynamics and competition across the various markets in which we operate. In some international markets, our competitors have stronger reputations and broader distribution than we have. We may not be as successful as our competitors in generating revenues in international markets due to our inability to provide services that are attractive to the local market, the lack of local reputation or other factors. Developing services that are attractive to end users in other cultures could be expensive. Furthermore, mobile carriers in different markets might alter their pricing structures and terms of service toward certain types of service providers, making it more profitable for some of our competitors to enter these markets. As a result, our international expansion efforts may be more costly and less profitable than we expect.
If we are not as successful as our competitors in our target markets, our sales could decline, our margins could be negatively impacted and we could lose market share, any of which could have a material adverse effect on our business, results of operations or financial condition.
The markets for mobile marketing, mobile entertainment and mobile money services and the mobile phones, which run those services are undergoing rapid innovation and change, which could render our services obsolete and could cause us to incur substantial costs to make changes to our services.
The markets for mobile marketing, mobile entertainment and mobile money services and mobile phones are experiencing rapid innovation and change, with evolving industry standards, frequent new service introductions and changes in the marketing and delivery of mobile entertainment, mobile marketing and mobile money services. Wireless network and mobile phone technologies are undergoing rapid innovation. Technologies such as 4G mobile broadband, Wi-Fi, worldwide interoperability for microwave access, or WiMAX, and voice over Internet protocol, or VOIP, are challenging existing wireless communication technologies. At the same time, new mobile phones with more advanced processors and supporting advanced programming languages continue to be introduced in the market. We have no control over the demand for these services. However, if we fail to anticipate and adapt to these and other technological changes, our market share and our operating results may suffer. Our future success will depend on our ability to adapt to rapidly changing technologies, develop services to accommodate evolving industry standards and improve the performance and reliability of our services. In addition, the widespread adoption of networking or telecommunications technologies or other technological changes could require substantial expenditures to modify, develop or adapt existing services and create new services more quickly. Any failure or delay in anticipating technological advances or developing and marketing new services that respond to any significant change in technology or demand could limit the available channels for our services and limit or reduce our sales. Furthermore, as mobile telephone technology becomes more sophisticated and end users seek more advanced services, we may be required to spend significantly more on in-house content development costs or licensing fees. Any of these developments may have a material adverse effect on our business, results of operations or financial condition.
Our revenues and prospects would be adversely affected if demand for mobile services declines or does not continue to grow.
Our success and future growth depend substantially on the general level of demand for mobile marketing, mobile entertainment and mobile money services. If demand for mobile marketing, mobile entertainment and mobile money services declines or does not continue to grow, our revenues and prospects would be materially and adversely affected. The market for mobile marketing, mobile entertainment and mobile money services is still developing, and it is difficult to predict either the future growth of that market or the size of our future end user base. If the markets for mobile marketing, mobile entertainment and mobile money services fail to develop and grow, if we lose market share, if we are forced to reduce our fees to maintain or increase market share, or if we fail to achieve a market share in any significant jurisdiction or market category, this could have a material adverse effect on our future revenue growth and our business, results of operations or financial condition.
30
If the markets for mobile marketing, mobile entertainment and mobile money services decline or the market share of the mobile carriers with whom we operate declines, our revenue and growth prospects may be adversely affected because we may not have additional services that would generate sufficient revenue to enable us to sustain our business while seeking new markets and applications for our services. If we seek to diversify our service offerings, we may not be successful.
We are subject to distinct regulatory requirements in each of the countries in which we operate, and we may not be able to comply with such requirements, which could expose us to costly penalties and damage our reputation.
We are subject to different time, manner, place and content restrictions in the various regulatory environments in which we operate, compliance with which can be difficult and costly. Even within a single jurisdiction, regulations can differ depending upon the particular media channel being used. For example, we may advertise featured digital content via television, radio broadcast, mobile device or print media channels. Each of these channels could be subject to different regulatory restrictions, depending upon the region. Moreover, each separate country in which we operate may impose different regulatory restrictions on any or all of these media channels. Given our operations in a multitude of different countries, we could face difficulties and increased costs maintaining compliance with numerous different regulatory regimes and tracking the changes in these regimes as they evolve.
Additionally, the increasingly global nature of the Internet and telecommunications technology and the ease with which digital media may be duplicated and transmitted can make it difficult to ensure that the advertisements and content that we distribute remain within the scope of their intended audience. Despite our efforts to comply with local regulatory requirements, our advertisements and content could be transmitted by third parties to locales where such dissemination violates local requirements, and we could face penalties and damage to our reputation. Any such penalties, reputational damage or increased costs associated with maintaining compliance in different regulatory environments could have a material adverse effect on our business, results of operations or financial condition.
We may be affected by data protection laws, laws on unsolicited commercial communications, laws on general terms and conditions, laws on the protection of minors and telecommunication laws, among others.
Our business is subject to governmental regulation, compliance with which can be difficult and costly, and it is possible that we will experience the effects of increased regulation in the future. In Latin America, Europe and other jurisdictions, we face laws and regulations on data protection, unsolicited commercial communications, general terms and conditions, the protection of minors and telecommunications as well as potential restrictions on the transmission of certain kinds of content, which could materially adversely affect our ability to complete, improve, license or distribute our services. Changes in the application or enforcement of these laws or regulations could result in a competitive disadvantage for us and the possible loss of clients, end users and revenue. If we are unable to comply fully with such regulations, we could become subject to substantial fines and exposed to potential liability claims by clients, end users or third parties as well as suspension or termination of our services, which could have a material adverse effect on our reputation, business, results of operations or financial condition.
Moreover, we may also face the risk that, due to the application of regulations in force or of new regulations, we may have to alter the mechanisms in place to ensure that we enter into legally binding contracts with our end users, including minors, and that terms and conditions of our services are known to and accepted by end users, which could have a material adverse effect on our business or results of operations.
Furthermore, in the recent past we have witnessed an increase in regulatory initiatives, particularly among mobile industry organizations, to tighten the rules under which mobile services are offered, including in the area of subscriptions and regulations in how end users accept the general terms and conditions of mobile services.
31
Though these regulatory initiatives have had a positive impact on our business thus far, the costs of compliance with regulations that may be implemented in the future may have a material adverse effect on our results of operations.
Finally, new regulations may affect the speed or ease by which end users may terminate our subscription and other services, which could have a material adverse effect on our business or results of operations.
The complexity and incompatibilities among next-generation mobile phones and wireless technologies may require us to use additional resources for the development of our applications.
We support numerous mobile phone models and technologies in an effort to reach the maximum number of mobile end users. However, keeping pace with the rapid innovations in mobile phone technologies together with the continuous introduction of new, and often incompatible, mobile phone models by mobile carriers requires us to make significant investments in research and development, including personnel, technologies and equipment. In the future, we may be required to make substantial, additional investments in developing mobile marketing, mobile entertainment and mobile money services that are compatible with next-generation mobile phones.
Actual or perceived security vulnerabilities in mobile phones could reduce demand for our services and adversely affect our revenues.
Maintaining the security of mobile phones and wireless networks is critical for our business. There are individuals and groups who develop and deploy viruses, worms and other malicious software programs that may attack wireless networks and mobile phones. Any actual or perceived security threat to mobile phones or any wireless network could lead our existing and potential end users to reduce or refrain from mobile phone usage, reduce or refrain from purchasing our services or seek refunds from mobile carriers or us. Mobile carriers and mobile phone manufacturers may also increase their expenditures on protecting their wireless networks and mobile phone products from attack, which could delay adoption of new mobile phone models, which, in turn, could lead to a decrease in demand for our services. Any of these activities could materially and adversely affect our revenues.
Risks Related to our Common Shares
The interests of our principal shareholders may differ from the interests of our other shareholders.
Upon completion of the offering, our principal shareholders (see “Principal and Selling Shareholders”) will collectively beneficially own approximately 80.4% of our shares (77.8% if the overallotment option is exercised in full). As a result, they will be able to determine substantially all matters requiring approval by a majority of our shareholders, including the declaration of dividends, the election of directors, changes in our issued share capital and the adoption of amendments to our bylaws. Our principal shareholders will also be able to cause or prevent a change in our control. The interests of our principal shareholders may differ significantly from the interests of our other shareholders.
Shareholder rights under Portuguese law may differ materially from shareholder rights in the United States, which could adversely affect our and our shareholders’ ability to protect our and their interests.
Our corporate affairs are governed by our bylaws and by the laws of the Republic of Portugal. The rights of shareholders to take action against the directors, actions by minority shareholders, and the fiduciary responsibilities of our directors to us under Portuguese law are governed by the laws of Portugal. The rights of our shareholders and the fiduciary responsibilities of our directors under Portuguese law in this area are different from those under statutes or judicial precedent in existence in some jurisdictions in the United States. In particular, Portugal has a less well-developed body of judicially interpreted corporate law. Moreover, we could be involved in a corporate combination in which dissenting shareholders would have no rights comparable to appraisal rights which would otherwise ordinarily be available to dissenting shareholders of U.S. corporations. Also, our Portuguese counsel is not aware of any reported class action or derivative action having been brought
32
in a Portuguese court. Such actions are ordinarily available in respect of U.S. corporations in U.S. courts, but shareholders of Portuguese companies may not have standing to initiate shareholder derivative action before the federal courts of the United States. As a result, our public shareholders may find it more difficult to protect their interests in actions against the management, directors or our controlling shareholders than would shareholders of a corporation incorporated in a jurisdiction in the United States, and our ability to protect our interests may be limited if we suffer harm that would otherwise be redressable in a U.S. federal court. In addition, voting procedures also differ between Portuguese and U.S. corporate law, and while we have taken steps consistent with Portuguese legal principles to facilitate the application of customary U.S. voting by beneficial owners in respect of our shares which we believe will be effective, we cannot assure you that these procedures, including those that provide for the pass-through of voting instructions by DTC participants, will be given effect under Portuguese law. See “Description of Share Capital—Corporate Governance.”
Our status as a foreign private issuer exempts us from certain of the corporate governance standards of the NASDAQ Stock Market (“NASDAQ”), limiting the protections afforded to investors.
We are a “foreign private issuer” within the meaning of the NASDAQ corporate governance standards. Under the NASDAQ rules, a foreign private issuer may elect to comply with the practice of its home country and not to comply with certain NASDAQ corporate governance requirements, including the requirements that (i) a majority of the Board of Directors consist of directors that are independent under NASDAQ rules, (ii) nonmanagement directors meet on a regular basis without management present, (iii) a nominating and corporate governance committee be established that is composed entirely of directors that are independent under NASDAQ rules and has a written charter addressing the committee’s purpose and responsibilities, (iv) a compensation committee be established that is composed entirely of directors that are independent under NASDAQ rules and has a written charter addressing the committee’s purpose and responsibilities and (v) an annual performance evaluation of the nominating and corporate governance and compensation committees be undertaken. Although we have a nominating and corporate governance committee and a compensation committee each comprised of directors that are “independent” as such term is defined in the regulations of the Securities and Exchange Commission pursuant to Section 301 of the Sarbanes-Oxley Act, we otherwise intend to use these exemptions. Accordingly, you will not have the same protections afforded to shareholders of companies that are subject to all NASDAQ corporate governance requirements. For a comprehensive discussion of the significant differences between Portuguese corporate governance practices and the NASDAQ Stock Market’s corporate governance standards, please see “Description of Share Capital—Corporate Governance—Summary of Significant Differences Between Portuguese Corporate Governance Practices and the NASDAQ Stock Market’s Corporate Governance Standards.”
Anti-takeover provisions in our charter documents could make an acquisition of us, which may be beneficial to our shareholders, more difficult and may prevent attempts by our shareholders to replace or remove our current management.
Our bylaws include a provision that could make an acquisition of us more difficult, whereby our board of directors has the right to issue shares (preferential or otherwise) without shareholder approval up to the limit of €1,000,000, which could be used to institute a “poison pill” that would work to dilute any potential hostile acquirer’s ownership interest in us, effectively preventing acquisitions that have not been approved by our board of directors.
Your ability to bring an action against us or against our directors and officers, or to enforce a judgment against us or them, will be limited because we are incorporated in the Republic of Portugal, because we do not conduct any of our operations in the United States and because all our directors and officers reside outside of the United States.
We are a company incorporated under the laws of the Republic of Portugal, and substantially all of our assets and all our subsidiaries and affiliates are located outside the United States. In addition, our directors and
33
officers and their assets are located outside the United States. As a result, it may not be possible to effect service of process within the United States upon our directors or officers, including with respect to matters arising under United States federal securities laws or applicable state securities laws.
We have been advised by CCA Advogados, our Portuguese legal advisors, that:
| | • | | the courts of Portugal will not automatically recognize or enforce against us judgments of courts of the United States based on certain civil liability provisions of the securities laws of the United States or any State thereof, and |
| | • | | in original actions brought in Portugal, Portuguese courts are unlikely to impose liabilities against us based on certain of the civil liability provisions of the securities laws of the United States or any state thereof, if and to the extent that such provisions are penal in nature. |
We currently do not intend to pay dividends on our common shares and, as a result, your only opportunity to achieve a return on your investment is if the price of our common shares appreciates.
We have never declared or paid any dividends on our common shares and currently do not expect to declare or pay dividends on our common shares in the foreseeable future. Instead, we anticipate that all of our earnings in the foreseeable future will be used in the operation and growth of our business. Any determination to pay dividends in the future must be proposed by our board of directors and then approved by our shareholders. In addition, (i) our ability to pay dividends on our common shares may be restricted by the terms of any future debt or preferred securities and (ii) our dividends, if distributed, would be paid in euro, creating a risk associated with any fluctuation in the exchange rate between the euro and the U.S. dollar. Accordingly, your only opportunity to achieve a return on your investment in our company may be if the market price of our common shares appreciates and you sell your shares at a profit. The market price for our common shares may never exceed, and may fall below, the price that you pay for such common shares.
If securities or industry analysts do not publish research or reports about our business, if they adversely change their recommendations regarding our common shares, or if our operating results do not meet their expectations, our share price and trading volume could decline.
The trading market for our common shares will be influenced by the research and reports that securities or industry analysts publish about us or our business. We do not have any control over these reports or analysts. If any of the analysts who cover our company downgrade our shares, or if our operating results do not meet the analysts’ expectations, our share price could decline. Moreover, if any of these analysts ceases coverage of our company or fails to publish regular reports on our business, we could lose visibility in the financial markets, which in turn could cause our share price and trading volume to decline.
As a foreign private issuer we are not subject to all of the reporting requirements and other rules applicable to U.S. domestic companies.
We are a “foreign private issuer” as such term is defined in Rule 405 under the Securities Act, and therefore, we are not required to comply with all the periodic disclosure and current reporting requirements of the U.S. Securities Exchange Act of 1934, as amended, and related rules and regulations, most notably those prescribing the content of proxy statements, and our officers, directors and principal shareholders are exempt from the reporting and short-swing profit recovery provisions contained in Section 16 of the Exchange Act, with respect to their purchase and sale of our common shares. In addition, we are not required to file reports and financial statements with the SEC as frequently or promptly as U.S. companies whose securities are registered under the Exchange Act. As such, if we do not voluntarily file reports and financial statements with the SEC as frequently as U.S. companies whose securities are registered under the Exchange Act, it may be more difficult for shareholders and potential investors to gather timely information about us, and it may be more difficult for industry or securities analysts to prepare reports covering our securities as they may not be able to compare our results to those of our competitors on a synchronized basis.
34
Risks Related to this Offering
The shares eligible for future sale after this offering could affect the market price of our shares.
Sales of a substantial number of our shares in the public market following this offering, or the perception that such sales could occur, could adversely affect the market price of our shares or our ability to raise capital through a future public offering of our shares. We have agreed, subject to certain limited exceptions, and our shareholders, executive officers and directors have agreed, that without the prior written consent of the joint global coordinators we will not, for a period of 180 days following the date of this prospectus, issue, offer, transfer, sell, contract to sell or pledge in guarantee of any obligation that may become due prior to the expiration of such period or otherwise dispose of, directly or indirectly, or enter into any transaction which could have an effect similar to the sale or offer of, any of our shares or other security convertible into or exchangeable for our shares or any other securities which may provide the right to subscribe for or purchase our shares, including transactions executed with or through derivatives, or announce publicly our intention to do any of the foregoing. After the expiry of the specified lockup period, such shareholders could sell their holdings of our shares, and we could offer to sell new shares in public or private transactions. Such future sales by us could dilute the ownership interests of our then-existing shareholders, and sales by our shareholders or us could materially and adversely affect the trading price of our shares.
As a new investor, you will experience substantial dilution as a result of this offering.
The public offering price per common share will be substantially higher than the net tangible book value per common share prior to the offering. Consequently, if you purchase common shares in this offering at an assumed public offering price of $13.00, you will incur immediate dilution of $11.39 per common share as of March 31, 2011. For further information regarding the dilution resulting from this offering, please see the section entitled “Dilution.” In addition, you may experience further dilution to the extent that additional shares are issued upon exercise of outstanding options. This dilution is due in large part to the fact that our earlier investors paid substantially less than the assumed initial public offering price when they purchased their common shares. In addition, if the underwriters exercise their overallotment option, you will experience additional dilution.
There is no established trading market for our shares.
This offering constitutes our initial public offering of shares, and no public market for our shares currently exists. We have applied to list our shares on the NASDAQ Stock Market, and we expect our shares to be quoted on the Automated Quotation System of the NASDAQ Stock Market on 2011, subject to completion of customary procedures in the United States. Any delay in the commencement of trading of our shares on the NASDAQ Stock Market would impair the liquidity of the market for our shares and make it more difficult for holders to sell our shares.
If our shares are listed on the NASDAQ Stock Market and quoted on the Automated Quotation System of the NASDAQ Stock Market, there can be no assurance that an active trading market for our shares will develop or be sustained after this offering is completed. The initial offering price has been determined by negotiations among the selling shareholders, the joint global coordinators and us. Among the factors considered in determining the initial offering price were our future prospects and the prospects of our industry in general, our revenue, net income and certain other financial and operating information in recent periods, and the financial ratios, market prices of securities and certain financial and operating information of companies engaged in activities similar to ours. However, there can be no assurance that following this offering our shares will trade at a price equal to or greater than the offering price.
In addition, the market price of our shares may be volatile. Factors such as fluctuations in our results of operations, negative publicity, changes in stock market analyst recommendations regarding us, sectors in which we operate, or the securities market generally and conditions in the financial markets may have a material adverse effect on the market price of our shares. During recent years, securities markets in the United States and
35
worldwide have experienced significant volatility in prices and trading volumes. This volatility could have a material adverse effect on the market price of our shares, irrespective of our results of operations and financial condition.
Our management will have broad discretion over the use and investment of the net proceeds we receive in this offering and might not apply the proceeds in ways that increase the value of your investment.
We have not decided on a specific use for the net proceeds we will receive from this offering. You will not have the opportunity, as part of your investment decision, to assess whether we use the net proceeds appropriately. Our management will have considerable discretion in the application of the net proceeds from this offering and, therefore, you must rely on its judgment. We intend to use the proceeds from this offering to accelerate expansion into new markets, enhance our monetization solutions portfolio through new developments and strengthen our capacity to pursue strategic acquisitions. The net proceeds received by us from this offering may be used in acquisitions or investments that do not produce income or which lose value, or could be applied in other ways that do not improve our operating results or increase the value of your investment in our shares.
If we fail to establish or maintain an effective system of internal controls, we may be unable to accurately report our financial results or prevent fraud, and investor confidence and the market price of our shares may, therefore, be adversely impacted.
We will be subject to reporting obligations under U.S. securities laws. Our reporting obligations as a public company will place a significant strain on our management, operational and financial resources and systems for the foreseeable future. Beginning with our annual report on Form 20-F for the fiscal year ending December 31, 2012, we will be required to perform system and process evaluation and testing of our internal controls over financial reporting to allow management and our independent registered public accounting firm to report on the effectiveness of our internal controls over financial reporting as required by Section 404 of the Sarbanes-Oxley Act.
Prior to this offering, we have been a private company with a limited number of accounting personnel and other resources with which to address our internal controls and procedures. At the same time, we have grown significantly in recent years. In connection with the offering, we have been implementing a number of measures to improve our internal control over financing reporting in order to obtain reasonable assurance regarding the reliability of our financial statements. Though we have not yet fully implemented a system of internal controls over financial reporting that complies with the requirements of Section 404 of the Sarbanes-Oxley Act, as of December 31, 2010 we had not, using our current procedures, identified any material weaknesses or significant deficiencies relating to our internal controls over financial reporting. We do not currently have an internal audit function.
We will continue to implement measures to improve our internal controls over financial reporting to meet the deadline imposed by Section 404 of the Sarbanes-Oxley Act. If we fail to timely implement, and maintain the adequacy of, our internal controls, we may not be able to conclude that we have effective internal control over financial reporting. Moreover, effective internal control over financial reporting is necessary for us to produce reliable financial reports and is important to help prevent fraud. As a result, our failure to achieve and maintain effective internal control over financial reporting could result in the loss of investor confidence in the reliability of our financial statements, which in turn could harm our business and negatively impact the market price of our common shares. Furthermore, we anticipate that we will incur considerable costs and use significant management time and other resources in an effort to comply with Section 404 of the Sarbanes-Oxley Act.
36
We will incur significant increased costs as a result of operating as a company whose shares are publicly traded in the U.S., and our management will be required to devote substantial time to new compliance initiatives.
As a company whose shares will be publicly traded in the U.S., we will incur significant legal, accounting and other expenses that we did not previously incur. In addition, the Sarbanes-Oxley Act of 2002, or Sarbanes-Oxley Act, and the rules of the SEC and The NASDAQ Stock Market, have imposed various requirements on public companies including requiring establishment and maintenance of effective disclosure and financial controls. Our management and other personnel will need to devote a substantial amount of time to these compliance initiatives. Moreover, these rules and regulations will increase our legal and financial compliance costs and will make some activities more time-consuming and costly. For example, we expect these rules and regulations to make it more difficult and more expensive for us to obtain director and officer liability insurance, and we may be required to incur substantial costs to maintain the same or similar coverage.
We may be classified as a passive foreign investment company for U.S. federal income tax purposes, which could result in adverse U.S. federal income tax consequences to U.S. holders of our common shares.
Based on the expected composition of our income and assets and the value of our assets (including the value of our goodwill, determined, in part, on the expected price of common shares in this offering), we do not expect to be a passive foreign investment company, or PFIC, for U.S. federal income tax purposes for our current taxable year or in the foreseeable future. However, because we expect to have a significant amount of passive assets following the offering, and because PFIC status is determined annually after the end of each taxable year and will depend on the composition of our income and assets and the market value of our assets (which may depend, in part, on the price of our common shares, which could change significantly) from time to time, there can be no assurance that we will not be a PFIC for any taxable year. In general, a non-U.S. corporation will be considered a PFIC for any taxable year in which either (i) 75% or more of its gross income consists of passive income or (ii) 50% or more of the average quarterly value of its assets consists of assets that produce, or are held for the production of, passive income.
If we were to be or become a PFIC, a U.S. Holder (as defined in “Taxation”) would generally be subject to imputed interest charges, characterization of a portion of any gain from the sale or exchange of our common shares as ordinary income, and other disadvantageous tax treatment with respect to our common shares. You are urged to consult your tax advisor concerning the U.S. federal income tax consequences of acquiring, holding and disposing of common shares if we are or become a PFIC. For more information, see “Taxation—Capital Gains—U.S. Federal Income Taxation—Passive Foreign Investment Company Rules.”
37
PRESENTATION OF FINANCIAL AND OTHER INFORMATION
This prospectus translates certain euro amounts into U.S. dollars at specified rates solely for the convenience of the reader. Unless otherwise indicated, such euro amounts have been translated at the rate of $1.4183 per €1.00, which corresponds to the noon buying rate for the euro calculated on March 31, 2011. The “noon buying rate” is the noon buying rate in New York City for cable transfers in foreign currencies as certified for customs purposes by the Federal Reserve Bank of New York. No representation is made that euro could have been, or could be, converted into U.S. dollars at that rate or any other rate. See “Exchange Rates” for information regarding exchange rates for the euro since 2006.
Financial Statements
Our consolidated financial statements at December 31, 2010 and 2009 and for each of the years ended December 31, 2010, 2009 and 2008 have been audited, as stated in the report appearing herein, and are included in this prospectus and referred to as our audited consolidated financial statements. We have prepared these financial statements and other financial data included herein in accordance with IFRS-IASB.
Market Share and Other Information
We obtained the market data, including market forecasts, used throughout this prospectus from market research, publicly available information and industry publications. We have presented this data on the basis of information from third-party sources that we believe are reliable, including, among others, Analysys Mason, Pyramid Research and the Economist Intelligence Unit. In many countries in which we operate, we are not aware of available public information concerning our and our competitors’ market positions. Therefore, in order to ascertain our market position, we rely on the feedback of our regional managers in these countries who, in the ordinary course of business, gather market and competitive positioning information from mobile carriers in their regions. Statements we make in this prospectus concerning our market position are not based on independent public data and are instead based such feedback we receive from our regional managers and the information our regional managers receive from local mobile carriers, which we believe is reliable because our competitors’ businesses, like ours, use mobile carriers’ networks and we believe that mobile carriers are well-positioned to evaluate our position in our markets.
Trademarks
We have proprietary rights to trademarks used in this prospectus, which are important to our business. We have omitted the “®” and “™” designations for certain trademarks, but nonetheless reserve all rights to them. Each trademark, trade name or service mark of any other company appearing in this prospectus belongs to its respective holder.
Glossary
In this prospectus, unless the context otherwise requires, the terms:
| | • | | “client” refers to any carrier, media company, government or brand owner to whom we offer our solutions; |
| | • | | “end user” refers to any mobile telephone user who maintains a subscription or prepaid arrangement with any mobile carrier to whom our platform is connected, and who consequently uses or could use our platform to access our mobile entertainment or mobile payment services and/or could be targeted in connection with our mobile marketing activities; end users who maintain more than a single arrangement with a carrier are counted as end users in respect of each such arrangement; |
38
| | • | | “mobile entertainment subscriber” refers to an end user who has subscribed for our services and has not cancelled or been deactivated by us or the relevant mobile carrier prior to year-end; subscribers are generally deactivated if they fail to pay amounts owed or do not use services for a prescribed period, which varies based on the mobile carrier and jurisdiction involved; and |
| | • | | “subscriber” refers generally to any mobile telephone user who maintains a subscription or prepaid arrangement with any mobile carrier, whether or not our platform is connected with such mobile carrier. Mobile telephone users who maintain more than a single arrangement with a carrier are counted as subscribers in respect of each such arrangement. |
39
FORWARD-LOOKING STATEMENTS
This prospectus contains estimates and forward-looking statements, principally in “Risk Factors,” “Management’s Discussion and Analysis of Financial Condition and Results of Operations” and “Business.” Some of the matters discussed concerning our operations and financial performance include estimates and forward-looking statements within the meaning of the Securities Act and the U.S. Securities Exchange Act of 1934, as amended, or the Exchange Act.
These forward-looking statements are subject to known and unknown risks, uncertainties, assumptions and other factors that could cause our actual results of operations, financial condition, liquidity, performance, prospects, opportunities, achievements or industry results, as well as those of the markets we serve or intend to serve, to differ materially from those expressed in, or suggested by, these forward-looking statements. These forward-looking statements are based on assumptions regarding our present and future business strategies and the environment in which we expect to operate in the future. Important factors that could cause those differences include, but are not limited to:
| | • | | the state of our relationships with mobile carriers; |
| | • | | our operations in Brazil; |
| | • | | our use of a single, leased datacenter; |
| | • | | the fluctuation of our quarterly results; |
| | • | | the growth of the market for mobile services in the regions in which we operate; |
| | • | | the success of our advertising efforts; |
| | • | | the impact of increased adoption of smartphones in our markets; |
| | • | | our success in protecting and enforcing our intellectual property rights and avoiding infringement of the intellectual property of others; |
| | • | | the global nature of our operations and the impact of changes in economic conditions in the markets in which we operate and worldwide; and |
| | • | | intense competition in the markets in which we operate. |
Additional factors that could cause actual results, financial condition, liquidity, performance, prospects, opportunities, achievements or industry results to differ materially include, but are not limited to, those discussed under “Risk Factors.” Additional risks that we may currently deem immaterial or that are not presently known to us could also cause the forward-looking events discussed in this prospectus not to occur. The words “believe,” “may,” “will,” “estimate,” “continue,” “anticipate,” “intend,” “expect” and similar words are intended to identify estimates and forward-looking statements. Estimates and forward-looking statements speak only at the date they were made, and we undertake no obligation to update or to review any estimate and/or forward-looking statement because of new information, future events or other factors. Estimates and forward-looking statements involve risks and uncertainties and are not guarantees of future performance. Our future results may differ materially from those expressed in these estimates and forward-looking statements. In light of the risks and uncertainties described above, the estimates and forward-looking statements discussed in this prospectus might not occur and our future results and our performance may differ materially from those expressed in these forward-looking statements due to, inclusive, but not limited to, the factors mentioned above. Because of these uncertainties, you should not make any investment decision based on these estimates and forward-looking statements.
40
USE OF PROCEEDS
We expect to receive total estimated net proceeds from this offering of approximately $77.9 million, based on the midpoint of the range set forth on the cover page of this prospectus, or $88.1 million if the underwriters exercise the overallotment option in full, in each case after deducting estimated underwriting discounts and estimated expenses of the offering payable by us. The estimated expenses of the offering payable by us include an aggregate amount of approximately €4.4 million to be paid to approximately 10 directors, executive officers and other employees in connection with the completion of this offering and are set forth under “Expenses of the Offering.” Each $1.00 increase (decrease) in the public offering price per common share would increase (decrease) our net proceeds, after deducting estimated underwriting discounts and expenses, by approximately $7.0 million (assuming no exercise of the overallotment option by the underwriters). We will not receive any proceeds from the sale of common shares by the selling shareholders.
We intend to put the net proceeds of this offering received by us to three principal uses. We intend to devote approximately 80% of the net proceeds of the offering toward (i) accelerating the expansion of our global footprint to include new markets which we believe offer significant opportunities for growth, such as Africa and Asia; and (ii) capitalizing upon market opportunities to acquire or partner with firms with strategically important technology or market positions in mobile marketing and/or mobile money segments, although we do not have commitments for any specific acquisitions at this time. We intend to devote the balance of the net proceeds of the offering toward enhancing our monetization solutions portfolio by incorporating new technologies into our platform and exploring new service offerings. The amount of net proceeds devoted to the foregoing uses may vary from these amounts, and we may devote some or all of the net proceeds of the offering to other uses as a result of changing business conditions or other developments subsequent to the offering. See “Risk Factors—Our management will have broad discretion over the use and investment of the net proceeds we receive in this offering and might not apply the proceeds in ways that increase the value of your investment.”
See “Capitalization” for information on the impact of the net proceeds of this offering on our financial condition.
41
CAPITALIZATION
The following table presents our consolidated capitalization at March 31, 2011:
| | • | | on an actual basis derived from our audited consolidated financial statements prepared in accordance with IFRS-IASB; and |
| | • | | on an as adjusted basis to give effect to the sale by us of 7,500,000 common shares in this offering at an offering price of $13.00 per common share (the midpoint of the range set forth on the cover page of this prospectus), after deduction of the underwriting discount and estimated offering expenses payable by us in connection with the offering and assuming no exercise of the overallotment by the underwriters. We have shown the net proceeds of the offering in the line items cash and cash equivalents and total equity pending the application of such proceeds by us. |
You should read this table in conjunction with our financial statements and the related notes and with the sections entitled “Selected Financial and Operating Data” and “Management’s Discussion and Analysis of Financial Condition and Results of Operations” included in this prospectus.
| | | | | | | | |
| | | As of March 31, 2011 | |
| | | Actual | | | As Adjusted(1) | |
| | | (in thousands) | |
Cash and cash equivalents | | € | 7,297 | | | € | 62,225 | |
| | | | | | | | |
Debt, current | | | 4,332 | | | | 4,332 | |
| | | | | | | | |
Debt, non current(2) | | | 9,392 | | | | 9,392 | |
Total equity | | | 19,524 | | | | 74,451 | |
| | | | | | | | |
Total capitalization | | € | 28,916 | | | € | 83,843 | |
| | | | | | | | |
| (1) | Based on the midpoint of the range set forth on the cover of this prospectus and translated into euro at the rate of $1.4183 per €1.00, the noon buying rate for the euro on March 31, 2011. |
| (2) | As of March 31, 2011, all of our non current debt was unsecured. |
42
DILUTION
At March 31, 2011, we had a net tangible book value of €10.4 million ($14.8 million) and a net tangible book value of €0.21 ($0.30) per common share at that date. Net tangible book value represents the amount of our total tangible assets less our total liabilities, and net tangible book value per common share represents net tangible book value divided by 50,000,000, the total number of our common shares outstanding immediately prior to the offering.
After giving effect to the issuance and sale by us of 7,500,000 common shares in the offering, and (1) considering an offering price of $13.00 per common share (based on the midpoint of the range set forth on the cover of this prospectus) and (2) assuming the underwriters have not exercised the overallotment option, and after deducting the estimated underwriting discounts and estimated offering expenses payable by us, our as adjusted net tangible book value would have been approximately €65.4 million ($92.7 million), representing €1.14 per share or $1.61 per common share as of March 31, 2011. This represents an immediate increase in net tangible book value of €0.93 per share or $1.32 per common share to existing shareholders and an immediate dilution in net tangible book value of €8.03 per share or $11.39 per common share to new investors purchasing common shares in this offering. Dilution for this purpose represents the difference between the price per common share paid by these purchasers and net tangible book value per common share immediately after the completion of the offering.
The following table presents this dilution to new investors purchasing common shares in the offering:
| | | | |
| | | As of March 31, 2011(1) | |
| | | (per common share)
(in €) | |
Initial public offering price | | | 9.17 | |
Net tangible book value at March 31, 2011 | | | 0.21 | |
Increase in net tangible book value attributable to new investors | | | 0.93 | |
As adjusted net tangible book value immediately after the offering | | | 1.14 | |
Dilution to new investors | | | 8.03 | |
| (1) | Based on the midpoint of the range set forth on the cover of this prospectus and translated into euro at the rate of $1.4183 per €1.00, the noon buying rate for the euro on March 31, 2011. |
Each $1.00 increase (decrease) in the offering price per common share, respectively, would increase (decrease) the net tangible book value after the offering by €0.09 per common share or $0.12 per common share assuming no exercise of the overallotment option granted to the underwriters and the dilution to investors in the offering by €0.62 per common share or $0.88 per common share.
We used an exchange rate of $1.4183 per €1.00, the noon buying rate for the euro on March 31, 2011, for purposes of the U.S. dollar calculations in this dilution discussion.
43
EXCHANGE RATES
The following table sets forth, for the periods indicated, information concerning the noon buying rate for euro, expressed in U.S. dollars per €1.00. The rates set forth below are provided solely for your convenience and are not used by us in the preparation of our consolidated financial statements included elsewhere in this prospectus. The “noon buying rate” is the noon buying rate in New York City for cable transfers in foreign currencies as certified for customs purposes by the Federal Reserve Bank of New York. No representation is made that euro could have been, or could be, converted into U.S. dollars at that rate or at any other rate. The noon buying rate on July 22, 2011 was $1.4366 per €1.00.
| | | | | | | | | | | | | | | | |
| | | Noon Buying Rate | |
| | | Period End | | | Average(1) | | | High | | | Low | |
Year: | | | | | | | | | | | | | | | | |
2006 | | | 1.3197 | | | | 1.2661 | | | | 1.3327 | | | | 1.1860 | |
2007 | | | 1.4603 | | | | 1.3793 | | | | 1.4862 | | | | 1.2904 | |
2008 | | | 1.3919 | | | | 1.4695 | | | | 1.6010 | | | | 1.2446 | |
2009 | | | 1.4332 | | | | 1.3955 | | | | 1.5100 | | | | 1.2547 | |
2010 | | | 1.3269 | | | | 1.3218 | | | | 1.4536 | | | | 1.1959 | |
| | | | |
Month: | | | | | | | | | | | | | | | | |
January 2011 | | | 1.3715 | | | | 1.3371 | | | | 1.3715 | | | | 1.2944 | |
February 2011 | | | 1.3793 | | | | 1.3656 | | | | 1.3794 | | | | 1.3474 | |
March 2011 | | | 1.4183 | | | | 1.4020 | | | | 1.4212 | | | | 1.3813 | |
April 2011 | | | 1.4821 | | | | 1.4460 | | | | 1.4821 | | | | 1.4211 | |
May 2011 | | | 1.4604 | | | | 1.4335 | | | | 1.4875 | | | | 1.4426 | |
June 2011 | | | 1.4523 | | | | 1.4403 | | | | 1.4675 | | | | 1.4155 | |
July 2011 (through July 22) | | | 1.4366 | | | | 1.4239 | | | | 1.4508 | | | | 1.4104 | |
| (1) | The average of the noon buying rate for euro on the last day of each full month during the relevant year or each business day during the relevant month. |
44
SELECTED FINANCIAL AND OPERATING DATA
The following financial data of TIMWE at March 31, 2011 and for the three months ended March 31, 2011 and March 31, 2010 and at December 31, 2010 and 2009 and for the years ended December 31, 2010, 2009 and 2008 have been derived from the consolidated financial statements prepared in accordance with IFRS-IASB. The financial data of TIMWE at December 31, 2007 and 2006 and for the years ended December 31, 2007 and 2006 have been prepared in accordance with IFRS-IASB, using as a basis our consolidated financial statements prepared in accordance with IFRS as adopted by the European Union (or “EU-IFRS”) for those years, which are not included herein. There are no differences, applicable to TIMWE, between IFRS-IASB and EU-IFRS for any of the periods presented. Our historical results are not necessarily indicative of results to be expected for future periods.
This financial data should be read in conjunction with our audited consolidated financial statements and the related notes and “Management’s Discussion and Analysis of Financial Condition and Results of Operations” included in this prospectus.
| | | | | | | | | | | | | | | | | | | | | | | | | | | | | | | | | | | | |
| | | Three Months Ended
March 31, | | | Year Ended December 31, | |
| | | 2011(1) | | | 2011 | | | 2010 | | | 2010(1) | | | 2010 | | | 2009 | | | 2008 | | | 2007 | | | 2006 | |
| | | (in thousands, except share and per share data) | |
| Income Statement Data | | | | |
Revenues | | $ | 67,205 | | | € | 47,384 | | | € | 34,600 | | | $ | 331,671 | | | € | 233,851 | | | € | 166,241 | | | € | 125,339 | | | € | 67,813 | | | € | 43,548 | |
Operating Expenses: | | | | | | | | | | | | | | | | | | | | | | | | | | | | | | | | | | | | |
Cost of service delivery | | | 34,202 | | | | 24,115 | | | | 18,798 | | | | 166,392 | | | | 117,318 | | | | 97,056 | | | | 65,059 | | | | 32,118 | | | | 15,660 | |
Commercial and production costs | | | 22,999 | | | | 16,216 | | | | 10,237 | | | | 107,826 | | | | 76,025 | | | | 37,130 | | | | 35,292 | | | | 21,511 | | | | 19,918 | |
Personnel costs | | | 4,059 | | | | 2,862 | | | | 2,269 | | | | 13,594 | | | | 9,585 | | | | 8,758 | | | | 6,519 | | | | 4,430 | | | | 1,435 | |
General and administrative | | | 2,926 | | | | 2,063 | | | | 1,631 | | | | 10,674 | | | | 7,526 | | | | 6,980 | | | | 6,162 | | | | 3,258 | | | | 1,791 | |
Tax expenses | | | 472 | | | | 333 | | | | 445 | | | | 4,628 | | | | 3,263 | | | | 2,306 | | | | 2,150 | | | | 420 | | | | 93 | |
Amortization and depreciation | | | 1,879 | | | | 1,325 | | | | 932 | | | | 5,992 | | | | 4,225 | | | | 2,490 | | | | 1,605 | | | | 517 | | | | 129 | |
Provisions expense | | | 129 | | | | 91 | | | | 46 | | | | 835 | | | | 589 | | | | 405 | | | | 116 | | | | 853 | | | | 20 | |
| | | | | | | | | | | | | | | | | | | | | | | | | | | | | | | | | | | | |
Total operating expense | | | 66,667 | | | | 47,005 | | | | 34,358 | | | | 309,943 | | | | 218,531 | | | | 155,125 | | | | 116,903 | | | | 63,107 | | | | 39,046 | |
| | | | | | | | | | | | | | | | | | | | | | | | | | | | | | | | | | | | |
Operating profit | | | 538 | | | | 379 | | | | 242 | | | | 21,728 | | | | 15,320 | | | | 11,116 | | | | 8,436 | | | | 4,706 | | | | 4,502 | |
| | | | | | | | | | | | | | | | | | | | | | | | | | | | | | | | | | | | |
Finance income | | | 153 | | | | 108 | | | | 314 | | | | 2,340 | | | | 1,650 | | | | 139 | | | | 570 | | | | 511 | | | | 484 | |
Finance costs | | | (600 | ) | | | (423 | ) | | | (440 | ) | | | (3,654 | ) | | | (2,576 | ) | | | (2,415 | ) | | | (1,500 | ) | | | (687 | ) | | | (618 | ) |
| | | | | | | | | | | | | | | | | | | | | | | | | | | | | | | | | | | | |
Net finance income (costs) | | | (447 | ) | | | (315 | ) | | | (126 | ) | | | (1,313 | ) | | | (926 | ) | | | (2,276 | ) | | | (930 | ) | | | (176 | ) | | | (134 | ) |
| | | | | | | | | | | | | | | | | | | | | | | | | | | | | | | | | | | | |
Profit before income taxes | | | 91 | | | | 64 | | | | 116 | | | | 20,415 | | | | 14,394 | | | | 8,840 | | | | 7,506 | | | | 4,530 | | | | 4,368 | |
| | | | | | | | | | | | | | | | | | | | | | | | | | | | | | | | | | | | |
Income tax expenses | | | (254 | ) | | | (179 | ) | | | 25 | | | | 4,807 | | | | 3,389 | | | | 1,676 | | | | 2,119 | | | | 1,973 | | | | 1,691 | |
| | | | | | | | | | | | | | | | | | | | | | | | | | | | | | | | | | | | |
Net income | | | 345 | | | | 243 | | | | 91 | | | | 15,608 | | | | 11,005 | | | | 7,164 | | | | 5,387 | | | | 2,557 | | | | 2,677 | |
| | | | | | | | | | | | | | | | | | | | | | | | | | | | | | | | | | | | |
Profit attributable to non-controlling interests | | | (31 | ) | | | (22 | ) | | | (120 | ) | | | 1,513 | | | | 1,067 | | | | 930 | | | | (26 | ) | | | 46 | | | | 50 | |
| | | | | | | | | | | | | | | | | | | | | | | | | | | | | | | | | | | | |
Profit attributable to controlling interests | | $ | 376 | | | € | 265 | | | € | 211 | | | $ | 14,095 | | | € | 9,938 | | | € | 6,234 | | | € | 5,413 | | | € | 2,511 | | | € | 2,627 | |
| | | | | | | | | | | | | | | | | | | | | | | | | | | | | | | | | | | | |
Earnings per share (basic and diluted) | | | — | | | | — | | | | — | | | $ | 0.17 | | | € | 0.12 | | | € | 0.08 | | | € | 0.07 | | | € | 0.03 | | | € | 0.03 | |
| | | | | | | | | | | | | | | | | | | | | | | | | | | | | | | | | | | | |
Weighted average shares used to compute earnings per share | | | 65,319 | | | | 65,319 | | | | 82,917 | | | | 82,917 | | | | 82,917 | | | | 82,917 | | | | 82,917 | | | | 83,333 | | | | 83,333 | |
| | | | | | | | | | | | | | | | | | | | | | | | | | | | | | | | | | | | |
45
| | | | | | | | | | | | | | | | | | | | | | | | | | | | | | | | |
| | | At March 31, | | | At December 31, | |
| | | 2011
(Pro Forma)(2) | | | 2011(1) | | | 2011 | | | 2010 | | | 2009 | | | 2008 | | | 2007 | | | 2006 | |
| | | (in thousands, except share and per share data) | |
| Balance Sheet Data | | | | |
Cash and cash equivalents | | € | 62,225 | | | $ | 10,349 | | | € | 7,297 | | | € | 8,610 | | | € | 5,667 | | | € | 4,456 | | | € | 3,886 | | | € | 2,671 | |
Net working capital(3) | | | 70,738 | | | | 22,423 | | | | 15,811 | | | | 19,032 | | | | 11,284 | | | | 14,222 | | | | 5,725 | | | | 4,039 | |
Total assets | | | 115,080 | | | | 85,186 | | | | 60,153 | | | | 59,576 | | | | 46,738 | | | | 40,049 | | | | 24,000 | | | | 14,074 | |
Total liabilities | | | 40,630 | | | | 57,308 | | | | 40,630 | | | | 35,564 | | | | 32,729 | | | | 31,684 | | | | 16,923 | | | | 9,005 | |
Total debt | | | 13,724 | | | | 19,465 | | | | 13,724 | | | | 9,835 | | | | 10,204 | | | | 15,973 | | | | 4,329 | | | | 1,117 | |
Total stockholders’ equity | | | 74,451 | | | | 27,689 | | | | 19,524 | | | | 24,012 | | | | 14,009 | | | | 8,366 | | | | 7,078 | | | | 5,068 | |
| | | | | | | | | | | | | | | | | | | | | | | | |
| | | Three Months Ended
March 31, | | | Year Ended December 31, | |
| | | 2011 | | | 2010 | | | 2010 | | | 2009 | | | 2008 | | | 2007 | |
| Other Operating Data | | | | | | | | | | | | | | | | | | | | | | | | |
Mobile Marketing | | | | | | | | | | | | | | | | | | | | | | | | |
Number of mobile marketing campaigns | | | 30 | | | | 28 | | | | 93 | | | | 115 | | | | 51 | | | | — | |
Average revenue per campaign (€ thousands) | | | 420.6 | | | | 134.8 | | | | 1,089.5 | | | | 470.9 | | | | 741.8 | | | | — | |
Mobile Entertainment | | | | | | | | | | | | | | | | | | | | | | | | |
Number of mobile entertainment subscribers (4)(thousands) | | | 18,190 | | | | 18,765 | | | | 19,334 | | | | 19,175 | | | | 11,675 | | | | — | |
Average revenue per mobile entertainment subscriber (monthly)(€) | | | 0.48 | | | | 0.48 | | | | 0.48 | | | | 0.45 | | | | 0.61 | | | | — | |
Mobile Money | | | | | | | | | | | | | | | | | | | | | | | | |
Number of mobile money clients (5)(6) | | | 49 | | | | 30 | | | | 44 | | | | 19 | | | | 1 | | | | — | |
Average revenue per client (monthly)(€ thousands) | | | 45.0 | | | | 32.2 | | | | 31.0 | | | | 20.0 | | | | 19.4 | | | | — | |
| |
| | | (in thousands) | |
Total revenues | | € | 47,384 | | | € | 34,600 | | | € | 233,851 | | | € | 166,241 | | | € | 125,339 | | | € | 67,813 | |
Mobile marketing revenues | | | 13,499 | | | | 3,774 | | | | 101,320 | | | | 54,154 | | | | 37,832 | | | | — | |
Mobile entertainment revenues | | | 27,264 | | | | 27,931 | | | | 116,185 | | | | 107,534 | | | | 87,274 | | | | 67,813 | |
Mobile money revenues | | | 6,621 | | | | 2,895 | | | | 16,346 | | | | 4,552 | | | | 233 | | | | — | |
Adjusted EBITDA(7) | | | 2,128 | | | | 1,665 | | | | 23,397 | | | | 16,317 | | | | 12,307 | | | | 6,496 | |
Net income | | | 243 | | | | 91 | | | | 11,005 | | | | 7,164 | | | | 5,387 | | | | 2,557 | |
| (1) | Certain euro amounts are translated into U.S. dollars at specified rates solely for the convenience of the reader. Unless otherwise indicated, such euro amounts have been translated at the rate of $1.4183 per €1.00, which corresponds to the noon buying rate for the euro calculated on March 31, 2011. |
| (2) | Pro forma reflects the issuance by us of 7,500,000 common shares at an offering price of $13.00 per share, the midpoint of the range set forth on the cover page of this prospectus, after deducting estimated underwriting discounts and estimated expenses for the offering payable by us, translated into euro at $1.4183 per €1.00, the noon buying rate on March 31, 2011. |
| (3) | Calculated as total current assets, which includes inventories, trade receivables, other receivables, current tax assets, other public entities, cash and cash equivalents and assets as held for sale; less total current liabilities, which includes loans and borrowings, financial lease obligations, suppliers and other current liabilities, current tax liabilities and other public entities. |
| (5) | Represents the number of clients with whom mobile money contracts have been signed. |
| (7) | We define Adjusted EBITDA as net income plus income tax expenses, finance costs, finance income, provisions expense, amortization and depreciation and tax expenses. Please see “—Adjusted EBITDA” for more information and for a reconciliation of Adjusted EBITDA to our net income calculated in accordance IFRS-IASB. |
Adjusted EBITDA
We include Adjusted EBITDA in this prospectus because (i) we seek to manage our business to a consistent level of Adjusted EBITDA as a percentage of total revenue, (ii) it is a key basis upon which our management assesses our operating performance, (iii) it is one of the primary metrics investors use in evaluating technology companies, and (iv) it is a factor in the evaluation of the performance of our management in determining
46
compensation. We define Adjusted EBITDA as net income plus income tax expenses, finance costs, finance income, provisions expense, amortization and depreciation and tax expenses.
We use Adjusted EBITDA as a key performance measure because we believe it facilitates operating performance comparisons from period to period by excluding potential differences caused by variations in capital structures (affecting interest expense), tax positions (such as the impact on periods or subsidiaries of changes in effective tax rates or fluctuations in permanent differences or discrete quarterly items) and the impact of depreciation and amortization expense on definite-lived intangible assets. Because Adjusted EBITDA facilitates internal comparisons of our historical operating performance on a more consistent basis, we also use Adjusted EBITDA for business planning purposes, to incentivize and compensate our management personnel and in evaluating acquisition opportunities.
In addition, we believe Adjusted EBITDA and similar measures are widely used by investors, securities analysts, ratings agencies and other interested parties in our industry as a measure of financial performance and debt-service capabilities. Our use of Adjusted EBITDA has limitations as an analytical tool, and you should not consider it in isolation from, or as a substitute for, analysis of our results as reported under IFRS-IASB. Some of these limitations are:
| | • | | Adjusted EBITDA does not reflect our cash expenditures for capital equipment or other contractual commitments; |
| | • | | although depreciation and amortization are non-cash charges, the assets being depreciated and amortized may have to be replaced in the future, and Adjusted EBITDA does not reflect cash capital expenditure requirements for such replacements; |
| | • | | Adjusted EBITDA does not reflect changes in, or cash requirements for, our working capital needs; |
| | • | | Adjusted EBITDA does not consider the potentially dilutive impact of issuing equity-based compensation to our management team and employees; |
| | • | | Adjusted EBITDA does not reflect the interest expense or the cash requirements necessary to service interest or principal payments on our indebtedness; |
| | • | | Adjusted EBITDA does not reflect certain tax payments that may represent a reduction in cash available to us; and |
| | • | | other companies, including companies in our industry, may calculate Adjusted EBITDA measures differently, which reduces their usefulness as a comparative measure. |
Because of these limitations, Adjusted EBITDA should not be considered as a measure of discretionary cash available to us to invest in the growth of our business. When evaluating our performance, you should consider Adjusted EBITDA alongside other financial performance measures, including various cash flow metrics, net income and our other IFRS-IASB financial results.
The following table presents a reconciliation of Adjusted EBITDA to net income, the most comparable IFRS-IASB measure, for each of the periods indicated:
| | | | | | | | | | | | | | | | | | | | | | | | | | | | |
| | | Three Months Ended
March 31, | | | Year Ended December 31, | |
| | | 2011 | | | 2010 | | | 2010 | | | 2009 | | | 2008 | | | 2007 | | | 2006 | |
| | | (in thousands) | |
Net income | | € | 243 | | | € | 91 | | | € | 11,005 | | | € | 7,164 | | | € | 5,387 | | | € | 2,557 | | | € | 2,677 | |
Income tax expenses | | | (179 | ) | | | 25 | | | | 3,389 | | | | 1,676 | | | | 2,119 | | | | 1,973 | | | | 1,691 | |
Finance costs | | | 423 | | | | 440 | | | | 2,576 | | | | 2,415 | | | | 1,500 | | | | 687 | | | | 618 | |
Finance income | | | (108 | ) | | | (314 | ) | | | (1,650 | ) | | | (139 | ) | | | (570 | ) | | | (511 | ) | | | (484 | ) |
Provisions expense | | | 91 | | | | 46 | | | | 589 | | | | 405 | | | | 116 | | | | 853 | | | | 20 | |
Amortization and depreciation | | | 1,325 | | | | 932 | | | | 4,225 | | | | 2,490 | | | | 1,605 | | | | 517 | | | | 129 | |
Tax expenses | | | 333 | | | | 445 | | | | 3,263 | | | | 2,306 | | | | 2,150 | | | | 420 | | | | 93 | |
| | | | | | | | | | | | | | | | | | | | | | | | | | | | |
Adjusted EBITDA | | € | 2,128 | | | € | 1,665 | | | € | 23,397 | | | € | 16,317 | | | € | 12,307 | | | € | 6,496 | | | € | 4,744 | |
| | | | | | | | | | | | | | | | | | | | | | | | | | | | |
47
MANAGEMENT’S DISCUSSION AND ANALYSIS OF FINANCIAL CONDITION AND
RESULTS OF OPERATIONS
The following discussion of our financial condition and results of operations should be read in conjunction with “Selected Financial and Operating Data” and our consolidated financial statements and accompanying notes appearing elsewhere in this prospectus. Our financial statements have been prepared in accordance with IFRS-IASB.
The preparation of the consolidated financial statements required the adoption of assumptions and estimates that affect the amounts recorded as assets, liabilities, revenue and expenses in the years and periods addressed and are subject to certain risks and uncertainties. Our future results may vary substantially from those indicated because of various factors that affect our business, including, among others, those identified under “Forward-Looking Statements” and “Risk Factors” and other factors discussed in this prospectus.
Overview
General
We are a global provider of mobile monetization solutions to mobile carriers, media groups, governments, nongovernmental organizations (“NGOs”), brand owners and content owners. We provide mobile marketing, mobile entertainment and mobile money services through our proprietary platform, which incorporates software-as-a-service technologies. We have connections to more than 280 mobile carriers, giving our clients access to a network of nearly three billion end users worldwide. We leverage this broad reach, along with our in-depth knowledge of local markets to facilitate the monetization and distribution of content and services that are tailored to local preferences. Our services allow end users to consume mobile entertainment, such as music and video, receive marketing and advertising messages and make mobile payments on-the-go and free from the constraints of traditional content, marketing and payment channels.
We began expanding into Latin America in 2005 and have since continued seeking out high-growth, emerging markets. We have grown 100% organically to become, based on feedback our regional managers receive from local mobile carriers, what we believe to be one of the largest providers of mobile solutions in Latin America and a global participant with 25 local offices and offerings in more than 75 different countries worldwide. Our core market remains Latin America, where we generated 79% of our 2010 revenues and have local offices in 11 countries. Brazil is our largest market, accounting for 44%, 40% and 36% of our consolidated revenues in 2010, 2009 and 2008, respectively. We also have offices and are rapidly expanding in a number of countries in Africa, the Asia Pacific region, Europe and the Middle East.
Our platform is used by clients and end users in connection with three principal activities: mobile marketing, mobile entertainment and mobile money. For the year ended December 31, 2010, we derived €101.3 million, €116.2 million and €16.3 million in revenues from mobile marketing, mobile entertainment and mobile money activities, respectively. Our total revenue grew from €166.2 million for the year ended December 31, 2009 to €233.9 million for the year ended December 31, 2010 and from €34.6 million in the three months ended March 31, 2010 to €47.4 million in the three months ended March 31, 2011. Our net income also increased from €7.2 million for the year ended December 31, 2009 to €11.0 million for the year ended December 31, 2010 and from €0.1 million in the three months ended March 31, 2010 to €0.2 million in the three months ended March 31, 2011.
Principal factors affecting our results of operations
We consider the following factors to be the principal drivers of our results of operations for the periods under review.
48
Growth of the mobile market and demand for monetization solutions. Our financial results have been, and we expect them to continue to be, largely dependent on growth in the mobile market in emerging countries. Historically, mobile marketing and entertainment services have represented the predominant portion of the mobile market in Latin America and of our revenues. We believe that our financial success in the near term will depend on the growth of the market for our services in our target geographies, particularly the market for mobile marketing and entertainment services where we have an established position. Such mobile market growth encompasses, for our purposes, both an increase in the number of mobile end users and an increase in demand for our solutions from our carrier, media group, brand owner and government clients in our target regions. In the longer term, we believe our ability to adapt our technology platform to offer favored mobile services that incorporate new technologies introduced in our target markets will be critical to our financial success. See “Risk Factors—Risks Relating to our Industry—Our revenues and prospects would be adversely affected if demand for mobile services declines or does not continue to grow.”
Growth in the use of our technology platform. We generate revenues primarily through clients’ and end users’ purchases of services delivered through our technology platform, which substantially depends on our ability to source, develop and market services that appeal to rapidly changing preferences and appropriately price our offerings. Our financial results are significantly affected by the frequency with which end users use our services, and we believe our ability to identify, market and deliver services appealing to end users in our target markets has significantly contributed to the frequency with which they use our services. In 2010 we processed approximately 5,489 million SMS messages through our platform compared to approximately 4,554 million SMS messages in 2009 and approximately 3,000 million in 2008. We leverage our substantial end user base by offering solutions to our various carrier, media group, brand owner and government clients who wish to target such end users. Thus, we believe our ability to generate revenues will depend not only upon our access to a large and growing end user base, but also upon our ability to continue to develop and expand our relationships with carrier, media group, brand owner and government clients by offering new, attractive solutions. If we cannot successfully sustain or expand upon our end user base and sustain or increase the frequency with which they use our services and if we cannot retain and attract clients by offering appealing mobile solutions, our financial results could be adversely affected.
Growth of operations in Brazil. Brazil is our largest market, accounting for 44%, 40% and 36% of our consolidated revenues in 2010, 2009 and 2008 respectively. We have direct connections to the mobile network of Vivo, the largest mobile carrier in Brazil, and have relationships with several important media companies in Brazil, such as Globo, the largest television network in Brazil. Our heritage as a Portuguese company and the historical and linguistic ties between Portugal and Brazil facilitated our early efforts to forge relationships among key mobile carriers and clients in Brazil. Today, Brazil is the largest economy in Latin America and continues to show signs of strong growth. As such, we expect to continue to devote substantial effort toward maintaining or increasing our presence in Brazil, leveraging our existing relationships and developing attractive new mobile solutions. Given the significant percentage of our consolidated revenues we have derived and expect to continue to derive from our operations in Brazil, we are substantially influenced by general economic and political conditions in Brazil, and particularly economic growth and its impact on mobile services. See “Risk Factors—Risks Relating to our Business—Because a substantial portion of our revenues is derived from our operations in Brazil, our business is particularly sensitive to economic and political conditions in Brazil. Any economic downturn or adverse political changes in Brazil could have a material, adverse effect on our business, results of operations and financial condition.”
International expansion. Expanding into emerging countries that we believe have significant mobile market growth potential has been a touchstone of our business strategy and we expect our financial results to continue to be largely dependent upon successfully executing our growth strategies. We believe that developing new relationships with mobile carrier, media group, brand owner and government clients in our targeted areas of expansion will be a critical element of such strategies. Expanding into new regions presents complex new regulatory, legal and tax challenges, however, and we believe that our ability to effectively manage such challenges will ultimately be a significant factor in the success of any growth strategy and, accordingly,
49
substantially impact our financial success. See “Risk Factors—Risks Related to our Business—The global nature of our business and our continued expansion into emerging markets presents business, political, regulatory, operational, financial and economic risks, any of which could increase our costs and hinder our growth.”
Mobile carrier connections and contract agreements. We deliver nearly all of our services through a network of more than 280 mobile carriers in more than 75 countries, either through direct agreements with mobile carriers or indirectly through connectivity service providers. This network gives us access to nearly three billion end users. In general, mobile carriers pay us an agreed portion of the sale price of the services we offer through their respective networks and retain the remainder as compensation for the delivery of our services as well as for their billing and collection efforts. Consequently, our financial success, and particularly our profitability, is substantially dependent upon our ability to negotiate favorable revenue sharing and other contractual terms with mobile carriers. Additionally, because our business depends upon the mobile carriers’ infrastructure, any deterioration of that infrastructure, our relationships with key mobile carriers or their mobile subscriber bases could adversely affect our financial results. See “Risk Factors—Risks Relating to our Business—We rely on mobile carriers for the delivery and billing of most of our mobile marketing, mobile entertainment and mobile money services and, therefore, we may experience a material adverse effect on our business, results of operations or financial condition if our relationship with any key mobile carrier ceases or deteriorates.”
Commercial and production costs. Commercial and production costs comprise a substantial portion of our expenses associated with acquiring clients. Commercial costs, which include direct media costs relating to the placement of our advertising on television, the Internet and other media, were €57.1 million in 2010, with advertising costs accounting for €27.7 million of such amount. We rely to a substantial extent upon advertising and marketing that is effectively designed and positioned to make end users aware of our services and create effective campaigns for clients. Frequently, our advertisements also provide end users with essential information that they need to effect the purchase of a particular service from us or a client. Given the importance of effective advertising and marketing to our business and to our client acquisition efforts, and given the substantial share of our operating expenses that commercial and production costs represent, our financial success will depend on our ability to continue to deploy client acquisition resources—including commercial costs relating to advertising—effectively and cost-efficiently. Were such costs, including the costs of purchasing media space, to unexpectedly increase, we could be forced to reduce the amount of advertising and marketing we do or opt for less effective media, which could detrimentally affect our client acquisition efforts. Finally, the timing of our commercial costs may be influenced by our available cash levels at any time and whether such costs are likely to lead to revenues in the current period or subsequent periods. See “Risk Factors—Risks Relating to our Business—The success of our business is dependent upon effective advertising and marketing, or to do so at sufficient levels, could have a material adverse effect on our business, results of operations or financial condition.”
Scalability. We base our platform on scalable, module-based technology, which has complemented our business growth strategy, allowing us to respond to industry changes and expand into new geographies and service markets. In the past, we have entered new markets on the basis of a narrow demand for one of our service offerings and then subsequently rolled out additional services, leveraging commercial synergies and the scalable nature of our platform and driving growth. For example, in 2008 we offered predominantly mobile entertainment services in Mexico. By the end of 2010, nearly a quarter of our revenues from Mexico were derived from mobile marketing and mobile money services. We expect to derive certain efficiencies of scale as we continue to expand our platform, geographical footprint and portfolio of service offerings. Our financial success will depend to a certain extent on our ability to continue to scale effectively and derive efficiencies therefrom.
Foreign exchange rates. We prepare our consolidated financial statements in euro. However, we conduct our business in multiple currencies, including the euro, the Brazilian real, several other Latin American currencies and other currencies that pertain to the more than 75 different countries in which we operate. In 2010, approximately 88% of our revenue was in currencies other than the euro. We are exposed to translation risks that arise from the fact that the financial records of our subsidiaries located outside the Eurozone are maintained in
50
currencies other than the euro. As a result, changes in the relative value of such currencies against the euro can affect our consolidated financial results. See “Risk Factors—Risks Relating to our Business—We are exposed to risks associated with operations in multiple currencies.”
Fluctuations in and comparability of our quarterly results
Our quarterly results of operations have fluctuated significantly in the past and are expected to fluctuate significantly in the future based on a number of factors, some of which are not in our control. Our business is seasonal, with revenues generally lowest in the first quarter of the year and gradually building throughout the year, prior to beginning to level off or decline toward the end of the fourth quarter of the year as a result of the termination of seasonal campaigns, cash conservation and reduced activity around the Christmas and New Year holidays, which tends to carry over into the subsequent year as a result of Carnival holidays in Brazil and the summer season throughout Latin America, our primary market. Next, our operating expenses do not increase or decrease in direct proportion to our generation of revenue, affecting the period-to-period comparability of our results. For example, in some cases we will have incurred significant commercial and production costs relating to client acquisition efforts and must recognize such costs as expenses in the period when incurred despite the fact that related revenues might be recognized in a subsequent period. As a result of this and our commercial strategy, which usually involves higher spending during the first half of the year, in general terms our operating profit tends to increase throughout the year and is significantly weighted toward the end of the year. Finally, some quarters may be exceptionally strong (or weak) due to the effectiveness of a particular marketing campaign. For example, we had particularly strong second and third quarters in 2010 in terms of revenue growth as a result of particularly large and successful campaigns in Brazil, which straddled the two periods. Similarly, in 2009 we completed a number of large and successful campaigns in the third and fourth quarters, which drove comparably stronger fourth quarter revenues for the year.
Consequently, we believe period-to-period comparisons are not necessarily meaningful and should not be relied upon as indicative of future results. See “Risk Factors—Risks Relating to our Business—Our quarterly results of operations may fluctuate significantly due to several factors, some of which are not within our control. Fluctuations in our quarterly results may make period-to-period comparisons of our results of operations and financial condition difficult and could affect the market price of our common shares in a manner unrelated to our long-term operating performance.” and “Risk Factors—Risks Relating to our Business—Because we may not receive revenue from our clients in the period in which we incur costs associated with generating client agreements, including commercial and production costs, our expenses may not increase or decrease in direct proportion to our generation of revenue.”
51
Selected Quarterly Results of Operation
The following table sets forth our selected unaudited consolidated quarterly income statements for the five quarters ended March 31, 2011. You should read the following information in conjunction with our audited financial statements and related notes thereto included elsewhere in this prospectus. We have prepared the selected unaudited consolidated quarterly financial information on the same basis as our audited consolidated financial statements included in this prospectus, and reflect all adjustments, consisting only of normal recurring adjustments, that we consider necessary for a fair presentation of this data. Our financial results for these quarterly periods may not be indicative of our financial results for any future quarterly periods.
| | | | | | | | | | | | | | | | | | | | |
| | | Three Months Ended | |
| | | March 31,
2011 | | | December 31,
2010 | | | September 30,
2010 | | | June 30,
2010 | | | March 31,
2010 | |
| | | (in thousands) | |
| Selected Quarterly Income Statement Data: | | | | |
Revenues | | € | 47,384 | | | € | 70,492 | | | € | 69,645 | | | € | 59,114 | | | € | 34,600 | |
Operating Expenses: | | | | | | | | | | | | | | | | | | | | |
Cost of service delivery | | | 24,115 | | | | 34,770 | | | | 34,502 | | | | 29,248 | | | | 18,798 | |
Commercial and production costs | | | 16,216 | | | | 20,443 | | | | 23,436 | | | | 21,909 | | | | 10,237 | |
Personnel costs | | | 2,862 | | | | 2,476 | | | | 2,701 | | | | 2,139 | | | | 2,269 | |
General and administrative | | | 2,063 | | | | 1,903 | | | | 1,797 | | | | 2,195 | | | | 1,631 | |
Tax expenses | | | 333 | | | | 433 | | | | 2,162 | | | | 223 | | | | 445 | |
Amortization and depreciation | | | 1,325 | | | | 1,253 | | | | 1,048 | | | | 992 | | | | 932 | |
Provisions expense | | | 91 | | | | 447 | | | | 46 | | | | 50 | | | | 46 | |
| | | | | �� | | | | | | | | | | | | | | | |
Total operating expense | | | 47,005 | | | | 61,725 | | | | 65,692 | | | | 56,756 | | | | 34,358 | |
| | | | | | | | | | | | | | | | | | | | |
Operating profit | | | 379 | | | | 8,767 | | | | 3,953 | | | | 2,358 | | | | 242 | |
| | | | | | | | | | | | | | | | | | | | |
Finance income | | | 108 | | | | 878 | | | | 47 | | | | 411 | | | | 314 | |
Finance costs | | | (423 | ) | | | (983 | ) | | | (601 | ) | | | (552 | ) | | | (440 | ) |
| | | | | | | | | | | | | | | | | | | | |
Net finance income (costs) | | | (315 | ) | | | (105 | ) | | | (554 | ) | | | (141 | ) | | | (126 | ) |
| | | | | | | | | | | | | | | | | | | | |
Profit before income taxes | | | 64 | | | | 8,662 | | | | 3,399 | | | | 2,217 | | | | 116 | |
| | | | | | | | | | | | | | | | | | | | |
Income tax expenses | | | (179 | ) | | | 2,023 | | | | 409 | | | | 932 | | | | 25 | |
| | | | | | | | | | | | | | | | | | | | |
Net income | | | 243 | | | | 6,639 | | | | 2,990 | | | | 1,285 | | | | 91 | |
| | | | | | | | | | | | | | | | | | | | |
Profit attributable to non-controlling interests | | | (22 | ) | | | (146 | ) | | | 384 | | | | 949 | | | | (120 | ) |
| | | | | | | | | | | | | | | | | | | | |
Profit attributable to controlling interests | | € | 265 | | | € | 6,785 | | | € | 2,606 | | | € | 336 | | | € | 211 | |
| | | | | | | | | | | | | | | | | | | | |
Application of Critical Accounting Policies and Use of Estimates
The preparation of our financial statements requires management to make estimates and assumptions that affect the amounts reflected in the consolidated financial statements and accompanying notes, and related disclosure of contingent assets and liabilities. We base our estimates on historical experience, where applicable, and on other assumptions that we believe are reasonable under the circumstances, which form the basis for making judgments concerning the carrying values of assets and liabilities that are not readily apparent from other sources. Actual results may differ from these estimates under different assumptions or conditions, and could have a material impact on our reported results.
In many cases, the accounting treatment of a particular transaction, event or activity is specifically dictated by accounting principles and does not require management’s judgment in its application; in other cases, management’s judgment is required in the selection of the most appropriate alternative among available accounting principles.
52
We believe that the accounting policies discussed below are critical to our financial results and to the understanding of our historical and future performance, as these policies relate to significant areas involving management’s estimates and assumptions. We consider an accounting estimate to be critical if: 1) it requires us to make assumptions because information was not available at the time or it involved consideration of matters that were highly uncertain at the time we were making our estimate; and 2) changes in the estimate or the use of different estimates could have a material impact on our financial condition or results of operations.
Revenue recognition
We recognize revenue when the amount of revenue can be measured reliably, service delivery has been performed, it is probable that the economic benefits will flow to us, costs incurred can be measured reliably and collectability is reasonably assured.
We generate revenues principally from the sale of a wide range of mobile applications and content to mobile end users. Our platform facilitates mobile marketing, including solutions to execute and monitor mobile marketing campaigns and mobile payment services. It also includes the sale and delivery of mobile entertainment applications and content (e.g., games, mobile music) to mobile handset users. Revenue is derived from data delivery to, and transactions executed by, mobile handset users, with revenues and cost of delivery recognized upon data transfer.
We utilize mobile network operators’ channels to distribute content and to collect payment from our customers. In return, the mobile network operators are entitled to commissions, which are a percentage of the gross fees collected from our customers.
We evaluate our agreements with mobile carriers to determine whether to recognize our revenues on a gross or net basis. Pursuant to applicable accounting standards, our determination is based upon an assessment of whether we act as a principal or agent in providing our services. With respect to most of these arrangements we act as a principal in providing our services and therefore recognize revenues on a gross basis in our consolidated income statement and recognize the commissions retained by mobile carriers as a cost of revenues. With respect to the remainder of these arrangements we act as an agent and recognize our revenues on a net basis in our consolidated income statement.
Where we recognize revenues on a gross basis, we do so generally in reliance on the following factors:
| | • | | We are the primary obligor in the sale and are responsible for providing the product or service ordered by the mobile handset user (end-user); |
| | • | | We have latitude in establishing prices within ranges prescribed by the mobile operators; |
| | • | | We determine the nature, type, characteristics and specifications of the products and services we will be rendering; |
| | • | | We have the ability to control the selection of our content suppliers; and, |
| | • | | We assume credit risk of nonpayment for all amounts billed to the end-user customers related to our services. |
Mobile marketing
We generate mobile marketing revenues from clients who use our platform to create, execute and measure mobile marketing campaigns. Usage-based fees are earned based on the number of SMS messages a campaign generates. We recognize revenues when individual SMS messages are tracked within our technology platform, which interfaces with, and receives instant verifications from, the mobile carriers.
53
Performance-based fees are variable fees that are tied to the consumer response that a particular campaign generates for a client and calculated based on contract-specific metrics—such as the number of coupons redeemed or leads in a given month—for the specific clients. We recognize revenues from performance-based campaigns based on response data for each month, as calculated by our platform traffic reports.
Mobile marketing revenues also include fees charged to clients for professional services relating to the implementation, execution and monitoring of customized mobile marketing and advertising campaigns. Such fees are typically paid over a fixed period corresponding to the duration of the campaign. We recognize these fees based on the percentage of completion of the campaign. In order to reliably measure the level of services performed for each contract, we compare services performed to date as a percentage of total services to be performed as well as the proportion that costs incurred to date compared to the estimated total costs of the campaign.
Mobile entertainment
We generate mobile entertainment revenues from end users who use our platform to access mobile entertainment services. Our mobile entertainment revenues include weekly and monthly usage-based fees charged to end users for access to content libraries and other services. Delivery of mobile entertainment services is recorded by data transfer reports generated by our IT platform, which interfaces with, and receives instant verifications from, the mobile network operators’ systems. The operators also send us monthly billing statement confirmations, which we use as a basis for invoicing and for the measurement of revenue. Since we do not receive collection statements from mobile operators until 30 to 60 days after our monthly cut-off date, we usually estimate revenues for the last month of the period, based on information as recorded on our IT platforms. These platforms record all transactions carried out with mobile operators and historically represent a reliable source of information to perform revenue estimates for our business.
By the time we report our financial results, we receive substantially all the monthly collection statements from the mobile carrier and have recognized revenues and sent invoices based on these monthly statements. In the event that a monthly statement is not received at a period-end, we will recognize revenue based on the data transfer reports generated by our IT platform. Fees that have been invoiced are recorded in trade receivables and fees that have not been invoiced as of the reporting date but on which all revenue recognition criteria are met are accrued and reported as unbilled trade receivables.
Given the nature of our business model, we have no deferred revenue, since revenue is earned and recognized immediately upon mobile data transfer.
Our mobile entertainment revenues also include fees for portal management, which are paid by mobile carriers for providing their mobile end users with carrier-specific access to entertainment content. These fees primarily include periodic fees charged for maintenance of a digital portal along with fees derived from revenue-sharing agreements. Revenue is measured by the total number of downloads from the portal, and we earn a fixed percentage of the total revenues generated by each portal.
Mobile money
We provide mobile billing solutions to consumer-facing micropayment providers, who provide mobile payment options to their customers through our billing connections with mobile carriers. We offer connectivity and bulk SMS packages, serving mainly as a technology intermediary between the micropayment provider, the mobile carrier and mobile end user. We earn a percentage of the transaction value that we charge for facilitating the mobile payment, which is earned and recognized at the point of the transaction.
In some circumstances, we provide both the content and micropayment solution to the end user. We provide end users access to virtual for online games and applications. These services are provided by our platform and
54
the connections we have with different mobile carriers. Revenues and costs are recognized at the moment we receive a request by SMS text from the end user to purchase the product, at which time content and service are also delivered.
Intangible assets
Separately acquired intangible assets
Separately acquired intangible assets comprise principally software licenses. They also include intellectual property and contractual rights. We recognize a separately acquired intangible asset based on the price paid to acquire the asset, including its purchase price and any directly attributable cost of preparing the asset for its intended use.
Software acquisition and development
We capitalize internally generated intangible assets related to the development of our proprietary software platform and other internally developed technology. Software includes assets acquired from third parties, as well as the cost of internally developed software. Directly attributable costs include the costs of employee salaries specifically dedicated to projects that qualify for capitalization as an intangible asset.
An internally generated intangible asset arising from development, or from the development phase, of an internal project is recognized if all of the following have been demonstrated:
| | • | | the technical feasibility of completing the intangible asset so that it will be available for use or sale; |
| | • | | the intention to complete the intangible asset and use or sell it; |
| | • | | the ability to use or sell the intangible asset; |
| | • | | the intangible asset will generate probable future economic benefits; |
| | • | | the availability of adequate technical, financial and other resources to complete the development and to use or sell the intangible asset; and |
| | • | | the ability to measure reliably the expenditure attributable to the intangible asset during its development. |
The amount initially recognized for an internally generated intangible asset is the expenditure incurred from the date when the intangible asset first meets the recognition criteria listed above. Software is uniquely identified and controlled by the company, and only when the future economic benefit is likely to occur are these assets recognized as intangible assets.
Expenditures on research and development projects that cannot be separately measured or do not qualify for capitalization are recognized as expenses in the period in which they are incurred. Research and development expenses primarily consist of personnel-related expenses.
Subsequent measurement of intangible assets
We subsequently measure intangible assets at cost less accumulated amortization and accumulated impairment losses (if any).
Management determines the amortization period and useful life of an intangible asset based on its best estimates, taking into account the following factors:
| | • | | the expected use of the asset; |
55
| | • | | typical content and product life cycles and public information on estimates of useful lives of similar assets; |
| | • | | technological and commercial or other types of obsolescence; |
| | • | | changes in the market demand for the services derived from the asset; |
| | • | | maintenance expenditures required to obtain the expected future economic benefits from the asset and the company’s ability and intention to make such expenditures; and |
| | • | | contractual and legal limits relating to the term of use of the asset. |
Acquired intangible assets such as intellectual property are amortized using a useful life of three years. Developed technology assets are amortized using a useful life of three to four years. We hold no intangible assets with indefinite useful lives. Management reviews the amortization periods and the amortization methods for intangible assets at each fiscal year-end.
Income tax expenses
Corporate taxes are payable on taxable profits at current rates. Income tax expense represents the sum of the tax currently payable and deferred tax. The tax currently payable is based on taxable profit for the year. Taxable profit differs from profit as reported in the consolidated statements of comprehensive income because of items of income or expense that are taxable or deductible in other years and items that are never taxable or deductible. The company’s liability for current tax is calculated using tax rates that have been enacted or substantively enacted by the end of the reporting period.
We account for income taxes using the asset and liability method. Under this method, we recognize deferred tax assets and liabilities based on temporary differences between the carrying amounts of assets and liabilities in the consolidated financial statements and the corresponding tax bases used in the computation of taxable profit. Deferred tax liabilities are generally recognized for all taxable temporary differences. Deferred tax assets are generally recognized for all deductible temporary differences to the extent that it is probable that taxable profits will be available against which those deductible temporary differences can be utilized and the differences are expected to reverse in the foreseeable future. Deferred tax assets applicable to the company include unused tax losses, tax credits and deductible temporary differences. Deferred tax assets are reviewed at each reporting date and are reduced to the extent that it is no longer probable that the related tax benefit will be realized.
Deferred tax assets and liabilities are not recognized if the temporary difference arises from goodwill or from the initial recognition (other than in a business combination) of other assets and liabilities in a transaction that affects neither taxable profit nor accounting profit. Deferred tax assets and liabilities are measured at the tax rates that are expected to apply in the period in which the liability is settled or the asset realized, based on tax rates (and tax laws) that have been enacted or substantively enacted by the end of the reporting period.
We are subject to corporate taxes in a number of different jurisdictions, and management applies judgment in determining the appropriate provision for transactions where the ultimate tax determination is uncertain. We recognize liabilities for anticipated taxes based on the best information available and where the anticipated liability is both probable and estimable. Where the final outcome of such matters differs from the amount recorded, any differences may impact the income tax and deferred tax provisions in the period in which the final determination is made.
In Portugal, tax authorities are allowed to review the corporate income tax (“CIT”) calculation of the company and its subsidiaries during a period of four to six years after the taxable year in question in the case of tax losses. Tax authorities may adjust the CIT charge if there are differences in tax legislation interpretation. However, we believe that there are no significant adjustments to income taxes in the financial statements.
56
Description of Certain Statement of Operations Items
Revenues
We derive our revenues primarily from monetization of our platform through its use in the sale of mobile marketing, mobile entertainment and mobile money services to clients and end users who use our platform. We generate revenues as follows:
Mobile marketing revenues: We generate mobile marketing revenues from clients who use our platform to create, execute and measure mobile marketing campaigns. There are three principal types of fees we charge in connection with campaigns and which comprise our mobile marketing revenues. Usage-based fees account for the predominant portion of revenues generated by mobile marketing campaigns and are calculated based on the number of SMS messages a campaign generates. Performance-based fees are variable fees that are tied to the consumer response that a particular campaign generates for a client and calculated based on contract-specific metrics—such as the number of coupons redeemed—tailored to measure successful results generated for the specific client. Finally, mobile marketing revenues also include fees charged to clients for professional services relating to the implementation, execution and monitoring of customized mobile marketing and advertising campaigns. Such fees are typically paid over a fixed period corresponding to the duration of the campaign. Due to the nature of the services that we provide, our client contracts may include service level requirements that may require us to pay penalties if we fail to meet the required service levels. We recognize any such penalties, when incurred, as a reduction to revenue.
Mobile entertainment revenues: We generate mobile entertainment revenues from end users who use our platform to access mobile entertainment services. Our mobile entertainment revenues include usage-based fees charged to end users for subscription-based access to content libraries and other services, renewable on a daily or weekly basis. Additionally, our mobile entertainment revenues include portal management revenues, which primarily include periodic fees charged for maintenance of the digital portal along with fees derived from revenue-sharing agreements, which are generally based on the total number of downloads from the portal and pursuant to which we collect a percentage of the total revenues generated by the portal.
Mobile money revenues: We generate mobile money revenues from end users who use our platform to execute mobile payments from clients with whom we contract to promote and offer such services. Our mobile money revenues include transaction- and usage-based fees, which are charged through our platform and mobile carrier networks.
Cost of service delivery
The principal component of our cost of service delivery is the fee charged by mobile carriers or connectivity service providers, as the case may be, for the use of their communications and billing channels. We maintain agreements with mobile carriers and connectivity service providers worldwide to facilitate our delivery of mobile content to end users and solutions to clients. Mobile carriers and connectivity service providers charge us fees for, among other things, SMS costs, usage of bandwidth on their networks and access to their billing systems, which fees vary from carrier to carrier and depending on the service to which they relate.
Commercial and production costs
Commercial and production costs includes media expenses, consisting primarily of direct costs of advertising, purchasing media inventory for the placement of advertising and media messaging services; fees paid to third parties for creative development and other services in connection with the creation and execution of marketing and advertising campaigns; costs associated with incentives and promotional items provided to end users to encourage participation in campaigns; content and third-party fees related to mobile entertainment services; and third-party fees related to our mobile money services. Commercial and production costs do not include any wages or salaries of employees. In connection with our growth strategy, we expect to continue to commit significant resources to develop our services and generate revenue growth which, accordingly, is likely to increase our commercial and production costs in absolute values in the future periods.
57
Personnel costs
Personnel costs consists primarily of personnel wages, benefits, social security taxes, remuneration charges and directors’ wages. Personnel costs related to information technology development are capitalized and not expensed as incurred, if the criteria set forth in International Accounting Standard No. 38 – Intangible Assets are met. We do not allocate personnel costs by function, and accordingly no wages or employee benefits expense is recorded under costs of service delivery or commercial and production costs.
General and administrative
General and administrative expenses consist primarily of travelling expenses, rents, fees and other general office expenses.
Tax expenses
Tax expenses consist principally of taxes and social contributions levied on company revenues by certain Latin American countries where we have significant sales operations. The majority of such expenses were paid in Brazil, which levies federal social contribution taxes that are based on operating margins.
Amortization and depreciation expenses
Amortization and depreciation expenses consist primarily of the depreciation of the cost of our technology and transportation equipment, principally hardware and motor vehicles, respectively, and amortization of our information technology programs.
Provisions expense
Provisions expense consists primarily of contingencies relating to tax and labor disputes.
Finance income
Finance income consists primarily of foreign currency translation differences, other finance revenues and interest.
Finance costs
Finance costs consists primarily of interest on bank loans, foreign exchange rate losses, impairment losses and other finance costs.
Income tax expenses
Generally, Portuguese companies were subject to corporate tax on their taxable income at the rate of 25% for the 2008, 2009 and 2010 tax years. This rate can be increased by a municipal surcharge of up to 1.5% of taxable profit and, from 2010 onward, a state surcharge of 2.5% on taxable profits in excess of €2.0 million. Under current legislation, tax returns are subject to revision and correction by the tax authorities during subsequent years. In Portugal and Spain that period is four years, and in Brazil, Turkey and Argentina it is five years. Tax losses are also subject to inspection and adjustment and can be deducted from taxable income in subsequent years (four years in Portugal, fifteen years in Spain, five years in Argentina and Turkey and no limit in Brazil except that only 30% of taxable income may be used per year).
A deferred tax asset or liability is created for temporary differences between income recognized for tax purposes and for accounting purposes.
58
Results of Operations
The following tables sets forth components of our consolidated statements of income for the periods indicated:
| | | | | | | | | | | | | | | | | | | | | | | | | | | | | | | | |
| | | Three Months Ended
March 31, | | | Year Ended December 31, | | | Change | |
| | | 2011 | | | 2010 | | | 2010 | | | 2009 | | | 2008 | | | Q1 2011 vs.
Q1 2010 | | | 2010 vs.
2009 | | | 2009 vs.
2008 | |
| | | (€ thousands except percentages) | |
Revenues | | | 47,384 | | | | 34,600 | | | | 233,851 | | | | 166,241 | | | | 125,339 | | | | 37 | % | | | 41 | % | | | 33 | % |
Operating expenses: | | | | | | | | | | | | | | | | | | | | | | | | | | | | | | | | |
Cost of service delivery | | | 24,115 | | | | 18,798 | | | | 117,318 | | | | 97,056 | | | | 65,059 | | | | 28 | % | | | 21 | % | | | 49 | % |
Commercial and production costs | | | 16,216 | | | | 10,237 | | | | 76,025 | | | | 37,130 | | | | 35,292 | | | | 58 | % | | | 105 | % | | | 5 | % |
Personnel costs | | | 2,862 | | | | 2,269 | | | | 9,585 | | | | 8,758 | | | | 6,519 | | | | 26 | % | | | 9 | % | | | 34 | % |
General and administrative | | | 2,063 | | | | 1,631 | | | | 7,526 | | | | 6,980 | | | | 6,162 | | | | 26 | % | | | 8 | % | | | 13 | % |
Tax expenses | | | 333 | | | | 445 | | | | 3,263 | | | | 2,306 | | | | 2,150 | | | | (25 | )% | | | 42 | % | | | 7 | % |
Amortization and depreciation | | | 1,325 | | | | 932 | | | | 4,225 | | | | 2,490 | | | | 1,605 | | | | 42 | % | | | 70 | % | | | 55 | % |
Provisions expense | | | 91 | | | | 46 | | | | 589 | | | | 405 | | | | 116 | | | | 98 | % | | | 45 | % | | | 249 | % |
| | | | | | | | | | | | | | | | | | | | | | | | | | | | | | | | |
Total operating expense | | | 47,005 | | | | 34,358 | | | | 218,531 | | | | 155,125 | | | | 116,903 | | | | 37 | % | | | 41 | % | | | 33 | % |
| | | | | | | | | | | | | | | | | | | | | | | | | | | | | | | | |
Operating profit | | | 379 | | | | 242 | | | | 15,320 | | | | 11,116 | | | | 8,436 | | | | 57 | % | | | 38 | % | | | 32 | % |
| | | | | | | | | | | | | | | | | | | | | | | | | | | | | | | | |
Finance income | | | 108 | | | | 314 | | | | 1,650 | | | | 139 | | | | 570 | | | | (66 | )% | | | n.m. | | | | (76 | )% |
Finance costs | | | (423 | ) | | | (440 | ) | | | (2,576 | ) | | | (2,415 | ) | | | (1,500 | ) | | | (4 | )% | | | 7 | % | | | 61 | % |
| | | | | | | | | | | | | | | | | | | | | | | | | | | | | | | | |
Net finance income (costs) | | | (315 | ) | | | (126 | ) | | | (926 | ) | | | (2,276 | ) | | | (930 | ) | | | 150 | % | | | (59 | )% | | | 145 | % |
| | | | | | | | | | | | | | | | | | | | | | | | | | | | | | | | |
Profit before income taxes | | | 64 | | | | 116 | | | | 14,394 | | | | 8,840 | | | | 7,506 | | | | (45 | )% | | | 63 | % | | | 18 | % |
| | | | | | | | | | | | | | | | | | | | | | | | | | | | | | | | |
Income tax expense (benefit) | | | (179 | ) | | | 25 | | | | 3,389 | | | | 1,676 | | | | 2,119 | | | | n.m. | | | | 102 | % | | | (21 | )% |
| | | | | | | | | | | | | | | | | | | | | | | | | | | | | | | | |
Net income | | | 243 | | | | 91 | | | | 11,005 | | | | 7,164 | | | | 5,387 | | | | 167 | % | | | 54 | % | | | 33 | % |
| | | | | | | | | | | | | | | | | | | | | | | | | | | | | | | | |
Profit attributable to non-controlling interests | | | (22 | ) | | | (120 | ) | | | 1,067 | | | | 930 | | | | (26 | ) | | | (82 | )% | | | 15 | % | | | n.m. | |
| | | | | | | | | | | | | | | | | | | | | | | | | | | | | | | | |
Profit attributable to controlling interests | | | 265 | | | | 211 | | | | 9,938 | | | | 6,234 | | | | 5,413 | | | | 26 | % | | | 59 | % | | | 15 | % |
| | | | | | | | | | | | | | | | | | | | | | | | | | | | | | | | |
Comparison of three months ended March 31, 2011 and 2010
Revenues
| | | | | | | | | | | | |
| | | Three Months Ended March 31, | | | Change | |
| | | 2011 | | | 2010 | | | Q1 2011 vs.
Q1 2010 | |
| | | (€ thousands) | | | | |
Revenues | | | 47,384 | | | | 34,600 | | | | 37% | |
Our revenues for the three months ended March 31, 2011 were €47.4 million compared with €34.6 million for the three months ended March 31, 2010, representing an increase of €12.8 million or 37%. This increase was the result of overall growth in revenues in mobile marketing and mobile money (€9.7 million and €3.7 million, respectively), predominantly in Brazil (€6.2 million) and Africa (€2.2 million).
59
The following table sets forth the breakdown of our revenues for the periods indicated based on the geographic sources thereof:
| | | | | | | | | | | | | | | | | | | | |
| | | Three Months Ended March 31, | |
| | | 2011 | | | 2010 | | | Change | |
| | | Revenues | | | % of Total
Revenues | | | Revenues | | | % of Total
Revenues | | | Q1 2011 vs.
Q1 2010 | |
| | | (€ thousands) | | | | | | (€ thousands) | | | | | | | |
Brazil | | | 14,126 | | | | 30 | % | | | 7,894 | | | | 23 | % | | | 79 | % |
Andean | | | 9,640 | | | | 20 | % | | | 6,028 | | | | 17 | % | | | 60 | % |
South Cone | | | 7,184 | | | | 15 | % | | | 6,915 | | | | 20 | % | | | 4 | % |
Mexico | | | 3,616 | | | | 8 | % | | | 5,409 | | | | 16 | % | | | (33 | )% |
EE CA(1) | | | 1,722 | | | | 4 | % | | | 1,278 | | | | 4 | % | | | 35 | % |
Middle East | | | 942 | | | | 2 | % | | | 593 | | | | 2 | % | | | 59 | % |
Europe | | | 6,207 | | | | 15 | % | | | 5,063 | | | | 15 | % | | | 23 | % |
Africa | | | 3,422 | | | | 7 | % | | | 1,266 | | | | 4 | % | | | 170 | % |
North America | | | 174 | | | | 0 | % | | | 77 | | | | 0 | % | | | 126 | % |
APAC(2) | | | 350 | | | | 0 | % | | | 78 | | | | 0 | % | | | n.m. | |
Total | | | 47,384 | | | | 100 | % | | | 34,600 | | | | 100 | % | | | 37 | % |
| (1) | Eastern Europe and Central Asia |
Our revenues from Brazil (comprising approximately 30% of total revenues) increased from €7.9 millon for the first three months of 2010 to €14.1 million for the first three month of 2011, as the result of increased mobile marketing activities. Revenues from mobile marketing activities in Brazil increased from €1.9 million for the first three months of 2010 to €7.1 million for the first three months of 2011 due to several significant campaigns with carriers and media groups. During this period, revenues from the Andean region (comprising approximately 20% of total revenues) increased by 60%. This increase was underpinned by growth in mobile money (€1.8 million), mobile entertainment (€1.2 million) and mobile marketing (€0.7 million). Revenues derived from mobile entertainment in the Andean region increased from €5.4 million for the first three months of 2010 to €6.6 million for the first three months of 2011, primarily due to activities in Colombia and Ecuador. Revenues derived from activities in Europe increased from €5.0 million for the first three months of 2010 to €6.2 million for the first three months of 2011, due primarily to increased mobile marketing activities (€1.1 million). Revenues derived from operations in Mexico decreased €1.8 million (or 33%) for the first three months of 2010 compared with the first three months of 2011 due to increased costs of investment in media and acquiring clients, which decreased overall investment levels of mobile entertainment activities in Mexico during the period.
The following table sets forth the breakdown of our revenues for the periods indicated based on the business sources thereof:
| | | | | | | | | | | | | | | | | | | | |
| | | Three Months Ended March 31, | |
| | | 2011 | | | 2010 | | | Change | |
| | | Revenues | | | % of Total
Revenues | | | Revenues | | | % of Total
Revenues | | | Q1 2011 vs.
Q2 2010 | |
| | | (€ thousands) | | | | | | (€ thousands) | | | | | | | |
Mobile marketing | | | 13,499 | | | | 28 | % | | | 3,774 | | | | 11 | % | | | n.m. | |
Mobile entertainment | | | 27,264 | | | | 58 | % | | | 27,931 | | | | 81 | % | | | (2 | )% |
Mobile money | | | 6,621 | | | | 14 | % | | | 2,895 | | | | 8 | % | | | 129 | % |
| | | | | | | | | | | | | | | | | | | | |
Total | | | 47,384 | | | | 100 | % | | | 34,600 | | | | 100 | % | | | 37 | % |
| | | | | | | | | | | | | | | | | | | | |
60
The following table sets forth key performance indicators for the periods indicated:
| | | | | | | | | | | | |
| | | Three Months Ended
March 31, | | | Change | |
| | | 2011 | | | 2010 | | | Q1 2011 vs.
Q1 2010 | |
Mobile Marketing | | | | | | | | | | | | |
Number of mobile marketing campaigns | | | 30 | | | | 28 | | | | 7 | % |
Average revenue per campaign (€ thousands) | | | 420.6 | | | | 134.8 | | | | n.m. | |
Mobile Entertainment | | | | | | | | | | | | |
Number of mobile entertainment subscribers (thousands)(1) | | | 18,190 | | | | 18,765 | | | | (3 | )% |
Monthly average revenue per mobile entertainment subscriber | | | 0.48 | | | | 0.48 | | | | — | |
Mobile Money | | | | | | | | | | | | |
Number of mobile money clients(2)(3) | | | 49 | | | | 30 | | | | 63 | % |
Monthly average revenue per client (€ thousands) | | | 45.0 | | | | 32.2 | | | | 40 | % |
| (2) | Represents the number of clients with whom mobile money contracts have been signed. |
Mobile marketing
Our mobile marketing revenues increased from €3.8 million for the first three months of 2010 to €13.5 million for the first three months of 2011, representing a €9.7 million increase. This increase was driven principally by mobile marketing revenue increases in Brazil (€5.2 million), Africa (€2.0 million), Europe (€1.1 million) and the Andean region (€0.7 million). Increases in Brazil were the result of our continued focus on large campaigns with carrier and media group clients, as well as the introduction of performance-based campaigns in the region. Increases across other regions were principally due to our expanded portfolio of mobile marketing services, which allowed us to capitalize on additional market opportunities. Though our total number of mobile marketing campaigns increased from 28 during the first three months of 2010 to 30 during the first three months of 2011, our average revenue per campaign (€0.4 million) during the first three months of 2011 was lower than our average revenue per campaign for the year ended December 31, 2010 (€1.1 million) due to the fact that our larger campaigns are typically conducted during the second quarter.
Mobile entertainment
Our mobile entertainment revenues decreased from €27.9 million for the first three months of 2010 to €27.3 million for the first three months of 2011, representing a 2% decrease. This decrease was mainly caused by lower mobile entertainment revenues in Brazil (a €1.2 million decrease) and Mexico (a €1.5 million decrease), which were the result of lower billing rates for our services in the regions, despite overall increases in our number of mobile entertainment subscribers in such regions. This decrease was partially offset by increases in mobile entertainment revenues in the Andean region (€1.2 million) and APAC (€0.3 million) regions.
Mobile money
Our mobile money revenues increased from €2.9 million for the first three months of 2010 to €6.6 million for the first three months of 2011, representing a 129% increase. This increase was driven principally by growth in Brazil, where we had a €2.1 million increase in mobile money revenues for the period. Additionally, in the Andean region our number of mobile money clients increased from 7 to 15 during the period, contributing to a €1.8 million increase in mobile money revenues attributable to operations in the Andean region for the period.
61
Operating expenses
| | | | | | | | | | | | | | | | | | | | |
| | | Three Months
Ended March 31, | | | Change | | | Percent of Total Revenues | |
| | | 2011 | | | 2010 | | | Q1 2011 vs.
Q1 2010 | | | Q1 2011 | | | Q1 2010 | |
| | | (€ thousands) | | | | | | | | | | |
Cost of service delivery | | | 24,115 | | | | 18,798 | | | | 28 | % | | | 51 | % | | | 54 | % |
Commercial and production costs | | | 16,216 | | | | 10,237 | | | | 58 | % | | | 34 | % | | | 30 | % |
Personnel costs | | | 2,862 | | | | 2,269 | | | | 26 | % | | | 6 | % | | | 7 | % |
General and administrative | | | 2,063 | | | | 1,631 | | | | 26 | % | | | 4 | % | | | 5 | % |
Tax expenses | | | 333 | | | | 445 | | | | (25 | )% | | | 1 | % | | | 1 | % |
Amortization and depreciation | | | 1,325 | | | | 932 | | | | 42 | % | | | 3 | % | | | 3 | % |
Provisions expense | | | 91 | | | | 46 | | | | 98 | % | | | — | | | | — | |
| | | | | | | | | | | | | | | | | | | | |
Total | | | 47,005 | | | | 34,358 | | | | 37 | % | | | 99 | % | | | 99 | % |
| | | | | | | | | | | | | | | | | | | | |
Cost of service delivery
The increase in cost of service delivery in the first three months of 2011 compared with the first three months of 2010 was due mainly to the increase in our revenues during that period. As a percentage of total revenues cost of service delivery decreased by 3 percentage points in the first three months of 2011 compared with the first three months of 2010. This decrease was due primarily to an overall increase in the percent of total revenues generated from mobile marketing activities, which generally are associated with lower cost of delivery. In connection with many mobile marketing campaigns and mobile money services we are generally able to negotiate better payout ratios with mobile carriers, compared with the typical mobile carrier agreements relating to our mobile entertainment activities. Thus, increasing mobile marketing activities allowed us to increase revenues while reducing costs of service delivery as a percentage of revenues.
Commercial and production costs
The increase in commercial and production expenses in the first three months of 2011 compared with the first three months of 2010 was due primarily to a €4.2 million increase in commercial costs, which represented 81% of total commercial and production costs for the first three months of 2011. This increase in commercial costs is attributable to our revenue growth, particularly in Brazil, which accounted for €2.2 million of the total increase in our commercial costs for the period. That increase is primarily associated with mobile marketing activities. Production costs in Europe also increased €0.6 million during the period, contributing to the overall increase in commercial and production costs. That increase is primarily associated with mobile marketing campaigns. As a percentage of total revenues, commercial and production expenses increased by 4 percentage points. This increase was due primarily to expanding the array of mobile marketing services we offer and giving greater weight to these services in respect of our overall business efforts.
Personnel costs
The increase in personnel costs in the first three months of 2011 compared with the first three months of 2010 stemmed principally from the overall growth of our operations and, in particular, from an increase in our headcount from 334 employees as of March 31, 2010 to 377 as of March 31, 2011 as we reinforced our sales and development teams in order to assert a stronger presence in the market. As a percentage of total revenues, personnel costs decreased by 1 percentage point. This decrease was due primarily to efficiency gains derived from the increased scale of our business.
62
General and administrative
The increase in general and administrative costs in the first three months of 2011 compared with the first three months of 2010 was due mainly to the increase in office rents (€0.2 million) in connection with opening new offices and an increase in external fees (€0.2 million) associated with the offering to which this prospectus relates. Due to efficiencies derived from the scale of our operations and internal cost initiatives, as a percentage of total revenues, general and administrative costs decreased by 1 percentage point during the period.
Tax expenses
The decrease in tax expenses in the first three months of 2011 compared with the first three months of 2010 was due mainly to decreased federal taxes recorded in Brazil.
Amortization and depreciation
The increase in amortization and depreciation in the first three months of 2011 compared with the first three months of 2010 was due mainly to an increase in capitalized costs in 2010 and 2011 associated with internally developed software used in our technology platforms. As a percentage of total revenues, amortization and depreciation costs did not change significantly during the period, representing 3% of total revenues.
Provisions expense
The increase in provisions expense in the first three months of 2011 compared with the first three months of 2010 was due principally to an increase in tax contingency provisions. As a percentage of total revenues, provisions expense remained insignificant in both periods.
Financial results
| | | | | | | | | | | | | | | | | | | | |
| | | Three Months Ended
March 31, | | | Change | | | Percent of Total Revenues | |
| | | 2011 | | | 2010 | | | Q1 2011 vs.
Q1 2010 | | | Q1 2011 | | | Q1 2010 | |
| | | (€ thousands) | | | | | | | | | | |
Finance income | | | 108 | | | | 314 | | | | (66 | )% | | | — | | | | 1 | % |
Finance costs | | | 423 | | | | 440 | | | | (4 | )% | | | 1 | % | | | 1 | % |
The decrease in finance income of €0.2 million in the first three months of 2011 compared with the first three months of 2010 was primarily due to the exchange rate translation gain of €0.2 million associated with Brazil during the first three months of 2010 which was not repeated in the first three months of 2011.
Finance costs remained the same (€0.4 million) in the first three months of 2011 and in the first three months of 2010 with such amount including €0.2 million in exchange rate losses, €0.1 million in interest expense and €0.1 million in other financial costs.
Income tax expense (benefit)
| | | | | | | | | | | | | | | | | | | | |
| | | Three Months Ended
March 31, | | | Change | | | Percent of Total Revenues | |
| | | 2011 | | | 2010 | | | Q1 2011 vs.
Q1 2010 | | | Q1 2011 | | | Q2 2010 | |
| | | (€ thousands) | | | | | | | |
Income tax expenses | | | (179 | ) | | | 25 | | | | (204 | ) | | | — | | | | — | |
63
We had a tax benefit of €0.2 million for the first three months of 2011 compared with a tax expense of €0.3 million for the first three months of 2011. This change was due mainly to the fact that income tax losses were recorded with respect to tax-bearing assets of certain of our subsidiaries during the first three months of 2011 that have higher income tax rates than our group’s weighted average.
Net income for the year
| | | | | | | | | | | | | | | | | | | | |
| | | Three Months Ended
March 31, | | | Change | | | Percent of Total Revenues | |
| | | 2011 | | | 2010 | | | Q1 2011 vs.
Q1 2010 | | | Q1 2011 | | | Q1 2010 | |
| | | (€ thousands) | | | | | | | | | | |
Net income for the year | | | 243 | | | | 91 | | | | 167 | % | | | 1 | % | | | — | |
The foregoing had the effect of increasing our net income by 167% for the first three months of 2011 compared with the first three months of 2010. This increase was generally due to increased revenues and, consequently, increased operating profit, which was only partially offset by increased financial costs associated with exchange rate translation losses.
Profit attributable to non-controlling interests
| | | | | | | | | | | | | | | | | | | | |
| | | Three Months Ended
March 31, | | | Change | | | Percent of Total Revenues | |
| | | 2011 | | | 2010 | | | Q1 2011 vs.
Q1 2010 | | | Q1 2011 | | | Q2 2010 | |
| | | (€ thousands) | | | | | | | | | | |
Profit attributable to non-controlling interests | | | (22 | ) | | | (120 | ) | | | (82 | )% | | | — | | | | — | |
The decrease in loss attributable to non-controlling interests in the first three months of 2011 compared with the first three months of 2010 was due primarily to net income recorded by one of our Brazilian subsidiaries, Brasiltec.
Comparison of the years ended December 31, 2010, 2009 and 2008
Revenues
| | | | | | | | | | | | | | | | | | | | |
| | | Year Ended December 31, | | | Change | |
| | | 2010 | | | 2009 | | | 2008 | | | 2010 vs. 2009 | | | 2009 vs. 2008 | |
| | | (€ thousands) | | | | | | | |
Revenues | | | 233,851 | | | | 166,241 | | | | 125,339 | | | | 41 | % | | | 33 | % |
Our revenues for the year ended December 31, 2010 were €233.9 million compared with €166.2 million for the year ended December 31, 2009, representing an increase of €67.6 million or 41%. This increase was the result of an overall growth in revenues in mobile marketing and mobile entertainment (€47.2 million and €8.7 million, respectively), predominantly in Brazil (€36.3 million), the Andean region (€18.7 million) and Africa (€8.8 million).
Our revenues for the year ended December 31, 2009 were €166.2 million compared with €125.3 million for the year ended December 31, 2008, representing an increase of €40.9 million or 33%. This increase was mainly due to an increase in the total number of mobile marketing initiatives in Brazil, which generated an increase of €18.3 million, and enhanced content monetization business in Mexico (€11.8 million).
64
The following table sets forth the breakdown of our revenues for the periods indicated based on the geographic sources thereof:
| | | | | | | | | | | | | | | | | | | | | | | | | | | | | | | | |
| | | Year Ended December 31, | |
| | | 2010 | | | 2009 | | | 2008 | | | Change | |
| | | Revenues | | | % of Total
Revenues | | | Revenues | | | % of Total
Revenues | | | Revenues | | | % of Total
Revenues | | | 2010 vs. 2009 | | | 2009 vs. 2008 | |
| | | (€ thousands) | | | | | | (€ thousands) | | | | | | (€ thousands) | | | | | | | | | | |
Brazil | | | 103,173 | | | | 44 | % | | | 66,860 | | | | 40 | % | | | 44,496 | | | | 36 | % | | | 54 | % | | | 50 | % |
Andean | | | 35,991 | | | | 15 | % | | | 17,316 | | | | 10 | % | | | 19,705 | | | | 16 | % | | | 108 | % | | | (12 | )% |
South Cone | | | 28,006 | | | | 12 | % | | | 37,229 | | | | 22 | % | | | 33,419 | | | | 27 | % | | | (25 | )% | | | 11 | % |
Mexico | | | 17,969 | | | | 8 | % | | | 15,257 | | | | 9 | % | | | 1,594 | | | | 1 | % | | | 18 | % | | | n.m. | |
EE CA | | | 7,525 | | | | 3 | % | | | 2,866 | | | | 2 | % | | | 3,206 | | | | 3 | % | | | 163 | % | | | (11 | )% |
Middle East | | | 2,864 | | | | 1 | % | | | 1,194 | | | | 1 | % | | | 672 | | | | 1 | % | | | 140 | % | | | 78 | % |
Europe | | | 21,706 | | | | 9 | % | | | 19,799 | | | | 12 | % | | | 18,709 | | | | 15 | % | | | 10 | % | | | 6 | % |
Africa | | | 14,318 | | | | 6 | % | | | 5,491 | | | | 3 | % | | | 3,490 | | | | 3 | % | | | 161 | % | | | 57 | % |
North America | | | 698 | | | | 0 | % | | | 0 | | | | 0 | % | | | 0 | | | | 0 | % | | | — | | | | 0 | % |
APAC | | | 1,600 | | | | 1 | % | | | 229 | | | | 0 | % | | | 49 | | | | 0 | % | | | n.m. | | | | n.m. | |
Total | | | 233,851 | | | | 100 | % | | | 166,241 | | | | 100 | % | | | 125,339 | | | | 100 | % | | | 41 | % | | | 33 | % |
Our revenues from Brazil (comprising approximately 44% of total revenues) increased during 2010 by 54% compared with 2009, as the result of increased mobile marketing activities. Revenues from mobile marketing activities in Brazil increased from €43.9 million in 2009 to €76.4 million in 2010 due to several significant campaigns with carriers and media groups. During this year, revenues from the Andean region (comprising approximately 15% of total revenues) increased by 108% compared with 2009. This growth was principally due to increased content monetization activities stemming from an increase in mobile entertainment subscribers (€10.6 million growth in mobile entertainment) and increased use of our mobile money services in that region (€5.9 million growth in mobile money). Revenues derived from mobile entertainment in the Andean region increased from €15.0 million in 2009 to €25.6 million in 2010, primarily due to enhanced content offerings, which attracted a greater number of mobile entertainment subscribers (a 70.2% increase). Revenues derived from mobile money activities in the Andean region increased from €0.5 million to €6.4 million from 2009 to 2010. This growth was due primarily to increased mobile money service offerings in the region and the addition of 15 new mobile money clients in the region during the year. Revenue growth in Brazil and the Andean region from 2009 to 2010 was partially offset by a 25% (or €9.2 million) decline in revenues from the South Cone during that period, which was attributable to less investment in the region, particularly in Argentina and also in Chile, which suffered a major earthquake in 2010, as well as fewer mobile entertainment activities.
During 2009, revenues from Brazil and Mexico increased €22.4 million and €13.7 million respectively, compared with 2008. This increase was due primarily to the increased mobile marketing and mobile entertainment activities in Brazil and Mexico, respectively. In Brazil, revenues from mobile marketing increased from €25.7 million in 2008 to €43.9 million in 2009, primarily due to mobile marketing services related to campaigns with carriers and media groups. This increase was partially offset by a 12% decrease in revenues from the Andean region during that period, which was primarily attributable to successful mobile marketing campaigns in Colombia in 2008, which generated €3.1 million and were not repeated in 2009. In Mexico, revenues from mobile entertainment increased from €1.1 million for 2008, when we first entered the market, to €12.9 million for 2009. This increase was primarily attributable to our entrance into the Mexico market in 2008, after which we significantly expanded our footprint and services offerings in Mexico. We expect that the proportion of revenue generated from each region will change as we continue to expand and increase our penetration into new geographies.
65
The following table sets forth the breakdown of our revenues for the periods indicated based on the business sources thereof:
| | | | | | | | | | | | | | | | | | | | | | | | | | | | | | | | |
| | | Year Ended December 31, | |
| | | 2010 | | | 2009 | | | 2008 | | | Change | |
| | | Revenues | | | % of Total
Revenues | | | Revenues | | | % of Total
Revenues | | | Revenues | | | % of Total
Revenues | | | 2010 vs.
2009 | | | 2009 vs.
2008 | |
| | | (€ thousands) | | | | | | (€ thousands) | | | | | | (€ thousands) | | | | | | | | | | |
Mobile marketing | | | 101,320 | | | | 43 | % | | | 54,154 | | | | 33 | % | | | 37,832 | | | | 30 | % | | | 87 | % | | | 43 | % |
Mobile entertainment | | | 116,185 | | | | 50 | % | | | 107,534 | | | | 65 | % | | | 87,275 | | | | 70 | % | | | 8 | % | | | 23 | % |
Mobile money | | | 16,346 | | | | 7 | % | | | 4,552 | | | | 3 | % | | | 233 | | | | 0 | % | | | n.m. | | | | n.m. | |
| | | | | | | | | | | | | | | | | | | | | | | | | | | | | | | | |
Total | | | 233,851 | | | | 100 | % | | | 166,241 | | | | 100 | % | | | 125,339 | | | | 100 | % | | | 41 | % | | | 33 | % |
| | | | | | | | | | | | | | | | | | | | | | | | | | | | | | | | |
The following table sets forth key performance indicators for the periods indicated:
| | | | | | | | | | | | | | | | | | | | |
| | | Years Ended December 31, | | | Change | |
| | | 2010 | | | 2009 | | | 2008 | | | 2010 vs.
2009 | | | 2009 vs.
2008 | |
Mobile Marketing | | | | | | | | | | | | | | | | | | | | |
Number of mobile marketing campaigns | | | 93 | | | | 115 | | | | 51 | | | | (19 | )% | | | 125 | % |
Average revenue per campaign (€ thousands) | | | 1,089.5 | | | | 470.9 | | | | 741.8 | | | | 131 | % | | | (37 | )% |
Mobile Entertainment | | | | | | | | | | | | | | | | | | | | |
Number of mobile entertainment subscribers (thousands)(1) | | | 19,334 | | | | 19,175 | | | | 11,675 | | | | 1 | % | | | 64 | % |
Average revenue per mobile entertainment subscriber (monthly)(€) | | | 0.48 | | | | 0.45 | | | | 0.61 | | | | 7 | % | | | (26 | )% |
Mobile Money | | | | | | | | | | | | | | | | | | | | |
Number of mobile money clients(2)(3) | | | 44 | | | | 19 | | | | 1 | | | | 132 | % | | | n.m. | |
Average revenue per client (monthly)(€ thousands) | | | 31.0 | | | | 20.0 | | | | 19.4 | | | | 55 | % | | | 3 | % |
| (2) | Represents the number of clients with whom mobile money contracts have been signed. |
Mobile marketing
We divide our mobile marketing clients into four categories: mobile carriers, media groups, government/NGOs and consumer brands. Through 2008 we focused principally on offering smaller campaigns to consumer brand clients. From 2008 to 2009, our average revenue per campaign decreased from €0.7 million to €0.5 million, due to an increased number of campaigns executed for consumer brand clients, which campaigns are generally smaller than those conducted for other categories of mobile marketing clients. By mid-2009 we began directing more of our efforts toward larger campaigns with media group and mobile carrier clients. This led to an increase in our average revenue per campaign from €0.5 million in 2009 to €1.1 million in 2010. Our total number of mobile marketing campaigns decreased from 115 in 2009 to 93 in 2010. While we conducted 20 fewer campaigns with consumer brands during the period and 11 fewer campaigns with media groups, we conducted 11 additional campaigns with mobile carriers, as part of our strategy to focus on larger campaigns, including those with mobile carriers.
Our mobile marketing revenues increased from €54.2 million in 2009 to €101.3 million in 2010, representing an 87% increase. This increase was driven by our enhanced focus on mobile marketing campaigns of greater size with leading carriers and media companies, specifically in Brazil (€6.9 million average revenue per campaign) and Africa (€1.2 million average revenue per campaign) in 2010, which, combined, accounted for
66
86% of our mobile marketing revenues in 2010. Our mobile marketing revenues increased from €37.8 million in 2008 to €54.2 million in 2009, representing a 43% increase, primarily due to increases in product push, loyalty and top-up campaigns.
Mobile entertainment
Our number of mobile entertainment subscribers increased from 19.2 million in 2009 to 19.3 million in 2010. This increase was due to greater investment in advertising and media costs in the Andean region (3.7 million new mobile entertainment subscribers) and Europe (0.1 million new mobile entertainment subscribers) and was partially offset by a decrease of 1.9 million mobile entertainment subscribers in the South Cone region. During the same period, average revenue per subscriber increased from €0.45 to €0.48. From 2008 to 2009, our number of mobile entertainment subscribers increased from 11.7 million to 19.2 million principally due to our increased investment in advertising and media costs in Brazil, where we acquired 4.6 million new mobile entertainment subscribers.
Our mobile entertainment revenues increased from €107.5 million in 2009 to €116.2 million in 2010, representing an 8% increase. This increase was mainly driven by the growth in the number of subscribers from 19.2 million in 2009 to 19.3 million in 2010 and a 42% increase in portal management revenues. Our mobile entertainment revenues increased from €87.3 million in 2008 to €107.5 million in 2009, representing a 23% increase. This increase was mainly driven by growth in Brazil (€3.1 million) and Mexico (€11.8 million). Increases in the mobile entertainment subscriber base in 2009 and 2010 were partially offset by a decrease in the average revenue per mobile entertainment subscriber from 2008 to 2009, which was primarily attributable to increased challenges associated with billing mobile entertainment subscribers as such subscriber base increased year-over-year.
Mobile money
Our total number of mobile money clients increased from 19 to 44 from 2009 to 2010. This increase consisted of 15 new mobile money clients in the Andean region, 4 new mobile money clients in Mexico and 4 new mobile money clients in the South Cone. During the period, our average revenue per mobile money client increased from €0.02 million to €0.03 million due to increased use of our mobile money services by end users. From 2008 to 2009 our number of mobile money clients increased from 1 to 19 due to our launch of mobile money services in Brazil (4 new mobile money clients during the period), the Andean region (4 new mobile money clients during the period), Eastern Europe and Central Asia (5 new mobile money clients during the period), the South Cone region (2 new mobile money clients during the period) and Mexico (3 new mobile money clients during the period).
Our mobile money revenues increased from €4.6 million in 2009 to €16.3 million in 2010, representing a €11.7 million increase. This increase was driven principally by the increased number of mobile payment transactions made by end users in Andean, Brazil and South Cone regions (an €8.3 million combined increase). In 2010, we increased the total number of clients who use our platform from 19 at December 31, 2009 to 44 at December 31, 2010. Our mobile money revenues increased from €0.2 million in 2008 to €4.6 million in 2009, primarily driven by a significant increase in the number of online merchant and other clients who contract to use our mobile money services and offer such services to end users as well as our entrance into the Mexico market in 2008 and expansion of mobile money service offerings there during 2009 (a €2.1 million increase). At December 31, 2008 we had one mobile money client, while one year later at December 31, 2009 we had 19 mobile money clients.
Our total number of mobile money clients increased from 19 to 44 from December 31, 2009 to December 31, 2010, while our average revenue per mobile money client also increased approximately 20% during the period. This change was due principally to increased allocation of marketing and technological resources to mobile money. The increase from one to 19 mobile money clients from 2008 to 2009 reflects our entry into the mobile money market in 2008, after which we began to establish mobile money service offerings and attract clients.
67
Operating expenses
| | | | | | | | | | | | | | | | | | | | | | | | | | | | | | | | |
| | | Year Ended December 31, | | | Change | | | Percent of Total Revenues | |
| | | 2010 | | | 2009 | | | 2008 | | | 2010 vs. 2009 | | | 2009 vs. 2008 | | | 2010 | | | 2009 | | | 2008 | |
| | | (€ thousands) | | | | | | | | | | | | | | | | |
Cost of service delivery | | | 117,318 | | | | 97,056 | | | | 65,059 | | | | 21 | % | | | 49 | % | | | 50 | % | | | 58 | % | | | 52 | % |
Commercial and production costs | | | 76,025 | | | | 37,130 | | | | 35,292 | | | | 105 | % | | | 5 | % | | | 33 | % | | | 22 | % | | | 28 | % |
Personnel costs | | | 9,585 | | | | 8,758 | | | | 6,519 | | | | 9 | % | | | 34 | % | | | 4 | % | | | 5 | % | | | 5 | % |
General and administrative | | | 7,526 | | | | 6,980 | | | | 6,162 | | | | 8 | % | | | 13 | % | | | 3 | % | | | 4 | % | | | 5 | % |
Tax expenses | | | 3,263 | | | | 2,306 | | | | 2,150 | | | | 42 | % | | | 7 | % | | | 1 | % | | | 1 | % | | | 2 | % |
Amortization and depreciation | | | 4,225 | | | | 2,490 | | | | 1,605 | | | | 70 | % | | | 55 | % | | | 2 | % | | | 1 | % | | | 1 | % |
Provisions expense | | | 589 | | | | 405 | | | | 116 | | | | 45 | % | | | 249 | % | | | — | | | | — | | | | — | |
| | | | | | | | | | | | | | | | | | | | | | | | | | | | | | | | |
Total | | | 218,531 | | | | 155,125 | | | | 116,903 | | | | 41 | % | | | 33 | % | | | 93 | % | | | 93 | % | | | 93 | % |
| | | | | | | | | | | | | | | | | | | | | | | | | | | | | | | | |
Cost of service delivery
The increase in cost of service delivery in 2010 compared with 2009 was due mainly to the increase in our revenues during that period. As a percentage of total revenues, however, cost of service delivery decreased by 8 percentage points in 2010 compared with 2009. This decrease was due primarily to an overall increase the percent of total revenues generated from mobile marketing activities (from 33% to 43%), which generally are associated with lower cost of delivery. In connection with many mobile marketing campaigns and mobile money services we are generally able to negotiate better payout ratios with mobile carriers, compared with the typical mobile carrier agreements relating to our mobile entertainment activities. Thus, increasing mobile marketing activities allowed us to increase revenues while reducing costs of service delivery as a percentage of such revenues. Mobile carriers are increasingly approaching us to negotiate lower cost of delivery terms in exchange for an anticipated increase in network traffic, though in certain regions such as Brazil and the Andean region we expect continued pressure from carriers relating to cost of service delivery terms, particularly with respect to mobile entertainment services.
The increase in cost of service delivery in 2009 compared with 2008 was related principally to the increased volume of our activity. For example, from 2008 to 2009 we experienced a 64% increase in the total number of subscribers in connection with our mobile entertainment activities. As a percentage of total revenues, cost of service delivery increased by 6 percentage points in 2009 compared with 2008. This increase was due primarily to mobile carriers demanding more favorable fee structures in 2009 compared with 2008 and a corresponding increase in payments made to mobile carriers in 2009 compared with 2008.
Commercial and production costs
The increase in commercial and production costs in 2010 was due primarily to increased media costs associated with our revenue growth (€9.2 million), particularly in connection with mobile marketing activities. We also increased the average size of our campaigns, which generated an average revenue of €1.1 million per campaign in 2010 as compared with an average revenue per campaign of €0.5 million in 2009. Overall, commercial costs, representing 75% of our commercial and production costs in 2010, increased €29.0 million during the period, with €19.9 million of such costs associated with activities in Brazil where we had €7.7 million in media costs and €12.2 million in other commercial costs during the period. Production costs, which represented 25% of our commercial and production costs in 2010, increased by €9.9 million during the period, with €8.5 million of such costs associated with our activities in Brazil As a percentage of total revenues, commercial and production expenses increased by 11 percentage points. This increase was due primarily to expanding the array of mobile marketing services we offer and giving greater weight to these services in respect of our overall business efforts.
68
The increase in commercial and production costs in 2009 was due primarily to a €5.6 million increase in production costs associated with the growth of our revenues from 2008 to 2009, particularly in connection with 2009 revenues related to mobile marketing activities in Africa (€2.5 million) and mobile money activities in Brazil (€1.0 million). Commercial costs decreased €3.7 million from 2008 to 2009, with €2.8 million of such decrease associated with activities in Brazil where media costs decreased €1.1 million and other commercial costs decreased €1.7 million during the period. This decrease was due primarily to lower media acquisition costs stemming from our increased use of the Internet as a media channel and corresponding decrease in the use of more traditional and expensive channels such as TV and print media.
Personnel costs
The increase in personnel costs in 2010 stemmed principally from the overall growth of our operations and, in particular, from an increase in our headcount from 274 employees as of December 31, 2009 to 335 as of December 31, 2010 as we reinforced our sales and development teams in order to assert a stronger presence in the market. As a percentage of total revenues, personnel costs decreased by 1 percentage point. This decrease was due primarily to efficiency gains derived from the increased scale of our business. We expect to continue increasing our personnel costs as we grow our operations in terms of both geographies and services.
The increase in personnel costs in 2009 similarly stemmed principally from the increase in our headcount from 245 employees in 2008 to 274 in 2009. As a percentage of total revenues, personnel costs did not change significantly.
General and administrative
The increase in general and administrative costs in 2010 was due mainly to the increase in office expenses (€0.1 million), communications (€0.1 million) and external fees in connection with opening new offices (€0.4 million) in connection with expanding existing offices. Due to efficiencies derived from the scale of our operations and internal cost initiatives, as a percentage of total revenues, general and administrative costs decreased by 1 percentage point as compared with 2009.
The increase in general and administrative costs in 2009 was due mainly to the increase in travel expenses (€1.0 million) and rents (€0.3 million) associated with opening three new offices in 2009. This increase was in line with the overall increase in our activity during that year. As a percentage of total revenues, general and administrative costs decreased by 1 percentage point as compared with 2008.
Tax expenses
The increase in tax expenses in 2010 and 2009 was due mainly to a (€0.7 million) increase in federal taxes recorded in Brazil by our subsidiary Total Spin. Such taxes are based on sales and certain expenses generated in Brazil. During 2010 and 2009 our revenues in Brazil increased 54% and 50%, respectively, increasing the corresponding tax expenses during those years.
Amortization and depreciation
The increase in amortization and depreciation in 2010 was due mainly to a (€1.2 million) increase in amortization of capitalized costs in 2009 related to internally developed software used in our technology platform, which we began to amortize in 2010. As a percentage of total revenues, amortization and depreciation costs did not change significantly from 2009 to 2010, representing 2% of total revenues.
The increase in amortization and depreciation in 2009 was due mainly to a €0.5 million increase in the amortization of technology capitalized and a €0.4 million increase in the depreciation of administrative equipment recognized that year. As a percentage of total revenues, amortization and depreciation did not change in 2009 compared with 2008.
69
Provisions expense
The increase in provisions expense in 2010 was due principally to increased labor contingencies of approximately €0.1 million. As a percentage of total revenues, provisions expense did not change significantly.
The increase in provisions expense in 2009 was due mainly to a €0.3 million increase in the tax contingencies provision. As a percentage of total revenues, provisions expense remained the same in 2009 compared with 2008.
Financial results
| | | | | | | | | | | | | | | | | | | | | | | | | | | | | | | | |
| | | Year Ended December 31, | | | Change | | | Percent of Total Revenues | |
| | | 2010 | | | 2009 | | | 2008 | | | 2010 vs.
2009 | | | 2009 vs.
2008 | | | 2010 | | | 2009 | | | 2008 | |
| | | (€ thousands) | | | | | | | | | | | | | | | | |
Finance income | | | 1,650 | | | | 139 | | | | 570 | | | | n.m. | | | | (76 | )% | | | 1 | % | | | — | | | | — | |
Finance costs | | | 2,576 | | | | 2,415 | | | | 1,500 | | | | 7 | % | | | 61 | % | | | 1 | % | | | 1 | % | | | 1 | % |
The increase in finance income of €1.5 million in 2010 was primarily due to foreign currency translation differences, principally related to Latin American countries, Portugal and Turkey (€1.3 million, €0.1 million and €0.1 million, respectively). Finance income during 2009 decreased by €0.4 million, or 76%, compared with 2008. This decrease was primarily the result of a €0.5 million decrease in foreign currency translation differences in 2009 compared with 2008, primarily related to Brazil.
The increase in finance costs in 2010 of €0.2 million resulted principally from foreign currency translation differences, principally related to Latin American countries (€0.6 million), which was partially offset by decreases in foreign translation differences in Europe (€0.4 million). Finance costs during 2009 increased by €0.9 million, or 61%, compared with 2008. This increase was primarily the result of a €1.2 million increase in other finance costs due to losses in associated companies. As a percentage of total revenues, finance costs remained substantially the same in 2009 compared with 2008.
Income tax expenses
| | | | | | | | | | | | | | | | | | | | | | | | | | | | | | | | |
| | | Year Ended December 31, | | | Change | | | Percent of Total Revenues | |
| | | 2010 | | | 2009 | | | 2008 | | | 2010 vs.
2009 | | | 2009 vs.
2008 | | | 2010 | | | 2009 | | | 2008 | |
| | | (€ thousands) | | | | | | | | | | | | | | | | |
Income tax expenses | | | 3,389 | | | | 1,676 | | | | 2,119 | | | | 102 | % | | | (21 | )% | | | 1 | % | | | 1 | % | | | 2 | % |
The increase in income tax expenses in 2010 compared with 2009 of approximately 102% was due mainly to the increase of our profit before taxes from €14.4 million for 2010 compared with €8.8 million for 2009. As a percentage of profit before income taxes, income tax expenses increased from 19% to 24% of profit before income taxes from 2009 to 2010, principally due to the deduction of €1.7 million of research and development-related tax benefits in 2009 compared with €0.8 million in benefits available for deduction in 2010.
The decrease in income tax expenses in 2009 of approximately 21% compared to 2008 resulted primarily from the deduction of €1.7 million of tax benefits granted by the Portuguese government, relating to research and development costs. As a percentage of profit before income taxes, income tax expenses decreased by 9 percentage points in 2009, compared with 2008.
70
Net income
| | | | | | | | | | | | | | | | | | | | | | | | | | | | | | | | |
| | | Year Ended December 31, | | | Change | | | Percent of Total Revenues | |
| | | 2010 | | | 2009 | | | 2008 | | | 2010 vs.
2009 | | | 2009 vs.
2008 | | | 2010 | | | 2009 | | | 2008 | |
| | | (€ thousands) | | | | | | | | | | | | | | | | |
Net income | | | 11,005 | | | | 7,164 | | | | 5,387 | | | | 54 | % | | | 33 | % | | | 5 | % | | | 4 | % | | | 4 | % |
The foregoing had the effect of increasing our net income by 33% from 2008 to 2009 and by 54% from 2009 to 2010. Such increases were generally due to increased revenues during such years and the efficiency gains derived from our increased scale.
Profit attributable to non-controlling interests
| | | | | | | | | | | | | | | | | | | | | | | | | | | | | | | | |
| | | Year Ended December 31, | | | Change | | | Percent of Total Revenues | |
| | | 2010 | | | 2009 | | | 2008 | | | 2010 vs.
2009 | | | 2009 vs.
2008 | | | 2010 | | | 2009 | | | 2008 | |
| | | (€ thousands) | | | | | | | | | | | | | | | | |
Profit attributable to non-controlling interests | | | 1,067 | | | | 930 | | | | (26 | ) | | | 15 | % | | | n.m. | | | | — | | | | 1 | % | | | — | |
The increase in profit attributable to non-controlling interests in 2010 compared with 2009 of approximately 15% was due primarily to €0.4 million of net income recorded by our Angola subsidiary, which is 49% owned by us and was partially offset by a €0.3 million decrease attributable to our subsidiary in Brazil. The €1.0 million increase in profit attributable to non-controlling interests in 2009 compared with 2008 was due primarily to €1.0 million of net income recorded by one of our Brazilian subsidiaries, Brasiltec.
Liquidity and Capital Resources
General
Our liquidity requirements relate primarily to working capital requirements, debt service and capital expenditures for the expansion and improvement of our networks. Until March 31, 2011, these requirements have been funded largely through funds generated from operations and bank borrowings.
Substantially all of our revenues are generated by our operating subsidiaries. Our operating subsidiaries around the world are subject to a variety of legal and regulatory regimes corresponding to the respective jurisdictions in which they operate, including different tax, foreign exchange control and corporate law regimes. We regularly in the ordinary course transfer funds from our operating subsidiaries to other group companies in the form of cash dividends, intercompany loans and intercompany charges in order to satisfy our operational liquidity needs. We have not historically experienced any material impediment to these transfers and we do not expect any local legal or regulatory regimes to have any impact on our ability to meet our liquidity requirements in the future. Nevertheless, it is possible that changes in local legal or regulatory regimes will be adopted that would limit the ability of our operating subsidiaries to transfer funds to us. If this were to occur, the geographic diversification of our business may help mitigate any impact of such changes.
We believe that our financial reserves will be sufficient to fund our anticipated cash needs for working capital, capital expenditures and debt service for at least the next 12 months. Our future capital requirements will depend on many factors, including our rate of revenue growth, the timing and extent of spending to support the expansion of sales and marketing activities and the timing of introductions of new services and enhancements to existing services.
71
Debt service
We have entered into loan agreements with a number of banks whereby we received long-term loans, due in monthly or quarterly installments. As of March 31, 2011 and December 31, 2010, 2009 and 2008, €13.7 million, €9.8 million, €10.2 million and €16.0 million, respectively, was outstanding under these agreements. The increase in loans outstanding during the first three months of 2011 is primarily the result of our purchase of €2.8 million of our common shares from certain minority shareholders during the period. The reduction in outstanding amounts through 2010 was achieved with cash generated from operations. Interest is payable monthly or quarterly at three month Euribor plus a spread of 1.5 to 3.00%.
In 2008, our outstanding debt was principally short-term and concentrated in one bank. In 2009, our outstanding debt was distributed among several banks and more than 80% of such debt had a maturity of between 3 and 5 years. In 2010 we further increased the maturity of our outstanding debt.
As of December 31, 2010, we had commercial paper programs with banks amounting to €9 million and overdraft financing of €4 million. As of March 31, 2011, €3 million was used under our commercial paper program, leaving €6 million available under the program. The commercial paper financing agreements may be utilized any time and are automatically renewed each year through 2013 and 2015. In the year ended December 31, 2010, we extended the term of certain commercial paper agreements, increasing the total aggregate facility amount from €7.0 million to €9.0 million. The overdraft agreements are also automatically renewed for terms of six and 12 months.
As of March 31, 2011, our debt less cash and cash equivalents amounted to €6.4 million.
72
The following tables sets forth information concerning our debt instruments outstanding at the periods indicated.
| | | | | | | | | | | | | | | | | | | | | | | | | | | | |
| | | | | | | As of March 31, | | | As of December 31, | |
| | | | | | | 2011 | | | 2010 | | | 2010 | | | 2009 | | | 2008 | |
Bank | | Debt Outstanding | | Date of
Maturity | | Total
Facility | | | Amount
Outstanding | | | Amount
Outstanding | | | Amount
Outstanding | | | Amount
Outstanding | | | Amount
Outstanding | |
| | | | | | | (€ thousands) | |
BBVA | | Bank loans 3 month Euribor + 1.50% | | November/12 | | | 2,000 | | | | 1,412 | | | | 2,000 | | | | 1,609 | | | | 2,000 | | | | | |
Banco BPI | | Bank loan 3 month Euribor + 2.00% | | November/14 | | | 500 | | | | 500 | | | | 500 | | | | 500 | | | | 500 | | | | | |
Banco Popular | | Bank loan 3 month Euribor + 2.50% | | October/13 | | | 1,250 | | | | 883 | | | | 1,250 | | | | 952 | | | | 1,250 | | | | | |
Barclays Bank | | 3 month Euribor + 1.80% bank loan | | October/12 | | | 2,000 | | | | 1,076 | | | | 1,785 | | | | 1,241 | | | | 1,893 | | | | | |
Banco Santander | | 3 month Euribor + 1.80% bank loan | | November/12 | | | 1,500 | | | | 1,000 | | | | 1,500 | | | | 1,000 | | | | 1,500 | | | | | |
Banco BPI | | Commercial paper 3 month Euribor + 1.75% | | renew every 6 months | | | | | | | | | | | | | | | | | | | | | | | 5,000 | |
Banco BPI | | Commercial paper 3 month Euribor + 1.75% | | renew every 6 months | | | | | | | | | | | | | | | | | | | | | | | 7,200 | |
Banco BPI | | Commercial paper 12 month Euribor + 2.4% | | September 2013 | | | 7,000 | | | | 3,000 | | | | | | | | — | | | | — | | | | | |
Millennium BCP | | Overdraft Program 1 month Euribor + 1.75% | | renew every 3 months | | | | | | | | | | | | | | | | | | | | | | | 350 | |
Banco Popular | | Overdraft Program 3 month Euribor + 1.75% | | renew every 3 months | | | | | | | | | | | | | | | | | | | | | | | 166 | |
Barclays Bank | | Commercial paper 12 month Euribor + 1.75% | | March 2014 | | | 2,000 | | | | — | | | | | | | | — | | | | — | | | | | |
Montepio | | Commercial paper 12 month Euribor + 2.50% | | renew every 6 months | | | | | | | | | | | 2,000 | | | | — | | | | 2,000 | | | | | |
Barclays Bank | | Overdraft program 3 month Euribor + 1.75% | | renew every 12 months | | | 1,000 | | | | 911 | | | | | | | | — | | | | — | | | | | |
Banco BPI | | Overdraft program 1 month Euribor + 3.00% | | renew every 3 months | | | 3,000 | | | | 398 | | | | 2,670 | | | | — | | | | — | | | | 2,532 | |
Banco Santander Rio | | Overdraft program effective month interest of 1,48% | | renew monthly | | | 100 | | | | 17 | | | | | | | | — | | | | — | | | | — | |
Banco BPI | | Guaranteed loans 3 month Euribor + 2.75% | | September 2016 | | | 2,000 | | | | 2,000 | | | | | | | | 2,000 | | | | — | | | | | |
Banco BPI | | Guaranteed loan 3 month Euribor + 1.75% | | June 2016 | | | 1,500 | | | | 1,500 | | | | | | | | 1,500 | | | | — | | | | | |
Banco BPI | | Guaranteed loan 3 month Euribor + 1.00% | | November 2014 | | | 1,000 | | | | 1,000 | | | | 1,000 | | | | 1,000 | | | | 1,000 | | | | | |
Banco Espirito Santo | | Other loans 3 month Euribor + 1.50% | | October 2011 – December 2011 | | | 124 | | | | 27 | | | | 49 | | | | 33 | | | | 61 | | | | 71 | |
| | Other overdraft | | | | | | | | | | | | | 137 | | | | | | | | | | | | | |
Millennium BCP | | Overdraft 1 month Euribor + 1.75% | | | | | | | | | | | | | | | | | | | | | | | | | 500 | |
GarantiBank | | Loan 7.76% | | December 2009 | | | | | | | | | | | | | | | | | | | | | | | 155 | |
| | | | | | | | | | | | | | | | | | | | | | | | | | | | |
| | | | | | | 24,974 | | | | 13,724 | | | | 12,891 | | | | 9,835 | | | | 10,204 | | | | 15,974 | |
| | | | | | | | | | | | | | | | | | | | | | | | | | | | |
| | Current portion | | | | | | | | | 4,332 | | | | 4,856 | | | | 2,521 | | | | 2,061 | | | | 2,684 | |
| | Non-current portion | | | | | | | | | 9,392 | | | | 8,035 | | | | 7,314 | | | | 8,143 | | | | 13,289 | |
| | | | | | | | | | | | | | | | | | | | | | | | | | | | |
| | | | | | | | | | | 13,724 | | | | 12,891 | | | | 9,835 | | | | 10,204 | | | | 15,974 | |
| | | | | | | | | | | | | | | | | | | | | | | | | | | | |
73
| | | | | | | | | | | | | | |
| | | Currency | | Interest Rate
nominal | | Face
Value | | | Carrying
Amount | | | Year of Maturity |
Balance at 1 January 2011 | | | | | | | | | | | 9,835 | | | |
New Issues | | | | | | | | | | | | | | |
Commercial Paper | | Euro | | Euribor + 2.4% | | | 3,000 | | | | 3,000 | | | September 2013 |
Overdraft program 3 month
Euribor + 1.75% | | Euro | | 3M Euribor + 1.75% | | | 911 | | | | 911 | | | renew every 12 months |
Overdraft program 1 month
Euribor + 3.00% | | Euro | | 1M Euribor + 3.00% | | | 398 | | | | 398 | | | renew every 3 months |
Overdraft program effective month interest of 1.48% | | Argentinian
Peso | | 18% | | | 17 | | | | 17 | | | renew monthly |
Repayments | | | | | | | | | | | | | | |
Other loans 3 month Euribor + 1.50% | | Euro | | 3M Euribor + 1.50% | | | (6 | ) | | | (6 | ) | | October 2011 – December 2011 |
Bank loans 3 month Euribor + 1.50% | | Euro | | 3M Euribor + 1.50% | | | (197 | ) | | | (197 | ) | | November 2012 |
Bank loan 3 month Euribor + 2.50% | | Euro | | 3M Euribor + 2.50% | | | (69 | ) | | | (69 | ) | | October 2013 |
3 month Euribor + 1.80% bank loan | | Euro | | 3M Euribor + 1.80% | | | (165 | ) | | | (165 | ) | | October 2012 |
Under our loan and commercial paper agreements we are required to maintain certain minimum financial ratios computed as follows:
| | • | | Equity to assets: ratio of (a) the sum of shareholders’ equity and shareholders loans to (b) total net assets less liquid assets. |
| | • | | Net debt to adjusted EBITDA: ratio of (a) the sum of all obligations owing to lending institutions, the face amount of any letters of credit, indebtedness owing in connection with seller notes and indebtedness owing in connection with capital lease obligations to (b) trailing 12-month adjusted EBIDTA. |
We were in compliance with these minimum financial ratios as of March 31, 2011 and December 31, 2010 and 2009.
Additionally our loan and commercial paper agreements contain certain non-financial covenants (see Note 23 to our consolidated financial statements). As of March 31, 2011, we were in compliance with all non-financial covenants contained in such loan and commercial paper agreements.
Capital expenditures
Our capital expenditures in 2008, 2009 and 2010 amounted to €5.3 million, €5.3 million and €6.1 million, respectively. Capital expenditures is defined as investment in fixed assets—tangible and intangible—such as technological equipment, motor vehicles and externally and internally developed software during a given period. For 2008, 2009 and 2010, a key focus of our capital investment has been the development of our internal platform that supports most of our business activities. We also invested significantly in hardware to support our operations. We do not intend to embark upon any significant capital expenditure programs during 2011, other than the continuous upgrade of our platform and continuous investment in research and development activities.
74
Cash flows
The following table summarizes our cash flows from operating, investing and financing activities for the periods indicated:
| | | | | | | | | | | | | | | | | | | | |
| | | Three Months Ended
March 31, | | | Year Ended December 31, | |
| | | 2011 | | | 2010 | | | 2010 | | | 2009 | | | 2008 | |
| | | (€ thousands) | |
Cash flows from (used in) operating activities | | | 149 | | | | (886 | ) | | | 11,289 | | | | 13,640 | | | | (683 | ) |
Cash flows used in investing activities | | | (1,204 | ) | | | (1,862 | ) | | | (5,399 | ) | | | (3,397 | ) | | | (5,370 | ) |
Cash flows from (used in) financing activities | | | 273 | | | | 1,631 | | | | (1,702 | ) | | | (7,666 | ) | | | 9,965 | |
Cash flows from operating activities
Cash flows from operating activities include collections from clients and end users, which are offset mainly by payments to suppliers, payments to personnel, and payments relating to income taxes. Cash flows from operating activities are the principal source of funding for our operations. Our cash flows from operating activities increased from €0.9 million used in operating activities for the three months ended March 31, 2010 to €0.1 million from operating activities for the three months ended March 31, 2011, due primarily to an increase in our net profit. Our cash flows from operating activities decreased by 17%, from €13.6 million for 2009 to €11.3 million for 2010, due primarily to the effects of longer payment terms for suppliers during 2009. Despite this fact, during 2010 we were able to improve our average collection period, converting 74% of our 2010 operating profit (€15.3 million) into cash flows from operating activities (€11.3 million).
Cash flows from operating activities were €13.6 million in 2009 compared with cash flows used in operating activities of €0.7 million in 2008, representing a 2,097% increase from 2008 to 2009, derived primarily from the implementation of a strict payment policy for suppliers pursuant to which we were able to negotiate longer payment terms. Also in 2009 there was an increase in the amount of cash received from clients and end users from €114.6 million in 2008 to €167.1 million in 2009.
Cash flows used in investing activities
The net cash flows from operating activities is the main capital resource for our investment activities.
For the three months ended March 31, 2011 and March 31, 2010, our net cash used in investing activities amounted to €1.2 million and €1.9 million, respectively; and for the years ended 2010, 2009 and 2008, our net cash used in investing activities amounted to €5.4 million, €3.4 million and €5.4 million, respectively. The payments were primarily for the acquisition of intangible assets and property, plants and equipment.
Cash flows from financing activities
For the three months ended March 31, 2011 and March 31, 2010, cash flows from financing activities amounted to €0.3 million and €1.6 million, respectively, which was used in financing our operations and planned investments. In 2010, net cash used in financing activities amounted to €1.7 million, which was used in the payment of interest and capital on loans as well as dividends paid by certain of our subsidiaries to minority interests. Cash inflow from financing activities in 2008 were €10.0 million, mainly from borrowings to finance our geographic expansion, which loans were repaid in 2009, generating an outflow of cash in finance activities of €7.7 million in 2009.
Net working capital
As of March 31, 2011, we had net working capital of €15.8 million compared with €19.0 million at December 31, 2010 and €11.3 million at December 31, 2009. The decrease during the first three months of 2011
75
was due to increased debt levels in connection with our purchase of our common shares for a total consideration of €2.8 million from certain minority shareholders during the period. The increase in working capital during 2010 was principally the result of an increase in trade receivables from €18.7 million in 2009 to €25.4 million in 2010, primarily due to the increase in our revenues during 2010. Trade receivables consist of outstanding amounts due from clients and mobile carriers, mainly for the services rendered by the company.
Net working capital as of December 31, 2008 was €14.2 million. The €2.9 million decrease from December 31, 2008 to December 31, 2009 was due principally to an increase in accounts payable from €12.9 million in 2008 to €16.5 million in 2009 and a decrease in trade receivables from €20.0 million to €18.7 million during the same period, primarily due to the implementation of several collections initiatives. Most of our revenues are generated using mobile carrier billing channels, which creates delays in receivables as we must wait for carrier statements and then follow country-specific invoicing practices. However, the fact that we receive substantially all of our revenues from the carriers themselves tends to reduce our number of bad collections below what it otherwise would be.
Off-Balance Sheet Arrangements
There are no off-balance sheet arrangements that have or are reasonably likely to have a current or future material effect on our financial condition, revenues or expenses, results of operations, liquidity, capital expenditures or capital resources.
Contractual Obligations and Commitments
Set forth below is a description of our contractual cash obligations as of March 31, 2011.
| | | | | | | | | | | | | | | | | | | | |
| | | Total(1) | | | 2011 | | | 2012-2014 | | | 2015-2016 | | | 2017 and Beyond | |
| | | (€ thousands) | |
Bank loans | | | 13,724 | | | | 6,440 | | | | 6,133 | | | | 1,150 | | | | — | |
Capital lease obligations | | | 1,871 | | | | 661 | | | | 1,210 | | | | — | | | | — | |
Operating lease obligations | | | 1,562 | | | | 501 | | | | 1,019 | | | | 41 | | | | — | |
| | | | | | | | | | | | | | | | | | | | |
Total | | | 17,156 | | | | 7,602 | | | | 8,362 | | | | 1,191 | | | | — | |
| | | | | | | | | | | | | | | | | | | | |
| (1) | Excludes interest obligations. |
Quantitative and Qualitative Disclosures about Market Risk
In the course of our normal operations, we are exposed to market risks including fluctuations in foreign currency exchange rates and interest rates. We prepare our consolidated financial statements in euro. However, we conduct our business in multiple currencies, including the euro, the Brazilian real, several other Latin American currencies and other currencies that pertain to the multiple different countries in which we operate. We currently sell our services in Brazil, in European countries that have adopted the euro and various other countries throughout the rest of the world that use other currencies. In 2010, approximately 12% of our revenue was in euro. In most countries our revenues and cost base are denominated in the same currency. In some countries, however, we face foreign currency transaction risks due to the fact that some revenues in such countries are denominated in a different currency than our cost base. Additionally, we are exposed to translation risks that arise from the fact that the financial records of our subsidiaries located outside the Eurozone are maintained in currencies other than the euro. Accordingly, changes in the relative value of such currencies against the euro can affect our consolidated financial results.
We are exposed to interest rate risk related to fluctuations in interest rates on our debt. Increases in interest rates will increase the cost of borrowing and our interest expense. We have not used any derivative financial instruments to manage our interest rate risk exposure.
76
Our financial obligations are primarily denominated in euros, and interest expense is generally calculated based on floating interest rates that are linked to Euribor. Based on our outstanding financial obligations as of December 31, 2010, a potential movement in Euribor by +/- 1% would result in an immaterial incremental interest charge and impact on our net income. Our accounts receivable and payable are non-interest bearing. Management monitors whether we have a level of cash and cash equivalents sufficient to cover our outstanding debt. As of December 31, 2010, we had borrowings outstanding of €9.8 million, and cash and cash equivalents of €8.6 million at such date.
Sensitivity information
A 10% change in the exchange of the euro against the following currencies would create an increase/(decrease) in our income statement and/or in our equity as shown below. This analysis is based on the foreign currency exchange rate variances that we considered to be reasonably possible at the reporting date. This analysis assumes that all other variables, such as interest rates, remain constant and ignores any impact of forecasted sales and purchases. This analysis is shown on the same basis for 2009, though the reasonably possible foreign exchange rate variances were different, as indicated below:
| | | | | | | | | | | | | | | | | | | | | | | | | | | | | | | | |
| | | December 31, 2010 | | | December 31, 2009 | |
| | | Earnings | | | Equity | | | Earnings | | | Equity | |
| | | +10% | | | -10% | | | +10% | | | -10% | | | +10% | | | -10% | | | +10% | | | -10% | |
| | | (thousands) | |
Argentine Peso | | | — | | | | — | | | | 122 | | | | (122 | ) | | | (33 | ) | | | 33 | | | | 108 | | | | (108 | ) |
Brazilian Real | | | 335 | | | | (335 | ) | | | 341 | | | | (341 | ) | | | 179 | | | | (179 | ) | | | 174 | | | | (174 | ) |
Colombian Peso | | | (4 | ) | | | 4 | | | | 197 | | | | (197 | ) | | | 31 | | | | (31 | ) | | | 162 | | | | (162 | ) |
Mexican Peso | | | (13 | ) | | | 13 | | | | (31 | ) | | | 31 | | | | (73 | ) | | | 73 | | | | (76 | ) | | | 76 | |
| | | | | | | | | | | | | | | | | | | | | | | | | | | | | | | | |
| | | 318 | | | | (318 | ) | | | 629 | | | | (629 | ) | | | 104 | | | | (104 | ) | | | 369 | | | | (369 | ) |
| | | | | | | | | | | | | | | | | | | | | | | | | | | | | | | | |
77
INDUSTRY
Industry Background
The mobile services industry is dynamic and characterized by a rapid rate of innovation. The number of mobile subscribers has grown significantly over the past ten years, and there has been a shift from subscribers demanding traditional voice and text-based services to demanding a wider range of data and content services. Mobile carriers require a system in which they can target information and marketing services toward individual subscribers while maximizing revenue and profits from these services. Content providers and marketers, facing significant competition, need platforms to help them reach end users. Mobile subscribers are faced with an ever-increasing number of options via an overwhelming array of delivery methods, but at the same time they continue to demand more from their mobile devices.
Dynamics Shaping the Industry in Which We Operate
Industry-wide dynamics
Latin America, Africa, and the Middle East are attractive macroeconomic environments.The macroeconomic environments in Latin America, Africa, and the Middle East are expected to provide attractive growth opportunities for businesses that operate in these regions. The overall populations and gross domestic products of these regions are expected to grow significantly faster than those of their Western peers, based on the historical information illustrated in the tables below. Additionally, the economic prospects of certain regions (for example, Brazil as indicated below) are expected to be buoyed by an expanding middle class, creating a larger population of consumers that are capable of purchasing goods and services from businesses in these regions.
| | | | |
| Population growth | | Real GDP growth | | Average monthly income |
| | |
| (‘10–’12 CAGR) | | (% real change per annum (2010) | | (Population split by income group in
Brazil) |
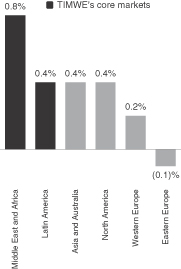 | | 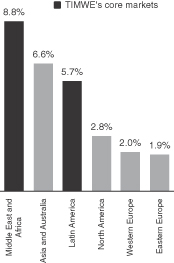 | | 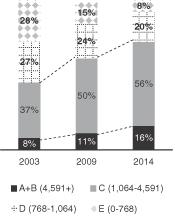 |
Source: Economist Intelligence Unit (2010E); Ministério da Fazenda Brasil (2010).
78
Mobile phones represent a large growth opportunity, particularly in emerging markets.While growth in the number of mobile subscribers historically has been driven by subscribers in developed markets, more recently it has, and in upcoming years it is expected to be, driven by mobile phone adoption in emerging markets. According to Analysys Mason (2011), in Central and Latin America alone, the number of cellular connections is expected to grow by more than 145 million to reach 726 million in 2016, while in the Middle East and Africa, the number of cellular connections is expected to grow by more than 500 million to more than 1.35 billion in 2016. As indicated by the following table, these regions represent large opportunities when compared with developed markets, such as Western Europe and North America.
(# of cellular connections in millions)
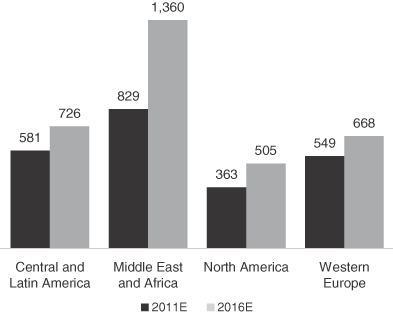
Source: Analysys Mason (2011).
Mobile subscribers in emerging markets rely on mobile phones for a wide range of services. In emerging markets, mobile phones are far more prevalent than personal computers and fixed line telephones. As illustrated in the chart below, according to the International Telecommunications Union (“ITU”) (2011), the ratio of mobile phone subscriptions to Internet access subscriptions is more than 3:1 as of December 31, 2010, while this ratio is less than 2:1 in developed markets at that date. ITU (2011) estimates that, in these emerging markets, mobile phone penetration is approximately 68% as of December 31, 2010, while Internet penetration is approximately 21% at that date. As a result, emerging market consumers have come to rely on mobile phones for a wide range of services, such as educational services, government information, and entertainment, that are less frequently delivered via mobile channels in more developed markets. As the number of mobile users in emerging markets increases and entrepreneurs continue to develop content-centric business models, revenue opportunities associated with mobile services are expected to continue to grow. For example, according to IDC (2010), consumers in “Rest of World” emerging markets (Latin America, Eastern Europe, Middle East, and Africa) consumed $8.1 billion of entertainment in 2010, and this number is expected to grow to $11.7 billion by 2014.
79
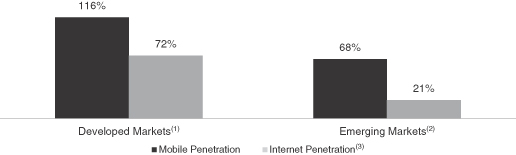
Source: ITU (2010).
| (1) | Includes data for UK, US, Germany, Canada and France. |
| (2) | Includes data for Brazil, Russia, India and Mexico. |
| (3) | Internet penetration calculated as number households with access to Internet divided by number of households. |
Mobile telecommunications providers are increasingly turning to partners to deliver next-generation services. We believe that mobile carriers are increasingly looking to find technology and service platform partners that can help them expand beyond their traditional voice services focus. According to Analysys Mason (2011), the percentage of data traffic (as opposed to voice traffic) on mobile carriers’ networks in emerging markets is expected to rise from approximately 59% in 2011 to approximately 90% in 2016, and carriers are looking for ways to capitalize on this shift. By offering new services (e.g., advertising, CRM, entertainment and information services), carriers can leverage their core assets to increase ARPU, reduce subscriber churn and provide a better user experience.
We believe, however, that mobile carriers generally lack the technological capabilities and expertise to offer these compelling services to consumers and other participants in the mobile data ecosystem because the mobile services ecosystem is highly complex, and because it is difficult to gain enough scale to justify required technology investments without expanding beyond a single carrier’s network.
Content and application providers need seamless technology and monetization solutions to reach consumers on mobile and across media platforms. The mobile data ecosystem is complex, highly competitive and evolving rapidly. As a result, content and application providers rely on monetization and technology solutions partners to reach the broadest possible base of consumers, to package their content and applications in a way that is easily accessible for these consumers, and to reduce the friction associated with purchasing their content and applications. By partnering with monetization solutions companies who have both global technology capabilities and local reach, content and application providers significantly increase their addressable user base and thus their revenues, while at the same time achieving significant cost savings.
In addition, we believe many traditional content providers such as global entertainment and media conglomerates or local TV companies need significant assistance to make their content accessible and to allow it to generate incremental revenues on both mobile and online platforms. As mobile has proven to be one of the few new media channels where content is monetizable with paid-for-services and pay-for-content, there is significant opportunity in helping these original content providers generate new revenue streams from their content.
Mobile marketing, advertising and nontraditional marketing channels are increasingly seen as critical for brands and organisations to build and deepen relationships with their customers. Organizations are increasingly looking for innovative, broad-reaching yet targeted, interactive and measurable ways to deliver their messages and deepen engagement with consumers. Mobile marketing and advertising represent strong new platforms for organizations to achieve these goals.
80
It is becoming increasingly difficult for organizations—mobile carriers, media companies, brands and governments—to reach, connect and bond with consumers. This is due to the increasing fragmentation of media consumption, the increasing personalisation of media consumption and communication, and the growth of new digital communication channels. Mobile marketing and advertising directly address these issues. Mobile phones provide the broad reach that these organizations want to capture, as well as the interactivity and location targeting to complement more traditional marketing and advertising channels. Mobile marketing and advertising offer highly targeted, cost-efficient one-to-one communication which allows these organizations to interact with customers in new ways, gaining valuable customer insights and increasing the probability of delivering the right message to the right customer at the right time in the right location. Lastly, mobile interactivity makes mobile highly measurable, providing marketers with a new way to manage the ROI of their broad reach campaign. These dynamics have driven the strong growth in mobile, online advertising revenues, which have grown from $337 million in 2008 to a run rate of almost $600 million per quarter as of September 30, 2010, according to IDC.
Mobile payments are growing rapidly, and are particularly well-suited for customers who lack access to financial services. The worldwide mobile payments market has evolved significantly in the recent years, and mobile handsets are now used for a variety of payment-related transactions. Mobile carriers are leveraging their large bases of paying customers to facilitate mobile payment purchases, a trend that is creating opportunities for mobile payment providers.
One of the drivers for this strong growth in mobile payments is that they are an attractive solution for customers who lack the means or desire to obtain banking/credit card services. For these consumers, mobile payments are often the only alternative to cash and potentially the only way to make online purchases. This makes mobile payments particularly well-suited for consumers in emerging markets, where, as illustrated in the following graphs, credit card penetration is 12% of the population, significantly lower than the penetration of mobile phones.
Mobile vs. Bank Accounts vs. Credit Cards
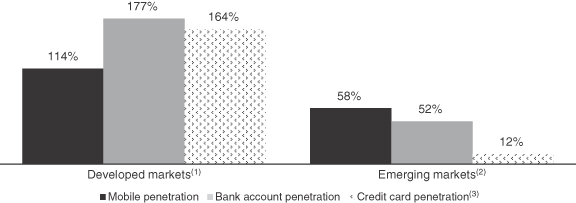
Source: ITU, Financial Access 2009 (Consultative Group to Assist the Poor, World Bank) Bank for International Settlements (December 2010).
| (1) | Includes 2009 data for US, Canada, UK, Germany and France. |
| (2) | Includes 2009 data for Brazil, Russia, India and Mexico with respect to mobile and bank account penetration. |
| (3) | Includes 2009 data for Brazil, Russia, India, China, Korea and Mexico within emerging markets category. |
Mobile payments are particularly well-suited for the purchase of online virtual goods. An example of this type of transaction is the popular game Farmville produced by Zynga, where consumers pay real money to purchase items in the game. In the emerging markets we target, where end users are generally less likely to have
81
credit cards, mobile payment offers an appealing value proposition to the purchaser and vendor alike. We believe end users in such markets will be more inclined to complete an online purchase when mobile payment is an available option. Higher conversion rates result in incremental revenue that can be shared among all participants in the mobile payments value chain, and are expected to help drive mobile payments for online virtual goods from $2.3 billion in 2010 to $10.1 billion in 2015, according to ABI Research (2010).
The emergence of smartphones is creating new opportunities for mobile carriers and their partners. While basic phone penetration is expected to grow rapidly in emerging markets over the next few years, smartphones also represent a large incremental revenue opportunity for mobile carriers and their partners. This opportunity will be driven both by the ability to sell apps (software applications sold through centralized app store marketplaces), and by the superior advertising inventory that smartphones enable. The market for these smartphone services is still in its infancy, with many large participants seeking to establish a position in this new ecosystem.
Mobile carriers possess the assets to capture a significant portion of the market for smartphone apps, especially in emerging markets that are characterized by low credit card penetration and a high percentage of customers on prepaid billing plans. In these markets, mobile carrier billing often is the only practical way for customers to purchase smartphone apps. In our view, this ensures that mobile carriers are likely to remain a key link in the app store value chain, and puts them in a strong position to operate their own app stores. These mobile carriers need technology partners to help them develop and operate app stores, but we believe they may be wary of working with large companies such as Apple or Google out of concern that such companies might attempt to marginalize carriers’ role in the new ecosystem. Thus, we believe that carriers are looking to independent, third-party technology platform partners to develop and operate their app stores, as these firms are more likely to facilitate a win-win situation for both parties. Emerging technology standards such as HTML5 are making it easier for these independent, third-party technology platform partners to offer compelling monetization solutions to partners and end users.
In addition to purchases of applications, the emergence of smartphones is expected to benefit mobile marketing and advertising companies. The incremental application usage, incremental browsing, and superior ad formats enabled by smartphones are expected to generate a sizable increase in high-quality advertising inventory that can be used to produce additional revenue via highly relevant, location-targeted ads.
82
BUSINESS
Overview
We are a global provider of mobile monetization solutions to mobile carriers, media groups, governments, nongovernmental organizations (“NGOs”), brand owners and content owners. We provide mobile marketing, mobile entertainment and mobile money services through our proprietary platform, which incorporates software-as-a-service technologies. We have connections to more than 280 mobile carriers, giving our clients access to a network of nearly three billion end users worldwide. We leverage this broad reach, along with our in-depth knowledge of local markets to facilitate the monetization and distribution of content and services that are tailored to local preferences. Our services allow end users to consume mobile entertainment, such as music and video, receive marketing and advertising messages and make mobile payments on-the-go and free from the constraints of traditional content, marketing and payment channels. We believe, based on feedback our regional managers receive from local mobile carriers, that we are the leading provider of these services in our core markets, including Brazil, Argentina, Colombia and Mexico. We have a proven track record of execution, growth and diversification, evidenced by both the double-digit organic revenue growth and the profitability we have achieved in each year since 2006.
Our primary focus is delivering our services in high-growth, emerging markets. We have grown 100% organically to become, based on feedback our regional managers receive from local mobile carriers, what we believe to be one of the largest providers of mobile solutions in Latin America and a global participant with 25 local offices and offerings in more than 75 different countries. Our core market is Latin America, where we generated 79% of our 2010 revenues and have local offices in 11 countries. Brazil is our largest market, accounting for 44% of our 2010 revenues. We also have offices and are rapidly expanding in a number of countries in Africa, the Asia Pacific region, Europe and the Middle East.
Our platform is used by clients and end users in connection with three principal activities: mobile marketing, mobile entertainment and mobile money. For the year ended December 31, 2010, we derived €101.3 million, €116.2 million and €16.3 million in revenues from mobile marketing, mobile entertainment and mobile money activities, respectively. In mobile marketing, mobile carriers, media groups, governments, NGOs and brand owners use our platform to leverage the convenience, prevalence and targeting capabilities of mobile telephones for marketing and communications purposes. Next, in mobile entertainment, our connections with mobile carriers and our highly scalable, easily adaptable technology platform give end users access to a broad array of third-party and proprietary mobile entertainment services and allow content owners to connect to a large end user base, which included nearly 20 million mobile entertainment subscribers as of December 31, 2010. Finally, mobile money clients and end users use our platform to leverage our connections with mobile carriers to facilitate easy, mobile-based billing solutions and micropayments for goods and services sold online.
Our business model puts us at the center of the mobile ecosystem, as we facilitate communications and transactions between mobile carriers, media groups, governments, NGOs, brand owners, online merchants, content owners and mobile end users. We believe that our central role allows us to leverage our scale and knowledge to deliver value to these stakeholders. Furthermore, we believe it positions us to benefit from the growth and evolution of this ecosystem as a whole.
83
We have achieved a strong record of growth over the past four years:
| | | | | | | | | | | | | | | | | | | | | | | | |
| | | Three Months
Ended March 31, | | | Year Ended December 31, | |
| | | 2011 | | | 2010 | | | 2010 | | | 2009 | | | 2008 | | | 2007 | |
Other Operating Data | | | | | | | | | | | | | | | | | | | | | | | | |
Mobile Marketing | | | | | | | | | | | | | | | | | | | | | | | | |
Number of mobile marketing campaigns | | | 30 | | | | 28 | | | | 93 | | | | 115 | | | | 51 | | | | — | |
Average revenue per campaign (€ thousands) | | | 420.6 | | | | 134.8 | | | | 1,089.5 | | | | 470.9 | | | | 741.8 | | | | — | |
Mobile Entertainment | | | | | | | | | | | | | | | | | | | | | | | | |
Number of mobile entertainment subscribers(1) (thousands) | | | 18,190 | | | | 18,765 | | | | 19,334 | | | | 19,175 | | | | 11,675 | | | | — | |
Average revenue per mobile entertainment subscriber (monthly)(€)(1) | | | 0.48 | | | | 0.48 | | | | 0.48 | | | | 0.45 | | | | 0.61 | | | | — | |
Mobile Money | | | | | | | | | | | | | | | | | | | | | | | | |
Number of mobile money clients
(at period end)(2)(3) | | | 49 | | | | 30 | | | | 44 | | | | 19 | | | | 1 | | | | — | |
Average revenue per client
(monthly)(€ thousands)(2) | | | 45.0 | | | | 32.2 | | | | 31.0 | | | | 20.0 | | | | 19.4 | | | | — | |
| |
| | | (in thousands) | |
Total revenues | | € | 47,384 | | | € | 34,600 | | | € | 233,851 | | | € | 166,241 | | | € | 125,339 | | | € | 67,813 | |
Mobile marketing revenues | | | 13,499 | | | | 3,774 | | | | 101,320 | | | | 54,154 | | | | 37,832 | | | | — | |
Mobile entertainment revenues | | | 27,264 | | | | 27,931 | | | | 116,185 | | | | 107,534 | | | | 87,274 | | | | 67,813 | |
Mobile money revenues | | | 6,621 | | | | 2,895 | | | | 16,346 | | | | 4,552 | | | | 233 | | | | — | |
Adjusted EBITDA(4) | | | 2,128 | | | | 1,665 | | | | 23,397 | | | | 16,317 | | | | 12,307 | | | | 6,496 | |
Net income | | | 243 | | | | 91 | | | | 11,005 | | | | 7,164 | | | | 5,387 | | | | 2,557 | |
| (2) | Represents the number of clients with whom mobile money contracts have been signed. |
| (4) | We define Adjusted EBITDA as net income plus income tax expenses, finance costs, finance income, provisions expense, amortization and depreciation and tax expenses. Please see “—Adjusted EBITDA” for more information and for a reconciliation of Adjusted EBITDA to our gross profit calculated in accordance IFRS-IASB. |
Our Strengths
High-growth, emerging markets focus
We provide mobile monetization solutions in emerging markets and have a strong presence in Latin America, including large countries such as Brazil, Argentina, Mexico and Colombia. Our expansion into Latin America began in 2005 when we opened offices in Colombia and Argentina, and since then we have expanded within Latin America, where we currently operate in 18 countries through 11 local offices. In 2010, 79% of our revenues were generated in Latin America, with Brazil, our largest market, accounting for 44% of our 2010 revenues. Our extensive footprint and experience in Latin America has made us a partner of choice for mobile carriers in the region, and our deeply embedded local relationships, including those with leading carriers such as Vivo, Movistar and Claro, give us access to a user base of more than 529 million end users throughout Latin America. More recently, we have leveraged our existing assets to expand into other emerging markets, such as those in Africa, the Middle East, the Asia Pacific region and Eastern Europe.
84
The emerging markets that we target have generally experienced faster economic growth in recent years than those of developed countries. For example, the Economist Intelligence Unit (2011) reported that GDP per capita in Latin America grew at a compound average rate of 5.7% during 2010, compared with just 2% in Western Europe during the same period. Such growth is expected to facilitate the growth of a middle class with more disposable income, contributing to a greater overall demand for mobile services. For example, the number of cellular connections in Central and Latin America is expected to grow by 145 million between 2011 and 2016, according to Analysys Mason Research (2011). The number of cellular connections in the Middle East and Africa is expected to grow by an even greater amount—531 million phones—over this same period. We anticipate that a rapidly growing subscriber base will generate demand for new mobile services and increase demand for existing mobile services. Moreover, individuals in emerging markets tend to rely more upon mobile channels for the delivery of and payment for mobile services such as ours than do people in more developed countries who have greater access to computers, broadband Internet and credit card and banking services. Thus, we believe that our focus on these emerging markets and our experience monetizing mobile channels puts us in a position to service this expected increase in demand and is one of the fundamental strengths of our business.
Dynamic and fast-growing mobile market
The market for mobile services is growing rapidly. For example, Macquarie Equities Research (2010) estimates that worldwide spending on mobile advertising will grow to $14 billion in 2015, compared with $3.5 billion spent on mobile ads in 2010. Similarly, the demand for mobile payment services is expected to increase significantly. For example, Gartner (2011) calculates that approximately $49 billion worth of mobile payment transactions were made worldwide in 2010 and estimates that that figure will increase to approximately $426 billion for 2015. We believe our experience in the mobile market and numerous connections with mobile carriers put us in a unique position to capitalize on this significant opportunity.
A global leader in mobile marketing and monetization
We believe we are one of the largest participants in the mobile marketing and monetization market worldwide, based on feedback our regional managers receive from local mobile carriers. With €233.9 million in total revenues in 2010 and organic revenue growth since our formation in 2002, we have grown with the mobile market and we now provide solutions that leverage our position as a market leader. We have billing connections with more than 280 mobile carriers, many of which have been in place for several years. Our global reach—with access to a network of nearly three billion end users—and our positioning in between mobile carriers, media groups, governments, NGOs, brand owners, content owners and end users, give us unique insights into industry trends and end user demands. We leverage these insights in order to deliver targeted and customized mobile marketing, mobile entertainment and mobile money services to end users, and we draw upon our local market insight, technological platform and experience to offer tailored strategies to our broad range of clients. We believe that these factors combine to create a self-reinforcing cycle that has contributed to the strong growth of our business: our large end user base tends to attract more content owners and marketers; more content owners and marketers tend to drive greater monetization; greater monetization tends to attract more mobile carriers; and more mobile carriers, in turn, tends to increase our end user base.
Scalable, cloud-based technology platform
Every area of our business draws upon our platform, which incorporates flexible, cloud-based, software-as-a-service technologies and spans multiple customer segments and channels. Proprietary technology powers our platform, allowing us to offer unique and differentiated solutions to our clients. In addition to being deeply integrated with the systems of more than 280 mobile carriers worldwide, our platform modules are also integrated with one another, across all our business activities and customer segments. Finally, with its highly scalable and modular architecture, our proprietary platform has given us the flexibility and agility we need to respond to the rapid growth and change that have been hallmarks of the mobile market. This design allows us to leverage our existing platform assets to build our business according to local demands and to deliver significant
85
benefits to our advertiser, content owner and media group clients, including time savings, revenue enhancement, ease of use and risk reduction, even within an evolving mobile ecosystem.
Local presence provides unique market insight and sustainable leadership
Our local presence enables us to deliver location-specific solutions along with targeted services. We have on-the-ground teams in 25 local offices and have created more than 50 local legal entities, each structurally tailored to meet local requirements. This presence provides firsthand insights into local culture, business practices and demographics and allows us to identify up-to-the-minute trends and evolving end user demand, which influence our marketing and targeting strategies in each of our distinct markets. Correspondingly, our ties to these markets enable us to respond to demands and trends we identify by sourcing and then delivering local content, tailored to the particular location, taking into account such factors as language and the predominant handsets used in the area. Additionally, our local focus has played a crucial role in the development and maintenance of lasting connections with mobile carriers, media groups, including broadcasters, as well as advertising agencies and media buyers who, themselves, frequently refer us to their own partners or affiliates in other regions, providing growth opportunities and broadening our reach. We draw on all these benefits to provide a range of monetization solutions to our clients that we believe only a company with such an extensive local knowledge and expertise could provide.
Multiple solutions provide value across the entire mobile value chain
Our cloud-based technology platform, our billing connections to mobile carriers worldwide and corresponding global presence, our local client and carrier relationships and our marketing and sales expertise are common features of each of our mobile marketing, mobile entertainment and mobile money activities. As we grow and devote resources to enhancing any one of these business activities, we also enhance the other business activities by virtue of strengthening our core assets and building upon our mobile monetization solutions platform.
Additionally, by drawing upon resources across our different business activities, we are able to create valuable synergies. For example, end user insights and industry trends that we learned as a providers of mobile entertainment have proven extremely useful to the design of mobile marketing campaigns. Similarly, the close relationships we maintain with mobile carriers in connection with both our mobile entertainment and mobile marketing business activities drive our mobile money activities.
We believe our portfolio presents an attractive value proposition to clients, whether for a single monetization solution or as a one-stop shop for multiple solutions in the mobile value chain.
Best-in-class management with an outstanding track record of organic growth
We believe that our success can be traced to the experience and capabilities of our management team. With rich mobile market expertise, nuanced knowledge of local markets, a solid network of business relationships and a proven track record of diversification, internationalization and financial results, our management team has led TIMWE from an idea in 2002, to a large, innovative, global participant in the fast-moving and highly competitive mobile industry.
Our close relationships with key clients give us early insights into new business opportunities and facilitate our expansion into new markets. By drawing on our existing assets—our relationships, adaptable technology and experience—our management team has guided our expansion into new geographical and service markets effectively and without resorting to acquisitions.
86
Business Strategy
Reinforce our leading position in current, attractive markets
We believe, based on feedback our regional managers receive from local mobile carriers, that we are one of the leading providers of mobile entertainment and mobile marketing services in Latin America, and our historical presence there dates back to 2005. We intend to continue to reinforce our position in our historic stronghold and use our market position to capitalize upon new opportunities, whether in the form of increasing the penetration of our existing monetization solutions or strategically rolling out new services. For example, with Brazil slated to host the World Cup in 2014 and the Olympic Games in 2016, we believe we are ideally positioned to take advantage of the media attention, growth and related opportunities these events are expected to bring, and we are already working with clients to develop related strategies. In addition, we have identified what we believe to be strong growth prospects in each of our business areas that we intend to pursue in our effort to sustain our leading position in Latin America. For example, we have already developed initiatives to capitalize upon location-based chat in our mobile entertainment area, we are focusing on creative solutions for media group and government clients in mobile marketing and in mobile money we are preparing to participate in the expected growth of in-app payments.
Expand into new geographies
We intend to follow our historical business model and expand our current offerings into new, emerging markets where we see high-growth potential. By focusing on geographies such as Africa and the Middle East in particular, and also Asia and Central and Eastern Europe, we can leverage our scalable, cloud-based distribution platform technology and participate in the anticipated growth in demand for mobile services in these markets. In Latin America, we aim to draw upon the experience we have in successfully establishing a strong presence in countries such as Brazil, Argentina and Mexico in order to pursue parallel growth opportunities in smaller markets in Latin America where we do not yet have a footprint, as well as enhance our presence in markets such as Puerto Rico, Ecuador and Nicaragua. We see opportunities in Africa and the Middle East—regions that are characterized by low mobile services penetration—and particularly, in countries such as Nigeria and Pakistan, to build a strong leadership position and participate in the expected rapid growth in these markets. Finally, in Asia, we intend to work to grow our existing operations in countries such as Malaysia, Indonesia and Vietnam.
Increase penetration of high-potential customer verticals
In addition to capitalizing upon existing offerings and territories, we believe we have a substantial opportunity to increase our penetration into new verticals, namely those of government/NGO and consumer brand clients.
We currently provide services to government entities and NGOs and we see significant potential for future growth in partnering with government entities and NGOs who wish to leverage the cost-effectiveness, convenience and targeting capability of mobile, digital channels to offer solutions such as awareness campaigns, information services, surveys, support to remote populations and information requests. For instance, in 2010 we worked with the ColombianAgencia Presidencial para la Acción Social y la Cooperación Internacional(“Acción Social”) to design a campaign aimed toward fostering the economic development and social inclusion of vulnerable groups in Colombia who were plagued by poverty, drugs and violence. Leveraging the mobile communication channel, we created a bulk SMS and SMS-based chat service to enhance interactivity between Acción Social and these target groups. End users in these groups were delivered important information concerning government services while Acción Social employed social workers to respond to SMS-based queries in real time. Acción Social was able to communicate with more than 1.2 million individuals—many of whom reside in remote locations—and register their information in its database in order to continue fostering the development of these groups.
We also see significant potential in continuing to work with and develop solutions for consumer brand clients. Consumer brand owners invest considerable amounts in marketing efforts and communicating with
87
existing and potential customers. We believe that consumer brand clients who work with us can differentiate themselves from their competitors by delivering customized, targeted solutions—electronic coupons, loyalty-based discounts and pricing or other key information services—to a narrowly defined audience and exploring new ways that mobile channels can facilitate interaction with their customers. For example, in 2010 we worked with Kellogg’s to develop a campaign for its Special K brand cereal. Leveraging our connections with several mobile carriers in Mexico, we created a Calorie Counter application to supplement Special K’s 15 Day Program initiative to connect with customers and underscore its image as a promoter of healthy lifestyles. More than 120,000 end users in Mexico downloaded the Calorie Counter application, increasing awareness of the Special K initiative and enhancing Kellogg’s relationships with its customers.
Deepen relationships with carriers and media groups
In addition to our numerous, solid relationships with mobile carriers, we have strong existing relationships with media groups, particularly television broadcasters and programmers. We see the potential to develop these relationships through loyalty programs and other innovative solutions that draw on our expertise and combine the power of the broad-reaching mobile and media channels. For example, by combining television advertisements with mobile text-based trivia and other games, we are developing with mobile carriers and media groups joint “anti-zapping” campaigns aimed at reducing the likelihood of viewers skipping or ignoring advertisements and at increasing traffic across the carriers’ networks. Given media groups’ and carriers’ relative lack of mobile marketing experience and scale, we believe that such partnerships could leverage our mobile monetization platform and the wide appeal of television in our markets and deliver significant benefits to our partners and us.
Exploit significant opportunity in the mobile money market
We see significant growth prospects in the mobile money market, and we believe that, with our billing solutions and micropayment services, we are well positioned to participate in such growth. For instance, Gartner (2011) calculated that the total volume of mobile money payments was approximately $49 billion worldwide in 2010 and estimates that such volume will grow to approximately $426 billion in 2015. With our worldwide presence, numerous connections with mobile carriers in our territories and technological expertise, we believe that we can move up the value chain and offer our own brand of compelling micropayment solutions to capitalize upon growth in the mobile money market. By providing both billing and payment services, we can streamline the value chain for online merchants who wish to leverage our direct access to mobile carriers around the world and improve their economics.
Capitalize upon smartphone app opportunity
Our mobile carrier connections and access to a network of nearly three billion end users together with our mobile marketing and sales expertise lay the foundation for our initiative to use our existing technology platform to monetize and distribute mobile apps under our own brand—App Republic Plus—and as a white label service to mobile carrier and other clients. With App Republic Plus and our white label initiatives, we believe that we can offer advantages to each link in the smartphone app distribution value chain. Our ability to offer payment solutions benefits end users who, like the substantial majority of individuals in our target geographies, do not have access to credit cards or banking services. The billing connections we have with mobile carriers and our local presence in our markets, which allows us to service those carriers, provide the global footprint, large-scale access to end users and mobile payment solutions that are important to content owners and aggregators. Lastly, our capabilities address what we believe is a growing concern among mobile carriers that credit-card based app stores, such as those operated by Apple and Google, will cut them out of the app distribution value chain. We believe that our model for App Republic Plus and white label stores combined with our deep relationships with mobile carriers and expertise in developing and operating mobile monetization platforms positions us to monetize and distribute smartphone apps while delivering value.
88
Services
Mobile Marketing
We believe, based on feedback our regional managers receive from local mobile carriers, that we are one of the largest mobile marketing and advertising providers in the world in terms of revenues. We use our extensive, local-market information and our rich marketing expertise to deliver highly targeted advertisements through our proprietary technology platform. Unlike other advertising mediums, mobile marketing is broadly available on a 24/7 basis and can be narrowly targeted. Additionally, mobile marketing offers the benefit of interactive communication between the client and the end user. Finally, it is cost-efficient, its results are easy to monitor and measure, and it has targeting and profiling capabilities. According to IDC (2010), worldwide online mobile marketing revenue increased 710% from September 30, 2008 to September 30, 2010.
Our mobile marketing clients benefit from our relationships with more than 280 mobile carriers, which helps ensure a broad distribution of their message. Additionally, our local focus—with 25 local offices—helps clients to be confident that we understand the most effective way to deliver their message in their particular area of focus. We design campaigns, ranging from mobile marketing strategy campaigns to performance-based initiatives to loyalty programs, for clients who wish to leverage our local expertise and advertising experience. Mobile carriers also benefit from our intimate knowledge of our end user base. In Latin America, for instance, prepaid phone service accounts for more than 80% of all mobile users (according to the World Cellular Information Service (2011)), which means that there is little consumer information available to mobile carriers because prepaid users need not provide the detailed billing and other information that would be required of a monthly subscriber. Prepaid end users who use our services, however, typically provide such nonpersonal information as their location, gender, and age range, as well as their interest in the particular service they are using, allowing us to identify key market and demographic trends. Our expertise and experience in organizing and employing such information allows us to explore opportunities that may not be cost-efficient for mobile carriers to explore themselves and makes us, we believe, a valuable partner to those carriers who either wish to market their own services or enhance their interactions with their user base. Additionally, in Brazil we have our own in-house ad placement agency, which results in significant cost savings in purchasing advertising media.
Four principal types of clients use our platform for mobile marketing services, each of which is discussed below: mobile carriers, media groups, governments and NGOs, and brand owners.
Mobile Carriers
We have been able to offer mobile marketing services to some of the leading carriers in their respective markets, such as Telefónica, America Movil, Oi, TIM Brasil and Tigo (who represented our top five mobile marketing mobile carrier clients in terms of revenues for the year ended December 31, 2010).
These mobile carriers use our marketing experience, intelligence, expertise and knowledge of consumer behavior to deliver highly targeted campaigns to their subscribers aimed at increasing and better understanding their subscriber base. Examples of the types of campaigns we offer include:
| | • | | Profiling: designed to build a representative database of subscribers, identify important market trends and enable mobile carriers to enhance their relationships with their subscribers, improving customer satisfaction, ARPU and loyalty. |
| | • | | Top-up campaign: designed to improve ARPU by rewarding customers who top-up with chances to win prizes. |
| | • | | Product push campaign: designed to increase the consumption of a specific service by rewarding subscribers who purchase them with chances to win prizes and often encouraging them to opt in to including their information in the mobile carrier’s database of subscriber information, which can be used in subsequent communications and may, with permission, be marketed to third parties. |
| | • | | Loyalty programs: designed to connect with subscribers through campaigns that award points, which can later be exchanged for certain of the carrier’s services. |
89
Media Groups
We provide mobile marketing solutions to some of the largest media groups worldwide. Strategic relationships with media groups such as Globo, Record, TPA, SIC and Caracol (who represented our top five mobile marketing media group clients in terms of revenues for the year ended December 31, 2010) leverage our access to a large network of end users in order to provide custom-tailored campaigns that include:
| | • | | Contest to win campaigns: encourage end users to participate to win prizes and facilitate one-on-one interaction between media group clients and end users. |
| | • | | Text to screen: an interactive TV format enabling audiences to send text messages from their mobile devices to a system which moderates broadcasted content. |
| | • | | Mobile voting: a one-way service that enables mobile users to express their opinion regarding a predefined topic by responding according to a list of predefined choices. |
| | • | | Opt-in campaigns: designed to encourage viewers to opt in to including their information in the client’s database of customer information, which can then be used in subsequent communications and may, with permission, be marketed to third parties. |
| | • | | Profiling:designed to construct a representative database of customers, identify important market trends and enable clients to enhance their relationships with their customers, with the aim of improving customer satisfaction and loyalty and increasing the client’s customer base. |
Our technology platform offers media group clients the opportunity to consolidate their mobile marketing needs into one contact point, thereby relieving them of the need to negotiate and contract with multiple different mobile carriers in their target markets.
Governments and NGOs
Our platform has proven useful to government entities and NGOs such as Acción Social (Colombia) and Secretaria de la Salud (Mexico) (who represented our top two mobile marketing government and NGO clients in terms of revenues for the year ended December 31, 2010) in delivering important information to citizens in target regions. Some of the services we provide to government entities and NGOs include:
| | • | | Corporate SMS: government entities are able to provide information services pertaining to key subjects (e.g. weather forecasts and the availability of social services); government entities are able to deploy mass information campaigns to citizens (e.g. information regarding natural catastrophes, new regulations, elections and foreign relations); and governments are able to communicate with citizens in remote locations with more effectiveness and speed than historical alternatives. |
| | • | | Mobile surveys: government entities can collect citizen data for government databases (e.g. statistical, social security and tax authorities). |
| | • | | M-Learning: government entities can offer educational content to citizens to provide the necessary information needed to complete regulatory procedures, such as tax filings. |
| | • | | Mobile chat services: end users can send an SMS to a short number to initiate an interaction with a selected government entity, which can provide consultations or information pertaining to temporary services in specific locations, or reply to information requests from citizens. |
We offer government entities and NGOs the ability to distribute their targeted messages or information services both more effectively and economically than traditional channels of communication utilizing a connection channel, the mobile telephone handset, that is widely available even in remote areas and among lower income populations.
90
Brand Owners
Our mobile marketing distribution platform gives our brand owner clients such as Blue, Mundiarroz Cigala, Cinemex, Pfizer and Coca-Cola (who represented our top five mobile marketing brand owner clients in terms of revenues for the year ended December 31, 2010) the opportunity to increase their brand awareness, reinforce key messages and enhance their relationships with customers via interactivity. Some examples of mobile interactive campaigns we offer to brand owners include:
| | • | | Contest to win: campaigns aimed at fostering one-on-one and interactive communication between brands and end customers in which customers participate to win prizes. |
| | • | | Mobile applications: through a mobile application tailored to the brand owner we provide a comprehensive and integrated marketing solution specially designed and customized to the strategy, goals and marketing mix of brands. |
| | • | | Loyalty programs: designed to connect with the brand owner’s customers through campaigns that award points, which can later be redeemed for prizes; such programs are also aimed at encouraging users to opt in to the client’s customer information database, which can subsequently be leveraged in additional marketing efforts. |
| | • | | Sales incentive: Web tools for companies seeking to foster sales effectiveness by leveraging the immediacy and constant, 24/7 availability of the mobile channel to communicate and interact effectively with vendors. |
Revenue Model
Our arrangements with all four of our primary client types in connection with our mobile marketing activities share similar revenue flow features and can be broken down into two categories: push-oriented campaigns and pull-oriented campaigns. In connection with push-oriented campaigns, we typically charge the client a fee for creating and executing the mobile marketing campaign. In pull-oriented campaigns we typically distribute the campaign on behalf of the client and share in a percentage of revenues generated by the campaign and collected from end users by the mobile carrier. The percentage of revenue we receive is typically based on the number of SMS messages the campaign generates and in some cases we share our revenues with the client. For both push- and pull-oriented campaigns we occasionally negotiate agreements that include both a fee and a revenue-sharing component.
Product Pipeline
Given the fast-paced evolution of the mobile services market, in order to remain a leader in mobile marketing we continually pursue the most compelling industry trends and technological innovations. We believe our product pipeline is well-poised to capitalize on the anticipated increase in demand for mobile marketing services from mobile carriers, media groups, governments, NGOs and brand owners. We use our mobile marketing experience to design new, creative solutions that can be leveraged synergistically among key target verticals. For example, we are developing an “anti-zapping” service for media groups designed to encourage viewers to continue watching advertisements. In connection with such campaigns, clients leverage our connections with mobile carriers by enticing viewers to continue watching a particular channel with the prospect that a code will be revealed, which the viewer can redeem for a prize via an SMS message. For TIMWE, such innovative solutions not only provide value to the particular client for which they are tailored, but also, once developed, we can easily provide similar solutions to any of our other clients using the existing framework.
Mobile Entertainment
We believe, based on feedback our regional managers receive from local mobile carriers, that we are one of the leading providers of mobile entertainment services worldwide and the largest mobile entertainment provider in Latin America in terms of revenues. For the year ended December 31, 2010, we recorded €116.2 million in
91
revenues from mobile entertainment services. We had 11,675 thousand, 19,175 thousand and 19,334 thousand mobile entertainment subscribers at December 31 2008, 2009 and 2010, respectively. We consider an end user to be a mobile entertainment subscriber for a particular period if the end user has subscribed for our services and has not cancelled or been deactivated by us or the relevant mobile carrier prior to year-end. Subscribers are generally deactivated if they fail to pay amounts owed or do not use services for a prescribed period, which varies based on the mobile carrier and jurisdiction involved.
We operate in emerging markets where individuals generally have fewer channels through which to access mobile content than in more developed regions where increased access to broadband Internet, cable and satellite services and a higher prevalence of smartphones gives individuals a wider array of choices in accessing mobile content and services. We believe our technology platform, which is designed to be compatible across all makes and models of basic and smartphones, and our connections with more than 280 mobile carriers give us an early-entrant advantage in these markets and position us to take advantage of an anticipated increase in demand for these services in the future.
We believe that we stand out among other mobile entertainment services providers in our core markets by virtue of the breadth of both the content we can provide and the end user base to which we can provide it. Our numerous relationships with top global and local content owners along with our substantial repository of innovative, proprietary content make us an excellent partner for mobile carriers who wish to make locally tailored mobile content available to their subscribers, but who are not able to or do not wish to invest valuable time and resources either creating their own content or negotiating and then maintaining relationships with multiple content owners. Similarly, we believe that we are a valuable, one-stop intermediary for content owners themselves who wish to broadly disseminate their content without the burdens of negotiating and maintaining relationships with numerous mobile carriers, and designing a distribution platform that will function seamlessly across multiple mobile carriers and mobile phone makes and models.
Content Monetization
Our content monetization service uses our highly scalable, easily adaptable technology platform to deliver text and content services directly to end users through either a single transaction or a subscription billing arrangement. We offer end users a wide array of content, such as games, applications, music, videos, images and proprietary text services. We closely track industry trends and end user demand and our proprietary platform allows us to quickly adapt and deliver new content types as they are developed.
We also develop our own proprietary mobile entertainment content: principally text-based infotainment services. This diversification enhances our revenues and allows us to stay on top of industry trends and technological innovations so that our distribution platform remains a simple, yet powerful channel through which we can deliver our own or third-party mobile entertainment content.
Our content monetization transaction model typically involves an initial advertisement placed by us, which makes end users aware of the featured content and gives them the information they need to access it. For example, we may use our local knowledge and marketing experience to detect a significant demand for a new music video in a particular region. We would mobilize our local experts in that region and, depending upon the profile of the end user in that region, we may advertise the availability of this new content in any number of media outlets such as television, newspaper or the Internet (including the mobile WAP Internet) in the target market. Using the information presented in the advertisement, any end user can then access the content by sending a simple—typically 4- to 8-digit—SMS message. Seconds later, the music video is made available to the end user.
We leverage the mobile carriers’ already existing billing relationships with their subscribers to streamline our content monetization business. Many end users in the emerging markets we target use prepaid mobile phone plans. For example, in Latin America, more than 80% of mobile subscribers maintain prepaid arrangements for
92
mobile telephone service, according to the World Cellular Information Service (2011). When a prepaid end user purchases mobile content, the purchase is deducted from the end user’s prepaid account with the mobile carrier. By contrast, end users who maintain subscription arrangements with mobile carriers simply see their purchase reflected in their monthly bill. After taking out a percentage from the end user’s purchase price, the mobile carrier then delivers a cumulative payment to us, typically at the end of every month. Where we provide proprietary content, we keep the entire amount delivered to us. Where we deliver third-party content, we may pay the third-party content owner a fixed fee for the particular content and/or share in a percentage of revenues with the third-party content owner.
Portal Management
Mobile carriers are increasingly interested in providing their own mobile content portals in order to reinforce their brand, enhance revenues and retain customers. Our business was founded upon portal management services in 2002, and today our portal management clients can leverage our experience and technology to free them from the responsibility of day-to-day operations of their content portals. We offer mobile carriers and other portal providers the advantage of a turnkey solution from an experienced content provider with a proven, highly compatible distribution platform.
Our arrangements with portal management clients typically provide for a flat monthly fee for maintaining the portal, and a revenue-sharing agreement whereby we are compensated a percentage of the client’s total revenues generated by the portal, which percentage ordinarily is based on the number of downloads end users execute from the portal.
Product Pipeline
We intend to maintain our leading position in the mobile entertainment market by consolidating current services, entering into new geographies and staying on top of market trends. We believe we can grow our content monetization business by consolidating leadership in current strongholds and tapping into new, high-potential regions. Also, while our existing business capitalizes upon the prevalence of feature phones in our target emerging markets, we aim to position ourselves to participate in the growing popularity of smartphone-based services. In this regard, we intend to leverage our connections with mobile carriers and experience with creating local monetization solutions for clients by enhancing our own platform-neutral app store—App Republic Plus—for use with the latest smartphone technologies in addition to offering parallel white label app store services to mobile carriers and other clients. Additionally, we have strategies in place to develop our own content portal—Natta Player—and pursue location-based chat opportunities.
Mobile Money
We are an early entrant into the fast-growing market for mobile payments for virtual services. We provide billing solutions, which leverage our access to the billing systems of mobile carriers to facilitate transactions for consumer-facing micropayment providers. We also offer consumer-facing mobile-based micropayment solutions for online purchases. In 2010 our revenues related to mobile money services were €16.3 million and such services generated an average revenue of €0.3 million per online merchant or other mobile money client. Mobile payment services are particularly attractive in the emerging markets we target, as end users in these markets are generally less likely to have a credit card and more likely to have a prepaid mobile device plan in comparison to end users in developed markets.
Billing Solutions
We provide billing solutions to consumer-facing micropayment providers who wish to offer a mobile payment option to their customers by establishing billing connections with mobile carriers. We use our broad set of connections with mobile carriers to provide these micropayment firms with access to nearly 3 billion mobile subscribers, creating significant value for carriers, micropayment providers, and end users alike.
93
Micropayment Solutions
We have relationships with online merchants such as Habbo, Fotolog and Baddo (who represented our top three mobile money clients in terms of revenues for the year ended December 31, 2010) to enable the mobile payment for virtual goods offered in their web applications. For example, during an online social gaming session on Habbo’s website, an end user may be prompted with an on-screen notice informing her that a virtual good, such as a new roller skating rink or luxury bubble-bath for the enhancement of her virtual hotel, is available for $2.00 and providing an SMS number to which she can send an SMS message to authorize payment for the virtual good. If purchased, within seconds, she will receive a reply SMS message containing a code to be entered to unlock the feature and receive the virtual good.
In the emerging markets we target, where end users are generally less likely to have credit cards, mobile payment offers an appealing value proposition to the purchaser and vendor alike. We believe end users in such markets will be more inclined to complete an online purchase when mobile payment is an available option.
Revenue Model
Our mobile money service arrangements often provide that we charge clients an initial set-up fee for implementing the billing or micropayment solution. The mobile carrier then earns, with respect to each transaction processed using our billing or micropayment solution, a percentage of the transaction value, which it keeps, and the remainder of the transaction value is passed to us, of which we keep a percentage before passing the final amount to the virtual product provider. Connectivity service providers, if any, who are positioned before or after us in the revenue chain also keep a percentage of the transaction value.
Sales and Marketing
We leverage our unique, locally relevant monetization solutions portfolio across a localized sales force in order to maximize the penetration of our solutions in each of our markets. We believe our local, on-the-ground presence in the markets in which we operate is a critical element of our sales and marketing success. In addition to the close relationships we have with a broad set of local mobile carriers, media groups, governments, NGOs, brand owners and content owners, we are constantly working toward fostering new client relationships. New clients reach out to us via carefully planned interactions such as workshops, industry events and personal meetings. Also, potential clients occasionally contact us via our corporate Web site, various social networks, trade associations and referrals. Our most valuable tool in retaining clients is the quality of the services we offer, but we also work to maintain daily interaction with clients, share knowledge through invitations to workshops and social events. Finally, due to our close connections inside key clients, we are able to collect feedback and other insights in order to provide optimal solutions and attract new clients in similar markets and who face similar challenges.
At our worldwide headquarters in Lisbon, Portugal, we develop global sales and marketing strategies and solutions and then combine them with unique regional initiatives designed at each of our regional sales headquarters. Each regional sales headquarters then disseminates a clear, locally tailored strategy to the local offices in its charge and monitors performance by establishing monthly targets and collecting real-time feedback. Using our customer relationship management and sales force automation tools, our regional sales heads report results back up the chain and maintain regular contact with the management team at our worldwide headquarters. We believe that this system engenders continuous improvement, responds to changes in local markets, and leverages our numerous local connections by facilitating the organization and sharing of information across our entire worldwide footprint.
94
As of December 31, 2010 we had more than 142 full-time dedicated sales and marketing employees.
We categorize our clients and offer each category customized value propositions as follows:
| | • | | Mobile Carriers: we offer solutions enabling mobile carriers to reinforce their brand image, improve customer engagement and loyalty, boost ARPU and aggregate revenues, enhance their technology development and explore additional revenue streams. |
| | • | | Media Groups: we offer solutions enabling media groups to reinforce their brand image; connect to and acquire new audiences; interact, engage and understand their customers; improve upon customer loyalty; and monetize audiences and content. |
| | • | | Governments and NGOs: we offer solutions enabling government entities to facilitate access to public services, foster civic participation, interact in real time, impact and engage citizens and improve cost efficiencies. |
| | • | | Brand Owners: we offer solutions enabling brand owners to integrate the mobile channel into their marketing arsenal and reinforce their brand image, approach and acquire new clients, foster consumption and improve customer engagement and loyalty. |
Technology
We use a proprietary platform, which incorporates cloud-based and software-as-a-service technologies, to offer our mobile marketing, mobile entertainment and mobile money services. Our platform benefits clients in the following ways:
| | • | | Save time: our end-to-end platform’s flexibility allows us to implement and deploy new products, channels and Web sites quickly and easily. Additionally, the platform features Web-based administration and automated report generation streamlining processes across all business areas. |
| | • | | Improve revenues: clients using our platform pay a revenue share based only on the services that they use; in addition, built-in, real-time analytics help our clients optimize their online sales by aiding decision-making. |
| | • | | Flexible and user-friendly: our platform is multiformat, multilanguage, multichannel and multiprotocol, ensuring maximum flexibility; additionally, easy system administration and a Web-based client interface enhance user-friendliness. |
| | • | | Reduce risk:we build in system redundancies to our platform to ensure maximum uptime, offer real-time user status updates and employ a digital rights management layer. |
Our platform has the following technical characteristics:
| | • | | ~100% Proprietary: almost 100% of our platform has been developed in-house, which eliminates third-party dependencies and gives us greater flexibility and speed in adapting it according to business needs. |
| | • | | Robust: our platform complies with open standards and uses component technologies from key providers such as Java, PHP, Linux, MySql and Oracle, allowing us to, for example, process more than 5.5 billion SMS messages in 2010. |
| | • | | Integrated: our platform is connected and integrated with more than 280 entities, including mobile carriers, television channels, corporations and government entities. |
| | • | | Secure: our platform offers standard encryption options and complies with ITIL best practices to ensure high security, which is critical when integrating and providing services to multiple entities. |
| | • | | Proven: our platform has supported the successful delivery of services to clients and end users since 2002 and has been upgraded to meet market needs. |
| | • | | Modular: our platform is organized as a series of modules, which can work on a stand-alone basis or in an integrated fashion, making it easy and fast to build customized solutions. |
95
| | • | | Scalable: our platform is designed to be fully scalable, allowing the flexibility necessary to meet our demanding standards of quality and performance and supporting our projected growth into new activities and geographies. |
| | • | | Cost-Efficient: our platform is designed to run as a centralized hosting solution, maximizing cost-efficiency and ROI through the delivery of multiple service types simultaneously. |
| | • | | Performance: our software components were specially designed to deliver maximum performance; currently, we estimate that we can process up to approximately one billion SMS messages per month. |
| | • | | Isolated Environments: we can create and provide isolated execution environments for specific regions or projects using our modular architecture and virtual features. |
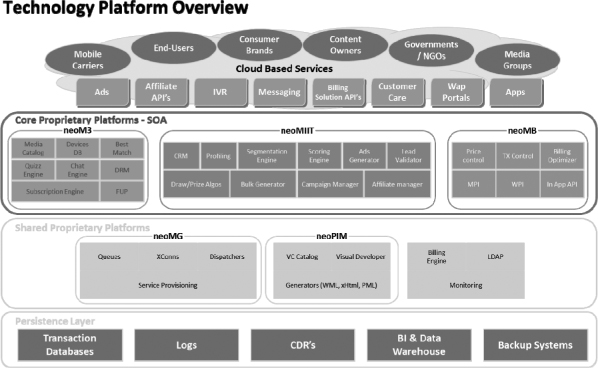
Our platform is comprised of the following modules:
Message Gateway Module: neoMG
neoMG is a proprietary carrier grade messaging gateway module that supports the routing of thousands of messages per second, between TIMWE and mobile carriers. The current installation configuration has 1,250 independent and isolated mobile carrier connections, supporting more than 5,000 SMS per second, with an average processing of 20 million SMS per day.
Mobile Marketing Module: neoMIIT
neoMIIT, a proprietary client resource management and mobile interactivity module for our mobile marketing activities, acquires data from end users and facilitates marketing intelligence, providing our marketing experts with detailed segment reports and databases that can be used to construct effective, targeted campaigns.
96
neoMIIT allows mobile carriers, media groups, agencies and brand owners to enhance revenues and profits by leveraging personalized or targeted interactivity to improve end user engagement and maximize cross- and up-selling.
Mobile Portals Module: neoPIM
neoPIM is a visual development tool for the creation of mobile sites. It allows nontechnical personnel to create and maintain mobile sites in Wap, XHTML or HTML5, with a visual, user-friendly and intuitive interface. It is fully integrated with the remaining TIMWE modules, which enables the development of mobile sites supporting mobile marketing, mobile entertainment and mobile money projects.
Mobile Entertainment Module: neoM3
neoM3, our proprietary module for our mobile entertainment business line, is a content management and delivery module that adapts, optimizes and delivers content based on the particular end user’s device. neoM3 enables delivery via SMS, MMS or WAP as well as the development of mobile content portals and the management of related client care services. neoM3 allows mobile carriers, media groups and other clients to grasp the mobile entertainment opportunity and generate extra revenue streams easily and quickly.
Mobile Money Module: neoMB
neoMB, our proprietary module for our mobile money business line, is an end-to-end platform that supports billing solutions and microbilling services. neoMB allows us to manage our relationships with clients and delivers valuable information, such as revenue and business generation statistics, to our mobile money clients. neoMB provides billing solutions clients the opportunity to enhance revenues by offering their services in geographies where they do not have direct connections to mobile carriers. neoMB also helps online merchants increase revenues by providing mobile phone-based payment options for end users who are unable or unwilling to use alternative payment methods online.
Research and Development
Our research and development efforts have been a cornerstone of our growth strategy and we expect to continue to devote significant resources to research and development as we develop our product pipeline along with new, innovative solutions. As of December 31, 2010 we had 127 full-time employees dedicated to information technology and research and development efforts worldwide. Such employees are spread across our global marketing group, our operations team at our headquarters and some are based at the TIMWE Lab, the core of our innovative research and development activities.
The TIMWE Lab, founded in 2009 and located in Covilhã, Portugal, is where we develop mid- and long-term product innovations, focused primarily on mobile, Web and interactivity solutions. We use our lab resources to identify new technologies and industry trends and promote interactions with the entrepreneurial and scientific communities. Recently, important innovations like our Natta Player content portal and NFC Launcher platform for smartphones have stemmed from the TIMWE Lab, and we are currently directing research and development efforts toward Android, iPhone/iPad and RIM compatibility, in-app payments, near-field-communications (NFC), and augmented reality. We invested €4.5 million in connection with research and development and information technology efforts in 2010 and we expect that such efforts, including those at the TIMWE Lab, will continue to be a key source of technological innovation.
Operations
We house the majority of our technology platform and content in a datacenter located in Lisbon, Portugal, owned and operated by Mainroad, a Portuguese company that provides datacenters to some of the leading mobile service providers in the industry and has a reputation of high performance and reliability within the industry. The datacenter has a Tier III classification awarded by the Uptime Institute and a power supply infrastructure that is classified as Tier IV, the highest possible classification.
97
All systems have redundancy in place and top-level support agreements with major suppliers such as Oracle, HP, Cisco and VMWare. TIMWE is also a member of Oracle’s Strategic Customer Program (SCP), giving us privileged support and responsibility in the evolution of high-end and innovative solutions such as Oracle Exadata.
Our platform operations follow industry-standard best practices and is supported by 24/7 monitoring teams, which allowed us to maintain an average uptime higher than 99.7% in the 12 months ended June 30, 2011.
As part of our disaster recovery initiative, we intend to establish an additional major datacenter outside of Portugal. Using Geo-Cluster architecture, we intend to share the service load of our activities between the new and existing datacenters while each one will serve as a backup for the other.
Competition
TIMWE competes with a large number of mobile solutions companies in the mobile marketing, mobile entertainment and mobile money areas. Most of the competition focuses on either one or two of these business areas. As far as the company is aware, there is no other company that offers the breadth of services in as many countries as TIMWE does, and we believe we provide a unique and highly differentiated solution to our clients and end users.
Given the nascent state of the market for mobile services and TIMWE’s geographical focus on Latin America and other emerging market regions, there are no reliable third-party data for the market shares of companies in TIMWE’s markets. However, we believe we are in the top three in each of our core markets and number one in Brazil, according to informal feedback we have received from our mobile carrier clients.
As a result of industry developments, some of our competitors may in the future create an integrated platform with features similar to ours. For example, Google, Inc. recently acquired Admob, Inc. and Apple, Inc. recently acquired Quattro Wireless, Inc., while larger companies such as Nokia, AOL, Microsoft and Yahoo! are beginning to enter the mobile market.
Mobile Marketing
In the mobile marketing market, we compete with companies that offer solutions that compete with single elements of our platform, such as mobile advertising networks, mobile ad serving and ad routing providers, mobile Web site and content developers, providers of mobile publishing and application development, SMS aggregators or providers of mobile analytics. We compete at times with interactive and traditional advertising agencies that perform mobile marketing and advertising as part of their services to their customers. We also compete with traditional media companies, such as television and newspaper companies, who offer their clients marketing services through their own media channels. Due to the wide and expanding range of our mobile marketing offerings, as we continue to develop innovative, new solutions we expect that the list of our competitors will continue to expand.
We believe there are a number of important factors to compete effectively in the mobile marketing market, including:
| | • | | strong mobile marketing expertise; |
| | • | | connections to mobile carriers; |
| | • | | local presence and end user insight; |
| | • | | scalable and highly reliable services; |
| | • | | service integration capabilities across a wide range of devices, networks and standards; |
98
| | • | | sufficient scale and operational efficiencies to be able to offer the most cost effective solutions; |
| | • | | high level of customer support; |
| | • | | ability to onboard a wide range of devices and content; and |
| | • | | adaptability to rapidly changing demand, technology and services external to our offerings. |
In Brazil, our largest mobile marketing market, we compete with mobile agencies such as F.biz and Pontomobi Interactive that design mobile advertising campaigns for their media group and brand owner clients.
We believe that our local presence in our target geographies along with the industry and end user knowledge that we derive from our other business activities give us significant advantages over companies that are devoted solely to mobile marketing or who do not invest the resources to establish a presence in local markets.
Mobile Entertainment
The mobile entertainment market continues to be competitive and fragmented. The widespread and rising adoption of open industry standards, rapidly changing technology trends and growing consumer demand have made it easier for new market entrants, existing competitors and nontraditional market participants to introduce new services that compete with ours. With the rapid growth and adoption of mobile data services, we expect competition to increase. As such, we believe there are a number of important factors needed to compete effectively in the mobile entertainment market, including:
| | • | | strong mobile entertainment expertise; |
| | • | | deep relationships with a broad set of international and local content owners; |
| | • | | connections to mobile carriers; |
| | • | | scalable and highly reliable services; |
| | • | | advanced user interface capabilities and end user insight; |
| | • | | knowledge and delivery capabilities across a wide array of content and applications; |
| | • | | service integration capabilities across a wide range of devices, networks and standards; |
| | • | | sufficient scale and operational efficiencies to be able to offer the most cost effective solutions; |
| | • | | high level of customer support; |
| | • | | ability to onboard a wide range of devices and content; and |
| | • | | adaptability to rapidly changing demand, technology and services external to our offerings. |
Our competitors include mobile device manufacturers, PC-based search engines, Internet portals and directories, and wireless service integrators.
In Brazil, our largest mobile entertainment market, we compete with companies such as Spring Wireless, which offers a wide range of interactive media delivery services to television and other media company clients and NeoMobile, the Italian-based media company which, through its Brazilian subsidiary Dindo, offers bundled services of content and SMS.
We believe that our numerous direct connections with mobile carriers along with our ability to offer billing and micropayment solutions combine to offer content owners a superior value proposition to that of many of our mobile entertainment competitors and also represent core assets that we can leverage going forward as we explore opportunities to establish our own content portals. Similarly, our broad set of relationships with owners of highly localized content allows mobile carriers to offer their subscribers the broadest selection of content, driving increased revenues and customer satisfaction.
99
Mobile Money
The mobile money market is nascent, rapidly growing, intensely competitive and characterized by rapid technological change. We compete with a number of companies, directly in the mobile-based online payments market, and indirectly with traditional payment methods such as credit cards, checks and money orders. In order to retain existing online merchants and other clients as well as end users and in order to attract new clients and end users, we must offer an attractive combination of the following factors:
| | • | | direct connections with mobile carriers’ billing platforms; |
We anticipate continued challenges from current competitors, who may enjoy greater resources, as well as by new entrants into the industry.
In Brazil, our largest mobile money market, we compete with companies such as Boku, which offers mobile payment services to its clients such as Facebook and Electronic Arts, and SpringWireless, which offers mobile payment and banking services to its corporate clients.
Many of our competitors have longer operating histories, significantly greater financial, technical, marketing, customer service and other resources, greater name recognition or a larger base of customers in affiliated businesses than we have.
Our connections with more than 280 mobile carriers allow us to offer mobile billing and micropayment solutions to individuals who do not have access to credit card or banking services. Particularly in the emerging markets where we operate, we believe our mobile billing and micropayment system has the potential to attract significantly more end users and also carrier clients (who want to avoid being cut out of the value chain) than the credit card-based systems of many of our competitors.
Seasonality
Our business is seasonal, with revenues generally lowest in the first quarter of the year and gradually building throughout the year, prior to beginning to level off or decline toward the end of the fourth quarter of the year as a result of the termination of seasonal campaigns, cash conservation and reduced activity around the Christmas and New Year holidays, which tends to carry over into the subsequent year as a result of Carnival holidays in Brazil and the summer season throughout Latin America, our primary market. Seasonal trends have historically contributed to, and we anticipate will continue to contribute to fluctuations in our quarterly results, including fluctuations in sequential revenue growth rates. Consequently, we believe period-to-period comparisons of our results of operations are not necessarily meaningful and should not be relied upon as indicative of future results. See “Risk Factors—Risks Relating to our Business—Our quarterly results of operations may fluctuate significantly due to several factors, some of which are not within our control. Fluctuations in our quarterly results may make period-to-period comparisons of our results of operations and financial condition difficult and could affect the market price of our common shares in a manner unrelated to our long-term operating performance.” and “Risk Factors—Risks Relating to our Business—Because we may not receive revenue from our clients in the period in which we incur costs associated with generating client agreements, including commercial and production costs associated with client acquisition, our expenses may not increase or decrease in direct proportion to our generation of revenue.”
100
Intellectual Property
We regard the protection of our developed technologies and intellectual property rights as an important element of our business operations and as important to our success. We rely primarily on a combination of trademark laws, copyright laws, trade secrets, confidentiality procedures and contractual provisions to protect our proprietary technology. Generally we maintain the rights to exploit all of the technology that is conceived by our employees during the course of their employment. The development of our technology and many of our processes are dependent upon the knowledge, experience and skills of key scientific and technical personnel. Neither our platform nor our platform modules are patented.
Proprietary
We consider the following proprietary trademarks as relevant to the development of our business:
| | • | | “NATTA!”: an international trademark, registered under the name of TIM we Ireland Limited, used in connection with content subscription services. |
| | • | | “MKTM Mobilising Brands”: an international trademark, registered under the name of TIM we Ireland Limited, used in connection with mobile entertainment and mobile marketing services. |
| | • | | “MIIT Multimedia Interactive Intelligence Technology”: an EU trademark, registered under the name of TIM we Ireland Limited, used in connection with interactive content, mobile marketing and customer support services. |
We are in the process of registering the following trademarks relating to our platform modules: “neoMG”, “neoMIIT”, “neoPIM”, “neoM3” and “neoMG”. Additionally, we are in the process of registering the “MCOIN” trademark relating to our mobile money smartphone services and a patent relating to our “NFC Launcher” smartphone software.
In addition to the above, we consider the following domains to be relevant to our business:
| | • | | “www.timwe.com”: our corporate Web site, where we disclose general information about TIMWE and our service offerings. |
| | • | | “www.natta.com”: our Web site devoted to our NATTA! player content portal and related services. |
| | • | | “www.mkt-m.com”: our Web site devoted to our MKTM Mobilizing Brands trademarked services, which include mobile marketing strategies and campaigns and mobile traffic-management and optimization initiatives. |
| | • | | “www.mcoin.com”: our website devoted to mobile money services, including payments within smartphone applications. |
Licensed
We have no material, third-party, licensed, intellectual property rights.
Employees
At December 31, 2008, 2009 and 2010 we had 230, 274 and 330 full-time employees, respectively. As of March 31, 2011, we had 377 full-time employees with:
| | • | | 168 in sales, marketing and business development; |
| | • | | 134 in research and development and information technology; |
| | • | | 70 in support, professional services and consulting; and |
| | • | | 5 in management and administration. |
101
Our goal is to attract, retain and motivate highly qualified technical, sales and management personnel, particularly highly skilled technical personnel and engineers involved in new service development and productive sales personnel. From time to time, we also employ independent contractors to support our research and development, marketing, sales and support and administrative organizations, though we do not employ temporary employees.
Facilities
We own no real estate. Our registered and principal executive offices are located at Avenida Infante Santo, 2H, 3º 1350-178, Lisbon, Portugal. Our principal leased facilities include:
| | • | | our headquarters facilities in Lisbon, Portugal, where we lease approximately 1,690 square meters; |
| | • | | the portion of the datacenter facility in Lisbon, Portugal, operated by Mainroad, where we house our technology platform and content; |
| | • | | regional headquarters located in São Paulo, Brazil, where we lease approximately 350 square meters; |
| | • | | regional headquarters in Bogotá, Colombia, where we lease approximately 300 square meters; |
| | • | | regional headquarters located in Istanbul, Turkey, where we lease approximately 220 square meters; and |
| | • | | regional headquarters located in Buenos Aires, Argentina, where we lease approximately 272 square meters. |
We believe that our premises are sufficient for our needs in the near future and that additional space will be available on commercially reasonable terms as needed.
Material Contracts
Mobile carrier agreement—Vivo (Brazil)
We have a mobile carrier agreement with Vivo, the largest mobile carrier in Brazil and South America, for the delivery and billing of our services to its subscribers. The agreement was signed between Vivo and TOTAL SPIN, our Brazilian operating subsidiary, on March 20, 2007 and, pursuant to the latest amendment, will terminate on March 19, 2012 absent a subsequent amendment.
The mobile carrier agreement sets forth general terms governing the relationship between the parties, such as events of breach, term and termination, as well as general obligations of both parties, including our obligation to deliver content. The specific service agreements sets forth the fees that the carrier is entitled to receive for billing and collection efforts relating to the specific services.
In the event of a breach by us, we will be responsible for a penalty equivalent to twelve times the amount of the average monthly invoice paid to Vivo during the three months prior to the breach. The agreement may be terminated by either party with 60 days’ written notice and may otherwise be terminated earlier in the event of either party’s bankruptcy, court-ordered reorganization or force majeure.
A copy of our agreement with Vivo is included as an exhibit to the registration statement of which this prospectus forms a part.
Data center agreement—Mainroad Information Technology
We have an agreement with Mainroad—Serviços em Tecnologias de Informação, S.A (“Mainroad”) for the provision of hosting, backup and data management services for our technology platforms. The agreement was executed on January 1, 2009 and remains in effect until December 31, 2011. The agreement automatically renews
102
for successive 3-year terms unless either party provides 180 days’ written notice of its intent not to renew. A material breach by either party of its obligations under the agreement may terminate the contract. Pursuant to the agreement, we are obligated to make monthly payments in the amount of €19,000 for services rendered and our failure to pay constitutes a breach of the agreement. Mainroad has agreed to provide certain service levels and its failure to provide at least 85% of such service levels during any given month constitutes a breach of the agreement.
A copy of our agreement with Mainroad is included as an exhibit to the registration statement of which this prospectus forms a part.
Legal and Administrative Proceedings
We are from time to time subject to claims and proceedings, including tax audits and related proceedings, arising in the ordinary course of our business. Furthermore, the mobile carriers and/or media companies with which we have agreements are also from time to time subject to claims and proceedings regarding the delivery and billing of our services. We are not currently subject to any such claims or proceedings that we believe could reasonably be expected to have a material and adverse effect on our business, results of operations or financial condition. Nevertheless, we are currently subject to several legal claims, the most significant of which are discussed below.
Argentina
We are party to a labor dispute brought by a former employee in October 2010 in the Labor Court of the City of Buenos Aires Number 57, alleging wrongful termination and inadequate compensation for the 2008, 2009 and 2010 fiscal years and seeking, among other things, damages totaling approximately €0.6 million. We believe such claims are without merit and intend to contest them vigorously.
Additionally, we are currently subject to three tax audits in Argentina. First, the Federal Government of Argentina (the “AFIP”) is currently auditing our tax returns for the 2007 and 2008 fiscal years in connection with questions the AFIP raised in connection with our treatment of certain value added taxes during those periods. We have provided the AFIP with all information requested in connection with this matter and are currently awaiting a response. Next, the Government of Ciudad Autonoma de Buenos Aires (the “CABA”) is currently auditing our treatment ofIngresos Brutos, which are type of sales tax assessed on gross revenues, for the period from January 1, 2005 through March 31, 2010. We are currently responding to information requests from the CABA in connection with this matter. Finally, our treatment ofIngresos Brutos from January 1, 2005 through March 31, 2010 is also being audited by the Gobierno de la Provincia de Mendoza. As of July 2010, we had provided all information requested by the Gobierno de la Provincia de Mendoza in connection with this matter and are currently awaiting a response. Due to the preliminary status of these matters we are unable to reasonably estimate the range of possible losses, if any, we may experience in connection with these audits.
Brazil
On December 1, 2010, the Brazilian Federal Public Prosecutor filled a class-action lawsuit against our Brazilian subsidiary, Total Spin Brasil Serviços de Telecomunicações Ltda. (“Total Spin”), and Globo Participações e Comunicações S.A. (TV Globo) before the 11th Federal Civil Court of São Paulo in connection with Total Spin’s participation in the marketing campaign “Torpedão Campeão”, alleging that misleading statements made in connection with the campaign caused collective damages to consumers and seeking R$7 million in restitution of amounts paid by consumers during the campaign and collective moral damages. On March 10, 2011, Total Spin submitted a challenge seeking to reduce the damages claim to R$0.1 million. On March 25th, 2011, Total Spin filed a response memorandum seeking full dismissal of the lawsuit. We believe the claim is likely to be dismissed by the court on the basis that a similar claim has already been dismissed by the court for lack of evidence in pretrial stages. We believe this claim is without merit and intend to contest it vigorously.
103
On July 13, 2011, we were notified of an additional claim brought by an individual against Total Spin in the Judicial Court of Rio de Janeiro in connection with the “Torpedo Campeão” campaign. The claim alleges that Total Spin did not deliver documentation required in order to participate in a contest in conjunction with the campaign. The claim alleges damages ranging from R$1 million to R$3.3 million. Total Spin is currently preparing its response memorandum. We believe that this claim is without merit and intend to contest it vigorously.
Regulation
Mobile services providers are subject to various laws and regulations depending upon the jurisdiction in which they operate and the range of services they provide. In addition, the application of existing domestic and international laws and regulations to mobile services companies such as ourselves can be unclear given the myriad issues our services can implicate, such as user privacy and data protection, pricing, advertising, taxation, gambling, sweepstakes, promotions, billing, consumer protection, accessibility, content regulation, quality of services, telecommunications, television and intellectual property ownership and infringement. Finally, the application to us of existing laws regulating or requiring licenses for certain businesses of our clients can be unclear.
We have recently experienced a significant increase in government regulation of our business, particularly in Europe, with an increased focus on regulations concerning consumer protection. Accordingly, it is possible that the trend toward strict consumer protection regulations would spread to other regions in which we operate where laws and regulations may be adopted, which could further restrict the mobile services industry, including laws and regulations regarding network management and device interconnection, lawful interception of personal data, taxation, content suitability, copyright, distribution and antitrust. We anticipate that regulation of our industry generally will increase, particularly with respect to consumer rights and privacy and that we will be required to devote legal and other resources to address this regulation.
The regulations we face predominantly relate to issues such as user privacy and data protection, advertising, gambling, sweepstakes, promotions and consumer protection. We include below a general summary of the regulatory issues that are most pertinent to our business within our principal markets:
Brazil
In Brazil, theAgência Nacional de Telecomunicações (“ANATEL”) asserts regulatory authority over the telecommunications (including mobile telecommunications) services sector. ANATEL has promulgated several consumer-rights-oriented regulations that include, among others: (i) rules relating to the manner in which consumers may be targeted for advertisements, and certain consumers, such as minors, who may not be targeted at all; (ii) requirements mandating transparency in mobile contract terms and consumer verification measures in connection with the purchase of subscription-based services. ANATEL may impose penalties at its discretion, ranging from R$60,000 to R$50 million per breach and can impose additional sanctions such as the suspension or revocation of the right to use certain short codes.
Additional consumer rights-focused regulators in Brazil such as theSistema Nacional de Defesa do Consumidor (“SNDC”), theDepartamento de Proteção e Defesa do Consumidor (“DPDC”)Instituto Brasileiro de Defesa do Consumidor (“IDEC”) andFundação de Proteção e Defesa do Consumidor (“PROCON”), have imposed regulations aimed at protecting mobile users’ personal data. Such regulations generally restrict the mobile carrier’s use of such data to billing purposes, restrict its transfer and give the mobile subscriber the right to access any of her personal data stored on the carrier’s database. These agencies are also responsible for policing SMS-related services to ensure that such services are not used in connection with child pornography, trafficking in human beings, dissemination of racist material or incitement to racial hatred, terrorism, or the sale, consumption or trafficking of illegal drugs. Finally, these Brazilian regulators monitor and restrict the use of
104
mobile telecommunications channels that facilitate gambling, including contests, games or competitions that involve an element of chance and offer prizes to winners. Such activities are generally prohibited absent a government authorization, which is generally expensive and time-consuming to procure.
Mexico
In Mexico, theSecretaría de Comunicaciones y Transportes, Comisión Federal de Telecomunicaciones (“COFETEL”) asserts regulatory control over the telecommunications (including mobile telecommunications) services sector. COFETEL has promulgated consumer-rights-oriented regulations that include, among others: (i) rules relating to the manner in which consumers may be targeted for advertisements and certain consumers, such as minors, who may not be targeted at all; and (ii) requirements mandating transparency of mobile contract terms, consumer verification measures in connection with the purchase of any subscription-based services and rules prohibiting clauses in contracts that are unduly burdensome for the consumer. TheProcuraduría Federal del Consumidor is the executive agency responsible for enforcing COFETEL regulations.
COFETEL itself has implemented regulations aimed at protecting mobile users’ personal data. Such regulations generally restrict the mobile carrier’s use of such data to billing purposes, restrict its transfer and give the mobile subscriber the right to access any of her personal data stored on the carrier’s database. These agencies are also responsible for policing SMS-related services to ensure that such services are not used in connection with child pornography, trafficking in human beings, dissemination of racist material or incitement to racial hatred, terrorism, or the sale, consumption or trafficking of illegal drugs. Penalties for violating personal data-related or SMS-related prohibitions include a range of fines and possible incarceration.
Argentina
In Argentina, theComissión Nacional de Comunicaciones (“CNC”) asserts regulatory control over the telecommunications (including mobile telecommunications) services sector. The CNC has promulgated consumer-rights-oriented regulations that principally relate to truth in advertising and require commercial communication to be true and not misleading.
Argentina’sDirección Nacional de Proteción de Datos Personales has implemented regulations aimed at protecting mobile users’ personal data. Such regulations generally restrict the mobile carrier’s use of such data to billing purposes, restrict its transfer and give the mobile subscriber the right to access any of her personal data stored on the carrier’s database. This agency is also responsible for policing SMS-related services to ensure that such services are not used in connection with child pornography, dissemination of racist material or incitement to racial hatred, terrorism, or the sale, consumption or trafficking of illegal drugs. Penalties for violating personal data-related or SMS-related prohibitions include a range of fines and possible incarceration.
In Argentina, theSecretaria de Industria, Comercio y Mineria dependiente del Ministerio de Economia y Obras y Servicios Publicos is responsible for policing gambling-related activities. In general, gambling activities are prohibited, including games of chance in connection with marketing efforts, except in limited circumstances where certain agency-promulgated requirements are met and approval is procured.
Colombia
In Colombia, theMinistério de Tecnologias de la Informacion y de las Comunicaciones (“Ministerio TIC”) asserts regulatory authority over the telecommunications (including mobile telecommunications) services sector. Service providers must apply for a registry within 90 days of beginning activity in Colombia. The Ministerio TIC maintains a Web site through which mobile users may opt to decline to receive mobile advertising messages. The Ministerio TIC may impose fines upon mobile advertisers who target individuals who have declined to receive advertising messages, and may also impose fines and other sanctions in connection with illicit advertising content, such as pornographic content.
105
Personal data must be collected and processed fairly and lawfully for specified, explicit and legitimate purposes. A mobile services provider can only collect personal data when such collection is (i) related to the function of the organisation collecting the information; (ii) directly related to the purposes of the collection; and (iii) strictly necessary to accomplish a lawful purpose. The Superintendence of Industry and Commerce and the Financial Superintendence are responsible for enforcing personal data protection regulations and may impose sanctions upon violators.
Empresa Territorial Para la Salud (“ETESA”) is the national regulator in Colombia responsible for policing gambling-related activities. Only entities specially authorized by ETESA may develop games of chance.
106
MANAGEMENT
Board of Directors
The Board of Directors of TIMWE is currently composed of eight members, each of whom is elected for a three-year term and may be reelected indefinitely.
The current members of the Board of Directors who are not “independent directors”—as such term is defined in the regulations of the Securities and Exchange Commission pursuant to Section 301 of the Sarbanes-Oxley Act—were elected at an Annual General Shareholders meeting held on June 19, 2009. The remaining current members of the Board of Directors were elected at the General Shareholders’ Meetings held on April 18, 2011 (Tomás de Mello and Bernardo Reynolds) and July 15, 2011 (Nuno Silvério), respectively. Pursuant to Portuguese law, the term for all of our current directors expires December 31, 2011. Notwithstanding the expiration of any director’s term, pursuant to Portuguese law, such director will remain a director of the company until the next Annual General Shareholders’ Meeting when directors may be relected or replaced. The following table presents information regarding the members of the Board of Directors.
| | | | | | |
Name | | Age | | | Position |
Diogo Ahrens Teixeira Salvi(1) | | | 42 | | | Chief Executive Officer and Chairman of the Board of Directors |
Ricardo Manuel Brás Calçado Carvalho(1) | | | 41 | | | Managing Partner and Director |
Paulo Jorge Passos Salgado | | | 38 | | | Chief Technology Officer and Director |
António Rafael de Brito Fouto(1) | | | 32 | | | Chief Financial Officer and Director |
Tomás de Mello Paes de Vasconcelos(2)(3)(4)(5)(6) | | | 53 | | | Director |
Martim Avillez de Azevedo Menezes | | | 42 | | | Director |
Nuno Silvério Marques(2)(3)(4)(6) | | | 55 | | | Director |
Bernardo Reynolds de Carvalho(2)(3)(4)(6) | | | 32 | | | Director |
| (1) | Member of the Executive Committee |
| (2) | Member of the Audit Committee |
| (3) | Member of the Compensation Committee |
| (4) | Member of the Nominating and Corporate Governance Committee |
| (5) | A “financial expert” as such term is defined in the regulations of the Securities and Exchange Commission pursuant to Section 407 of the Sarbanes-Oxley Act |
| (6) | An “independent director” as such term is defined in the regulations of the Securities and Exchange Commission pursuant to Section 301 of the Sarbanes-Oxley Act |
Biographical information concerning the members of our Board of Directors is set forth below.
Diogo Ahrens Teixeira Salvi
Diogo cofounded TIMWE and became its CEO in 2002. He is currently the Chairman of the Board of Directors and the Executive Committee. With wide experience in banking, Diogo was until 2001 closely involved in the strategic development of leading Portuguese banks, working closely with bankers and business consultants on well-known projects, including restructuring, innovation, internationalization and M&A projects. Recognized as a successful entrepreneur, Diogo was named one of the 50 Mobile Entertainment global leaders in 2009 and won the INSEAD Entrepreneurship Award for 2009/2010. Diogo has an MBA from Universidade Nova de Lisboa, a leading business school in Portugal.
Ricardo Manuel Brás Calçado Carvalho
Ricardo Carvalho cofounded TIMWE and became Managing Partner in 2002. He is also a member of the Executive Committee. Prior to working at TIMWE, Ricardo was an entrepreneur and an advisor in the digital and
107
technology arenas for 12 years. Ricardo owned and managed the sports web portalinfodesporto.pt, which he cofounded in 1996 and sold to Portugal Telecom in 2000. Between 2000 and 2003, Ricardo was strategic advisor to leading mobile marketing and entertainment firms. Between 2000 and 2001, Ricardo was a Board Advisor to the Portuguese media group Cofina, specializing in media, Internet and customer relationship management fields.
Paulo Jorge Passos Salgado
Paulo Salgado joined TIMWE as Chief Technology Officer in 2003. With extensive experience in IT and mobile business, Paulo worked for General Electric for five years (1996-2000) on workflow and reengineering projects. In 2000 he cofounded Movensis, a mobile marketing company, where he was responsible for research and product development, implementing some of the first SMS Bank services in Europe, several mobile marketing campaigns and an innovative pack of mobile-based products at that time, in the areas of marketing, interactivity and sales force automation. Paulo has a degree in IT Management from Universidade do Minho.
Antonio Rafael de Brito Fouto
António Fouto joined TIMWE as CFO in 2008 and is a member of our Executive Committee. Antonio has a solid background in telecommunications, having spent most of his career in Portugal Telecom, where he held various positions from 2001 until 2008. António first performed strategy and business development and, later, became the Finance Director of Portugal Telecom subsidiaries, responsible for finance, administrative, planning and quality control and assurance functions as well as commercial and client retention functions for almost two years. Additionally, António was a Board Member of PT Contact Cabo Verde. António has a management degree from Lisbon Catholic University.
Tomás de Mello Paes de Vasconcelos
Tomás de Mello Paes de Vasconcelos joined TIMWE as a director and Audit Committee, Compensation Committee and Nominating and Corporate Governance Committee member in 2011. Tomás is also presently a member of the Supervisory Board (since 2009) of BCP—Banco Commercial Português. Tomás has seven years of audit-related experience gained from working for Arthur Andersen LLP (from 1980 to 1987), and he has experience in the automotive sector, where he worked at Santogal Group (1987 to 1998) and the telecommunications sector, where he worked from 2003 to 2009 at Portugal Telecom, an NYSE-listed company, and served as a member of its audit committee and a “financial expert” as such term is defined in the regulations of the Securities and Exchange Commission pursuant to Section 407 of the Sarbanes-Oxley Act. Thomás graduated in 1980 from Lisbon Catholic University and has held a CPA degree since 1984.
Martim Avillez de Azevedo Menezes
Martim is a lawyer and a founding partner of CCA Advogados, responsible for the Technology, Media and Telecommunications (“TMT”) Department of the firm. He joined CCA Advogados in 1996 and has provided legal advice to several companies in the PSI 20 (Portuguese Stock Index) and assisted several firms in defining their strategic vision for their national and international operations. Due to his TMT experience, Martim is often invited to speak at major conferences and seminars on e-commerce, new technologies, intellectual property and media. Martim has a degree in law from Portuguese International University. CCA Advogados regularly advises TIMWE on corporate and other legal matters, and is acting as Portuguese counsel to TIMWE in connection with the offering.
Nuno Silvério Marques
Nuno joined TIMWE as a director and Audit Committee, Compensation Committee and Nominating and Corporate Governance Committee member in 2011. Nuno is a partner and board member at CIDOT—Estudio de Comunicação where he has worked since 2004. He is also a member of the board of directors and the audit
108
committee of ZON Multimédia where he has worked since 2007. He was also a member of the board of directors and the audit committee of Portugal Telecom Group from 2003 to 2006, a director and the chairman of Agille—Consultoria de Gestão from 2003 to 2010, a partner of Fundamentis, lda from 2000 to 2003, director and chief financial officer of Telecel/Vodafone from 1992 to 2000 and a director and board member of Quimigal—Quimica de Portugal Group from 1981 to 1991. He holds a bachelor’s degree and MBA from the Universidade Católica in Lisbon.
Bernardo Reynolds de Carvalho
Bernardo joined TIMWE as a director in 2011 and is a member of our Audit, Compensation, and Nominating and Corporate Governance Committees. Bernardo is currently a lawyer at CCA Advogados, where he has worked since January 2011, responsible for the International Corporate Department of the firm. From 2005 to 2010 Bernardo was a lawyer in Spain where he provided legal advice to several companies listed on the IBEX35 Spanish Stock Index and assisted several national and international firms in their international expansion, including major investments in the United States. Bernardo has a degree in law from Portuguese Catholic University in Lisbon and an LLM degree from Instituto de Empresa in Madrid. CCA Advogados regularly advises TIMWE on corporate and other legal matters, and is acting as Portuguese counsel to TIMWE in connection with the offering.
Executive Officers
The executive officers of TIMWE are responsible for the day-to-day management of our company.
The following table lists the names and positions of our executive officers.
| | | | |
Name | | Age | | Position |
Worldwide Executive Officers | | | | |
Diogo Ahrens Teixeira Salvi | | 42 | | Director and Chief Executive Officer |
Ricardo Manuel Brás Calçado Carvalho | | 41 | | Director and Managing Partner |
Antonio Rafael de Brito Fouto | | 32 | | Director and Chief Financial Officer |
Paulo Jorge Passos Salgado | | 38 | | Director and Chief Technology Officer |
Rui Antunes | | 37 | | EMEA & Asia Managing Director |
Catarina Azevedo | | 32 | | Human Resources Director |
Latin America Managing Directors | | | | |
Martin Zalaya | | 43 | | South Cone Managing Director |
Paulo Pessoa | | 41 | | Brazil Managing Director |
Antonio Alvarez | | 35 | | Mexico Managing Director |
Other Managing Directors | | | | |
Vikas Nambiar | | 39 | | Middle East Managing Director |
Rodrigo Azevedo | | 40 | | Angola and Mozambique Managing Director |
Biographical information of our executive officers and key employees who are not members of our Board of Directors is set forth below.
Rui Antunes
Rui Antunes joined TIMWE in 2009. Rui has extensive experience in the telecom industry, particularly in the mobile area, where he has held several international positions. During his ten-year career with Motorola from 1998 to 2007 he was responsible for various marketing areas, ranging from below-the-line to above-the-line advertising, strategy and operations across multiple countries and regions within Europe, the Middle East, Africa and India, and led all marketing operations by the time he left in 2007. Before joining TIMWE, he led HTC Corporation’s Europe, Middle East and Africa marketing group from 2007 to 2009 as it established itself as a
109
recognized leader in the smartphone space, and launched its worldwide brand. Rui holds an MBA from Lisbon Catholic University and has completed the Program for Leadership Development executive course from Harvard Business School.
Catarina Azevedo
Catarina Azevedo joined TIMWE in 2010. Catarina has ten years of experience in human resources management. Catarina worked at Kraft Foods from 2008 until 2010 and at Philip Morris from 2005 to 2008, holding a variety of human resources positions. Catarina is an expert in organizational design and development and talent management. Catarina is a certified trainer in project management, creativity and innovation training and leadership. Catarina holds a bachelor’s degree in Organizational Psychology and has completed a post-graduate degree in human resources management.
Martin Zalaya
Martín Zalaya joined TIMWE as the South Cone region General Manager in 2011. Martín has significant experience in consumer goods industries. Before joining TIMWE, Martín worked at Alicorp, a well-known consumer goods company in the South Cone region, where he was responsible for marketing, international business and R&D departments from 2000 until 2010. He has an accounting degree from Universidad de Belgrano, in Argentina.
Paulo Pessoa
Paulo Pessoa has been TIMWE Brazil’s General Manager since 2008. Paulo’s career has centered on the telecommunications industry, both in Portugal and in Brazil, where he has held strategic positions in marketing, business development and portfolio management. Before joining TIMWE, Paulo worked at Embratel, where he was marketing director from 2006 until 2008. Paulo has a degree in electronic engineering (telecommunications field) and an MBA from Universidade Nova de Lisboa.
Antonio Alvarez
Antonio Alvarez is TIMWE Mexico’s General Manager. Before joining TIMWE in 2007, he was involved in the development of the Mexican market, leading the commercial, legal and finance departments at Itouch Movilisto Group, where he worked for two years. Previously, he worked for ABG Consulting Mexico for eight years as a Commercial and Finance Advisor. Antonio has a summa cum laude degree in economics and finance and a Master’s degree in finance and commerce from the Instituto de Empresa, Madrid, Spain.
Vikas Nambiar
Vikas Nambiar has been the TIMWE Middle East General Manager since 2007. Before joining TIMWE, Vikas worked in the mobile division of LG Electronics from 2006 to 2007 and at Pantech from 2003 to 2006. Vikas has more than ten years of sales and marketing experience, five of which were dedicated to the Middle East telecommunications sector. He has strong international marketing and business development experience stemming from his posts in Australia, India and the Middle East. He holds an electrical and electronics engineering degree from Regional Engineering College, Calicut, India, and holds an MBA from Graduate School of Management, University of Western Australia, Australia.
Rodrigo Azevedo
Rodrigo Azevedo joined TIMWE in 2005 as the South Cone General Manager, and since 2007, he has been General Manager of the Angola and Mozambique regions. Before joining TIMWE, Rodrigo worked at Portugal’s largest mobile carrier—TMN—for nine years, where his last position was Direct and Indirect Sales Coordinator. He has a degree in corporate communication and marketing from Instituto Superior de Comunicação Empresarial, Lisbon, Portugal.
110
Compensation
For the year ended December 31, 2010, the total amount of remuneration (including salary and bonus) we paid to our non-director executive officers was €0.8 million, excluding certain bonuses in respect of 2010 that have yet to be determined and paid. Our directors received remuneration from us of €0.9 million in salary and bonus in 2010, also excluding certain bonuses in respect of 2010 that have yet to be determined and paid.
We have not set aside or accrued any amount of cash to provide pension, retirement or other similar benefits to our officers and directors. We are required by law to make contributions equal to certain percentages of each employee’s salary for his or her retirement benefit, medical insurance benefits, unemployment and other similar statutory benefits. We contributed an aggregate of approximately €0.2 million for retirement and similar benefits for our directors and executive officers in fiscal year 2010. None of our directors currently maintains a contract with us or any of our subsidiaries that provides for benefits upon termination of his employment with us.
We expect to pay certain directors, executive officers and other employees certain additional bonus cash compensation in connection with the completion of the initial public offering of our common shares. We expect to pay approximately 10 individuals an aggregate of approximately €4.4 million, which will be deducted from the gross proceeds of the offering. In addition, we agreed in July 2011 to award Antonio Fouto, a director and our Chief Financial Officer, rights to receive from us approximately 134,000 common shares in connection with the offering, which will vest over a three year period. We expect to record the corresponding expense over such vesting period in accordance with IFRS-IASB.
Incentive Plan
We have not historically had a stock option plan or similar executive compensation scheme. Compensation is divided into two principal components: (i) annual salary and (ii) annual cash bonus, which may be granted based on annual negotiations with each eligible employee.
Following the offering we expect to adopt and implement an incentive plan to help attract, retain and motiviate talented employees. We expect the plan to be directed to approximately 30 executive officers, directors and key employees and involve up to a maximum of 10% of TIMWE’s capital stock following the offering. The plan remains subject to the approval of our Board of Directors and shareholders.
Audit Committee
Our Audit Committee consists of Nuno Silvério Marques, Tomás de Mello Paes de Vasconcelos and Bernardo Reynolds de Carvalho, each of whom is an “independent director” of our Board of Directors as such term is defined in the regulations of the Securities and Exchange Commission pursuant to Section 301 of the Sarbanes-Oxley Act. Tomás de Mello Paes de Vasconcelos serves as the chair of our Audit Committee. Our bylaws delegate to the Audit Committee the responsibility to, among other things:
| | • | | approve and disclose an annual report on their supervisory activity, expressly mentioning any constraints faced; |
| | • | | approve an annual action plan contemplating, among others, the measures required for compliance with its duties in the following year; |
| | • | | inform and discuss with the Board of Directors and the Executive Committee any issues identified in the exercise of their powers and duties; |
| | • | | discuss and issue its opinion to the Executive Committee and the registered independent public accounting firm on any reports, documentation or information to be disclosed to the competent authorities; |
| | • | | adopt procedures to ensure compliance with the legal and regulatory provisions that are applicable to TIMWE; |
111
| | • | | evaluate the accuracy and supervise the quality and integrity of our financial statements and the information contained therein; |
| | • | | analyze and give its opinion on accounting and auditing matters, as well as the impact on our financial statements of changes to accounting rules applicable to us; |
| | • | | establish and monitor the procedures relating to the preparation and auditing of our financial statements by the registered independent public accounting firm, as well as supervise and review internal procedures on accounting and auditing practices; |
| | • | | propose the appointment of the registered independent public accounting firm to the General Shareholders’ Meeting; |
| | • | | supervise the independence of the registered independent public accounting firm, particularly with respect to the rendering of additional services; |
| | • | | settle any differences between the Executive Committee and our registered independent public accounting firm with respect to financial information to be included in the financial statements to be filed with competent authorities, or with respect to the audit report process; |
| | • | | evaluate the quality, integrity and efficiency of our risk management system, internal control system and internal audit system, including an annual review of the adequacy and efficiency of such systems, and generally supervise our internal audit and internal control systems; and |
| | • | | receive and review reports of irregularities, claims and complaints submitted by shareholders, employees or others, and implement procedures designed to receive, register and process them as they relate to accounting and auditing matters, and create internal control procedures concerning such matters. |
Tomás de Mello Paes de Vasconcelos qualifies as a “financial expert” as such term is defined in the regulations of the Securities and Exchange Commission pursuant to Section 407 of the Sarbanes-Oxley Act. In making its determination that Tomás de Mello Paes de Vasconcelos qualifies as a financial expert, our board has considered Tomás’s formal education and the nature and scope of his previous experience, including past service on various audit committees. Both our independent registered public accounting firm and management periodically meet privately with our Audit Committee.
Disclosure Committee
Our Disclosure Committee consists of Ricardo Manuel Brás Calçado Carvalho, Antonio Fouto and Martim Menezes. Ricardo Manuel Brás Calçado Carvalho serves as the chair of our Disclosure Committee. Our Disclosure Committee is responsible for assisting senior officers in fulfilling their responsibility for oversight of the accuracy and timeliness of the disclosures made by TIMWE, including responsibility for the following tasks:
| | • | | Design and establish controls and other procedures that are designed to ensure that (i) information required to be disclosed by TIMWE to the Securities and Exchange Commission (the “SEC”) and other written information that TIMWE will disclose to the investment community is recorded, processed, summarized and reported accurately and on a timely basis and (ii) information is accumulated and communicated to management, including the senior officers, as appropriate to allow timely decisions regarding such required disclosure (“Disclosure Controls”). |
| | • | | Monitor the integrity and effectiveness of TIMWE’s Disclosure Controls. |
| | • | | Review and supervise the preparation of TIMWE’s (i) Annual Report on Form 20-F (the “periodic report”), information statements, registration statements and any other information filed with the SEC, (ii) press releases containing financial information, earnings guidance, information about material acquisitions or dispositions or other information material to TIMWE’s security holders, (iii) correspondence broadly disseminated to shareholders and all presentations to analysts and the |
112
| | investment community and (iv) presentations to rating agencies and lenders (collectively, the “Disclosure Statements”) and review disclosure policies for TIMWE’s corporate/investor relations website(s). |
| | • | | Evaluate the effectiveness of TIMWE’s Disclosure Controls as of the end of the period covered by the periodic report. |
| | • | | Discuss with the senior officers all relevant information with respect to the committee’s proceedings, the preparation of the Disclosure Statements and the committee’s evaluation of the effectiveness of TIMWE’s Disclosure Controls. |
| | • | | Provide a certification to the Audit Committee prior to the filing with the SEC of each periodic report as to (i) the Disclosure Committee’s compliance with its policies and procedures and proper performance of the responsibilities that have been assigned to it and (ii) the Disclosure Committee’s conclusions resulting from its evaluation of the effectiveness of the Disclosure Controls. |
In the discharge of its duties, the Disclosure Committee has full access to all of TIMWE’s books, records, facilities and personnel, including the internal auditors.
Compensation Committee
Our Compensation Committee consists of Nuno Silvério Marques, Tomás de Mello Paes de Vasconcelos and Bernardo Reynolds de Carvalho, each of whom is an “independent director” of our Board of Directors as such term is defined in the regulations of the Securities and Exchange Commission pursuant to Section 301 of the Sarbanes-Oxley Act. The chairperson of our compensation committee is Tomás de Mello Paes de Vasconcelos. The Compensation Committee reviews and, as it deems appropriate, recommends to the Board of Directors policies, practices and procedures relating to the compensation of our officers and the establishment and administration of employee benefit plans. The Committee advises and consults with our officers as may be requested regarding managerial personnel policies.
Nominating and Corporate Governance Committee
Our Nominating and Corporate Governance Committee consists of Nuno Silvério Marques, Tomás de Mello Paes de Vasconcelos and Bernardo Reynolds de Carvalho, each of whom is an “independent director” of our Board of Directors as such term is defined in the regulations of the Securities and Exchange Commission pursuant to Section 301 of the Sarbanes-Oxley Act. The chairperson of our Nominating and Corporate Governance Committee is Nuno Silvério Marques. The Nominating and Corporate Governance Committee reviews and, as it deems appropriate, recommends to the Board of Directors policies and procedures relating to director and board committee nominations and corporate governance policies.
For a summary of the significant differences between the corporate governance practices followed by TIMWE and those applicable to U.S. domestic issuers under the NASDAQ listing standards, please see “Description of Share Capital—Corporate Governance—Differences Between Portuguese Corporate Governance Practices and the NASDAQ Stock Market’s Corporate Governance Standards.”
Executive Committee
Our Executive Committee consists of Diogo Ahrens Teixeira Salvi, Ricardo Manuel Brás Calçado Carvalho and António Rafael de Brito Fouto. The chairperson of our Executive Committee is Diogo Ahrens Teixeira Salvi. The Executive Committee is responsible for the day-to-day management of the company and may be delegated specific powers and responsibilities by the Board of Directors, including acting on behalf of the Board of Directors with respect to day-to-day activities that are later presented for full review by the Board of Directors.
113
PRINCIPAL AND SELLING SHAREHOLDERS
The following table sets forth information regarding beneficial ownership of our common shares before and immediately after the offering:
| | | | | | | | | | | | | | | | | | | | | | | | | | | | | | | | |
| | | | | | | | | Number of
Common
Shares
Offered
(excluding
over-
allotment) | | | Number of
Common
Shares
Offered
(including
over-
allotment) | | | Common Shares Beneficially Owned After the
Offering | |
| | | Common Shares
Beneficially Owned Prior
to the Offering | | | | | Excluding Exercise of
Over-Allotment | | | Including Exercise of
Over-Allotment | |
Name | | Number | | | Percent | | | | | Number | | | Percent | | | Number | | | Percent | |
Diogo Ahrens Teixeira Salvi | | | 32,000,000 | | | | 64.0 | % | | | 2,400,000 | | | | 2,940,000 | | | | 29,600,000 | | | | 51.5 | % | | | 29,060,000 | | | | 49.8 | % |
Ricardo Manuel Brás Calçado Carvalho | | | 16,000,000 | | | | 32.0 | % | | | 1,200,000 | | | | 1,470,000 | | | | 14,800,000 | | | | 25.7 | % | | | 14,530,000 | | | | 24.9 | % |
Paulo Jorge Passos Salgado | | | 2,000,000 | | | | 4.0 | % | | | 150,000 | | | | 183,750 | | | | 1,850,000 | | | | 3.2 | % | | | 1,816,250 | | | | 3.1 | % |
Public | | | — | | | | — | | | | — | | | | — | | | | 11,250,000 | | | | 19.6 | % | | | 12,937,500 | | | | 22.2 | % |
| | | | | | | | | | | | | | | | | | | | | | | | | | | | | | | | |
Total | | | 50,000,000 | | | | 100.0 | % | | | 3,750,000 | | | | 4,593,750 | | | | 57,500,000 | | | | 100.0 | % | | | 58,343,750 | | | | 100.0 | % |
| | | | | | | | | | | | | | | | | | | | | | | | | | | | | | | | |
Our principal and selling shareholders will continue to own, in the aggregate, 80.4% of our common shares immediately following the offering. Our principal and selling shareholders are also members of our management and will therefore continue to exercise significant influence over us after the offering. See “Risk Factors—Risks Related to our Common Shares—The interests of our principal shareholders may differ from the interests of our other shareholders.”
114
RELATED PARTY TRANSACTIONS
Since January 1, 2008, we have not engaged in transactions with “related parties” (within the meaning of SEC rules) other than the purchase by us in 2011 of 20,000 common shares (equivalent to 2,000,000 common shares based on the number of shares outstanding immediately prior to the offering) for an aggregate purchase price of €600,000 from one of our directors who is also an executive officer and one of his family members.
115
DIVIDENDS AND DIVIDEND POLICY
Our dividend policy and the amount of any future dividends we decide to pay, if any, will depend upon a number of factors, including, but not limited to, our earnings, financial condition, cash requirements (including capital expenditure, investment plans and acquisitions), prospects and such other factors as may be deemed relevant at the time. We do not currently expect to pay dividends in the year ending December 31, 2011.
Pursuant to Portuguese law, we are required to transfer to our legal reserve each year an amount equal or superior to 5% of that year’s profit, until such reserve is equivalent to the minimum mandatory legal percentage of our share capital (currently, 20%). Under Portuguese law, we may pay dividends in any amount, not to exceed the total of our profit (after such transfer to the legal reserves) and our other distributable reserves (which include prior years’ profits after such transfers). Under Portuguese law, we may not pay dividends if our own capital, including net income, is, or as a result of the dividend payment would become, lower than our issued share capital and reserves that cannot be distributed to shareholders, and we may not distribute dividends (i) from proceeds which would otherwise be used to cover any year’s losses and until such losses are duly covered, and (ii) until all expenses related to the incorporation of the company and research and development are completely amortized, except if our free reserves or the year’s nondistributed profit are at least equal to the nonamortized expenses.
The conditions under which we may declare dividends based on Portuguese law and our bylaws are described under “Description of Share Capital—Dividends on the Common Shares”.
116
DESCRIPTION OF SHARE CAPITAL
The following summary provides information concerning our share capital and briefly describes all material provisions of our bylaws (estatutos) and Portuguese law. The information set forth below describes all material considerations concerning our share capital. For the complete terms of our by-laws, please see the copy filed as an exhibit to the registration statement of which this prospectus forms a part.
General
Our authorized share capital consists of 58,343,750 common shares, €0.03 par value per share, 50,000,000 of which were issued and outstanding immediately prior to the offering. All of our issued and outstanding shares are validly issued and fully paid. Prior to the offering, none of our common shares is held of record in the United States.
Object and Purpose
Our object and purpose, which is described in Article Three of our bylaws, is the management of other companies. Pursuant to this corporate purpose, TIMWE acts as a holding company (a Portuguese “SGPS”), managing its ownership interests in the TIMWE’s operating subsidiaries as in indirect way of undertaking its business activities. Under Portuguese law, SGPS companies may be formed only for the purpose of managing equity interests in other entities; thus, operational responsibilities are vested in each of TIMWE’s respective operating subsidiaries.
Certain Provisions with Respect to Board Members
Our Board of Directors consists of eight directors. According to our bylaws, members of the Board of Directors are elected for a three-year period and may be re-elected on one or more occasions. The current members of the Board of Directors who are not “independent directors”—as such term is defined in the regulations of the Securities and Exchange Commission pursuant to Section 301 of the Sarbanes-Oxley Act—were elected at an Annual General Shareholders meeting held on June 19, 2009. The remaining current members of the Board of Directors were elected at the General Shareholders’ Meetings held on April 18, 2011 (Tomás de Mello and Bernardo Reynolds) and July 15, 2011 (Nuno Silvério), respectively. Pursuant to Portuguese law, the term for all of our current directors expires December 31, 2011. Notwithstanding the expiration of any director’s term, pursuant to Portuguese law, such director will remain a director of the company until the next Annual General Shareholders’ Meeting when directors may be re-elected or replaced. The next Annual General Shareholders’ Meeting will take place, pursuant to Portuguese law, between January 1, 2012 and May 31, 2012. The directors are elected by a majority of the votes cast at the Annual General Shareholders’ Meeting.
Agreements between us and our directors must be authorized by a resolution of the Board of Directors and a favorable opinion of the Audit Committee or of our registered independent public accounting firm. Our directors are not permitted to vote on resolutions relating to agreements in which they are materially interested or with respect to which they have a conflict of interest. Pursuant to Portuguese law, any agreements executed with the directors must be duly referenced in the annual accounts of TIMWE, except agreements entered into in pursuit of TIMWE’s corporate purpose and from which the individual director did not derive a benefit. Our directors do not have the power to vote for their compensation, which is determined at the Annual General Shareholders’ Meeting. Our directors may not receive loans from TIMWE, other than up to one month of compensation in advance. There are no age limit requirements for the retirement of board members. No minimum shareholding is required for qualification as a member of the board.
Dividends on the Common Shares
The holder of record of common shares on the date of payment of any dividend is entitled to receive that dividend. The settlement of a trade and the transfer of record ownership of shares traded on the NASDAQ Stock Market takes place on the third business day after the trade.
117
The Board of Directors has sole discretion over any proposal for dividends to be paid. Each dividend must be approved by a majority of the votes cast at a General Shareholders’ Meeting and shareholders may also authorize a dividend in excess of the amount proposed by the Board of Directors. The Board of Directors, subject to certain conditions, including the consent of our Audit Committee and the certification of our registered independent public accounting firm, may also authorize the payment of interim dividends.
Under Portuguese law, distributable net income is net income remaining after deducting accumulated losses and setting aside 5% in legal reserves until this reserve represents the minimum mandatory legal percentage of share capital. Although other reserves established under a company’s bylaws are generally deducted from that company’s distributable net income, our bylaws do not provide for any other reserves. Such reserves, however, could be established by amendment of our bylaws by a two-thirds majority of the votes cast at a General Shareholders’ Meeting.
Dividends are payable from net income and free reserves, which are reserves other than the legal reserve. Portuguese law requires net income and free reserves to be applied against accumulated losses for the given financial year, and only thereafter may a share issuance premium be applied against accumulated losses.
Portuguese law also prohibits the payment of dividends when a company’s shareholders’ own capital, including the net income, is less than the sum of its share capital, and any reserves that cannot be distributed to the shareholders pursuant to Portuguese law or the bylaws of the company. The payment of a dividend would also be illegal under Portuguese law if, following the payment, the company’s shareholders’ equity would become smaller than such sum. The categories of other similar reserves under Portuguese law include, among other things, the portion of the revaluation reserve related to assets not yet amortized and the reserve equivalent to the book value of treasury shares.
Voting Rights of the Common Shares
Under the Portuguese Companies Code, the statutory framework that applies to Portuguese corporate law matters, matters are decided at a General Shareholders’ Meeting by a simple majority of votes. However, resolutions for the amendment of the bylaws, dissolution, spin-off, merger or transformation of TIMWE and certain other matters mandated by Portuguese law require the approval of two-thirds of the votes cast at a General Shareholders’ Meeting. A quorum of not less than one-third of the share capital entitled to vote must be present. If the quorum requirement is not met at the first meeting, then matters may be approved on a later day at a second call of such meeting by (i) a two-thirds majority of the votes cast at the meeting or (ii) a simple majority of the votes cast if at least one-half of the share capital is represented.
In respect of TIMWE’s treasury shares, all rights attached to such shares are suspended, including voting rights. As a result, treasury shares are neither counted for the purpose of calculating any minimum quorum nor for determining a majority of votes cast. The purchase by TIMWE of its common shares generally must be approved by its shareholders in accordance with our bylaws and the Portuguese Companies Code. Under Portuguese law, a Portuguese company may not, except under certain limited circumstances (such as the repurchase of its own shares for the purpose of reducing share capital), purchase more than 10% of its nominal share capital as treasury stock.
In addition, all of our common shares being sold in this offering will be recorded in our share register under the name of the Depository Trust Company’s nominee, Cede & Co., which will be considered under Portuguese law to be the legal owner of such common shares and a shareholder of TIMWE. We have provided in our bylaws, consistent with Portuguese legal principles, for Cede & Co. to receive voting instructions from beneficial owners of our common shares, although we cannot assure you that these procedures will be given effect under Portuguese law.
118
Pre-Emptive Rights
Upon issuance of new common shares for cash consideration, unless otherwise decided by a vote at a General Shareholders’ Meeting, those who are shareholders at the time of the resolution approving such share capital increase, shall have a right to subscribe proportionately for such shares. The pre-emptive rights of shareholders to subscribe for shares are freely transferable. Under Portuguese law, there are no limitations upon a U.S. shareholder’s exercise of pre-emptive rights.
Liquidation Rights
Provided there are funds or assets available after the payment of all debts of TIMWE, our common shares have pro rata rights to share in our remaining assets and/or funds upon our liquidation.
Changes in Rights of Shareholders
The rights of holders of TIMWE common shares may only be changed by a shareholders’ resolution amending the bylaws. Resolutions for the amendment of the bylaws require the approval of two-thirds of votes cast at a General Shareholders’ Meeting. A quorum of not less than one-third of the share capital entitled to vote must be present. If the quorum requirement is not met at the initial meeting, then those matters may be approved at a later date at a second call of that meeting by a two-thirds majority of the votes cast at the meeting or a simple majority of the votes cast if at least one-half of the share capital is represented.
General Shareholders’ Meetings
General Shareholders’ Meetings may be held at our registered office or, when the registered office does not have satisfactory conditions for the meeting, at another location within Portuguese territory. General Shareholders’ Meetings are called by publication of a notice on the Ministry of Justice’s website (http://publicacoes.mj.pt) and our website (www.timwe.com). An Annual General Shareholders’ Meeting must be held every year before the end of May and must be convened on not less than one month’s notice. At the Annual General Shareholders’ Meeting, the annual accounts, including a report on our activities during the previous year and any proposal for the payment of dividends, are presented to the shareholders for approval. Meetings may also be called upon the request of the Board of Directors, the Audit Committee or shareholders holding at least 5% of our share capital.
To attend a General Shareholders’ Meeting in person or by proxy or to vote by courier, shareholders must demonstrate that the common shares they hold are registered in a securities account for common shares at least five business days in advance of the meeting or that such shares are duly inscribed in our share register, as applicable. Shareholders may appoint proxies in writing. No shareholder may be represented by more than one representative. General Shareholders’ Meetings are presided over by a chairman appointed by the shareholders.
Share Register
Prior to the offering our share register was maintained by one of our officers at our headquarters in Portugal and from the date of this offering our share register will be maintained by American Stock Transfer & Trust Company in New York, New York, who will act as transfer agent and registrar. The share register will reflect only record owners of our shares; beneficial owners of common shares holding their shares through the Depository Trust Company, or “DTC,” will not be recorded in our share register. Common shares held through DTC will be registered in our share register in the name of DTC’s nominee, Cede & Co. Under Portuguese law and our bylaws, we are entitled to accept only those persons as shareholders or nominees who have been
119
recorded in our share register, and to make dividend payments and perform other obligations only to our shareholders of record, including DTC. We expect that all of our common shares being sold in this offering will initially be held through DTC.
Transfer of Beneficial Interests in our Common Shares
The holders of beneficial interests in our common shares may transfer their beneficial interests in our common shares though participants in the book-entry system of DTC.
There are no restrictions under Portuguese law with regard to the percentage of shares that a non-Portuguese resident, such as DTC, may own in TIMWE.
Disclosure of Shareholdings and Shareholders’ Agreements
Our bylaws do not require shareholders to disclose their shareholdings. Shareholders are not required under our bylaws to provide information relating to shareholders’ agreements.
Changes in Capital
With the approval of the Audit Committee, the Board of Directors may increase the share capital of TIMWE on one or more occasions, up to a maximum of €1,000,000. Certain terms of a share capital increase, such as the maximum amount of the share capital increase, the class of shares to be issued and whether any limitations will be imposed on the subscription rights of shareholders, must be approved by the shareholders at a general meeting.
Corporate Governance
Portuguese Legal Framework
The principal source of corporate governance standards in Portugal is the Portuguese Companies Code, which was enacted in 1987 and codified European Union directives on commercial law. The Portuguese Companies Code was subject to three major amendments in 2006, 2007 and 2009. A revision on March 29, 2006, mainly related to corporate governance matters. On January 17, 2007, a second revision covered issues such as share capital reductions and disclosure of financial information. Finally, in 2009, a recent European Union directive on the annual accounts and consolidated accounts of certain types of companies was transposed into the Portuguese legal framework, and as a result, measures have been taken in order to modernize company law, improve EU-wide comparability and public confidence in financial statements and reports, increase transparency in transactions with related parties and off-balance sheet arrangements and improve disclosure about corporate governance practices applied in a company. Moreover, Portuguese rules on mergers and spin-offs were significantly simplified.
The Portuguese Companies Code is legally binding on any company with a registered office in Portugal. The Portuguese Companies Code establishes corporate governance standards with respect to the following:
| | • | | Shareholder pre-emptive rights, which are intended to protect shareholders and holders of securities convertible into shares against a decrease in equity value; |
| | • | | Share capital formation and capital increases, including the mandatory verification by independent auditors of contributions in kind; |
| | • | | Dividends, which are subject to mandatory minimum distributions of 50%, except in limited circumstances, including if a lower percentage is set forth in the bylaws and if otherwise resolved by a qualified majority at the Shareholders General Meeting. Our bylaws leave this matter to a resolution of the Shareholders General Meeting; |
120
| | • | | General Shareholders’ Meetings, including minimum notice requirements, minority rights, voting by correspondence, and requirements that shareholders elect the chairman and other officials of the meeting who must be independent members (in the case of major companies and issuers of securities traded on a regulated market, such as TIMWE) and are empowered to convene and conduct the meetings; |
| | • | | Annual reports of management to the General Shareholders’ Meeting; |
| | • | | Shareholder access to information, including the right to request information in general meetings, and minority rights to request information regarding the company’s performance; |
| | • | | Shareholder rights to, in certain circumstances, request the judicial declaration of annulment or voiding of decisions made at a General Shareholders’ Meeting and the suspension of an illegal resolution, as well as to request to the chairman of the board of the General Shareholders’ Meeting to suspend a meeting in progress; |
| | • | | Strengthening of the supervisory functions of the supervisory body’s membership (it being mandatory for the aforementioned committee for financial matters, the statutory auditor board and the Audit Committee to be composed of a majority of independent members among whom there must be an expert, as defined in the law) and broadening the scope of the supervisory powers (by adding powers on matters such as whistleblowing systems, oversight of the work and independence of the statutory auditor, and making proposals on the selection and confirmation of the statutory auditor); |
| | • | | Conflicts of interest, which are highly regulated, including a requirement that board members make their share transactions and significant shareholdings public and that they refuse themselves from participating and voting in any matters in which they have a personal interest; |
| | • | | Fiduciary duties of board members to shareholders and the company; and |
| | • | | Compensation of members of our Board of Directors, which is established by our General Shareholders’ Meeting or by a compensation committee appointed by a General Shareholders’ Meeting. |
The Portuguese Companies Code sets further the following requirements, among others, relating to corporate governance structure:
| | • | | The management and supervisory body of the company may be structured according to one of three modes: (i) Board of Directors and supervisory board, or (ii) Board of Directors, including an Audit Committee and a statutory auditor, or (iii) an executive Board of Directors, general and supervisory board and statutory auditor; |
| | • | | Wherever provision is made by law, instead of the Board of Directors or executive Board of Directors, there may be just one manager and instead of a supervisory board there may be a sole inspector; |
| | • | | In companies which are structured with a Board of Directors and supervisory board, the existence of a statutory auditor who is not a member of the supervisory board is mandatory in cases where such a provision is set forth by law; |
| | • | | In companies which are structured with a Board of Directors, including an Audit Committee and a statutory auditor, the existence, on the general and supervisory board, of a committee for financial matters is mandatory in cases where such a provision is set forth by law; |
| | • | | Companies with a single manager cannot adopt the structure of a Board of Directors, including an Audit Committee and a statutory auditor; and |
| | • | | The bylaws may be amended at any time to adopt another structure which is permitted under the previous paragraphs. |
121
New Corporate Governance Model
As mentioned above in “—Portuguese Legal Framework,” in March 2006, the Portuguese Companies Code was broadly amended with important implications for the models and principles of corporate governance, in particular those applicable to issuers of securities traded on a regulated market. These amendments required companies to make changes to their corporate governance and supervision structures by June 30, 2007. At the General Shareholders’ Meeting held on April 18, 2011, our shareholders approved a proposal of the Board of Directors adopting a new corporate governance structure and introducing the required amendments into our bylaws. The decision to adopt the new structure took into account, among other things, the fact that we anticipate having securities traded on the NASDAQ Stock Market (“NASDAQ”), where this structure is mandatory for U.S. domestic companies. Following the adoption of the new structure, our corporate bodies consist of the General Shareholders’ Meeting, the Board of Directors, which includes an Audit Committee, and a Statutory Auditor.
Until April 18, 2011, the Statutory Auditor was the entity responsible for supervision of the audit function and other supervisory functions. On April 18, 2011, we replaced some of the functions of the Statutory Auditor with those of the Audit Committee, currently consisting of three independent directors. In addition, we have a statutory chartered registered public independent accountant (formerly the statutory auditor) that is responsible for the audit function and is elected by our shareholders based on a proposal of the Audit Committee.
Summary of Significant Differences Between Portuguese Corporate Governance Practices and the NASDAQ Stock Market’s Corporate Governance Standards
The following paragraphs provide a brief general summary of significant differences between the corporate governance practices followed by Portuguese companies, such as TIMWE, and those required for domestic companies under NASDAQ listing standards.
Composition of Board of Directors and Independence
The NASDAQ listing standards provide that the Board of Directors of a U.S.-listed company must consist of a majority of independent directors and that the Audit Committee must consist solely of independent directors. A director qualifies as independent only if the board affirmatively determines that the director has no material relationship with the company, either directly or indirectly. In addition, the listing standards enumerate a number of relationships that preclude independence. The listing standards do not specifically deal with the avoidance of conflicts of interest and related party transactions. These matters are typically governed by the laws of the state in which the listed company is incorporated.
Portuguese law does not require that a majority of members of the Board of Directors of a Portuguese company be independent. On the other hand, Portuguese law does provide that all the members of the Audit Committee satisfy legal requirements concerning conflicts of interest. These principles are designed to strengthen the supervision of the audit function and to avoid conflicts of interest.
The Audit Committee elected at the General Shareholders’ Meetings on April 18, 2011 and July 15, 2011, currently complies with the independence requirements set forth pursuant to Rule 10A-3 under the U.S. Securities Exchange Act of 1934, as amended (the “Exchange Act”) as applicable to “foreign private issuers” as that term is defined therein.
Meetings of Non-Management Directors
NASDAQ listing standards provide that the non-management directors of each U.S.-listed company must meet at regularly scheduled executive sessions without management in order to empower them to serve as a more effective check on management. There is no similar requirement or recommendation under Portuguese law.
122
Committees of the Board of Directors
The NASDAQ listing standards require that a U.S.-listed company must have a Nominating/Corporate Governance Committee and a Compensation Committee, and that all listed companies, including non-U.S.-listed companies, must have an Audit Committee that satisfies the requirements of the Exchange Act. U.S. listed companies must have an Audit Committee that fulfils additional NASDAQ-imposed requirements. The NASDAQ listing standards require each of these committees to consist solely of directors who are independent under NASDAQ rules and to have a written charter that addresses certain matters specified in the listing standards.
Portuguese law requires companies adopting a corporate governance structure similar to ours (as described under “—Portuguese Legal Framework” above) to have, respectively, a Committee for Financial Matters within the Supervisory Body or an Audit Committee within the Board of Directors, in each case satisfying certain requirements as to the committee’s minimum powers and conflicts of interest. Moreover, the Portuguese Companies Code permits the creation of a Compensation Committee appointed by a general meeting of shareholders. We have a Nominating and Corporate Governance Committee and a Compensation Committee each of which is comprised entirely of independent directors as such term is defined in the regulations of the Securities and Exchange Commission pursuant to Section 301 of the Sarbanes-Oxley Act.
Audit Committee
TIMWE established an Audit Committee on April 18, 2011, consisting of three independent members of its Board of Directors. The Audit Committee operates as a committee of the Board of Directors with delegated powers relating to the following matters, among others: (i) supervising the quality and integrity of the financial information contained in our financial statements, (ii) evaluating the qualification and independence of our external auditors, (iii) evaluating the quality, integrity and efficiency of our internal control systems, (iv) evaluating the execution of functions performed by our external auditors and the corporate internal auditing office and (v) evaluating the compliance with legal and regulatory requirements, as well as those recommendations and guidelines issued by competent authorities.
According to our bylaws, the members of the Audit Committee must comply with all the applicable requirements on conflicts of interest, independence and expertise arising out of Portuguese laws and regulations, as well as other relevant market rules, including those in force in the jurisdictions where TIMWE has securities listed for trading. As a supervisory body, the Audit Committee has the powers to, in addition to all other powers established by law or our bylaws,
| | • | | approve and disclose an annual report on their supervisory activity, expressly mentioning any constraints faced; |
| | • | | approve an annual action plan contemplating, among others, the measures required for compliance with its duties in the following year; |
| | • | | inform and discuss with the Board of Directors and the Executive Committee any issues identified in the exercise of their powers and duties; |
| | • | | discuss and issue its opinion to the Executive Committee and the registered independent public accounting firm on any reports, documentation or information to be disclosed to the competent authorities; |
| | • | | adopt procedures to ensure compliance with the legal and regulatory provisions that are applicable to TIMWE; |
| | • | | evaluate the accuracy and supervise the quality and integrity of our financial statements and the information contained therein; |
| | • | | analyze and give its opinion on accounting and auditing matters, as well as the impact on our financial statements of changes to accounting rules applicable to us; |
123
| | • | | establish and monitor the procedures relating to the preparation and auditing of our financial statements by the registered independent public accounting firm, as well as supervise and review internal procedures on accounting and auditing practices; |
| | • | | propose the appointment of the registered independent public accounting firm to the General Shareholders’ Meeting; |
| | • | | supervise the independence of the registered independent public accounting firm, particularly with respect to the rendering of additional services; |
| | • | | settle any differences between the Executive Committee and our registered independent public accounting firm with respect to financial information to be included in the financial statements to be filed with competent authorities, or with respect to the audit report process; |
| | • | | evaluate the quality, integrity and efficiency of our risk management system, internal control system and internal audit system, including an annual review of the adequacy and efficiency of such systems, and generally supervise our internal audit and internal control systems; and |
| | • | | receive and review reports of irregularities, claims and complaints submitted by shareholders, employees or others, and implement procedures designed to receive, register and process them as they relate to accounting and auditing matters, and create internal control procedures concerning such matters. |
Our Audit Committee monitors our compliance with laws, regulations, recommendations and guidelines issued by the U.S. Securities and Exchange Commission (“SEC”) and NASDAQ and defines and implements policies to ensure our compliance with these laws, regulations, recommendations and guidelines.
Tomás de Mello Paes de Vasconcelos (Chairman), Nuno Silvério Marques and Bernardo Reynolds de Carvalho were elected at the General Shareholders’ Meetings held on April 18, 2011 and July 15, 2011 as members of the Audit Committee for a term of office that expires on December 31, 2011.
Additionally, the new corporate governance structure includes a Statutory Auditor who is not one of the members of the Audit Committee, as required by the Decree-Law No. 76-A/2006 of March 27, 2006, which amended the Portuguese Companies Code. The current Statutory Auditor was appointed at the General Shareholders’ Meeting held on April 18, 2011. KPMG & Associados—Sociedade de Revisores Oficiais de Contas, S.A., represented by João Augusto, was elected as the Effective Statutory Auditor, and no Alternate Statutory Auditor was appointed, as permitted by law.
Advisory Board
We established an Advisory Board in 2008 in order to provide advice and consultancy services to the Company’s management on an informal, non-binding basis. This Advisory Board has no legal role under Portuguese law and its recommendations have no binding effect on the company pursuant to its by-laws. It is considered internally as an informal committee of “wise-men,” which provides from time to time advice and direction from an outside perspective.
The Advisory Board is informally convened and meetings are held quarterly. The primary functions of the Advisory Board include giving opinions and advice concerning high level, strategic subjects such as diversification, and structural organization, among other things. Advisory board members also leverage their network of contacts to increase awareness of our company.
There is no formal appointment process for members of the Advisory Board and their term in office is indefinite.
124
Code of Business Conduct and Ethics
The NASDAQ listing standards require each U.S.-listed company to adopt, and post on its Web site, a code of business conduct and ethics for its directors, officers and employees and promptly disclose any waivers of the code for directors or executive officers. There is no similar requirement or recommendation under Portuguese law. However, under the Exchange Act rules and regulations, all foreign private issuers, such as TIMWE, must disclose in their annual reports on Form 20-F whether they have adopted a code of ethics that applies to the principal executive officer, principal financial officer, principal accounting officer or controller, or persons performing similar functions or, if they have not adopted such a code, why they have not done so. In addition, a foreign private issuer must either file a copy of the code with the U.S. Securities Exchange Commission as an exhibit to its annual report; post the text of the code on its Web site and disclose in its annual report its Internet addresses and the fact that it has posted such a code on its Web site; or undertake in its annual report to provide a copy upon request to any person without charge. There is significant, though not complete, overlap between the code of ethics required by the NASDAQ listing standards and the code of ethics required by the Exchange Act rules.
TIMWE has a code of ethics that complies with Exchange Act requirements, which is filed as an exhibit to the registration statement of which this prospectus forms a part.
125
TAXATION
The following is a summary of material Portuguese and U.S. federal income tax consequences of the acquisition, ownership and disposition of the common shares by the U.S. Holders described herein, but it does not purport to be a comprehensive description of all the tax considerations that may be relevant to a decision to purchase the shares.The disclosure concerning Portuguese taxation is the opinion of CCA Advogados. The disclosure concerning U.S. federal income taxation is the opinion of Davis Polk & Wardwell LLP as to the material U.S. federal income tax consequences to the U.S. Holders described herein of an investment in the common shares.
This discussion does not address all aspects of Portuguese and U.S. federal income taxation that may be relevant to a particular holder based on such holder’s particular circumstances. For example, the following discussion does not address all of the U.S. federal income tax consequences to a U.S. Holder (i) that owns or is deemed to own 10% or more of our voting stock; (ii) that is a dealer in securities, an insurance company, a bank or other financial institution, a tax-exempt organization, or a partnership or other pass-through entity; (iii) that holds TIMWE’s common shares as a part of an integrated investment (including a “straddle”) comprised of the common shares and one or more other positions; (iv) whose functional currency is not the U.S. dollar; or (v) that holds common shares in connection with a trade or business conducted outside of the United States. This discussion generally applies only to U.S. Holders that hold the common shares as capital assets.
In addition, the following discussion does not address alternative minimum tax considerations or any aspect of state, local or non-U.S. tax laws (other than material Portuguese tax laws).
If an entity that is classified as a partnership for U.S. federal income tax purposes holds common shares, the U.S. federal income tax treatment of a partner will generally depend on the status of the partner and the activities of the partnership. Partnerships holding common shares and partners in such partnerships should consult their tax advisors as to the particular U.S. federal income tax consequences of holding and disposing of the common shares.
The description of the Portuguese and U.S. federal income tax laws and practices set forth below is based on the laws as in force and as applied in practice on the date of this Form F-1, including the tax laws of Portugal and regulations thereunder, the U.S. Internal Revenue Code of 1986, as amended, hereinafter referred to as the “Code,” its legislative history, existing and proposed regulations thereunder, published rulings and court decisions, as well as the convention between the United States of America and the Portuguese Republic for the Avoidance of Double Taxation and the Prevention of Fiscal Evasion with Respect to Taxes on Income, including the protocol thereto, hereinafter referred to as the “Tax Treaty.” These laws and practices and the Tax Treaty may be subject to change, possibly on a retroactive basis.
As used in this section, the term “U.S. Holder” means a beneficial owner of common shares that is entitled to the benefits of the Tax Treaty and is for U.S. federal income tax purposes:
| | • | | an individual citizen or resident of the United States.; |
| | • | | a corporation or other entity taxable as a corporation organized under the laws of the U.S. or of any state thereof or the District of Columbia; or |
| | • | | an estate or trust the income of which is subject to U.S. federal income taxation regardless of its source. |
We urge prospective investors to consult their own tax advisors as to the tax consequences of the acquisition, ownership and disposition of the common shares, including whether they are eligible for the benefits of the Tax Treaty and any tax consequences arising under any other applicable tax laws of the United States or Portugal or any other jurisdiction.
126
Dividends
Portuguese Taxation
The general rate of withholding tax on dividends in Portugal is currently 21.5% for both Portuguese residents and nonresidents.
Under the Tax Treaty, the withholding tax rate on dividends distributed to U.S. tax residents may be reduced, as a general rule, to 15%. In order to apply the reduced treaty rate, TIMWE must have confirmation that each shareholder is eligible for the benefits of the Tax Treaty. A specific form (Form 21-RFI of the Directorate-General of Taxes (Direcção Geral de Impostos—DGCI) of the Portuguese Ministry of Finance), duly certified by the U.S. Internal Revenue Service, must be received by the payor of the dividends, which will be TIMWE or a Portuguese financial intermediary through which payments are made, prior to the date the dividends are made available to shareholders.
If this form is not available as of the relevant date, Portuguese withholding tax will generally be levied at the 21.5% rate. The 6.5% excess Portuguese withholding tax may be subsequently reimbursed by the Portuguese tax authorities pursuant to specific claims of individual shareholders on Form 22-RFI of the Directorate-General of Taxes (Direcção Geral de Impostos—DGCI) of the Portuguese Ministry of Finance, duly certified by the U.S. Internal Revenue Service and presented to the Portuguese tax authorities within two years following the date the dividends are made available. Although Portuguese law states that the excess withholding tax should be reimbursed within one year from the date the claim was submitted, we cannot guarantee if or when you will receive any reimbursement of the 6.5% excess Portuguese withholding tax even if you fill out Form 21-RFI or Form 22-RFI to claim eligibility for the benefits of the Tax Treaty.
Please contact your tax advisor if you wish to fill out Form 21-RFI or Form 22-RFI to claim eligibility for the benefits of the Tax Treaty. You should know that receiving certification of a Form 21-RFI or Form 22-RFI from the U.S. Internal Revenue Service can be a lengthy process. You should therefore contact your tax advisor promptly after learning of any proposed or paid dividend or if you believe you are entitled to a refund of Portuguese tax.
U.S. Federal Income Taxation
Subject to the discussion under “Passive Foreign Investment Company Rules” below, distributions paid on common shares, other than certain pro rata distributions of common shares, will be treated as dividends to the extent paid out of our current or accumulated earnings and profits (as determined under U.S. federal income tax principles). Because we do not maintain calculations of earnings and profits under U.S. federal income tax principles, it is expected that distributions generally will be reported to U.S. Holders as dividends. Subject to applicable limitations, dividends paid to certain non-corporate U.S. Holders in taxable years beginning before January 1, 2013 may be taxable at favorable rates, up to a maximum rate of 15%. U.S. Holders should consult their tax advisors regarding the availability of the reduced tax rate on dividends in their particular circumstances. The amount of a dividend will include amounts withheld in respect of Portuguese taxes. The amount of the dividend will be treated as foreign-source dividend income to U.S. Holders and will not be eligible for the dividends-received deduction generally available to U.S. corporations under the Code. Dividends will be included in a U.S. Holder’s income on the date of the U.S. Holder’s receipt of the dividend.
The amount of dividend income paid in euros will be the U.S. dollar amount calculated by reference to the exchange rate in effect on the date of receipt, regardless of whether the payment is in fact converted into U.S. dollars. If the dividend is converted into U.S. dollars on the date of receipt, a U.S. Holder should not be required to recognize foreign currency gain or loss in respect of the dividend income. A U.S. Holder may have ordinary gain or loss if the dividend is converted into U.S. dollars after the date of receipt.
127
Subject to applicable limitations, some of which vary depending upon a U.S. Holder’s circumstances, income taxes withheld from dividends on common shares at a rate not exceeding the rate applicable to the U.S. Holder under the Tax Treaty will be creditable against the U.S. Holder’s U.S. federal income tax liability. For a discussion of how to obtain the Tax Treaty rate, see “—Dividends—Portuguese Taxation” above. Dividends paid on common shares generally will constitute “passive category income” or, in the case of certain holders, “general category income” for U.S. foreign tax credit limitation purposes. As an alternative to claiming a foreign tax credit, a U.S. Holder may claim a deduction for Portuguese withholding tax (subject to generally applicable limitations), but in general, may do so only for a year for which such U.S. Holder elects to do so with respect to all foreign income taxes. The rules governing foreign tax credits are complex, and U.S. Holders should consult their tax advisors regarding the creditability of foreign taxes in their particular circumstances.
Capital Gains
Portuguese Taxation
Capital gains of entities that have neither a head office nor effective management in Portuguese territory nor a permanent establishment there on which they are chargeable and capital gains of individuals not resident in Portugal, are generally subject to Portuguese tax at the rate of 25%. However, capital gains derived by a U.S. Holder entitled to the benefits of the Tax Treaty from the sale or other disposition of common shares will, under the Tax Treaty, not be subject to Portuguese tax.
U.S. Federal Income Taxation
Subject to the discussion under “Passive Foreign Investment Company Rules” below, gain or loss realized on the sale or other taxable disposition of common shares will be capital gain or loss, and will be long-term capital gain or loss if the U.S. Holder held the common shares for more than one year. The amount of the gain or loss will equal the difference between the U.S. Holder’s tax basis in the common shares disposed of (which will generally be the purchase price of the common shares) and the amount realized on the disposition, in each case as determined in U.S. dollars. This gain or loss will generally be U.S.-source gain or loss for foreign tax credit purposes. Long-term capital gain recognized by non-corporate U.S. Holders is generally subject to preferential rates. The deductibility of capital losses is subject to limitations.
Passive Foreign Investment Company Rules
Based on the expected composition of our income and assets and the value of our assets (including the value of our goodwill, determined based, in part, on the expected price of common shares in this offering), we do not expect to be a passive foreign investment company, or PFIC, for U.S. federal income tax purposes for our current taxable year or in the foreseeable future. However, because we expect to have a significant amount of passive assets following the offering, and because PFIC status is determined annually after the end of each taxable year and will depend on the composition of our income and assets and the market value of our assets (which may depend, in part, on the price of our common shares, which could change significantly) from time to time, there can be no assurance that we will not be a PFIC for any taxable year. In general, a non-U.S. corporation will be considered a PFIC for any taxable year in which either (i) 75% or more of its gross income consists of passive income or (ii) 50% or more of the average quarterly value of its assets consists of assets that produce, or are held for the production of, passive income. For purposes of the above calculations, a non-U.S. corporation that directly or indirectly owns at least 25% by value of the shares of another corporation is treated as if it held its proportionate share of the assets of the other corporation and received directly its proportionate share of the income of the other corporation. Passive income generally includes dividends, interest, rents, royalties and capital gains.
If we were a PFIC for any taxable year during which a U.S. Holder held common shares, gain recognized by a U.S. Holder on a sale or other disposition (including certain pledges) of the common shares would be allocated
128
ratably over the U.S. Holder’s holding period for the common shares. The amounts allocated to the taxable year of the sale or other disposition and to any year before we became a PFIC would be taxed as ordinary income. The amount allocated to each other taxable year would be subject to tax at the highest rate in effect for individuals or corporations, as appropriate, for that taxable year, and an interest charge would be imposed on the resulting tax liability. Further, to the extent that any distribution received by a U.S. Holder on its common shares exceeds 125% of the average of the annual distributions on the common shares received during the preceding three years or the U.S. Holder’s holding period, whichever is shorter, that distribution would be subject to taxation in the same manner as gain, described immediately above. In addition, if we were a PFIC or, with respect to a particular U.S. Holder, were treated as a PFIC for the taxable year in which we paid a dividend or for the prior taxable year, the favorable rate discussed above with respect to dividends paid to certain noncorporate U.S. Holders would not apply. Certain elections may be available that would result in alternative treatments (such as mark-to-market treatment) of the common shares. U.S. Holders should consult their tax advisors to determine whether any of these elections would be available and, if so, what the consequences of the alternative treatments would be in their particular circumstances.
In addition, if we were a PFIC, annual Internal Revenue Service reporting obligations would apply to U.S. Holders.
Information Reporting and Backup Withholding
Payments of dividends and sales proceeds that are made within the United States or through certain U.S.-related financial intermediaries generally are subject to information reporting, and may be subject to backup withholding, unless (i) the U.S. Holder is an exempt recipient or (ii) in the case of backup withholding, the U.S. Holder provides a correct taxpayer identification number and certifies that it is not subject to backup withholding.
The amount of any backup withholding from a payment to a U.S. Holder will be allowed as a credit against the holder’s U.S. federal income tax liability and may entitle it to a refund, provided that the required information is timely furnished to the Internal Revenue Service.
129
UNDERWRITING
Credit Suisse Securities (USA) LLC and Citigroup Global Markets Inc. are acting as global coordinators and joint book-running managers of the offering and as representatives of the underwriters named below. Subject to the terms and conditions stated in the underwriting agreement dated the date of this prospectus, each underwriter named below has severally agreed to purchase, and we have agreed to sell to that underwriter, the number of shares set forth opposite the underwriter’s name.
| | |
Underwriter | | Number
of Shares |
Credit Suisse Securities (USA) LLC | | |
Citigroup Global Markets Inc | | |
Needham & Company, LLC | | |
Pacific Crest Securities LLC | | |
Piper Jaffray & Co. | | |
Santander Investment Securities Inc | | |
ThinkEquity LLC | | |
| | |
Total | | |
| | |
The underwriting agreement provides that the underwriters are obligated to purchase all the shares of common stock in the offering if any are purchased, other than those shares covered by the overallotment option described below. The underwriting agreement also provides that if an underwriter defaults the purchase commitments of nondefaulting underwriters may be increased or the offering may be terminated.
All sales of the common stock in the United States will be made by U.S. registered broker/dealers.
We and the selling shareholders have granted to the underwriters a 30-day option to purchase on a pro rata basis up to 843,750 additional shares from us and an aggregate of 843,750 additional outstanding shares from the selling shareholders at the initial public offering price less the underwriting discounts and commissions. The option may be exercised only to cover any overallotments of common shares.
The underwriters propose to offer the shares of common stock initially at the public offering price on the cover page of this prospectus and to selling group members at that price less a selling concession of $ per share. After the initial public offering the representatives may change the public offering price and concession.
The following table summarizes the compensation and estimated expenses we and the selling shareholders will pay:
| | | | | | | | | | | | | | | | |
| | | Per Share | | | Total | |
| | | Without
Over-
allotment | | | With Over-
allotment | | | Without
Over-
allotment | | | With Over-
allotment | |
Underwriting discounts and commissions paid by us | | $ | | | | $ | | | | $ | | | | $ | | |
Expenses payable by us | | $ | | | | $ | | | | $ | | | | $ | | |
Underwriting discounts and commissions paid by selling shareholders | | $ | | | | $ | | | | $ | | | | $ | | |
Expenses payable by the selling shareholders | | $ | | | | $ | | | | $ | | | | $ | | |
The representatives have informed us that the underwriters do not expect sales to accounts over which the underwriters have discretionary authority to exceed 5% of the shares of common stock being offered. The underwriters have agreed to reimburse us for certain expenses we incur in connection with the offering.
130
We have agreed that we will not, directly or indirectly, take any of the following actions with respect to any shares of our common stock or any securities convertible into or exchangeable or exercisable for any shares of our common stock (which we refer to collectively as lockup securities): offer, sell, issue, contract to sell, pledge or otherwise dispose of lockup securities; offer, sell, issue, contract to sell, contract to purchase or grant any option, right or warrant to purchase lockup securities; enter into any swap, hedge or any other agreement that transfers, in whole or in part, the economic consequences of ownership of lockup securities; establish or increase a put equivalent position or liquidate or decrease a call equivalent position in lockup securities within the meaning of Section 16 of the Exchange Act; file with the Securities and Exchange Commission a registration statement under the Securities Act relating to lockup securities; or publicly disclose the intention to take any such action, without the prior written consent of the representatives, for a period of 180 days after the date of the underwriting agreement or until such earlier date that the representatives consent to in writing, except: grants of employee stock options pursuant to the terms of a plan in effect on the date of the underwriting agreement and described in this prospectus; issuances of lockup securities pursuant to the exercise of such options or the exercise of any other employee stock options outstanding on the date of the underwriting agreement and described in this prospectus; or issuances of lockup securities pursuant to our dividend reinvestment plan. However, in the event that either (1) during the last 17 days of the lockup period, we release earnings results or material news, or a material event relating to us occurs, or (2) prior to the expiration of the lockup period, we announce that we will release earnings results during the 16-day period beginning on the last day of the lockup period, then in either case the expiration of the lockup will be extended until the expiration of the 18-day period beginning on the date of the release of the earnings results or the occurrence of the material news or event, as applicable, unless the representatives waive, in writing, such an extension.
Our executive officers and directors, and our shareholders have agreed that they will not, directly or indirectly, take any of the following actions with respect to lockup securities: offer, sell, issue, contract to sell, pledge or otherwise dispose of lockup securities; offer, sell, issue, contract to sell, contract to purchase or grant any option, right or warrant to purchase lockup securities; enter into any swap, hedge or any other agreement that transfers, in whole or in part, the economic consequences of ownership of lockup securities; establish or increase a put equivalent position or liquidate or decrease a call equivalent position in lockup securities within the meaning of Section 16 of the Exchange Act; file with the Securities and Exchange Commission a registration statement under the Securities Act relating to lockup securities; or publicly disclose the intention to take any such action, without the prior written consent of the representatives, for a period of 180 days after the date of the underwriting agreement or until such earlier date that the representatives consent to in writing. However, in the event that either (1) during the last 17 days of the lockup period, we release earnings results or material news, or a material event relating to us occurs, or (2) prior to the expiration of the lockup” period, we announce that we will release earnings results during the 16-day period beginning on the last day of the “lockup” period, then in either case the expiration of the “lockup” will be extended until the expiration of the 18-day period beginning on the date of the release of the earnings results or the occurrence of the material news or event, as applicable, unless the representatives waive, in writing, such an extension.
We and the selling shareholders have agreed to indemnify the underwriters against liabilities under the Securities Act, or contribute to payments that the underwriters may be required to make in that respect.
We have applied to list the shares of common stock on The NASDAQ Stock Market under the symbol “TMWE”.
This offering constitutes our initial public offering of shares, and no public market for our shares currently exists. The initial public offering price has been determined by negotiations among the selling shareholders, the joint global coordinators and us. Among the factors considered in determining the initial public offering price were our future prospects and the prospects of our industry in general, our revenue, net income and certain other financial and operating information in recent periods, and the financial ratios, market prices of securities and certain financial and operating information of companies engaged in activities similar to ours.
131
In connection with the offering, the underwriters may engage in stabilizing transactions, overallotment transactions, syndicate covering transactions, penalty bids in accordance with Regulation M under the Exchange Act.
| | • | | Stabilizing transactions permit bids to purchase the underlying security so long as the stabilizing bids do not exceed a specified maximum. |
| | • | | Overallotment involves sales by the underwriters of shares in excess of the number of shares the underwriters are obligated to purchase, which creates a syndicate short position. The short position may be either a covered short position or a naked short position. In a covered short position, the number of shares over-allotted by the underwriters is not greater than the number of shares that they may purchase in the overallotment option. In a naked short position, the number of shares involved is greater than the number of shares in the overallotment option. The underwriters may close out any covered short position by either exercising their overallotment option and/or purchasing shares in the open market. |
| | • | | Syndicate covering transactions involve purchases of the common stock in the open market after the distribution has been completed in order to cover syndicate short positions. In determining the source of shares to close out the short position, the underwriters will consider, among other things, the price of shares available for purchase in the open market as compared to the price at which they may purchase shares through the overallotment option. If the underwriters sell more shares than could be covered by the overallotment option, a naked short position, the position can only be closed out by buying shares in the open market. A naked short position is more likely to be created if the underwriters are concerned that there could be downward pressure on the price of the shares in the open market after pricing that could adversely affect investors who purchase in the offering. |
| | • | | Penalty bids permit the representatives to reclaim a selling concession from a syndicate member when the common stock originally sold by the syndicate member is purchased in a stabilizing or syndicate covering transaction to cover syndicate short positions. |
These stabilizing transactions, syndicate covering transactions and penalty bids may have the effect of raising or maintaining the market price of our common stock or preventing or retarding a decline in the market price of the common stock. As a result, the price of our common stock may be higher than the price that might otherwise exist in the open market. These transactions may be effected on The NASDAQ Stock Market or otherwise and, if commenced, may be discontinued at any time.
The underwriters have performed commercial banking, investment banking and advisory services for us from time to time for which they have received customary fees and reimbursement of expenses. The underwriters may, from time to time, engage in transactions and perform services for us in the ordinary course of their business for which they may receive customary fees and reimbursement of expenses.
Notice to Prospective Investors in the European Economic Area
In relation to each Member State of the European Economic Area which has implemented the Prospectus Directive each, a “Relevant Member State”), with effect from and including the date on which the Prospectus Directive is implemented in that Relevant Member State (the “Relevant Implementation Date”), an offer to the public of any of our common shares which are the subject of the offering contemplated by this prospectus (the “Securities”) may not be made in that Relevant Member State except that an offer to the public in that Relevant Member State of any Securities may be made at any time with effect from and including the Relevant Implementation Date under the following exemptions under the Prospectus Directive, if they have been implemented in that Relevant Member State:
(a) to legal entities which are qualified investors as defined in the Prospectus Directive;
(b) to fewer than 100, or, if the Relevant Member State has implemented the relevant provisions of the 2010 PD Amending Directive, 150, natural or legal persons (other than qualified investors as defined in the Prospectus Directive), as permitted under the Prospectus Directive, subject to obtaining the prior consent of the global coordinators and joint book-running managers for any such offer; or
132
(c) in any other circumstances falling within Article 3(2) of the Prospectus Directive,
provided that no such offer of Securities shall require us or any underwriter to publish a prospectus pursuant to Article 3 of the Prospectus Directive.
For the purposes of this provision, the expression an “offer to the public” in relation to any Securities in any Relevant Member State means the communication in any form and by any means of sufficient information on the terms of the offer and any Securities to be offered so as to enable an investor to decide to purchase any Securities, as the same may be varied in that Member State by any measure implementing the Prospectus Directive in that Member State, the expression “Prospectus Directive” means Directive 2003/71/EC (and amendments thereto, including the 2010 PD Amending Directive, to the extent implemented in the Relevant Member State), and includes any relevant implementing measure in each Relevant Member State and the expression “2010 PD Amending Directive” means Directive 2010/73/EU.
This EEA selling restriction is in addition to any other selling restrictions set out in this prospectus.
Notice to Prospective Investors in the United Kingdom
This communication is only being distributed to and is only directed at (i) persons who are outside the United Kingdom or (ii) investment professionals falling within Article 19(5) of the Financial Services and Markets Act 2000 (Financial Promotion) Order 2005 (the “Order”) or (iii) high net worth companies, and other persons to whom it may lawfully be communicated, falling within Article 49(2)(a) to (d) of the Order (all such persons together being referred to as “relevant persons”). Our common stock is only available to, and any invitation, offer or agreement to subscribe, purchase or otherwise acquire such common stock will be engaged in only with, relevant persons. Any person who is not a relevant person should not act or rely on this document or any of its contents.
Notice to Prospective Investors in France
Neither this prospectus nor any other offering material relating to the shares described in this prospectus has been submitted to the clearance procedures of the Autorité des Marchés Financiers or of the competent authority of another member state of the European Economic Area and notified to the Autorité des Marchés Financiers. The shares have not been offered or sold and will not be offered or sold, directly or indirectly, to the public in France. Neither this prospectus nor any other offering material relating to the shares has been or will be:
| | • | | released, issued, distributed or caused to be released, issued or distributed to the public in France; or |
| | • | | used in connection with any offer for subscription or sale of the shares to the public in France. |
Such offers, sales and distributions will be made in France only:
| | • | | to qualified investors (investisseurs qualifiés) and/or to a restricted circle of investors (cercle restreint d’investisseurs), in each case investing for their own account, all as defined in, and in accordance with articles L.411-2, D.411-1, D.411-2, D.734-1, D.744-1, D.754-1 and D.764-1 of the French Code monétaire et financier; |
| | • | | to investment services providers authorized to engage in portfolio management on behalf of third parties; or |
| | • | | in a transaction that, in accordance with article L.411-2-II-1°-or-2°-or 3° of the French Code monétaire et financier and article 211-2 of the General Regulations (Règlement Général) of the Autorité des Marchés Financiers, does not constitute a public offer (appel public à l’épargne). |
The shares may be resold directly or indirectly, only in compliance with articles L.411-1, L.411-2, L.412-1 and L.621-8 through L.621-8-3 of the French Code monétaire et financier.
133
Notice to Prospective Investors in Hong Kong
The shares may not be offered or sold in Hong Kong by means of any document other than (i) in circumstances which do not constitute an offer to the public within the meaning of the Companies Ordinance (Cap. 32, Laws of Hong Kong), or (ii) to “professional investors” within the meaning of the Securities and Futures Ordinance (Cap. 571, Laws of Hong Kong) and any rules made thereunder, or (iii) in other circumstances which do not result in the document being a “prospectus” within the meaning of the Companies Ordinance (Cap. 32, Laws of Hong Kong) and no advertisement, invitation or document relating to the shares may be issued or may be in the possession of any person for the purpose of issue (in each case whether in Hong Kong or elsewhere), which is directed at, or the contents of which are likely to be accessed or read by, the public in Hong Kong (except if permitted to do so under the laws of Hong Kong) other than with respect to shares which are or are intended to be disposed of only to persons outside Hong Kong or only to “professional investors” within the meaning of the Securities and Futures Ordinance (Cap. 571, Laws of Hong Kong) and any rules made thereunder.
Notice to Prospective Investors in Japan
The shares offered in this prospectus have not been registered under the Securities and Exchange Law of Japan. The shares have not been offered or sold and will not be offered or sold, directly or indirectly, in Japan or to or for the account of any resident of Japan, except (i) pursuant to an exemption from the registration requirements of the Securities and Exchange Law and (ii) in compliance with any other applicable requirements of Japanese law.
Notice to Prospective Investors in Singapore
This prospectus has not been registered as a prospectus with the Monetary Authority of Singapore. Accordingly, this prospectus and any other document or material in connection with the offer or sale, or invitation for subscription or purchase, of the shares may not be circulated or distributed, nor may the shares be offered or sold, or be made the subject of an invitation for subscription or purchase, whether directly or indirectly, to persons in Singapore other than (i) to an institutional investor under Section 274 of the Securities and Futures Act, Chapter 289 of Singapore (the “SFA”), (ii) to a relevant person pursuant to Section 275(1), or any person pursuant to Section 275(1A), and in accordance with the conditions specified in Section 275 of the SFA or (iii) otherwise pursuant to, and in accordance with the conditions of, any other applicable provision of the SFA, in each case subject to compliance with conditions set forth in the SFA.
Where the shares are subscribed or purchased under Section 275 of the SFA by a relevant person which is:
| | • | | a corporation (which is not an accredited investor (as defined in Section 4A of the SFA)) the sole business of which is to hold investments and the entire share capital of which is owned by one or more individuals, each of whom is an accredited investor; or |
| | • | | a trust (where the trustee is not an accredited investor) whose sole purpose is to hold investments and each beneficiary of the trust is an individual who is an accredited investor, |
shares, debentures and units of shares and debentures of that corporation or the beneficiaries’ rights and interest (howsoever described) in that trust shall not be transferred within six months after that corporation or that trust has acquired the shares pursuant to an offer made under Section 275 of the SFA except:
| | • | | to an institutional investor (for corporations, under Section 274 of the SFA) or to a relevant person defined in Section 275(2) of the SFA, or to any person pursuant to an offer that is made on terms that such shares, debentures and units of shares and debentures of that corporation or such rights and interest in that trust are acquired at a consideration of not less than S$200,000 (or its equivalent in a foreign currency) for each transaction, whether such amount is to be paid for in cash or by exchange of securities or other assets, and further for corporations, in accordance with the conditions specified in Section 275 of the SFA; |
| | • | | where no consideration is or will be given for the transfer; or |
| | • | | where the transfer is by operation of law. |
134
Brazil
| | • | | For purposes of Brazilian law, this offer of securities is addressed to you personally, upon your request and for your sole benefit, and is not to be transmitted to anyone else, to be relied upon elsewhere or for any other purpose either quoted or referred to in any other public or private document or to be filed with anyone without our prior, express and written consent. |
| | • | | Therefore, as this prospectus does not constitute or form part of any public offering to sell or solicitation of a public offering to buy any shares or assets, the offering and THE COMMON SHARES OFFERED HEREBY HAVE NOT BEEN, AND WILL NOT BE, AND MAY NOT BE OFFERED FOR SALE OR SOLD IN BRAZIL EXCEPT IN CIRCUMSTANCES WHICH DO NOT CONSTITUTE A PUBLIC OFFERING OR DISTRIBUTION UNDER BRAZILIAN LAWS AND REGULATIONS. DOCUMENTS RELATING TO THE COMMON SHARES, AS WELL AS THE INFORMATION CONTAINED THEREIN, MAY NOT BE SUPPLIED TO THE PUBLIC, AS A PUBLIC OFFERING IN BRAZIL OR BE USED IN CONNECTION WITH ANY OFFER FOR SUBSCRIPTION OR SALE OF THE COMMON SHARES TO THE PUBLIC IN BRAZIL. |
Argentina
The common shares are not authorized for public offering in Argentina and they may not be sold publicly under the Argentine Securities Law No. 17,811, as amended. Therefore, any such transaction must be made privately.
Chile
The common shares are not registered in the Securities Registry (Registro de Valores) or subject to the control of the Chilean Securities and Exchange Commission (Superintendencia de Valores y Seguros de Chile). This prospectus and other offering materials relating to the offer of the common shares do not constitute a public offer of, or an invitation to subscribe for or purchase, the common shares in the Republic of Chile, other than to individually identified purchasers pursuant to a private offering within the meaning of Article 4 of the Chilean Securities Market Act (Ley de Mercado de Valores) (an offer that is not “addressed to the public at large or to a certain sector or specific group of the public”).
Mexico
The securities have not been registered with the National Securities’ Registry (Registro Nacional de Valores) maintained by the National Banking and Securities Commission (Comisión Nacional Bancaria y de Valores or CNBV), and may not be offered or sold publicly in Mexico.
This document is not intended to be publicly distributed to an undetermined person through mass media, nor to serve as an application for the registration of the securities in Mexico, nor as a prospectus for their public offering in said jurisdiction.
This document is addressed to you under a private offering exception contained in article 8 of the Securities Market Law (Ley del Mercado de Valores or LMV), for which you must comply with any of the following requirements:
(a) you are either an institutional or qualified investor for purposes of Mexican law;
(b) you are a member of a group of less than 100 individually identified people to whom the common shares are being offered directly and personally; or
(c) you are an employee of the issuer and a beneficiary of an employees’ benefit plan of said issuer.
135
The LMV and CNBV regulations (along with other laws applicable in Mexico) define institutional investors as Mexican and foreign banks, broker-dealers, insurance and bond companies, bonded warehouses, financial leasing companies, factoring companies and investment funds, private pension and annuities funds and foreign pension and investment funds. Such regulations also define qualified investors as individuals and corporations which maintain during the previous year investments in securities for an amount equal or similar to 1.5 million Mexican Unidades de Inversión or UDIS (approximately $330,000 dollars) or that have obtained during the previous two years a gross income of at least 500,000 UDIS (approximately $110,000) per year.
Uruguay
This offering of common shares is not authorized for public offering in Uruguay and may not be sold publicly under Uruguayan Securities Law 18,627 unless registered according to the terms and conditions established therein. The common shares are being offered privately and may only be offered directly to natural persons or determined legal entities and shall not be offered on the Uruguayan Stock Exchange (Bolsa Electrónica de Valores del Uruguay S.A.) nor be advertised by any means.
136
EXPENSES OF THE OFFERING
We estimate that the expenses payable by us in connection with this offering, other than underwriting discounts, will be as follows:
| | | | |
| | | Amount | |
| | | (in $
thousands) | |
Expenses: | | | | |
SEC registration fee | | | 21.0 | |
FINRA filing fee | | | 18.6 | |
NASDAQ listing fee | | | 225.0 | |
Printing and engraving expenses | | | 48.5 | |
Legal fees and expenses | | | 2,850.2 | |
Accounting fees and expenses | | | 2,137.7 | |
Road show expenses | | | 200.0 | |
Initial public offering completion bonus | | | 6,270.4 | |
Miscellaneous costs | | | 1,000.0 | |
Total | | | 12,771.4 | |
We anticipate that the total underwriting discount on shares offered by us in the offering will be approximately $6.8 million, or 7% of the gross proceeds to us of the offering, assuming no exercise of the underwriters’ overallotment option.
All amounts in the table are estimates except the SEC registration fee and the FINRA filing fee.
LEGAL MATTERS
The validity of our common shares and certain matters governed by Portuguese law will be passed on for us by CCA Advogados, our Portuguese counsel, and for the underwriters by Morais Leitão, Galvão Teles, Soares da Silva & Associados, Portuguese counsel for the underwriters.
Certain other matters governed by U.S. federal and New York state law will be passed on for us by Davis Polk & Wardwell LLP, our U.S. counsel, and for the underwriters by Cleary Gottlieb Steen & Hamilton LLP, U.S. counsel for the underwriters.
EXPERTS
Our consolidated financial statements at December 31, 2009 and 2010 and for each of the years ended December 31, 2008, 2009 and 2010 prepared in accordance with IFRS-IASB included elsewhere in this prospectus have been audited by KPMG & Associados—Sociedade de Revisores Oficiais de Contas, S.A., our independent auditors.
The cost of external audit services provided to us for the year ended December 31, 2008 was €0.3 million, compared with €0.2 million for the year ended December 31, 2009 and €0.2 million for the year ended December 31, 2010. We also paid total fees of €0.1 million, €0.1 million and €0.1 million for non-audit services for the years ended December 31, 2008, 2009 and 2010, respectively. The above figures for audit-related services and non-audit services include fees paid to KPMG & Associados—Sociedade de Revisores Oficiais de Contas, S.A. as our independent auditors for the relevant period.
137
SERVICE OF PROCESS AND ENFORCEMENT OF JUDGMENTS
We are incorporated under the laws of Portugal. All of our directors and officers reside outside the United States. Substantially all of our assets are located outside the United States. As a result, it may not be possible, or it may be difficult, for you to effect service of process upon us or these other persons within the United States or to enforce judgments obtained in U.S. courts against us or them, including those predicated upon the civil liability provisions of the U.S. federal securities laws.
We have appointed CT Corporation as our authorized agent upon whom process may be served in any action instituted in any U.S. federal or state court having subject matter jurisdiction in the Borough of Manhattan in New York, New York, arising out of or based upon the common shares or the underwriting agreement related to the shares.
Notwithstanding the foregoing, we cannot assure you that a Portuguese court would enforce a U.S.-based judgment with respect to the shares based on U.S. securities laws. We have been advised by our Portuguese counsel that there is no legal basis for original actions to be brought against us or our directors and executive officers in a Portuguese court predicated solely upon the provisions of the U.S. securities laws. In addition, certain remedies available under provisions of the U.S. securities laws may not be admitted or enforced by Portuguese courts.
138
WHERE YOU CAN FIND MORE INFORMATION
We have filed with the SEC a registration statement on Form F-1, including amendments and relevant exhibits and schedules, under the Securities Act covering the common shares to be sold in this offering. This prospectus, which constitutes a part of the registration statement, summarizes material provisions of contracts and other documents that we refer to in the prospectus. Since this prospectus does not contain all of the information contained in the registration statement, you should read the registration statement and its exhibits and schedules for further information with respect to us and our common shares. You may review and copy the registration statement, reports and other information we file at the SEC’s public reference room at 100 F Street, N.E., Washington, D.C. 20549. You may also request copies of these documents upon payment of a duplicating fee by writing to the SEC. For further information on the public reference facility, please call the SEC at 1-800-SEC-0330. Our SEC filings, including the registration statement, are also available to you on the SEC’s Web site athttp://www.sec.gov.
Immediately upon completion of this offering, we will become subject to periodic reporting and other informational requirements of the Exchange Act as applicable to foreign private issuers. Our annual reports on Form 20-F for the year ended December 31, 2011 and subsequent years will be due four months following the fiscal year end. We are not required to disclose certain other information that is required from U.S. domestic issuers. Also, as a foreign private issuer, we are exempt from the rules of the Exchange Act prescribing the furnishing of proxy statements to shareholders and our executive officers, directors and principal shareholders are exempt from the reporting and short-swing profit recovery provisions contained in Section 16 of the Exchange Act.
As a foreign private issuer, we are also exempt from the requirements of Regulation FD (Fair Disclosure) which, generally, are meant to ensure that select groups of investors are not privy to specific information about an issuer before other investors. We are, however, still subject to the anti-fraud and anti-manipulation rules of the SEC, such as Rule 10b-5. Since many of the disclosure obligations required of us as a foreign private issuer are different than those required by other U.S. domestic reporting companies, our shareholders, potential shareholders and the investing public in general, should not expect to receive information about us in the same amount and at the same time as information is received from, or provided by, U.S. domestic reporting companies. We are liable for violations of the rules and regulations of the SEC, which do apply to us as a foreign private issuer.
139
TIM w.e. SGPS, S.A.
INDEX TO CONSOLIDATED FINANCIAL STATEMENTS
| | | | |
Report of Independent Registered Public Accounting Firm | | | F-2 | |
Consolidated Statements of Income | | | F-3 | |
Consolidated Statements of Comprehensive Income | | | F-4 | |
Consolidated Statements of Financial Position | | | F-5 | |
Consolidated Statements of Cash Flows | | | F-6 | |
Consolidated Statements of Changes in Equity | | | F-7 | |
Notes to the Consolidated Financial Statements | | | F-8 | |
Unaudited Condensed Consolidated Statements of Income for the three month periods ended March 31, 2011 and March 31, 2010 | | | F-44 | |
Unaudited Condensed Consolidated Statements of Comprehensive Income three month periods ended March 31, 2011 and March 31, 2010 | | | F-45 | |
Unaudited Condensed Consolidated Statements of Financial Position as of March 31, 2011 and December 31, 2010 | | | F-46 | |
Unaudited Condensed Consolidated Statements of Cash Flows for the three month periods ended March 31, 2011 and March 31, 2010 | | | F-47 | |
Unaudited Condensed Consolidated Statements of Changes in Equity for the three month periods ended March 31, 2011 and December 31, 2010 | | | F-48 | |
Notes to the Unaudited Condensed Consolidated Financial Statements | | | F-49 | |
F-1

| | | | |
| | KPMG & Associados - Sociedade de Revisores Oficiais de Contas, S.A. Edificio Monumental Av. Praia da Vitória, 71-A, 11° 1069-006 Lisboa Portugal | | Telefone: +351 210 110 000 Fax: +351 210 110 121 Internet: www.kpmg.pt |
Report of Independent Registered Public Accounting Firm
The Board of Directors and Stockholders
Tim w.e. SGPS, S.A.
We have audited the accompanying consolidated statement of financial position of Tim w.e. SGPS, S.A. and subsidiaries as of December 31, 2010 and 2009, and the related consolidated statements of income, comprehensive income, changes in equity, and cash flows for each of the years in the three-year period ended December 31, 2010. These consolidated financial statements are the responsibility of the Company’s management. Our responsibility is to express an opinion on these consolidated financial statements based on our audits.
We conducted our audits in accordance with the standards of the Public Company Accounting Oversight Board (United States). Those standards require that we plan and perform the audit to obtain reasonable assurance about whether the financial statements are free of material misstatement. An audit includes examining, on a test basis, evidence supporting the amounts and disclosures in the financial statements. An audit also includes assessing the accounting principles used and significant estimates made by management, as well as evaluating the overall financial statement presentation. We believe that our audits provide a reasonable basis for our opinion.
In our opinion, the consolidated financial statements referred to above present fairly, in all material respects, the financial position of Tim w.e. SGPS, S.A. and subsidiaries as of December 31, 2010 and 2009, and the results of their operations and their cash flows for each of the years in the three-year period ended December 31, 2010, in conformity with International Financial Reporting Standards, as issued by the International Accounting Standards Board.
Lisbon, July 18, 2011
| | | | |

| | | | |
| KPMG & Associados – | | | | |
| Sociedade de Revisores Oficiais de Contas, S.A. | | | | |
| | | | |
KPMG & Associados - Sociedade de Revisores Oficiais de Contas, S.A., a firma portuguesa membro da rede KPMG, composta por firmas independentes afiliadas da KPMG International Cooperative (‘KPMG International’), uma entidade suica. | | KPMG & Associados - S.R.O.C., S.A. Capital Social: 2.840.000 Euros - Pessoa Colectiva N° PT 502 161 078 - Inscrito na O.R.O.C. N° 189 - Inscrito na C.M.V.M. N° 9093 | | Matriculada na Conservatória do registo Comercial de Lisboa sob o N° PT 502 161 078 |
F-2
CONSOLIDATED STATEMENTS OF INCOME
in Euro thousands, except shares and per share amounts
| | | | | | | | | | | | | | |
| | | | | Years ended December 31, | |
| | | Note | | 2010 | | | 2009 | | | 2008 | |
Revenue | | 5 | | | 233,851 | | | | 166,241 | | | | 125,339 | |
Operating expenses | | | | | | | | | | | | | | |
Cost of service delivery | | 6 | | | (117,318 | ) | | | (97,056 | ) | | | (65,059 | ) |
Commercial and production costs | | 7 | | | (76,025 | ) | | | (37,130 | ) | | | (35,292 | ) |
Personnel costs | | 8 | | | (9,585 | ) | | | (8,758 | ) | | | (6,519 | ) |
General and administrative | | 9 | | | (7,526 | ) | | | (6,980 | ) | | | (6,162 | ) |
Tax expenses | | 10 | | | (3,263 | ) | | | (2,306 | ) | | | (2,150 | ) |
Amortization and depreciation | | 17 and 18 | | | (4,225 | ) | | | (2,490 | ) | | | (1,605 | ) |
Provisions expense | | 22 | | | (589 | ) | | | (405 | ) | | | (116 | ) |
| | | | | | | | | | | | | | |
Total operating expenses | | | | | (218,531 | ) | | | (155,125 | ) | | | (116,903 | ) |
| | | | | | | | | | | | | | |
Operating profit | | | | | 15,320 | | | | 11,116 | | | | 8,436 | |
Finance income | | 11 | | | 1,650 | | | | 139 | | | | 570 | |
Finance costs | | 11 | | | (2,576 | ) | | | (2,415 | ) | | | (1,500 | ) |
| | | | | | | | | | | | | | |
| | | | | (926 | ) | | | (2,276 | ) | | | (930 | ) |
| | | | | | | | | | | | | | |
Profit before income taxes | | | | | 14,394 | | | | 8,840 | | | | 7,506 | |
| | | | | | | | | | | | | | |
Income tax expenses | | 15 | | | (3,389 | ) | | | (1,676 | ) | | | (2,119 | ) |
| | | | | | | | | | | | | | |
Net income for the year | | | | | 11,005 | | | | 7,164 | | | | 5,387 | |
| | | | | | | | | | | | | | |
Profit/(loss) attributable to controlling interests | | | | | 9,938 | | | | 6,234 | | | | 5,413 | |
Profit/(loss) attributable to non-controlling interests | | | | | 1,067 | | | | 930 | | | | (26 | ) |
| | | | | | | | | | | | | | |
| | | | | 11,005 | | | | 7,164 | | | | 5,387 | |
| | | | | | | | | | | | | | |
Earnings per share | | | | | | | | | | | | | | |
Basic and Diluted (in Euros) | | 25 | | | 0.12 | | | | 0.08 | | | | 0.07 | |
| | | | | | | | | | | | | | |
Weighted-average shares used to compute earnings per share: | | | | | | | | | | | | | | |
Basic and Diluted (number of shares in thousands) | | 25 | | | 82,917 | | | | 82,917 | | | | 82,917 | |
| | | | | | | | | | | | | | |
See accompanying notes to consolidated financial statements.
F-3
CONSOLIDATED STATEMENTS OF COMPREHENSIVE INCOME
in Euro thousands, except shares and per share amounts
| | | | | | | | | | | | |
| | | Years ended December 31, | |
| | | 2010 | | | 2009 | | | 2008 | |
Net income for the year | | | 11,005 | | | | 7,164 | | | | 5,387 | |
| | | | | | | | | | | | |
Exchange differences on translation | | | (369 | ) | | | (1,284 | ) | | | (3,342 | ) |
Other comprehensive income | | | (9 | ) | | | (236 | ) | | | 9 | |
| | | | | | | | | | | | |
Total comprehensive income | | | 10,627 | | | | 5,644 | | | | 2,054 | |
| | | | | | | | | | | | |
Profit/(loss) attributable to controlling interests | | | 9,579 | | | | 4,545 | | | | 2,080 | |
Profit/(loss) attributable to non-controlling interests | | | 1,048 | | | | 1,099 | | | | (26 | ) |
| | | | | | | | | | | | |
| | | 10,627 | | | | 5,644 | | | | 2,054 | |
| | | | | | | | | | | | |
See accompanying notes to consolidated financial statements.
F-4
CONSOLIDATED STATEMENT OF FINANCIAL POSITION
in Euro thousands, except shares and per share amounts
| | | | | | | | | | |
| | | | | At December 31, | |
| | | Note | | 2010 | | | 2009 | |
ASSETS | | | | | | | | | | |
Current assets | | | | | | | | | | |
Cash and cash equivalents | | 12 | | | 8,610 | | | | 5,667 | |
Trade receivables | | 13 | | | 25,431 | | | | 18,738 | |
Inventories | | | | | 72 | | | | 307 | |
Prepaid expenses and other assets | | 14 | | | 3,238 | | | | 4,069 | |
Current income tax assets | | 15 | | | 3,280 | | | | 1,867 | |
Other tax assets | | 16 | | | 4,647 | | | | 3,375 | |
Assets classified as held for sale | | | | | — | | | | — | |
| | | | | | | | | | |
| | | | | 45,278 | | | | 34,023 | |
Non-current assets | | | | | | | | | | |
Property and equipment | | 17 | | | 2,775 | | | | 2,780 | |
Capitalized technology | | 18 | | | 5,536 | | | | 4,562 | |
Other intangible assets | | 18 | | | 3,139 | | | | 2,318 | |
Goodwill | | 19 | | | 642 | | | | 642 | |
Deferred income tax assets | | 15 | | | 2,119 | | | | 2,352 | |
Other assets | | | | | 87 | | | | 61 | |
| | | | | | | | | | |
| | | | | 14,298 | | | | 12,715 | |
| | | | | | | | | | |
Total assets | | | | | 59,576 | | | | 46,738 | |
| | | | | | | | | | |
EQUITY and LIABILITIES | | | | | | | | | | |
Current liabilities | | | | | | | | | | |
Accounts payable | | 20 | | | 20,084 | | | | 16,461 | |
Liabilities related to factoring operations | | 21 | | | 1,181 | | | | 77 | |
Current portion of long term debt | | 23 | | | 2,521 | | | | 2,061 | |
Current portion of finance lease obligations | | 24 | | | 1,038 | | | | 894 | |
Current income tax liabilities | | 15 | | | 535 | | | | 1,751 | |
Other tax liabilities | | 16 | | | 887 | | | | 1,495 | |
| | | | | | | | | | |
| | | | | 26,246 | | | | 22,739 | |
Non-current liabilities | | | | | | | | | | |
Provisions | | 22 | | | 699 | | | | 414 | |
Long-term debt | | 23 | | | 7,314 | | | | 8,143 | |
Long-term portion of finance lease obligations | | 24 | | | 1,036 | | | | 1,219 | |
Deferred income tax liabilities | | 15 | | | 269 | | | | 214 | |
Other non-current liabilities | | | | | — | | | | — | |
| | | | | | | | | | |
| | | | | 9,318 | | | | 9,990 | |
| | | | | | | | | | |
Total liabilities | | | | | 35,564 | | | | 32,729 | |
| | | | | | | | | | |
Equity | | | | | | | | | | |
Share capital (Par value of €0.03,
83,333,333 shares authorized and issued and
82,916,667 outstanding as of December 31, 2010 and 2009) | | 25 | | | 2,500 | | | | 2,500 | |
Treasury shares | | 25 | | | (750 | ) | | | (750 | ) |
Translation reserves | | 25 | | | (5,707 | ) | | | (5,357 | ) |
Retained earnings | | 25 | | | 26,406 | | | | 16,477 | |
| | | | | | | | | | |
Equity attributable to controlling interest stockholders | | | | | 22,449 | | | | 12,870 | |
Non-controlling interests | | 25 | | | 1,563 | | | | 1,139 | |
| | | | | | | | | | |
Total equity | | | | | 24,012 | | | | 14,009 | |
| | | | | | | | | | |
Total equity and liabilities | | | | | 59,576 | | | | 46,738 | |
| | | | | | | | | | |
See accompanying notes to consolidated financial statements.
F-5
CONSOLIDATED STATEMENTS OF CASH FLOWS
in Euro thousands, except shares and per share amounts
| | | | | | | | | | | | |
| | | Years ended December 31 | |
| | | 2010 | | | 2009 | | | 2008 | |
Operating activities | | | | | | | | | | | | |
Cash receipts from customers | | | 226,854 | | | | 167,174 | | | | 114,597 | |
Cash paid to suppliers | | | (198,852 | ) | | | (139,658 | ) | | | (104,248 | ) |
Cash paid to employees | | | (9,585 | ) | | | (8,758 | ) | | | (6,519 | ) |
Other operational payables and receivables | | | (1,276 | ) | | | (1,086 | ) | | | (1,469 | ) |
| | | | | | | | | | | | |
Income tax paid | | | (5,852 | ) | | | (4,032 | ) | | | (3,044 | ) |
| | | | | | | | | | | | |
Cash flows from operating activities | | | 11,289 | | | | 13,640 | | | | (683 | ) |
| | | | | | | | | | | | |
Investing activities | | | | | | | | | | | | |
Cash received from: | | | | | | | | | | | | |
Proceeds from sale of property and equipment | | | — | | | | 109 | | | | — | |
Interest received | | | 85 | | | | 62 | | | | — | |
Cash paid for: | | | | | | | | | | | | |
Investments | | | — | | | | — | | | | (61 | ) |
Capitalized technology | | | (4,445 | ) | | | (3,390 | ) | | | (3,254 | ) |
Acquisition of property and equipment | | | (1,039 | ) | | | (178 | ) | | | (2,055 | ) |
| | | | | | | | | | | | |
Cash flows from investing activities | | | (5,399 | ) | | | (3,397 | ) | | | (5,370 | ) |
| | | | | | | | | | | | |
Financing activities | | | | | | | | | | | | |
Loan proceeds | | | 3,500 | | | | 4,374 | | | | 15,319 | |
Loan repayments | | | (3,869 | ) | | | (10,143 | ) | | | (3,674 | ) |
Interest paid | | | (709 | ) | | | (1,897 | ) | | | (930 | ) |
Dividends paid | | | (624 | ) | | | — | | | | — | |
Sale / (acquisition) of own shares | | | — | | | | — | | | | (750 | ) |
| | | | | | | | | | | | |
Cash flows from financing activities | | | (1,702 | ) | | | (7,666 | ) | | | 9,965 | |
| | | | | | | | | | | | |
Increase in cash and cash equivalents | | | 4,188 | | | | 2,577 | | | | 3,912 | |
| | | | | | | | | | | | |
Cash and cash equivalents at January 1 | | | 5,667 | | | | 4,456 | | | | 3,886 | |
| | | | | | | | | | | | |
Effect of exchange rate fluctuations on cash held | | | (1,245 | ) | | | (1,366 | ) | | | (3,342 | ) |
| | | | | | | | | | | | |
Cash and cash equivalents at December 31 | | | 8,610 | | | | 5,667 | | | | 4,456 | |
| | | | | | | | | | | | |
See accompanying notes to consolidated financial statements.
F-6
CONSOLIDATED STATEMENTS OF CHANGES IN EQUITY
YEAR ENDED 31 DECEMBER 2010, 2009 and 2008
in Euro thousands, except shares and per share amounts
| | | | | | | | | | | | | | | | | | | | | | | | | | | | |
| | | Share capital | | | Treasury
share reserve | | | Translation
reserve | | | Retained
earnings | | | Total equity
attributable to
controlling
interests | | | Non-
controlling
interests | | | Total equity | |
Balance at 1 January 2008 | | | 2,500 | | | | — | | | | (563 | ) | | | 5,058 | | | | 6,995 | | | | 83 | | | | 7,078 | |
| | | | | | | | | | | | | | | | | | | | | | | | | | | | |
Profit for the year | | | — | | | | — | | | | — | | | | 5,413 | | | | 5,413 | | | | (26 | ) | | | 5,387 | |
Foreign currency translation adjustment | | | — | | | | — | | | | (3,342 | ) | | | — | | | | (3,342 | ) | | | — | | | | (3,342 | ) |
Other changes | | | — | | | | — | | | | — | | | | 9 | | | | 9 | | | | — | | | | 9 | |
| | | | | | | | | | | | | | | | | | | | | | | | | | | | |
Total comprehensive income for the year | | | — | | | | — | | | | (3,342 | ) | | | 5,422 | | | | 2,080 | | | | (26 | ) | | | 2,054 | |
| | | | | | | | | | | | | | | | | | | | | | | | | | | | |
Transfer to accumulated reserves | | | — | | | | — | | | | — | | | | — | | | | — | | | | — | | | | — | |
Share repurchase | | | — | | | | (750 | ) | | | — | | | | — | | | | (750 | ) | | | — | | | | (750 | ) |
Changes in non-controlling interests | | | — | | | | — | | | | — | | | | — | | | | — | | | | (17 | ) | | | (17 | ) |
| | | | | | | | | | | | | | | | | | | | | | | | | | | | |
Balance at 31 December 2008 | | | 2,500 | | | | (750 | ) | | | (3,905 | ) | | | 10,480 | | | | 8,325 | | | | 40 | | | | 8,365 | |
| | | | | | | | | | | | | | | | | | | | | | | | | | | | |
Profit for the year | | | — | | | | — | | | | — | | | | 6,234 | | | | 6,234 | | | | 931 | | | | 7,165 | |
Foreign currency translation adjustment | | | — | | | | — | | | | (1,452 | ) | | | — | | | | (1,452 | ) | | | 168 | | | | (1,284 | ) |
Other changes | | | — | | | | — | | | | — | | | | (237 | ) | | | (237 | ) | | | — | | | | (237 | ) |
| | | | | | | | | | | | | | | | | | | | | | | | | | | | |
Total comprehensive income for the year | | | — | | | | — | | | | (1,452 | ) | | | 5,997 | | | | 4,545 | | | | 1,099 | | | | 5,644 | |
| | | | | | | | | | | | | | | | | | | | | | | | | | | | |
Transfer to accumulated reserves | | | — | | | | — | | | | — | | | | — | | | | — | | | | — | | | | — | |
| | | | | | | | | | | | | | | | | | | | | | | | | | | | |
Balance at 31 December 2009 | | | 2,500 | | | | (750 | ) | | | (5,357 | ) | | | 16,477 | | | | 12,870 | | | | 1,139 | | | | 14,009 | |
| | | | | | | | | | | | | | | | | | | | | | | | | | | | |
Profit for the year | | | — | | | | — | | | | — | | | | 9,938 | | | | 9,938 | | | | 1,067 | | | | 11,005 | |
Foreign currency translation adjustment | | | — | | | | — | | | | (350 | ) | | | — | | | | (350 | ) | | | (19 | ) | | | (369 | ) |
Other changes | | | — | | | | — | | | | — | | | | (9 | ) | | | (9 | ) | | | — | | | | (9 | ) |
| | | | | | | | | | | | | | | | | | | | | | | | | | | | |
Total comprehensive income for the year | | | — | | | | — | | | | (350 | ) | | | 9,929 | | | | 9,579 | | | | 1,048 | | | | 10,627 | |
| | | | | | | | | | | | | | | | | | | | | | | | | | | | |
Dividends paid in 2010 | | | — | | | | — | | | | — | | | | — | | | | — | | | | (624 | ) | | | (624 | ) |
| | | | | | | | | | | | | | | | | | | | | | | | | | | | |
Balance at 31 December 2010 | | | 2,500 | | | | (750 | ) | | | (5,707 | ) | | | 26,406 | | | | 22,449 | | | | 1,563 | | | | 24,012 | |
| | | | | | | | | | | | | | | | | | | | | | | | | | | | |
See accompanying notes to consolidated financial statements.
F-7
NOTES TO THE CONSOLIDATED FINANCIAL STATEMENTS
1. ORGANIZATION
Description of Business
Tim w.e., SGPS, S.A. (“we,” “us,” “our,” “the Group,” “Company”) is a global provider of mobile monetization solutions to carriers, brands, media companies and governments, providing mobile marketing, mobile entertainment and mobile money products and services through our proprietary technology platforms.
We are a global provider of mobile monetization solutions to carriers, brands, media companies and governments, providing mobile marketing, mobile entertainment and mobile money products and services through our proprietary technology platforms. We leverage our broad connections to mobile operators and their users, along with our in-depth knowledge of local markets, to facilitate the monetization and distribution of content that is tailored to local preferences.
Group Structure
Tim w.e., SGPS, S.A. is a company domiciled in Portugal. The consolidated financial statements of the Group as at and for the year ended December 31, 2010 comprise the Group and its subsidiaries and the Group’s interest in associates and jointly controlled entities.
The consolidated financial statements of the Group are presented in Euro (“€”), which is the functional currency of the Group.
At December 31, 2010, the Group had direct and indirect interests in the following subsidiaries:
| | | | | | | | | | | | | | |
| | | Headquarters | | % ownership at December 31, | |
| | | 2010 | | | 2009 | | | 2008 | |
The principal activity if the following company is to be the holding company for the group | |
Tim we SGPS, SA | | Portugal | | | 100.0 | % | | | 100.0 | % | | | 100.0 | % |
| | | | |
Subsidiaries: | | | | | | | | | | | | | | |
|
| For each of the following subsidiaries, the principal activity is the delivery of mobile marketing, mobile entertainment and mobile money services | |
| | | | |
Tim we Angola | | Angola | | | 49.0 | % | | | — | | | | — | |
Total Tim Argentina, S.R.L. | | Argentina | | | 95.0 | % | | | 95.0 | % | | | 95.0 | % |
Tim We Argentina | | Argentina | | | 95.0 | % | | | 95.0 | % | | | 95.0 | % |
Mobile Int. LLC | | Azerbeijan | | | 99.0 | % | | | — | | | | — | |
Tim We Bolivia, S.R.L. | | Bolivia | | | 98.0 | % | | | 98.0 | % | | | 98.0 | % |
Total Spin Serviços de Telecomunicações, Lda. | | Brazil | | | 100.0 | % | | | 100.0 | % | | | 100.0 | % |
Bookmark Agência de Publicidade, Ltda. | | Brazil | | | 99.5 | % | | | — | | | | — | |
Brasiltec | | Brazil | | | 99.0 | % | | | 99.0 | % | | | — | |
Total Tim Chile Telec., Lda. | | Chile | | | 99.9 | % | | | 99.9 | % | | | 99.9 | % |
Tim We Asia | | China | | | 100.0 | % | | | 100.0 | % | | | — | |
Tim We WFOE | | China | | | 100.0 | % | | | 100.0 | % | | | — | |
Tim We Columbia. Lda | | Colombia | | | 99.9 | % | | | 99.9 | % | | | 99.9 | % |
Total Tim we, S.A. | | Costa Rica | | | 100.0 | % | | | 100.0 | % | | | 100.0 | % |
Tim We Republica Dominicana | | Dominican Republic | | | 99.9 | % | | | — | | | | — | |
Tim We FZ LLC | | Dubai | | | 100.0 | % | | | 100.0 | % | | | 100.0 | % |
Tim We Ecuador, S.A. | | Ecuador | | | 99.9 | % | | | 99.9 | % | | | 99.9 | % |
F-8
| | | | | | | | | | | | | | |
| | | Headquarters | | % ownership at December 31, | |
| | | 2010 | | | 2009 | | | 2008 | |
Tim We El Salvador | | El Salvador | | | 99.9 | % | | | 99.9 | % | | | 99.9 | % |
Tim We France | | France | | | 100.0 | % | | | 100.0 | % | | | 100.0 | % |
Total TIM Georgia | | Georgia | | | 100.0 | % | | | 100.0 | % | | | 100.0 | % |
TIMWE Hellas Limited Liability Company | | Greece | | | 99.5 | % | | | 99.5 | % | | | — | |
Tim We Guatemala | | Guatemala | | | 98.0 | % | | | 98.0 | % | | | 98.0 | % |
Tim We Honduras | | Honduras | | | 99.9 | % | | | 99.9 | % | | | 99.9 | % |
Tim We Iran | | Iran | | | 100.0 | % | | | — | | | | — | |
Tim We Irlanda | | Ireland | | | 100.0 | % | | | 100.0 | % | | | 100.0 | % |
TIM we Telecom | | Kazakhstan | | | 100.0 | % | | | 100.0 | % | | | — | |
TIM w.e. Kenya Ltd | | Kenya | | | 55.0 | % | | | — | | | | — | |
TIM w.e. Kyrgyzstan | | Kyrgyzstan | | | 100.0 | % | | | — | | | | — | |
Tim We Luxemburgo | | Luxembourg | | | 100.0 | % | | | 100.0 | % | | | 100.0 | % |
Tim w.e. Malasya | | Malasya | | | 100.0 | % | | | — | | | | — | |
Tim We Mexico | | Mexico | | | 92.5 | % | | | 92.5 | % | | | 85.0 | % |
Total TIM SRL | | Morocco | | | 100.0 | % | | | — | | | | — | |
Tim we Moçambique | | Mozambique | | | 90.0 | % | | | 90.0 | % | | | 90.0 | % |
Total Tim Moçambique | | Mozambique | | | 51.3 | % | | | 51.3 | % | | | 51.3 | % |
Tim We Nicaragua | | Nicaragua | | | 99.0 | % | | | 99.0 | % | | | 99.0 | % |
TIM w.e. Nigeria Ltd | | Nigeria | | | 55.0 | % | | | — | | | | — | |
Total Tim Panamá, S.A. | | Panama | | | 100.0 | % | | | 100.0 | % | | | 100.0 | % |
Total Tim Paraguay, S.A. | | Paraguay | | | 99.0 | % | | | 99.0 | % | | | 99.9 | % |
Total Tim We Peru, S.A.C. | | Peru | | | 99.9 | % | | | 99.9 | % | | | 99.9 | % |
Tim We Poland | | Poland | | | 100.0 | % | | | 100.0 | % | | | 100.0 | % |
Tekmob, Unipessoal Lda | | Portugal | | | 100.0 | % | | | 100.0 | % | | | 100.0 | % |
Tim We, S.A. | | Portugal | | | 100.0 | % | | | 100.0 | % | | | 100.0 | % |
Total Tim, Lda | | Portugal | | | 100.0 | % | | | 100.0 | % | | | 100.0 | % |
Tim We ID | | Portugal | | | 100.0 | % | | | 100.0 | % | | | — | |
Tim we Consult | | Portugal | | | 90.0 | % | | | 90.0 | % | | | 100.0 | % |
Total Spin SRL | | Romania | | | 100.0 | % | | | 100.0 | % | | | — | |
Tim We Russia | | Russia | | | 100.0 | % | | | — | | | | — | |
Tim We Arabia Saudita | | Saudi Arabia | | | 95.0 | % | | | 95.0 | % | | | — | |
Tim we servia | | Serbia | | | 100.0 | % | | | — | | | | — | |
Tim We SAF | | South Africa | | | 100.0 | % | | | 100.0 | % | | | 100.0 | % |
Servicios Tecnologicos Tim, S.L. | | Spain | | | 100.0 | % | | | 100.0 | % | | | 100.0 | % |
Tim we—Servicios de Telecomunicaciones Moviles SL | | Spain | | | 100.0 | % | | | — | | | | — | |
TIMWE Iletisim Hizmetleri Ticaret Limited Sirketi | | Turkey | | | 100.0 | % | | | 100.0 | % | | | 100.0 | % |
TIM we Telecom LTD | | Ukraine | | | 100.0 | % | | | 100.0 | % | | | 100.0 | % |
Tim We Uruguay, S.A. | | Uruguay | | | 100.0 | % | | | 100.0 | % | | | 100.0 | % |
Tim We LLC | | USA | | | 100.0 | % | | | 100.0 | % | | | 100.0 | % |
Total Tim Venezuela, C.A. | | Venezuela | | | 100.0 | % | | | 100.0 | % | | | 100.0 | % |
2. ACCOUNTING POLICIES
Statement of compliance
The accompanying Consolidated Financial Statements of Tim w.e., SGPS, S.A. and its subsidiaries have been prepared in accordance with International Financial Reporting Standards (“IFRS”) as issued by the International Accounting Standards Board (“IASB”). The designation “IFRS” includes all standards issued by and related interpretations issued by the IASB and related interpretations issued by the International Financial Reporting Interpretations Committee (“IFRIC”).
F-9
Basis of preparation
The consolidated financial statements present the financial position of Tim w.e. SGPS, S.A. and subsidiaries as of December 31, 2010 and 2009, and the related consolidated statements of income, comprehensive income, changes in equity, and cash flows for each of the years in the three year period ended December 31, 2010.
The financial statements were approved by the board of directors and authorized for issue on July 15, 2011.
The consolidated financial statements have been prepared under the historical cost convention. The preparation of consolidated financial statements in conformity with IFRS requires management to make judgments, estimates and assumptions that affect the application of accounting policies and the reported amounts of assets, liabilities, income and expenses. Changes in such assumptions or differences between these and the reality would impact on current estimates and judgments. Information about critical judgments in applying accounting policies that have a significant effect on the amounts recognized in the consolidated financial statements is included below.
Basis of consolidation
The consolidated financial statements include the accounts of the Group and its subsidiaries. All intercompany transactions, balances, income and expenses are eliminated on consolidation. All Group entities prepare their financial statements as at December 31.
All financial statements were prepared applying the same Group accounting and valuation principles.
Subsidiaries
Subsidiaries are entities controlled by Tim w.e., SGPS.
Control is assumed when Tim w.e., SGPS has the power to exercise a majority of voting rights. Control can also exist when Tim w.e., SGPS has the power, directly or indirectly, to manage the financial and operating policies of a particular company in order to obtain benefits from its activities, even though the equity shares and voting rights are below 50%. The financial statements of subsidiaries are included in the consolidated financial statements from the date that control commences until the date that control ceases.
Associates
Associates are entities in which the Group has significant influence, but not control, over the financial and operating policies. Significant influence is presumed to exist when the Group holds between 20 and 50 percent of the voting power of another entity. Additionally, the Group can exercise significant influence through participation in the management of the associate or in determining the composition of management bodies with executive powers.
We account for associates using the equity method of accounting. When the Group’s share of losses exceeds its interest in an equity-accounted investee, the carrying amount of that interest, including any long-term investments, is reduced to zero.
Additional losses and liabilities are recognized only to the extent that the Group has incurred legal or constructive obligations or made payments on behalf of an associate. The entire carrying amount of the investment is tested for impairment as a whole. When a Group entity enters into a transaction with an associate of the Group, profits and losses are eliminated to the extent of the Group’s interest in the associate.
Goodwill
Goodwill is the excess of cost of an acquired entity over the amounts assigned to assets acquired and liabilities assumed in a business combination. Goodwill resulting from acquisitions is recognized as an asset and recorded
F-10
at cost and is not subject to amortization. Goodwill is tested for impairment annually, and is tested for impairment between annual tests if an event occurs or circumstances change that would indicate the carrying amount may be impaired.
Transactions eliminated on consolidation
Intra-group balances and transactions, and any unrealized income and expenses arising from intra-group transactions, are eliminated in preparing the consolidated financial statements. Unrealized gains arising from transactions with equity-accounted investees are eliminated against the investment to the extent of the Group’s interest in the investee. Unrealized losses are eliminated in the same way as unrealized gains, but only to the extent that there is no evidence of impairment.
Uses of estimates and judgments
The preparation of financial statements in accordance with IFRS requires management to make estimates and assumptions that affect the amounts reported in the Group’s consolidated financial statements. Actual results could differ materially from those estimates. Management considers that the criteria set out are appropriate and that the financial statements present fairly the financial position of the Group and the result of its operations.
Foreign currency transactions
Assets and liabilities of foreign subsidiaries that operate in a functional currency other than the Euro are translated at the exchange rate on the date of the Statement of Financial Position. Revenue, cost of sales and expenses are remeasured at average exchange rates for each reporting period. Translation adjustments are recorded in other comprehensive income (loss).
Transactions in foreign currencies are translated to the respective functional currencies of Group entities at the exchange rates at the dates of each transaction. Non-monetary items in a foreign currency that are measured in terms of historical cost are translated using the exchange rate at the date of each transaction. Monetary assets and liabilities that are denominated in foreign currencies are remeasured at the period-end closing rate with resulting gains and losses reflected in Finance income or losses in the Consolidated Statements of Income.
The financial statements of foreign subsidiaries and associates are prepared in their functional currency, defined as the currency of the economy where each specific entity operates. On disposal or liquidation of investments in foreign subsidiaries, foreign currency translation adjustments previously recorded in other components of equity are recognized in profit (loss).
Revenue Recognition
The Group recognizes revenue when the amount of revenue can be measured reliably, service delivery has been performed, it is probable that the economic benefits will flow to the Group, costs incurred can be measured reliably and collectability is reasonably assured.
The Group generates revenues principally from the sale of a wide range of mobile applications and content to mobile end users. Our platform facilitates mobile marketing, including solutions to execute and monitor mobile marketing campaigns and mobile payment services. It also includes the sale and delivery of mobile entertainment applications and content (e.g., games, mobile music) to mobile handset users. Revenue is derived from data delivery to, and transactions executed by, mobile handset users, with revenues and cost of delivery recognized upon data transfer.
The Group utilizes mobile network operators’ channels to distribute content and to collect payment from our customers. In return, the mobile network operators are entitled to commissions, which are a percentage of the gross fees collected from the Group’s customers.
F-11
The Group evaluates our agreements with mobile carriers to determine whether to recognize our revenues on a gross or net basis. Pursuant to applicable accounting standards, our determination is based upon an assessment of whether we act as a principal or agent in providing our services. With respect to most of these arrangements we act as a principal in providing our services and therefore recognize revenues on a gross basis in our consolidated income statement and recognize the commissions retained by mobile carriers as a cost of revenues. With respect to the remainder of these arrangements we act as an agent and recognize our revenues on a net basis in our consolidated income statement.
Where we recognize revenues on a gross basis, we do so generally in reliance on the following factors:
| | • | | We are the primary obligor in the sale and are responsible for providing the product or service ordered by the mobile handset user (end-user); |
| | • | | We have latitude in establishing prices within ranges prescribed by the mobile operators; |
| | • | | We determine the nature, type, characteristics and specifications of the products and services we will be rendering; |
| | • | | We have the ability to control the selection of our content suppliers; and, |
| | • | | We assume credit risk of non-payment for all amounts billed to the end-user customers related to our services. |
Mobile marketing
We generate mobile marketing revenues from clients who use our platform to create, execute and measure mobile marketing campaigns. Usage-based fees are earned based on the number of SMS messages a campaign generates. We recognize revenues when individual SMS messages are tracked within our technology platform, which interfaces with, and receives instant verifications from, the mobile carriers.
Performance-based fees are variable fees that are tied to the consumer response that a particular campaign generates for a client and calculated based on contract-specific metrics—such as the number of coupons redeemed or leads in a given month—for the specific clients. We recognize revenues from performance-based campaigns based on response data for each month, as calculated by our platform traffic reports.
Mobile marketing revenues also include fees charged to clients for professional services relating to the implementation, execution and monitoring of customized mobile marketing and advertising campaigns. Such fees are typically paid over a fixed period corresponding to the duration of the campaign. We recognize these fees based on the percentage of completion of the campaign. In order to reliably measure the level of services performed for each contract, we compare services performed to date as a percentage of total services to be performed as well as the proportion that costs incurred to date compared to the estimated total costs of the campaign.
Mobile entertainment
We generate mobile entertainment revenues from end users who use our platform to access mobile entertainment services. Our mobile entertainment revenues include weekly and monthly usage-based fees charged to end users for access to content libraries and other services. Delivery of mobile entertainment services is recorded by data transfer reports generated by our IT platform, which interfaces with, and receives instant verifications from, the mobile network operators’ systems. The operators also send us monthly billing statement confirmations, which we use as a basis for invoicing and for the measurement of revenue. Since the Group does not receive collection statements from mobile operators until 30 to 60 days after our monthly cut-off date, we usually estimate revenues for the last month of the period, based on information as recorded on our IT platforms. These platforms record all transactions carried out with mobile operators and historically represent a reliable source of information to perform revenue estimates for our business.
F-12
By the time the Group reports our financial results, we receive substantially all the monthly collection statements from the mobile operators and have recognized revenues and sent invoices based on these monthly statements. In the event that a monthly statement is not received at a period-end, we will recognize revenue based on the data transfer reports generated by our IT platform. Fees that have been invoiced are recorded in trade receivables and fees that have not been invoiced as of the reporting date but on which all revenue recognition criteria are met are accrued and reported as unbilled trade receivables.
Given the nature of our business model, we have no deferred revenue, since revenue is earned and recognized immediately upon mobile data transfer.
Our mobile entertainment revenues also include fees for portal management, which are paid by mobile carriers for providing their mobile end users with carrier-specific access to entertainment content. These fees primarily include periodic fees charged for maintenance of a digital portal along with fees derived from revenue-sharing agreements. Revenue is measured by the total number of downloads from the portal, and the Company earns a fixed percentage of the total revenues generated by each portal.
Mobile money
We provide mobile billing solutions to consumer-facing micropayment providers, who provide mobile payment options to their customers through our billing connections with mobile carriers. We offer connectivity and bulk SMS packages, serving mainly as a technology intermediary between the micropayment provider, the mobile carrier and mobile end user. We earn a percentage of the transaction value that we charge for facilitating the mobile payment.
In some circumstances, we provide both the content and micropayment solution to the end user. We provide end users access to virtual online games and applications. These services are provided by our platform and the connections we have with different mobile carriers. Revenues and costs are recognized at the moment we receive a request by SMS text from the end user to purchase the product, at which time content and service are also delivered.
Finance income and finance costs
Finance income includes foreign currency gains and losses, dividends received, and interest income. The Group does not hold any material financial instruments.
Finance costs relate primarily to interest paid on loans.
Advertising costs
The Group expenses advertising costs as incurred or when the advertising is first run.
Cash and cash equivalents
Cash and cash equivalents include cash on hand and in banks with less than three months of maturity from the date of the statement of financial position and are not restricted as to use.
Inventories
Inventories of the Group primarily consist of telecommunications equipment. Inventories are measured at the lower of cost and net realizable value. The cost of inventories includes expenditure incurred in acquiring the inventories and other costs incurred in bringing them to their existing location and condition. Net realizable value is the estimated selling price in the ordinary course of business, less the estimated costs of completion and selling expenses. The cost of inventories is determined following the first-in first-out method.
F-13
Accounts receivable and allowance for doubtful accounts
Accounts receivable are presented at their face amount, less an allowance for doubtful accounts. Credit risk with respect to accounts receivable is generally diversified due to the large number of end-users comprising the Group’s customer base and their dispersion across many geographical regions.
Accounts receivable consist of amounts billed and also amounts due from customers but not yet billed. Revenues in excess of billings arise in the consolidated statement of financial positions when revenues have been recognized, but the amounts cannot be billed until the Group receives monthly data reports from certain mobile operators. Such amounts are recoverable from end-user customers, since they relate to services already delivered with no right of refund or return. We believe that we have established legal bases for pursuing recovery of these receivables, and it is management’s intention to pursue these receivables, if necessary. The mobile operators also provide us a billing confirmation to verify these receivables. The Group has established a history of collecting on our receivables, with no significant credit losses from its accounts receivable.
The Group generally has experienced longer accounts receivable collection cycles in specific markets. The Group also bills for a significant portion of its revenue through mobile phone operators. As a result, the Group maintains significant receivable balances with these parties. If the financial condition in specific markets or the operations of mobile operators deteriorate substantially, the Group’s operating results could be adversely affected. Management performs ongoing credit evaluations of the financial condition of mobile operators on an annual basis.
Management analyzes accounts receivable and considers the probability of collecting on accounts receivable and aging. To ensure a receivable balance is not overstated due to uncollectibility, the Group maintains an allowance for doubtful accounts based on a variety of factors, including the length of time receivables are past due, macroeconomic conditions, significant one-time events and historical experience. The past due or delinquency status of a receivable is based on the contractual payment terms of the receivable. The need to write off a receivable balance depends on the age, size and a determination of collectability of the receivable. The Group provides an allowance for doubtful trade receivables equal to the estimated uncollectible amounts. That estimate is based on historical collection experience, current economic and market conditions, and a review of the current status of each customer’s trade accounts receivable.
Property and equipment
Property and equipment comprise of office equipment, vehicles and computer hardware. Property and equipment are measured at cost less accumulated depreciation and accumulated impairment losses. Expenditure on maintenance and repair costs are recognized as expenses as incurred.
Depreciation of property and equipment is calculated using the straight-line method in accordance with the following periods of useful lives of asset classes:
| | | | |
| | | Depreciation period (in years) | |
Leasehold improvements | | | Shorter of the lease term or 10 years | |
Computer hardware | | | 3 | |
Vehicles | | | 4 | |
Office equipment | | | 7 – 10 | |
The useful lives of property and equipment are evaluated annually. An item of property and equipment is derecognized upon disposal or when no future economic benefits are expected to arise from the continued use of the asset. Any gain or loss arising on derecognition of the asset is included in profit or loss in the period in which the item is derecognized.
F-14
Intangible assets
Separately acquired intangible assets
Separately acquired intangible assets comprise mainly of software licenses. They also include intellectual property and contractual rights. The Group recognizes a separately acquired intangible asset based on the price paid to acquire the asset, including its purchase price and any directly attributable cost of preparing the asset for its intended use.
Software acquisition and development
The Group capitalizes internally generated intangible assets related to the development of our proprietary software platform and other internally-developed technology. Software includes assets acquired from third parties, as well as the cost of internally-developed software. Directly attributable costs include the costs of employee salaries specifically dedicated to projects that qualify for capitalization as an intangible asset.
An internally generated intangible asset arising from development, or from the development phase, of an internal project is recognized if all of the following have been demonstrated:
| | • | | the technical feasibility of completing the intangible asset so that it will be available for use or sale; |
| | • | | the intention to complete the intangible asset and use or sell it; |
| | • | | the ability to use or sell the intangible asset; |
| | • | | how the intangible asset will generate probable future economic benefits; |
| | • | | the availability of adequate technical, financial and other resources to complete the development and to use or sell the intangible asset; and |
| | • | | the ability to measure reliably the expenditure attributable to the intangible asset during its development. |
The amount initially recognized for an internally-generated intangible asset is the expenditure incurred from the date when the intangible asset first meets the recognition criteria listed above. Software is uniquely identified and controlled by the Group, and only when the future economic benefit is likely to occur are these assets recognized as intangible assets.
Expenditures on research and development projects that cannot be separately measured or do not qualify for capitalization are recognized as expenses in the period in which they are incurred. Research and development expenses primarily consist of personnel-related expenses.
Subsequent measurement of intangible assets
The Group subsequently measures intangible assets at cost less accumulated amortization and accumulated impairment losses (if any).
Management determines the amortization period and useful life of an intangible asset based the best estimate of variety of factors, primarily:
| | • | | the expected usage of the asset; |
| | • | | typical content and product life cycles and public information on estimates of useful lives of similar assets; |
| | • | | technical, technological and commercial or other types of obsolescence; |
| | • | | changes in the market demand for the products or services output from the asset; |
| | • | | the level of maintenance expenditure required to obtain the expected future economic benefits from the asset and the entity’s ability and intention to reach such a level; and |
| | • | | the period of contractual and legal limits on the use of the asset. |
F-15
Given our industry, our intangible assets are susceptible to technological obsolescence. Other intangible assets are also subject to commercial or contractual limitations. The useful life is the shorter of the periods determined by the above factors.
Our intangible assets are amortized over the following periods:
| | | | |
| | | Weighted-average
useful life (in years) | |
Acquired intangible assets (e.g., intellectual property and copyrights): | | | 3 | |
Developed technology | | | 3 - 4 | |
We hold no intangible assets with indefinite useful lives. Management reviews the amortization periods and the amortization methods for intangible assets at each fiscal year-end.
Impairment of long-lived assets including goodwill
The Group evaluates property and equipment and intangible assets for impairment whenever events or changes in circumstances indicate that a specific asset’s carrying amount exceeds its recoverable amount. Management considers events and changes in circumstances for specific assets such as major changes in technology, a significant decline in market value, obsolescence or physical damage of an asset and internal plans to change how an asset is used. For intangible assets not yet available for use, management also evaluates impairment at each year end by comparing each asset’s carrying amount with its recoverable amount.
An asset’s recoverable amount is determined by its fair value less normal selling expenses or its value in use, if this value exceeds the fair value. The value in use is the present value of the future cash flows expected to be derived from an asset. When an asset’s carrying amount exceeds its recoverable amount, the resulting impairment loss will be recognized in the income statement. After the recognition of an impairment loss, the depreciation charge for the asset is adjusted for the future periods by estimating the economic lifetime of the asset.
The Group performs impairment reviews at each fiscal year-end date for goodwill. The carrying value of goodwill is compared to the net present value of future cash flows, derived from the underlying assets using a projection period of four years for each cash-generating unit. Given the relatively small amounts of goodwill typically recognized by the Group, this four year future cash flow period is sufficient to cover any amount of goodwill within each cash-generating unit. Any impairment would be recognized as an expense in the current period and is not subsequently reversed.
Provisions
Provisions are recognized when:
| | • | | an entity has a present obligation (legal or constructive) as a result of a past event; |
| | • | | it is probable that an outflow of resources embodying economic benefits will be required to settle the obligation; and, |
| | • | | a reliable estimate can be made of the amount of the obligation. |
We regularly reevaluate provisions as additional information becomes available or circumstances change.
Leases
The Group classifies leases as finance leases or operating leases according to their substance and not its legal form. Leases in terms of which the Group assumes substantially all the risks and rewards of ownership are classified as finance leases. Other leases are operating leases and are not recognized in the Group’s statement of financial position.
F-16
Operating leases
Leases where a significant portion of the risks and rewards of ownership are retained by an external party are classified as operating leases. Operating lease rentals are charged to the income statement on a straight-line basis over the lease term. Any premium or discount on the acquisition of a lease is spread over the life of the lease on a straight-line basis. Contingent rentals arising under operating leases are recognized as an expense in the period in which they are incurred.
Finance leases
Leases are classified as finance leases when the terms of the lease transfer substantially all the risks and rewards of ownership to the lessee. Assets held under finance leases are recognized as assets of the Group at the inception of the lease at the lower of their fair value and the present value of the minimum lease payments.
Rents are composed of interest and amortization of the principal. The finance expense is allocated to each period during the lease term. Leasing payments are treated as consisting of capital and interest elements and the interest is charged to the income statement as it is incurred. Depreciation on leased assets is charged to the consolidated income statement on the same basis as owned assets.
Taxation
Corporate taxes are payable on taxable profits at current rates. Income tax expense represents the sum of the tax currently payable and deferred tax. The tax currently payable is based on taxable profit for the year. Taxable profit differs from profit as reported in the consolidated statements of comprehensive income because of items of income or expense that are taxable or deductible in other years and items that are never taxable or deductible. The Group’s liability for current tax is calculated using tax rates that have been enacted or substantively enacted by the end of the reporting period.
The Group accounts for income taxes using the asset and liability method. Under this method, the Group recognizes deferred tax assets and liabilities based on temporary differences between the carrying amounts of assets and liabilities in the consolidated financial statements and the corresponding tax bases used in the computation of taxable profit. Deferred tax liabilities are generally recognized for all taxable temporary differences. Deferred tax assets are generally recognized for all deductible temporary differences to the extent that it is probable that taxable profits will be available against which those deductible temporary differences can be utilized and the differences are expected to reverse in the foreseeable future. Deferred tax assets applicable to the Group include unused tax losses, tax credits and deductible temporary differences. Deferred tax assets are reviewed at each reporting date and are reduced to the extent that it is no longer probable that the related tax benefit will be realized.
Deferred tax assets and liabilities are not recognized if the temporary difference arises from goodwill or from the initial recognition (other than in a business combination) of other assets and liabilities in a transaction that affects neither taxable profit nor accounting profit. Deferred tax assets and liabilities are measured at the tax rates that are expected to apply in the period in which the liability is settled or the asset realized, based on tax rates (and tax laws) that have been enacted or substantively enacted by the end of the reporting period.
The Group is subject to corporate taxes in a number of different jurisdictions and applies management judgment in determining the appropriate provision for transactions where the ultimate tax determination is uncertain. The Group recognizes liabilities for anticipated taxes based on the best information available and where the anticipated liability is both probable and estimable. Where the final outcome of such matters differs from the amount recorded, any differences may impact the income tax and deferred tax provisions in the period in which the final determination is made.
F-17
In Portugal, tax authorities are allowed to review the corporate income tax (CIT) calculation of Tim w.e., SGPS and its subsidiaries, during a period of four to six years in the case of tax losses. Tax authorities may adjust the CIT charge if there are differences in tax legislation interpretation. However, it is the belief of management that there are no significant adjustments to income taxes in the financial statements.
Tax laws that apply to the Group’s subsidiaries may also be amended by the relevant tax authorities. Such potential amendments are regularly monitored and adjustments are made to the Group’s tax liabilities and deferred tax assets and liabilities where necessary.
Earnings per share
Basic earnings per share is computed by dividing the consolidated and individual profit or loss attributable to ordinary shareholders of Tim w.e., SGPS by the weighted average number of ordinary shares outstanding during the year. The Group has one class of shares, and each share entitles its holder to one vote at the shareholders’ meeting. There is no difference in the weighted average shares outstanding for calculating basic and diluted earnings per share since there are no potentially dilutive items relevant to the Group’s shares such as stock options, restricted stock units or convertible debt.
Treasury shares
If Tim w.e., SGPS, S.A. or its subsidiaries purchases treasury (“own”) shares, the consideration paid including any related incremental external costs, net of tax, is deducted from total shareholders’ equity as treasury shares until the shares are cancelled. If own shares are subsequently sold, any consideration received is included in shareholders’ equity.
Statement of Cash Flows
The Statement of Cash Flows is prepared under the direct method, under which receipts and cash payments are allocated to operating, investing and financing activities.
The Group classifies interest and dividends paid as financing activities and interest and dividends received as investing activities.
Operating Segments
IFRS guidance defines operating segments as components of the Group for which discrete financial information is available and is regularly reviewed by the chief operating decision maker (“CODM”) in deciding how to allocate resources and in assessing performance. The Group’s CODM is our chief executive officer. The Group operates and manages its business as a single segment.
We generate revenue by delivering monetizing solutions through our IT platform. While these solutions include mobile marketing, mobile entertainment and mobile money, all are based on the same IT platform. We deliver these solutions through the same service delivery channels to the same types of customers.
Our CODM takes a global, cross-product view of the business when reviewing financial information, allocating resources and assessing performance. We do not produce financial reports by service offering or by geographic region for management decision-making purposes. We allocate resources based on projects and major initiatives, with reviews by major customer. Revenue and capital expenditures are evaluated on a worldwide basis for planning purposes. Principal executive compensation and performance is not evaluated based on specific geographies or service offerings.
While we obtain financial statements from our subsidiaries in order to prepare the Group’s consolidated financial statements, we do not review them either individually or in the aggregate when making operating decisions. We therefore have determined that our international operations do not constitute separate operating segments individually or in aggregate.
F-18
3. FINANCIAL RISK MANAGEMENT
The Group’s activities expose it to a variety of financial risks, including the effects of changes in exchange rates and interest rates. The Group’s exposure to financial risks lies essentially in its debt portfolio, resulting in interest rate and currency risks.
Currency risk
Currency risk arises when an entity conducts transactions in a currency other than its functional currency. The Group’s functional and reporting currency is the Euro, while its subsidiaries utilize as their functional currency the local currency of each country.
Our reporting currency is the Euro, although the functional currencies of our subsidiaries include: the American Dollar, Argentinean Peso, Brazilian Real, Colombian Peso, Mexican Peso and others. Most of our local operating expenses are incurred in local currencies, and most of our revenues are also generated in local currencies.
As a result of investments in entities that have denominated currency other than the Euro, we face foreign exchange translation risk and our results can be affected by movements in the Brazilian Real versus the Euro, Argentinean Peso versus the Euro, as well as other currencies against the Euro. We have not hedged exposures denominated in foreign currencies and do not have any other derivative-related financial instruments. Additionally, the Group also incurs in the currency risk associated with loans made to subsidiaries that are made based on Euros or U.S. Dollars. Therefore, our operating results may become subject to significant fluctuations based upon changes in foreign currency exchange rates of certain currencies relative to the Euro, and foreign currency exchange rate fluctuations may adversely affect our financial results in the future.
In 2010, approximately 12% of our revenue was denominated in Euros. Accordingly, we expect Euros to continue to comprise a smaller percentage of our revenues by the end of 2011 as we continue to increase sales to customers in geographies outside of Europe, with revenue payable in Brazilian Reais and several other currencies, as well as increase the number of contracts with foreign customers with revenue payable in other currencies. Transactions in each country are made in their functional currency, including substantially all revenues and costs. Any decline in the value of these local currencies compared to the Euro will accordingly impact the subsidiaries’ revenues and costs as reported in Euros.
We currently do not plan to enter into any hedging arrangements, such as forward exchange contracts and foreign currency option contracts, to reduce the effect of our foreign exchange risk exposure. If we decided to enter into any such hedging activities in the future, we cannot assure you that we would be able to effectively manage our foreign exchange risk exposure. As exchange rates in these currencies vary, our revenue and operating results, when translated, may be materially and adversely impacted.
A 10% change in the exchange of the Euro against the following currencies, would create an increase / (decrease) in the income statement and/or in the equity of the Group as shown below. This analysis is based on the foreign currency exchange rate variances that the Group considered to be reasonably possible at the reporting date. This analysis assumes that all other variables, such as interest rates, remain constant and ignores any impact of forecasted sales and purchases. This analysis is shown on the same basis for 2009, albeit that the reasonably possible foreign exchange rate variances were different, as indicated below:
| | | | | | | | | | | | | | | | | | | | | | | | | | | | | | | | |
| | | December 31, 2010 | | | December 31, 2009 | |
| | | Earnings | | | Equity | | | Earnings | | | Equity | |
| | | +10% | | | -10% | | | +10% | | | -10% | | | +10% | | | -10% | | | +10% | | | -10% | |
Argentinean Peso | | | — | | | | — | | | | 122 | | | | (122 | ) | | | (33 | ) | | | 33 | | | | 108 | | | | (108 | ) |
Brazilian Real | | | 335 | | | | (335 | ) | | | 341 | | | | (341 | ) | | | 179 | | | | (179 | ) | | | 174 | | | | (174 | ) |
Colombian Peso | | | (4 | ) | | | 4 | | | | 197 | | | | (197 | ) | | | 31 | | | | (31 | ) | | | 162 | | | | (162 | ) |
Mexican Peso | | | (13 | ) | | | 13 | | | | (31 | ) | | | 31 | | | | (73 | ) | | | 73 | | | | (76 | ) | | | 76 | |
| | | | | | | | | | | | | | | | | | | | | | | | | | | | | | | | |
| | | 318 | | | | (318 | ) | | | 629 | | | | (629 | ) | | | 104 | | | | (104 | ) | | | 369 | | | | (369 | ) |
| | | | | | | | | | | | | | | | | | | | | | | | | | | | | | | | |
F-19
Liquidity risk
The Group monitors and attempts to maintain a level of cash and cash equivalents adequate to finance the Group’s operations and mitigate the effects of fluctuations in cash flows. We have financed our operations primarily through cash provided by operating activities. For specific projects and investments, we supplement this with borrowings under our revolving credit facilities. The Group manages liquidity risk by hiring and maintaining lines of credit and financing facilities with a commitment to underwriting, with domestic financial institutions, enabling immediate access to funds. These lines are used in addition to national commercial paper, which diversifies the sources of short-term financing of the Group.
Our principal sources of liquidity as of December 31, 2010 consisted of cash of €8.6 million (as of December 31 and 2009: €5.7 million), mainly through cash generated from operations. Our principal needs for liquidity have been for working capital requirements and capital expenditures. We have both short-term and long-term revolving credit maturities. We have been approached with opportunities to increase borrowing availability under our existing and new credit facilities, to explore additional debt options with different banking institutions.
We expect that working capital requirements and capital expenditures will continue to be our principal needs for liquidity over the near term. Working capital requirements are expected to increase as a result of our growth, both organically and through potential acquisitions. The main portion of our capital expenditures has been, and is expected to continue to be, for product development. We believe that our cash flow from operations, available cash and cash equivalents (including the net proceeds from this offering) and available borrowings under our revolving credit facility will be sufficient to meet our liquidity needs for at least the next 12 months. Although we have no specific current plans to do so, if we decide to pursue one or more significant strategic acquisitions, we would likely need to incur additional debt or sell additional equity to finance such transactions.
The credit markets have experienced extreme volatility and disruption that reached unprecedented levels during late 2008 and through 2010. In Portugal, the credit and equity markets remain volatile, and capital availability remains relatively limited. If we require additional debt or equity financing, we may not be able to obtain it on terms we consider favorable to us or at all. In addition, our liquidity and our ability to meet our obligations and fund our capital requirements depends upon the future financial performance of our business, which is subject to general economic, financial and other factors that are beyond our control.
While we believe that we have sufficiently managed the need for debt financing (including bank borrowings) during this challenging time, general economic conditions and the prospects for renewed economic growth throughout the world remain uncertain. Accordingly, we cannot assure you that our business will generate sufficient cash flow from operations, that future borrowings will be available under our credit facilities or otherwise, or that additional sources of liquidity will be available in amounts sufficient to meet our future liquidity needs.
| | | | | | | | | | | | | | | | | | | | |
In Euros (‘000) | |
| | | December 31, 2010 | |
| | | Total | | | Until
6 months | | | 6 months to
1 year | | | 1 to 5 years | | | More than
5 years | |
LIABILITIES | | | | | | | | | | | | | | | | | | | | |
Accounts payable | | | 19,118 | | | | 11,842 | | | | 7,276 | | | | — | | | | — | |
Liabilities related to factoring operations | | | 1,181 | | | | 1,181 | | | | — | | | | — | | | | — | |
Current portion of long term debt | | | 2,521 | | | | 1,321 | | | | 1,200 | | | | — | | | | — | |
Current finance lease obligations | | | 1,038 | | | | 416 | | | | 622 | | | | — | | | | — | |
Tax liabilities | | | 535 | | | | 535 | | | | — | | | | — | | | | — | |
Current taxes payable | | | 887 | | | | 887 | | | | — | | | | — | | | | — | |
Long-term debt | | | 7,314 | | | | — | | | | — | | | | 7,314 | | | | — | |
Non-current finance lease obligations | | | 1,036 | | | | — | | | | — | | | | 1,036 | | | | — | |
| | | | | | | | | | | | | | | | | | | | |
| | | 33,630 | | | | 16,182 | | | | 9,098 | | | | 8,350 | | | | — | |
| | | | | | | | | | | | | | | | | | | | |
F-20
| | | | | | | | | | | | | | | | | | | | |
In Euros (‘000) | |
| | | December 31, 2009 | |
| | | Total | | | Until
6 months | | | 6 months to
1 year | | | 1 to 5 years | | | More than
5 years | |
LIABILITIES | | | | | | | | | | | | | | | | | | | | |
Accounts payable | | | 16,461 | | | | 7,199 | | | | 9,262 | | | | — | | | | — | |
Liabilities related to factoring operations | | | 77 | | | | 77 | | | | — | | | | — | | | | — | |
Current portion of long term debt | | | 2,061 | | | | — | | | | 2,061 | | | | — | | | | — | |
Current finance lease obligations | | | 894 | | | | 223 | | | | 671 | | | | — | | | | — | |
Tax liabilities | | | 1,751 | | | | 1,751 | | | | — | | | | — | | | | — | |
Current taxes payable | | | 1,495 | | | | — | | | | 1,495 | | | | — | | | | — | |
Long-term debt | | | 8,143 | | | | — | | | | — | | | | 8,143 | | | | — | |
Non-current finance lease obligations | | | 1,219 | | | | — | | | | — | | | | 1,219 | | | | — | |
| | | | | | | | | | | | | | | | | | | | |
| | | 32,101 | | | | 9,250 | | | | 13,489 | | | | 9,362 | | | | — | |
| | | | | | | | | | | | | | | | | | | | |
Interest rate risk
The Group does not account for any fixed rate financial assets and liabilities at fair value through profit or loss, and the Group has not entered into any hedging activities—either to manage interest rate risk or for speculative purposes.
We are exposed to interest rate risk related to subject to market risks due to fluctuations in interest rates on our debt. Such instruments carry a degree of interest rate risk. Increases in interest rates will increase the cost of borrowing and our interest expense. We have not been exposed to material risks due to changes in interest rates. We have not used any derivative financial instruments to manage our interest risk exposure.
Our financial obligations are primarily denominated in Euros, and interest expense is generally calculated based on floating interest rates that are linked to Euribor. Based on our outstanding financial obligations as of December 30, 2010, a potential movement in Euribor by +/- 1% would result in an immaterial incremental interest charge and impact to our net income. Our accounts receivable and payable are non-interest bearing. Management monitors whether the Group has a level of cash and cash equivalents cover our outstanding debt, and interest rate risk is mitigated by the fact that we can repay outstanding loans with cash on-hand if needed.
Inflation Risk
Inflation may affect the Group by increasing costs of labor, supplies and equipment. We do not believe that inflation has had any material effect on our business, financial condition or results of operations in the last three fiscal years. Although we do not expect that inflation or changing prices will materially affect our business in the foreseeable future, if our costs were to become subject to significant inflationary pressures, we might not be able to offset these higher costs fully through price increases. Our inability or failure to do so could harm our business, operating results and financial condition.
F-21
4. EXCHANGE RATES USED TO TRANSLATE FOREIGN CURRENCY FINANCIAL STATEMENTS
On December 31, 2010, 2009 and 2008, assets and liabilities in foreign currencies were translated into Euros based on exchange rates at the reporting date. The income statements of subsidiaries denominated in foreign currencies are translated into Euros based on average exchange rates of the currencies against the Euro.
| | | | | | | | | | | | | | | | | | | | | | | | |
In Euros | |
| | | December 31, 2010 | | | December 31, 2009 | | | December 31, 2008 | |
Currency | | Closing
currency | | | Average
currency | | | Closing
currency | | | Average
currency | | | Closing
currency | | | Average
currency | |
American Dollars (USA) | | | 1.336 | | | | 1.326 | | | | 1.433 | | | | 1.466 | | | | 1.410 | | | | 1.410 | |
Argentinean Pesos (Argentina) | | | 5.263 | | | | 5.265 | | | | 5.507 | | | | 5.538 | | | | 4.874 | | | | 4.856 | |
Real (Brazil) | | | 2.208 | | | | 2.250 | | | | 2.508 | | | | 2.551 | | | | 3.321 | | | | 3.301 | |
Colombian Pesos (Colombia) | | | 2,584.647 | | | | 2,500.000 | | | | 2,908.050 | | | | 2,941.176 | | | | 3,174.330 | | | | 3,108.240 | |
Mexican Peso (Mexico) | | | 16.385 | | | | 16.401 | | | | 18.692 | | | | 18.720 | | | | 19.231 | | | | 19.231 | |
5. REVENUES AND GEOGRAPHIC DATA
Revenue is detailed as follows:
| | | | | | | | | | | | |
In Euros (‘000) | |
| | | December 31, | |
Revenues | | 2010 | | | 2009 | | | 2008 | |
Sales of tangible goods | | | 957 | | | | 2,243 | | | | 330 | |
Services rendered | | | 232,894 | | | | 163,998 | | | | 125,009 | |
| | | | | | | | | | | | |
| | | 233,851 | | | | 166,241 | | | | 125,339 | |
| | | | | | | | | | | | |
During the years ended December 31, 2010, 2009 and 2008, the Group operated and managed its business as a single segment. We primarily derive revenue from customers that are located in a single location, attributed based on the geographic location of the mobile operator. The following table provides revenue by geographic area:
| | | | | | | | | | | | |
In Euros (‘000) | |
| | | December 31, | |
Revenues | | 2010 | | | 2009 | | | 2008 | |
| | | Revenues | | | Revenues | | | Revenues | |
Portugal | | | 5,997 | | | | 5,207 | | | | 5,289 | |
Brazil | | | 103,173 | | | | 66,860 | | | | 44,496 | |
All other international | | | 124,681 | | | | 94,174 | | | | 75,554 | |
| | | | | | | | | | | | |
| | | 233,851 | | | | 166,241 | | | | 125,339 | |
| | | | | | | | | | | | |
During the fiscal year ended December 31, 2010, the Group generated €55.2 million of our revenues from the billing system of one mobile carrier (fiscal year ended December 31, 2009: €45.8 million, fiscal year ended December 31, 2008: €27.3 million). There was no single external customer directly responsible for greater than 10 percent of the Group’s revenues in any of the years presented.
F-22
The group’s long-lived assets consist primarily of property and equipment, intangible assets and goodwill. They are attributed to the geographic location in which they are located. Long-lived assets by geographic area as of December 31, 2010 and 2009 are as follows:
| | | | | | | | |
In Euros (‘000) | |
| | | December 31, | |
Long-lived Assets | | 2010 | | | 2009 | |
Portugal | | | 9,036 | | | | 8,465 | |
Brazil | | | 1,731 | | | | 861 | |
All Other | | | 1,325 | | | | 976 | |
| | | | | | | | |
| | | 12,092 | | | | 10,302 | |
| | | | | | | | |
6. COST OF SERVICE DELIVERY
Cost of service delivery is detailed as follows:
| | | | | | | | | | | | |
In Euros (‘000) | |
| | | December 31, | |
Cost of service delivery | | 2010 | | | 2009 | | | 2008 | |
Cost of sales | | | 645 | | | | 1,432 | | | | 278 | |
Cost of services | | | 116,673 | | | | 95,624 | | | | 64,781 | |
| | | | | | | | | | | | |
| | | 117,318 | | | | 97,056 | | | | 65,059 | |
| | | | | | | | | | | | |
Costs of service delivery comprise the amount of revenue share paid to operators for their services in facilitating our sales, access to their customer base, delivery via their mobile networks and billing to end-user mobile handset customers. This also includes distribution costs to brokers in markets where there are no direct agreements with operators.
7. COMMERCIAL AND PRODUCTION COSTS
Commercial and production costs are detailed as follows:
| | | | | | | | | | | | |
In Euros (‘000) | |
| | | December 31, | |
Commercial and production costs | | 2010 | | | 2009 | | | 2008 | |
Commercial costs | | | 57,061 | | | | 28,091 | | | | 31,825 | |
Production costs | | | 18,964 | | | | 9,039 | | | | 3,467 | |
| | | | | | | | | | | | |
| | | 76,025 | | | | 37,130 | | | | 35,292 | |
| | | | | | | | | | | | |
Commercial and production costs are paid to third party vendors primarily to execute media campaigns, to facilitate our sales and to create content. Commercial costs relate to direct media costs for the placement of our advertising on TV, Internet and other media. We also pay for third-party vendors to develop and execute our marketing and advertising campaigns. The costs of advertising are fully expensed the first time the advertising takes place. Advertising costs amounted to €27.7 million, €18.5 million and €17.8 million for the years ended December 31, 2010, 2009 and 2008, respectively. Commercial costs also include vendor fees for creative development and third party service fees in conjunction with our mobile money services.
The Group incurs production costs for our sales and marketing campaigns, which include participation incentives for mobile end-users.
F-23
8. PERSONNEL COSTS
The Group had 335 employees, as of December 31, 2010 (274 in 2009 and 245 in 2008). Our employees are based primarily in Portugal and allocated as follows:
| | | | |
| | | Number of employees | |
Directors | | | 5 | |
Personnel | | | 330 | |
| | | | |
| | | 335 | |
| | | | |
Personnel costs were comprised of:
| | | | | | | | | | | | |
In Euros (‘000) | |
| | | December 31, | |
Personnel Costs | | 2010 | | | 2009 | | | 2008 | |
Directors wages | | | 872 | | | | 1,027 | | | | 975 | |
Personnel wages | | | 8,689 | | | | 7,955 | | | | 5,484 | |
Remuneration charges | | | 2,487 | | | | 2,117 | | | | 1,182 | |
Other expenses | | | 388 | | | | 496 | | | | 521 | |
| | | | | | | | | | | | |
| | | 12,436 | | | | 11,595 | | | | 8,162 | |
| | | | | | | | | | | | |
Capitalized development costs—wages | | | (2,851 | ) | | | (2,837 | ) | | | (1,643 | ) |
| | | | | | | | | | | | |
| | | 9,585 | | | | 8,758 | | | | 6,519 | |
| | | | | | | | | | | | |
Personnel costs are composed primarily of salaries and bonuses. The Group has not instituted any pension plans or share-based payments in any of the years presented. Capitalized development costs—wages are directly attributable salaries and bonuses for employees specifically dedicated to development projects that qualify for capitalization as an intangible asset. The Group capitalizes these qualifying development costs for our software platform and other internally-developed technology.
Refer to Note 18 for additional details.
9. GENERAL AND ADMINISTRATIVE
General and administrative expenses are detailed as follows:
| | | | | | | | | | | | |
In Euros (‘000) | |
| | | December 31, | |
General and Administrative | | 2010 | | | 2009 | | | 2008 | |
Travel | | | 2,290 | | | | 2,415 | | | | 1,366 | |
Fees | | | 2,244 | | | | 1,856 | | | | 2,153 | |
Rent | | | 717 | | | | 961 | | | | 640 | |
Office Expenses | | | 1,082 | | | | 985 | | | | 1,264 | |
Communications | | | 520 | | | | 399 | | | | 454 | |
IT Expenses | | | 673 | | | | 364 | | | | 285 | |
| | | | | | | | | | | | |
| | | 7,526 | | | | 6,980 | | | | 6,162 | |
| | | | | | | | | | | | |
10. TAX EXPENSES
Tax expenses for the fiscal year ended December 31, 2010 were €3.3 million (fiscal year ended December 31, 2009: €2.3 million, 2008: €2.2 million). These expenses are federal taxes and social contributions levied on company operating margin by Latin American countries where we have significant sales operations.
F-24
11. FINANCE INCOME AND FINANCE COST
Finance income comprised of the following:
| | | | | | | | | | | | |
In Euros (‘000) | |
| | | December 31, | |
Finance income | | 2010 | | | 2009 | | | 2008 | |
Interest income—third parties | | | 85 | | | | 11 | | | | 9 | |
Foreign currency translation differences | | | 1,540 | | | | 77 | | | | 539 | |
Other finance income | | | 25 | | | | 51 | | | | 22 | |
| | | | | | | | | | | | |
| | | 1,650 | | | | 139 | | | | 570 | |
| | | | | | | | | | | | |
Finance costs comprised of the following:
| | | | | | | | | | | | |
In Euros (‘000) | |
| | | December 31, | |
Finance costs | | 2010 | | | 2009 | | | 2008 | |
Interest expense | | | (861 | ) | | | (770 | ) | | | (1,041 | ) |
Foreign currency translation differences | | | (776 | ) | | | (180 | ) | | | (217 | ) |
Other finance costs | | | (939 | ) | | | (1,465 | ) | | | (242 | ) |
| | | | | | | | | | | | |
| | | (2,576 | ) | | | (2,415 | ) | | | (1,500 | ) |
| | | | | | | | | | | | |
Foreign currency translation differences are primarily gains or losses on invoices sent in a functional currency that differs from the Euro.
12. CASH AND CASH EQUIVALENTS
Cash and cash equivalents of the Group are mainly denominated in Euros and U.S. dollars. Cash and cash equivalents comprise of the following:
| | | | | | | | |
In Euros (‘000) | |
| | | December 31, | |
Cash and cash equivalents | | 2010 | | | 2009 | |
Petty cash | | | | | | | | |
Cash | | | 81 | | | | 17 | |
| | | | | | | | |
Bank deposits | | | | | | | | |
Current deposits | | | 7,446 | | | | 5,316 | |
Short-term deposits | | | 1,083 | | | | 334 | |
| | | | | | | | |
| | | 8,529 | | | | 5,650 | |
| | | | | | | | |
| | | 8,610 | | | | 5,667 | |
| | | | | | | | |
13. TRADE RECEIVABLES
Trade receivables comprise of the following:
| | | | | | | | |
In Euros (‘000) | |
| | | December 31, | |
Trade receivables | | 2010 | | | 2009 | |
Trade debtors | | | 11,499 | | | | 6,391 | |
Unbilled Revenue | | | 14,056 | | | | 12,464 | |
Allowance for doubtful accounts | | | (124 | ) | | | (117 | ) |
| | | | | | | | |
| | | 25,431 | | | | 18,738 | |
| | | | | | | | |
F-25
Unbilled receivables are a result of the timing of the Group’s invoices. The Group invoices based on end-user download, subscription and usage reports received from mobile operators. The Group receives these reports up to two months after the subscription and content delivery. The Group records revenue when earned, but bills with a time lag, which results in unbilled receivables.
Management has no history of significant write-offs of trade receivables. The Group records an allowance for doubtful accounts mainly for invoices issued to local country brokers who facilitate the Group’s sales in countries where we do not have operations.
Changes in the allowance for doubtful accounts during the fiscal years ended December 31, 2010 and 2009 were as follows:
| | | | | | | | |
In Euros (‘000) | |
| | | December 31, | |
| | | 2010 | | | 2009 | |
Beginning balance | | | 117 | | | | — | |
Additions | | | — | | | | 121 | |
Foreign exchange differences | | | 7 | | | | (4 | ) |
| | | | | | | | |
Final balance | | | 124 | | | | 117 | |
| | | | | | | | |
14. PREPAID EXPENSES AND OTHER ASSETS
This caption relates to advanced payments to suppliers, other prepaid expenses and other receivables.
| | | | | | | | |
In Euros (‘000) | |
| | | December 31, | |
Prepaid expenses and other assets | | 2010 | | | 2009 | |
Advanced payments to suppliers | | | 1,758 | | | | 1,060 | |
Deferred costs | | | 904 | | | | 935 | |
Other debtors | | | 576 | | | | 2,074 | |
| | | | | | | | |
| | | 3,238 | | | | 4,069 | |
| | | | | | | | |
Advanced payments to suppliers include cash advances for contents, advisory fees and other planned services from third parties. Deferred costs include costs for media programming for which content creation services have not yet been provided.
15. TAXATION
Income tax expense in the statement of comprehensive income includes:
| | | | | | | | | | | | |
In Euros (‘000) | |
| | | December 31, | |
| | | 2010 | | | 2009 | | | 2008 | |
Current tax | | | 3,127 | | | | 4,074 | | | | 1,953 | |
Current period | | | 3,117 | | | | 4,051 | | | | 2,128 | |
Adjustment for prior period | | | 10 | | | | 23 | | | | (175 | ) |
Deferred tax | | | 262 | | | | (2,398 | ) | | | 166 | |
Origination and reversal of temporary differences | | | 262 | | | | (2,398 | ) | | | 166 | |
| | | | | | | | | | | | |
Total | | | 3,389 | | | | 1,676 | | | | 2,119 | |
| | | | | | | | | | | | |
F-26
Profit before income taxes was generated in the following jurisdictions:
| | | | | | | | | | | | |
In Euros (‘000) | |
| | | Year ended December 31, | |
Profit before income taxes | | 2010 | | | 2009 | | | 2008 | |
Portugal operations | | | 3,788 | | | | 3,562 | | | | 1,417 | |
International operations | | | 10,606 | | | | 5,278 | | | | 6,089 | |
| | | | | | | | | | | | |
Total | | | 14,394 | | | | 8,840 | | | | 7,506 | |
| | | | | | | | | | | | |
Group companies based in Portugal are subject to corporate tax at the standard rate of 25%, which can be increased by a maximum rate of 10% for municipal surcharge, resulting in an aggregate tax rate of 26.5%.
Under current legislation, tax returns are subject to audit, revision and correction by the tax authorities during subsequent years. In Portugal and Spain, that period is four years. In Brazil, Turkey and Argentina, the period is five years. Tax losses are also subject to inspection and adjustment and can be deducted from taxable income in subsequent years (six years in Portugal, fifteen years in Spain, five years in Argentina and Turkey and no limit in Brazil, but with limits 30% of taxable income for the year).
In certain jurisdictions, the Group is required to prepay corporate income taxes and subsequently reverses any prepaid amounts upon the actual filing.
The current corporate income tax is detailed as follows:
| | | | | | | | | | | | | | | | |
In Euros (‘000) | |
| | | Assets | | | Liabilities | |
| | | December 31, | | | December 31, | |
Current income tax | | 2010 | | | 2009 | | | 2010 | | | 2009 | |
Corporate income tax | | | 3,280 | | | | (535 | ) | | | 1,867 | | | | (1,751 | ) |
| | | | | | | | | | | | | | | | |
The reconciliation of the income tax expense using the statutory Portuguese income tax rate compared to the Group’s effective tax rate for the years ended December 31, 2010, 2009 and 2008 is as follows:
| | | | | | | | | | | | | | | | | | | | | | | | | | | | | | | | | | | | |
In Euros (‘000) | |
| | | December 31, | |
| | | 2010 | | | 2009 | | | 2008 | |
Earnings before taxes and
non-controlling interests | | % Rate | | | Tax
base | | | Tax | | | % Rate | | | Tax
base | | | Tax | | | % Rate | | | Tax
base | | | Tax | |
Statutory income tax rate | | | 27 | % | | | 14,394 | | | | 3,815 | | | | 27 | % | | | 8,840 | | | | 2,343 | | | | 27 | % | | | 7,506 | | | | 1,989 | |
Differences in subsidiaries’ tax rate | | | -3 | % | | | (1,437 | ) | | | (381 | ) | | | -3 | % | | | (1,043 | ) | | | (277 | ) | | | -1 | % | | | (225 | ) | | | (59 | ) |
Tax benefits | | | -9 | % | | | (4,820 | ) | | | (1,277 | ) | | | -17 | % | | | (5,754 | ) | | | (1,525 | ) | | | 0 | % | | | — | | | | — | |
Non taxable capital gains | | | 0 | % | | | — | | | | — | | | | 0 | % | | | (6 | ) | | | (2 | ) | | | 0 | % | | | — | | | | — | |
Tax losses used, which had not been recognized deferred tax asset | | | -1 | % | | | (314 | ) | | | (83 | ) | | | -1 | % | | | (381 | ) | | | (101 | ) | | | -2 | % | | | (703 | ) | | | (186 | ) |
Deferred tax assets not recognized on tax losses generated in the period | | | 5 | % | | | 2,820 | | | | 747 | | | | 11 | % | | | 3,611 | | | | 957 | | | | 1 | % | | | 356 | | | | 95 | |
Non-deductible costs | | | 4 | % | | | 2,033 | | | | 539 | | | | 1 | % | | | 444 | | | | 118 | | | | 5 | % | | | 1,510 | | | | 400 | |
Other | | | 0 | % | | | 109 | | | | 29 | | | | 2 | % | | | 614 | | | | 163 | | | | -2 | % | | | (448 | ) | | | (120 | ) |
| | | | | | | | | | | | | | | | | | | | | | | | | | | | | | | | | | | | |
Effective tax rate | | | 24 | % | | | 12,785 | | | | 3,389 | | | | 19 | % | | | 6,325 | | | | 1,676 | | | | 28 | % | | | 7,996 | | | | 2,119 | |
| | | | | | | | | | | | | | | | | | | | | | | | | | | | | | | | | | | | |
F-27
The Group accounted for the tax effects arising from temporary differences between tax basis and accounting basis of assets and liabilities, which are comprised of the following:
| | | | | | | | | | | | | | | | | | | | | | | | |
In Euros (‘000) | |
| | | Deferred tax assets | | | Deferred tax liabilities | | | Deferred tax net | |
| | | December 31, | | | December 31, | | | December 31, | |
Deferred tax | | 2010 | | | 2009 | | | 2010 | | | 2009 | | | 2010 | | | 2009 | |
Tax credits | | | 1,244 | | | | 1,744 | | | | — | | | | — | | | | 1,244 | | | | 1,744 | |
Tax losses | | | 609 | | | | 608 | | | | — | | | | — | | | | 609 | | | | 608 | |
Provisions | | | 266 | | | | — | | | | — | | | | — | | | | 266 | | | | (28 | ) |
Other differences | | | — | | | | — | | | | (269 | ) | | | (158 | ) | | | (269 | ) | | | (186 | ) |
| | | | | | | | | | | | | | | | | | | | | | | | |
Deferred tax asset/liability | | | 2,119 | | | | 2,352 | | | | (269 | ) | | | 214 | | | | 1,850 | | | | 2,138 | |
| | | | | | | | | | | | | | | | | | | | | | | | |
Deferred tax assets are considered recoverable when compared to projections of cash flows that are based on reasonable and supportable assumptions and represent management’s best estimate of economic conditions that will exist within the projection results. The Group does not have any valuation allowances for its deferred tax assets. Management considers the scheduled reversal of deferred tax liabilities (including the impact of available carryback and carryforward periods), projected future taxable income, and tax planning strategies in making this assessment. These recent financial forecasts are approved by management. Based upon the level of historical taxable income and projections for future taxable income over the periods in which the deferred tax assets are deductible, management believes it is more likely than not that the Company will realize the benefits of these deductible differences. The amount of the deferred tax asset considered realizable, however, could be reduced in the near term if estimates of future taxable income during the carryforward period are reduced.
The following table reflects the movements in deferred tax assets (liabilities) for 2010 and 2009:
| | | | | | | | | | | | | | | | |
In Euros (‘000) | |
| | | Deferred tax assets | | | Deferred tax liabilities | |
| | | December 31, | | | December 31, | |
Deferred tax | | 2010 | | | 2009 | | | 2010 | | | 2009 | |
Initial balance as at January 1st | | | 2,352 | | | | 383 | | | | (214 | ) | | | (500 | ) |
Tax credits | | | (500 | ) | | | 1,969 | | | | — | | | | 286 | |
Provisions | | | 267 | | | | — | | | | — | | | | — | |
Other differences | | | — | | | | — | | | | (55 | ) | | | — | |
| | | | | | | | | | | | | | | | |
| | | 2,119 | | | | 2,352 | | | | (269 | ) | | | (214 | ) |
| | | | | | | | | | | | | | | | |
Additionally, the Group does not recognize deferred tax assets for certain tax losses, as it is not expected that they will be recovered in the near future. The Company considers these earnings to be indefinitely reinvested.
A detail of tax losses for which no deferred tax asset was recognized is presented as follows:
| | | | | | | | |
In Euros (‘000) | |
Expiration | | 2010 | | | 2009 | |
2011 | | | — | | | | — | |
2012 | | | — | | | | — | |
2013 | | | — | | | | — | |
2014 | | | 1,131 | | | | 1,445 | |
>2015 | | | 4,988 | | | | 2,168 | |
| | | | | | | | |
| | | 6,119 | | | | 3,613 | |
| | | | | | | | |
F-28
A reconciliation of the beginning and ending amount of unrecognized tax benefits for 2010 and 2009 is as follows:
| | | | | | | | |
In Euros (‘000) | |
| | | December 31, | |
Unrecognized tax benefit | | 2010 | | | 2009 | |
Unrecognized tax benefit—beginning of year | | | 3,613 | | | | 383 | |
Gross decreases—tax positions in prior period | | | (314 | ) | | | (381 | ) |
Gross increases—tax positions in current period | | | 2,820 | | | | 3,611 | |
| | | | | | | | |
Unrecognized tax benefit—end of year | | | 6,119 | | | | 3,613 | |
| | | | | | | | |
16. OTHER TAX ASSETS AND LIABILITIES
The Group also records in the statement of financial position value added tax and other taxes as a result of timing differences for tax payments.
Other tax assets
| | | | | | | | |
In Euros (‘000) | |
| | | December 31, | |
Prepaid and other indirect taxes | | 2010 | | | 2009 | |
Value added tax and other local taxes | | | 3,228 | | | | 1,738 | |
Withholding retention tax | | | 1,225 | | | | 1,432 | |
Others | | | 194 | | | | 205 | |
| | | | | | | | |
| | | 4,647 | | | | 3,375 | |
| | | | | | | | |
Value added taxes and other local taxes are amounts that the Group is entitled to recover as a result of tax payment for services received from third party vendors that exceed tax payments for services delivered to the Group’s customers. These amounts will vary depending on the flow of services delivered and received within specific countries. Other taxes are comprised of withholdings on intercompany sales that may be utilized for future tax payments.
Other tax liabilities
| | | | | | | | |
In Euros (‘000) | |
| | | December 31, | |
Other tax liabilities | | 2010 | | | 2009 | |
Value added tax | | | 175 | | | | 778 | |
Other taxes | | | 712 | | | | 717 | |
| | | | | | | | |
| | | 887 | | | | 1,495 | |
| | | | | | | | |
The Group accrues for amounts paid for corporate income taxes based on expected profits in specific tax jurisdictions. Value added taxes and other local taxes are amounts that the Group must pay as a result of required tax payments for services delivered to the Group’s customers that exceed tax payment for services received from third party vendors. Other taxes are primarily social security tax payments the Group collects from employees and must remit to the relevant tax authorities.
F-29
17. PROPERTY AND EQUIPMENT
Changes in property and equipment for the years ended December 31, 2010 and 2009 were as follows:
| | | | | | | | | | | | | | | | | | | | | | | | | | | | |
In Euros (‘000) | |
| | | Leasehold
improvements | | | Computer
hardware | | | Vehicles | | | Office
equipment | | | Other | | | Work in
progress | | | Total | |
Acquisition cost | | | | | | | | | | | | | | | | | | | | | | | | | | | | |
Balance as of December 31, 2008 | | | 248 | | | | 364 | | | | 838 | | | | 1,850 | | | | 224 | | | | 394 | | | | 3,918 | |
| | | | | | | | | | | | | | | | | | | | | | | | | | | | |
Additions | | | — | | | | — | | | | 129 | | | | 1,206 | | | | 101 | | | | — | | | | 1,436 | |
Disposals | | | — | | | | (52 | ) | | | (149 | ) | | | (8 | ) | | | (7 | ) | | | — | | | | (216 | ) |
Reclassifications | | | (82 | ) | | | (226 | ) | | | (1 | ) | | | 788 | | | | (85 | ) | | | (394 | ) | | | — | |
| | | | | | | | | | | | | | | | | | | | | | | | | | | | |
Balance as of December 31, 2009 | | | 166 | | | | 86 | | | | 817 | | | | 3,836 | | | | 233 | | | | — | | | | 5,138 | |
| | | | | | | | | | | | | | | | | | | | | | | | | | | | |
Additions | | | — | | | | 1 | | | | 154 | | | | 1,387 | | | | 126 | | | | — | | | | 1,668 | |
Disposals | | | — | | | | (50 | ) | | | (48 | ) | | | (270 | ) | | | (1 | ) | | | — | | | | (369 | ) |
Reclassifications | | | — | | | | — | | | | (3 | ) | | | 84 | | | | (171 | ) | | | — | | | | (90 | ) |
Currency variations | | | — | | | | — | | | | — | | | | 11 | | | | 9 | | | | — | | | | 20 | |
| | | | | | | | | | | | | | | | | | | | | | | | | | | | |
Balance as of December 31, 2010 | | | 166 | | | | 37 | | | | 920 | | | | 5,048 | | | | 196 | | | | — | | | | 6,367 | |
| | | | | | | | | | | | | | | | | | | | | | | | | | | | |
Accumulated Depreciation | | | | | | | | | | | | | | | | | | | | | | | | | | | | |
| | | | | | | | | | | | | | | | | | | | | | | | | | | | |
Balance as of December 31, 2008 | | | 85 | | | | 123 | | | | 352 | | | | 680 | | | | 93 | | | | — | | | | 1,334 | |
| | | | | | | | | | | | | | | | | | | | | | | | | | | | |
Depreciation of the period | | | 17 | | | | 38 | | | | 153 | | | | 882 | | | | 31 | | | | — | | | | 1,121 | |
Disposals | | | — | | | | (26 | ) | | | (74 | ) | | | (6 | ) | | | (1 | ) | | | — | | | | (107 | ) |
Reclassifications | | | (88 | ) | | | (94 | ) | | | (20 | ) | | | 171 | | | | 31 | | | | — | | | | — | |
Foreign currency effect | | | — | | | | (8 | ) | | | 33 | | | | (8 | ) | | | (7 | ) | | | — | | | | 10 | |
| | | | | | | | | | | | | | | | | | | | | | | | | | | | |
Balance as of December 31, 2009 | | | 14 | | | | 33 | | | | 444 | | | | 1,719 | | | | 147 | | | | — | | | | 2,358 | |
| | | | | | | | | | | | | | | | | | | | | | | | | | | | |
Depreciation of the period | | | 18 | | | | 1 | | | | 164 | | | | 1,164 | | | | 41 | | | | — | | | | 1,388 | |
Disposals | | | — | | | | — | | | | (48 | ) | | | (33 | ) | | | (1 | ) | | | — | | | | (82 | ) |
Reclassifications | | | — | | | | — | | | | — | | | | 78 | | | | (161 | ) | | | — | | | | (83 | ) |
Foreign currency effect | | | — | | | | — | | | | — | | | | 1 | | | | 10 | | | | — | | | | 11 | |
| | | | | | | | | | | | | | | | | | | | | | | | | | | | |
Balance as of December 31, 2010 | | | 32 | | | | 34 | | | | 560 | | | | 2,929 | | | | 36 | | | | — | | | | 3,592 | |
| | | | | | | | | | | | | | | | | | | | | | | | | | | | |
Net balance as of December 31 2009 | | | 152 | | | | 53 | | | | 373 | | | | 2,117 | | | | 86 | | | | — | | | | 2,780 | |
| | | | | | | | | | | | | | | | | | | | | | | | | | | | |
Net balance as of December 31 2010 | | | 134 | | | | 3 | | | | 360 | | | | 2,119 | | | | 160 | | | | — | | | | 2,775 | |
| | | | | | | | | | | | | | | | | | | | | | | | | | | | |
As at December 31, 2010, the gross value of property and equipment financed through leasing contracts amounted to €4.5 million (2009: €3.2 million), accumulated depreciation amounted to €1.2 million (2009: €1.3 million) and their rents payable amounted to €2.2 million (December 31, 2009: €2.2 million).
The Group recognized depreciation expense of €1.4 million, €1.1 million, and €0.8 million in the fiscal years ended December 31, 2010, 2009 and 2008 respectively.
F-30
18. CAPITALIZED TECHNOLOGY AND OTHER INTANGIBLE ASSETS
Change in intangible assets for the years ended December 31, 2010 and 2009 were as follows:
| | | | | | | | | | | | | | | | | | | | | | | | |
In Euros (‘000) | | | | | | | | | | | | | | | | | | |
| | | Capitalized
technology | | | Rights | | | Contents | | | Other
intangibles | | | In process
technology | | | Total | |
Acquisition cost | | | | | | | | | | | | | | | | | | | | | | | | |
Balance as of December 31, 2008 | | | 2,421 | | | | 346 | | | | 435 | | | | 120 | | | | 2,022 | | | | 5,344 | |
| | | | | | | | | | | | | | | | | | | | | | | | |
External acquisitions | | | 433 | | | | 32 | | | | — | | | | — | | | | 586 | | | | 1,051 | |
Own work capitalized | | | — | | | | — | | | | — | | | | — | | | | 2,837 | | | | 2,837 | |
Reclassifications | | | 3,568 | | | | — | | | | 415 | | | | — | | | | (3,983 | ) | | | — | |
Currency variations | | | (59 | ) | | | — | | | | — | | | | — | | | | 11 | | | | (48 | ) |
| | | | | | | | | | | | | | | | | | | | | | | | |
Balance as of December 31, 2009 | | | 6,363 | | | | 378 | | | | 850 | | | | 120 | | | | 1,473 | | | | 9,184 | |
| | | | | | | | | | | | | | | | | | | | | | | | |
External acquisitions | | | 1,062 | | | | 64 | | | | 20 | | | | 334 | | | | 124 | | | | 1,604 | |
Own work capitalized | | | 1,016 | | | | — | | | | 300 | | | | — | | | | 1,535 | | | | 2,851 | |
Disposals | | | (63 | ) | | | — | | | | — | | | | — | | | | — | | | | (63 | ) |
Reclassifications | | | 922 | | | | 150 | | | | — | | | | 335 | | | | (1,355 | ) | | | 52 | |
Currency variations | | | 214 | | | | — | | | | — | | | | — | | | | 1 | | | | 215 | |
| | | | | | | | | | | | | | | | | | | | | | | | |
Balance as of December 31, 2010 | | | 9,514 | | | | 592 | | | | 1,170 | | | | 789 | | | | 1,778 | | | | 13,843 | |
| | | | | | | | | | | | | | | | | | | | | | | | |
Amortization | | | | | | | | | | | | | | | | | | | | | | | | |
Balance as of December 31, 2008 | | | 749 | | | | 69 | | | | 145 | | | | 37 | | | | — | | | | 1,000 | |
| | | | | | | | | | | | | | | | | | | | | | | | |
Amortization of the period | | | 1,086 | | | | 106 | | | | 176 | | | | 1 | | | | — | | | | 1,369 | |
Reclassifications | | | 29 | | | | — | | | | — | | | | (29 | ) | | | — | | | | — | |
Currency variations | | | (63 | ) | | | (2 | ) | | | — | | | | — | | | | — | | | | (65 | ) |
| | | | | | | | | | | | | | | | | | | | | | | | |
Balance as of December 31, 2009 | | | 1,801 | | | | 173 | | | | 321 | | | | 9 | | | | — | | | | 2,304 | |
| | | | | | | | | | | | | | | | | | | | | | | | |
Amortization of the period | | | 2,333 | | | | 113 | | | | 208 | | | | 183 | | | | — | | | | 2,837 | |
Reclassifications | | | (134 | ) | | | 146 | | | | 35 | | | | — | | | | — | | | | 47 | |
Currency variations | | | (22 | ) | | | 2 | | | | — | | | | — | | | | — | | | | (20 | ) |
| | | | | | | | | | | | | | | | | | | | | | | | |
Balance as of December 31, 2010 | | | 3,978 | | | | 434 | | | | 564 | | | | 192 | | | | — | | | | 5,168 | |
| | | | | | | | | | | | | | | | | | | | | | | | |
Net balance as of December 31, 2009 | | | 4,562 | | | | 205 | | | | 529 | | | | 111 | | | | 1,473 | | | | 6,880 | |
| | | | | | | | | | | | | | | | | | | | | | | | |
Net balance as of December 31, 2010 | | | 5,536 | | | | 158 | | | | 606 | | | | 597 | | | | 1,778 | | | | 8,675 | |
| | | | | | | | | | | | | | | | | | | | | | | | |
Intangible assets are comprised primarily of capitalized and in-progress technology related to the development of new features on our proprietary mobile delivery and customer support platforms. This includes purchased software that is not integral to specific hardware and directly attributable costs for internal development projects that are at a sufficiently advanced stage and are economically viable, in line with our accounting policy for capitalized internally generated intangible assets. Development costs are primarily incurred in Portugal and Brazil. We are amortizing the technology assets on a straight-line basis over their estimated useful lives of 3-4 years.
Rights and contents are primarily distribution rights that the Group purchases through third-party providers, such as television stations and music labels. These include costs incurred to acquire content such as video clips, ringtones and images and to make these items available for delivery to consumers through our platform.
Research and development expenses not capitalized for the years ended December 31, 2008, 2009 and 2010 were €0.4 million, €0.3 million and €0.3 million, respectively.
The Group recognized amortization expense for intangible assets of €0.9 million, €1.4 million and €2.8 million in the fiscal years ended December 31, 2008, 2009 and 2010, respectively. Amortization is computed using the
F-31
straight-line method over the assets’ estimated useful lives. As of December 31, 2010, 2009 and 2008, all of the Group’s intangible assets that had a carrying value were being amortized. The Group annually reviews these assets to determine whether events and circumstances continue to support the indefinite useful life designation.
In-process technology was tested for impairment during the fourth quarter of fiscal 2010 and did not note an impairment charge needed, as discounted future cash flows expected to be derived from the assets exceeded their carrying amounts. We also reviewed amortization estimates, methods and the amortization periods for our intangible assets and noted no indicators that warranted a change in amortization.
The estimated aggregate amortization from intangible assets for each of the next five years is as follows (in thousands of Euros):
| | | | |
In Euros (‘000) | |
December 31, | | Amount | |
2011 | | | 3,693 | |
2012 | | | 2,728 | |
2013 | | | 1,673 | |
2014 | | | 581 | |
2015 | | | — | |
2016 and beyond | | | — | |
| | | | |
Total | | | 8,675 | |
| | | | |
19. GOODWILL
Goodwill was primarily recognized during the organization of the Group in 2006 upon the combination of three previously-independent entities. There have been no goodwill additions, impairments or write-offs in any of the fiscal years presented.
Management performed an annual goodwill impairment test at December 31, 2010. The test assessed whether the carrying value of goodwill was supported by the net present value of future cash flows derived from the underlying assets. Management has made the determination that goodwill was not impaired based on these positive projected operating results.
20. ACCOUNTS PAYABLE
Accounts payable includes:
| | | | | | | | |
In Euros (‘000) | |
| | | December 31, | |
AP and other current liabilities | | 2010 | | | 2009 | |
Trade accounts payable | | | 11,842 | | | | 7,276 | |
Accrued liabilities (current) | | | 7,795 | | | | 9,029 | |
Other liabilities | | | 447 | | | | 156 | |
| | | | | | | | |
| | | 20,084 | | | | 16,461 | |
| | | | | | | | |
Aside from trade accounts payable to suppliers for normal operations, the Group accrued current liabilities related to accrued salaries, vacation pay and bonuses.
F-32
21. LIABILITIES RELATED TO FACTORING OPERATIONS INCLUDE:
| | | | | | | | |
In Euros (‘000) | |
| | | December 31, | |
| | | 2010 | | | 2009 | |
Liabilities related to factoring operations | | | 1,181 | | | | 77 | |
| | | | | | | | |
Factoring operations with recourse
The Group has factoring operations of trade receivables for specifically-identified customers to unrelated third-party banks, with recourse. These arrangements stipulate the transfer of all rights of the cash flows of the receivables to the bank. The Group passes all servicing responsibilities and credit risk of these receivables to the bank, which notifies the customer associated with the receivable in writing to remit payment to the bank and not to Tim w.e. However, the Group retains the risk associated with any unpaid invoices, including any late payment interest owed to the bank, until the customer pays their invoice. The interest rate for any delay in payment is Euribor 3 months plus a 1% spread.
We have determined that these transfers do not qualify for derecognition because the Group has retained substantially all the risks of ownership for the receivables. The Group continues to recognize the receivables in our statement of financial position. The Group also recognizes a financial liability related to the factoring operations and considers the transfers as a secured borrowing with the pledge of receivables as collateral. The expenses are included in Financial expenses on the Statement of Comprehensive Income.
These facilities contain customary affirmative and negative covenants as well as specific provisions related to the quality of the accounts receivables transferred. The banks have the right to cancel the factoring facility if these covenants are not met, at which time all outstanding debt would be payable by the group on demand. As of December 31, 2010, there were €1.2 million in secured borrowings under the facility, as a result of factoring €1.5 million of receivables with recourse. As of December 31, 2009, there were €77 thousand in secured borrowings under the facility, as a result of factoring €121 thousand of receivables with recourse.
Factoring operations without recourse
The Group also has facilities that enable us to sell, on an ongoing basis, certain trade receivable from mobile carriers to third-parties without recourse. The trade receivables sold are generally short-term trade receivables. We record these transactions as asset sales as they qualify for derecognition under IFRS. These arrangements stipulate the transfer of all rights to all cash flows of the receivable to the bank. Any risks and rewards associated with the receivables are transferred to the bank, and the Group does not hold any beneficial interests in the receivables sold. The Group passes all servicing responsibilities and credit risk of these receivables to the bank, which notifies the customer associated with the receivable in writing to remit payment to the bank and not to Tim w.e.
There is no gain or loss on the transfer of the assets, as the banks purchase the invoices at face value. The Group pays a fee of 1.95%-2.78% per invoice when purchased by the banks. Transactions occur on a regular basis and we have the ability to sell all invoices up to a €2.0 million limit.
F-33
22. PROVISIONS
Provisions are as follows:
| | | | | | | | |
In Euros (‘000) | |
| | | December 31, | |
Provisions | | 2010 | | | 2009 | |
Provisions for legal and labor contingencies | | | 162 | | | | 409 | |
Provisions for other risks | | | 537 | | | | 5 | |
| | | | | | | | |
| | | 699 | | | | 414 | |
| | | | | | | | |
The movements in Provision and other non-current liabilities are as follows:
| | | | | | | | |
In Euros (‘000) | |
| | | Provisions for legal and labor
contingencies at December 31, | |
| | | 2010 | | | 2009 | |
Balance on January 1 | | | 409 | | | | 5 | |
Charge for the year | | | 59 | | | | 482 | |
Write-back | | | (7 | ) | | | — | |
Utilization | | | (299 | ) | | | (118 | ) |
Exchange rate differences | | | — | | | | 40 | |
| | | | | | | | |
Balance on December 31 | | | 162 | | | | 409 | |
| | | | | | | | |
| | | | | | | | |
In Euros (‘000) | |
| | | Provisions for other risks at
December 31, | |
| | | 2010 | | | 2009 | |
Balance on January 1 | | | 5 | | | | 81 | |
Charge for the year | | | 537 | | | | — | |
Write-back | | | — | | | | (77 | ) |
Utilization | | | (5 | ) | | | — | |
Exchange rate differences | | | — | | | | 1 | |
| | | | | | | | |
Balance on December 31 | | | 537 | | | | 5 | |
| | | | | | | | |
Costs (including legal costs) expected to be incurred in connection with a loss contingency are expensed as incurred. The Group records a provision for costs that have been delivered and expenses incurred (such as legal fees), but not yet invoiced. Other provisions were accrued for labor and tax settlements that management has deemed to be probable and reasonably estimable.
F-34
23. LOANS AND BORROWINGS
Details of long-term debt and short-term financing by facility are as follows:
| | | | | | | | | | | | | | | | | | |
| In Euros (‘000) | | | | | | As of December 31, | | | |
| | | | | | | 2010 | | | 2010 | | | 2009 | | | |
Bank | | Debt Outstanding | | Date of
Maturity | | Total
Facility | | | Amount
Outstanding | | | Amount
Outstanding | | | Covenants |
| BBVA | | Bank loans 3 month Euribor + 1.50% | | November/12 | | | 2,000 | | | | 1,609 | | | | 2,000 | | | • The Borrower shall not Sell, transfer or otherwise dispose more than 20% of its assets without the express consent of the Lenders • The Company will send to the bank a copy of its financial statements not later than 120 days after the end of the financial period to which they are related • Ensure that its obligations under the Finance Documents will at all times rank at least pari passu with all other present and future unsecured and unsubordinated indebtedness, save for indebtedness preferred by law or as otherwise agreed by the Lenders |
| | | | | | |
| Banco BPI | | Bank loan 3 month Euribor + 2.00% | | November/14 | | | 500 | | | | 500 | | | | 500 | | | • Ensure that the ratio Equity/Total Net Asset ratio is greater than 20% • Ensure that from TIMwe, SPGS, S.A. the Net Debt/EBITDA ratio does not exceed 2.5 and that the ratio (Equity + Shareholders Loans)/(Total Net Asset) ratio is greater than 20% |
| | | | | | |
| Banco Popular | | Bank loan 3 month Euribor + 2.50% | | October/13 | | | 1,250 | | | | 952 | | | | 1,250 | | | • Notify the Agent of any possibility of Event of Default • Provide details of any Financial statements documentation required by the lender |
| | | | | | |
| Barclays Bank | | 3 month Euribor + 1.80% bank loan | | October/12 | | | 2,000 | | | | 1,241 | | | | 1,893 | | | • Ensure that the Net Debt/EBITDA ratio does not exceed 2.5 • Comply with payment term of debt • Ensure that its obligations under the Finance Documents will at all times rank at least pari passu with all other present and future unsecured and unsubordinated indebtedness, save for indebtedness preferred by law or as otherwise agreed by the Lenders |
| | | | | | |
| Banco Santander | | 3 month Euribor + 1.80% bank loan | | November/12 | | | 1,500 | | | | 1,000 | | | | 1,500 | | | • Comply with payment term of debt |
| | | | | | |
| Banco BPI | | Commercial paper 12 month Euribor + 2.4% | | September/13 | | | 7,000 | | | | — | | | | | | | • Ensure that in TIMwe, SGPS, SA the ratio (Equity + Shareholders Loans)/(Total Net Asset-Liquid Assets) ratio is equal or greater than 20% • Ensure that in TIMwe, SGPS, SA the Net Debt/EBITDA ratio does not exceed 2.5 • Ownership Clause: the current stockholders must keep a higher than 50.1% equity stake in the company |
F-35
| | | | | | | | | | | | | | | | | | |
| In Euros (‘000) | | | | | | As of December 31, | | | |
| | | | | | | 2010 | | | 2010 | | | 2009 | | | |
Bank | | Debt Outstanding | | Date of
Maturity | | Total
Facility | | | Amount
Outstanding | | | Amount
Outstanding | | | Covenants |
| Barclays Bank | | Commercial paper 12 month Euribor + 1.75% | | March/14 | | | 2,000 | | | | — | | | | | | | • Ownership Clause: the current stockholders must keep a higher than 51% equity stake in the company • Ensure that its obligations under the Finance Documents will at all times rank at least pari passu with all other present and future unsecured and unsubordinated indebtedness, save for indebtedness preferred by law or as otherwise agreed by the Lenders |
| | | | | | |
| Montepio | | Commercial paper 12 month Euribor + 2.50% | | N/A | | | — | | | | — | | | | 2,000 | | | None |
| | | | | | |
| Barclays Bank | | Overdraft program 3 month Euribor + 1.75% | | renew every 12 months | | | 1,000 | | | | — | | | | | | | • Ownership Clause: the current stockholders must keep a higher than 51% Equity stake in the company • Ensure that its obligations under the Finance Documents will at all times rank at least pari passu with all other present and future unsecured and unsubordinated indebtedness, save for indebtedness preferred by law or as otherwise agreed by the Lenders |
| | | | | | |
| Banco BPI | | Overdraft program 1 month Euribor + 3.00% | | renew every 3 months | | | 3,000 | | | | — | | | | | | | • Ownership Clause: the current stockholders must keep a higher than 51% Equity stake in the company |
| | | | | | |
Banco BPI | | Guaranteed loans 3 month Euribor + 2.75% | | September/16 | | | 2,000 | | | | 2,000 | | | | | | | • Ensure that its obligations under the Finance Documents will at all times rank at least pari passu with all other present and future unsecured and unsubordinated indebtedness, save for indebtedness preferred by law or as otherwise agreed by the Lenders |
| | | | | | |
| | | | | | | | | | | | | | | | | | Negative Pledge: it will not without the the prior written approval of the Bank create or agree to create or permit to subsist any security interest on or over the whole or any part of its undertaking, assets or revenues (present or future) |
| | | | | | |
| | | | | | | | | | | | | | | | | | • Ensure that in TIMwe, SGPS, SA the ratio (Equity + Shareholders Loans)/(Total Net Asset-Liquid Assets) ratio is equal or greater than 20% |
| | | | | | |
| | | | | | | | | | | | | | | | | | • Ensure that in TIMwe, SGPS, SA the Net Debt/EBITDA ratio does not exceed 2.5 |
| | | | | | |
| | | | | | | | | | | | | | | | | | • Maintenance of a minimum of 5,000,000€ of supplementary Capital |
F-36
| | | | | | | | | | | | | | | | | | |
| In Euros (‘000) | | | | | | As of December 31, | | | |
| | | | | | | 2010 | | | 2010 | | | 2009 | | | |
Bank | | Debt Outstanding | | Date of
Maturity | | Total
Facility | | | Amount
Outstanding | | | Amount
Outstanding | | | Covenants |
Banco BPI | | Guaranteed loan 3 month Euribor + 1.75% | | June/16 | | | 1,500 | | | | 1,500 | | | | | | | • Ensure that its obligations under the Finance Documents will at all times rank at least pari passu with all other present and future unsecured and unsubordinated indebtedness, save for indebtedness preferred by law or as otherwise agreed by the Lenders |
| | | | | | |
| | | | | | | | | | | | | | | | | | Negative Pledge: it will not without the the prior written approval of the Bank create or agree to create or permit to subsist any security interest on or over the whole or any part of its undertaking, assets or revenues (present or future) |
| | | | | | |
| | | | | | | | | | | | | | | | | | • Ensure that the ratio (Equity + Shareholders Loans)/(Total Net Asset-Liquid Assets) ratio is greater than 20% |
| | | | | | |
| | | | | | | | | | | | | | | | | | • Ensure that the Net Debt/EBITDA ratio from TIMwe, SPGP, S.A. does not exceed 2.5 |
| | | | | | |
Banco BPI | | Guaranteed loan 3 month Euribor + 1.00% | | November/14 | | | 1,000 | | | | 1,000 | | | | 1,000 | | | Negative Pledge: it will not without the the prior written approval of the Bank create or agree to create or permit to subsist any security interest on or over the whole or any part of its undertaking, assets or revenues (present or future) |
| | | | | | |
| | | | | | | | | | | | | | | | | | • Ensure that its obligations under the Finance Documents will at all times rank at least pari passu with all other present and future unsecured and unsubordinated indebtedness, save for indebtedness preferred by law or as otherwise agreed by the Lenders |
| | | | | | |
| | | | | | | | | | | | | | | | | | From the Borrower |
| | | | | | |
| | | | | | | | | | | | | | | | | | • Ensure that the ratio Equity /Total Net Asset ratio is greater than 20% |
| | | | | | |
| | | | | | | | | | | | | | | | | | From TIMwe, SGPS, SA |
| | | | | | |
| | | | | | | | | | | | | | | | | | • Ensure that the ratio Equity /Total Net Asset ratio is greater than 20% |
| | | | | | |
| | | | | | | | | | | | | | | | | | • Ensure that the Net Debt/EBITDA ratio does not exceed 2.5 |
| | | | | | |
| Banco Espirito Santo | | Other loans 3 month Euribor + 1.50% | | October 2011 - December 2011 | | | 124 | | | | 33 | | | | 61 | | | • Comply with payment term of debt |
| | | | | | | | | | | | | | | | | | |
| | | | | | | 24,875 | | | | 9,835 | | | | 10,204 | | | |
| | | | | | | | | | | | | | | | | | |
| | Current portion | | | | | | | | | 2,521 | | | | 2,061 | | | |
| | Non-current portion | | | | | | | | | 7,314 | | | | 8,143 | | | |
| | | | | | | | | | | | | | | | | | |
| | | | | | | | | | | 9,835 | | | | 10,204 | | | |
| | | | | | | | | | | | | | | | | | |
F-37
The Group has agreements with banks for commercial paper and overdraft financing, for which no amounts were utilized or outstanding as of December 31, 2010. The commercial paper financing agreements may be utilized by the Group at any time and are automatically renewed each year through 2013 and 2015.
In the year ended December 31, 2010, the Group extended the term of one commercial paper agreement, for which we increased the total facility amount from €5.0M to €7.0M. The overdraft agreements are also automatically renewed for terms of six and twelve months.
Future principal repayments under all debt arrangements as of December 31, 2010 are as follows:
| | | | |
| In Euros (‘000) | | | |
December 31, | | Amount | |
2011 | | | 2,521 | |
2012 | | | 3,436 | |
2013 | | | 1,528 | |
2014 | | | 1,200 | |
2015 | | | 700 | |
2016 and beyond | | | 450 | |
| | | | |
Total | | | 9,835 | |
| | | | |
Debt Covenants
As part of the Group’s debt agreements, we are required to comply with certain financial covenants, including, but not limited to: maximum debt to EBITDA ratio, and minimum equity to total net assets ratio. The Group was in compliance with all of its financial covenants as of December 31, 2010.
Additionally, under the debt agreements, the group is required to comply with certain non-financial covenants. These non-financial covenants included, but are not limited to: compliance with payment of all taxes including social security, providing financial statements to the bank in a timely manner, requirements that current stock-holders maintain at least 51% ownership, and the borrower shall not sell, transfer or otherwise dispose of 20% of its assets without the express consent of the lenders. The Group was in compliance with all of its non-financial covenants as of December 31, 2010.
New Financing Facilities
In the year ended December 31, 2010, the Group entered into three new debt facilities for a total of €3.5 million in available financing. All debt facilities are under the PME Investment Program, which is offered by the Portuguese government in order to encourage lending in the country. Fifty percent of the loan amount is secured by the government. The new debt facilities are:
| | 1) | PME INVEST V with a principal amount of €1.5 million at an interest rate of Euribor 3M + 1.75% per annum. |
| | 2) | PME INVEST VI with a principal amount of €1 million at an interest rate of Euribor 3M + 2.75% per annum. |
| | 3) | PME INVEST VI with a principal amount of €1 million at an interest rate of Euribor 3M + 2.75% per annum. |
Each of these facilities is a five year loan that is repayable in 20 equal quarterly payments with the first payment in year one. The loan may be repaid early without any cancelation fee at the Group’s option, with three day advanced notice Covenants ensure that the ratio of: (Equity + Shareholders Loans) / (Total Net Asset-Liquid Assets) ratio is greater than 20% and that the Net Debt / EBITDA ratio from TIMwe, SPGS, S.A. does not exceed 2.5.
F-38
24. LEASES
Finance leases relate to hardware for administrative and operating purposes with various technology vendors.
As at December 31, 2010 and 2009, the Group’s obligations are:
| | | | | | | | | | | | | | | | | | | | | | | | |
| In Euros (‘000) | |
| | | Due in December 31, 2010 | | | Due in December 31, 2009 | |
Finance Leases | | Amount | | | Interest | | | Rent | | | Amount | | | Interest | | | Rent | |
Less than 1 year | | | 1,038 | | | | 73 | | | | 1,111 | | | | 894 | | | | 73 | | | | 967 | |
Between 1 and 5 years | | | 1,036 | | | | 44 | | | | 1,080 | | | | 1,219 | | | | 51 | | | | 1,270 | |
| | | | | | | | | | | | | | | | | | | | | | | | |
Total | | | 2,074 | | | | 117 | | | | 2,191 | | | | 2,113 | | | | 124 | | | | 2,237 | |
| | | | | | | | | | | | | | | | | | | | | | | | |
The Group leases vehicles and office space under non-cancelable leases that expire at various dates through 2014. Rent expense under operating leases totaled €0.8 million and totaled €0.8 million for the years ended December 31, 2010 and 2009, respectively.
As of December 31, 2010, the future minimum rental payments due under noncancelable operating leases that have initial or remaining lease terms in excess of one year are as follows (in thousands of Euros):
| | | | | | | | | | | | |
| In Euros (‘000) | | | | | | | | | |
| | | December 31, | |
Operating Leases | | 2010 | | | 2009 | | | 2008 | |
Until one year | | | 703 | | | | 748 | | | | 676 | |
From one to five years | | | 1,046 | | | | 1,227 | | | | 1,975 | |
| | | | | | | | | | | | |
Total | | | 1,749 | | | | 1,975 | | | | 2,651 | |
| | | | | | | | | | | | |
25. EQUITY
The Group’s equity is comprised of:
| | | | | | | | | | | | |
| In Euros (‘000) | | | | | | | | | |
| | | December 31, | |
| | | 2010 | | | 2009 | | | 2008 | |
Share capital (Par value of €0.03, 83,333,333 shares authorized & issued and 82,916,667 outstanding as of December 31, 2010, 2009 and 2008) | | | 2,500 | | | | 2,500 | | | | 2,500 | |
Treasury share reserve | | | (750 | ) | | | (750 | ) | | | (750 | ) |
Translation reserve | | | (5,707 | ) | | | (5,357 | ) | | | (3,905 | ) |
Retained earnings | | | 26,406 | | | | 16,477 | | | | 10,480 | |
| | | | | | | | | | | | |
Total equity attributable to controlling interests | | | 22,449 | | | | 12,870 | | | | 8,325 | |
| | | | | | | | | | | | |
Non-controlling interests | | | 1,563 | | | | 1,139 | | | | 40 | |
| | | | | | | | | | | | |
Total equity | | | 24,012 | | | | 14,009 | | | | 8,365 | |
| | | | | | | | | | | | |
| | | |
| In Euros (‘000) | | | | | | | | | |
| | | December 31, | |
Non-controlling interests | | 2010 | | | 2009 | | | 2008 | |
Brasiltec | | | 970 | | | | 973 | | | | — | |
Tim w.e. Angola | | | 432 | | | | — | | | | — | |
Other Companies | | | 161 | | | | 166 | | | | 40 | |
| | | | | | | | | | | | |
Total Non-controlling interests | | | 1,563 | | | | 1,139 | | | | 40 | |
| | | | | | | | | | | | |
F-39
During the year ended December 31, 2010, the Group generated income attributable to non-controlling interests amounting to €1.6 million (€1.1 million for the year ended December 31, 2009).
In accordance with Portuguese legislation, retained earnings are not available for distribution unless certain conditions of minimum capital are met. At the year ended December 31, 2010, the Group had € 160 thousand of non-distributable reserves.
During a shareholders meeting held on May 17, 2010, a stock repurchase program was authorized, including the repurchase of 57,500 shares of the Group’s common stock. The repurchase was subject to, among other conditions, a shareholder meeting deliberation, which have not occurred until the year-end. Refer to Note 28—Events after the reporting period for additional discussion.
As of the December 31, 2010 balance sheet date, share capital consisted of 500,000 common shares, each with an arithmetical par value of €5.00, of which 497,500 were outstanding. On February 23, 2011 the Company made a share split from 1 share to 10 shares, which increased the share capital to 5,000,000 common shares. On the same date, the Company effected a share capital reduction of an aggregate of 2,000,000 common shares, which reduced the share capital to 3,000,000 common shares. On April 18, 2011 the shares increased by a share split from 3,000,000 shares to 30,000,000 shares. On July 14, 2011 the shares increased by a share split from 30,000,000 shares to 50,000,000 shares.
Considering the share splits occurred post balance sheet, the shares outstanding and earnings per share were retroactively adjusted to reflect the stock splits. The shares outstanding were not retroactively adjusted to reflect the share capital reduction given that there was a change in the Company’s resources arising in connection with such reduction, which results in the Company’s shares outstanding as of the balance sheet date (82,916,667, calculated as 497,500 x 10 x 10 x 1.667) exceeding the shares outstanding as of July 14, 2011 (50,000,000, calculated as 5,000,000 x 0.6 x 10 x 1.667), the date these financial statements were prepared.
| | | | | | | | | | | | |
| | | December 31, | |
| | | 2010 | | | 2009 | | | 2008 | |
Profit attributable to controlling interests (in thousands Euros) | | | 9,938 | | | | 6,234 | | | | 5,413 | |
| | | | | | | | | | | | |
Average number of outstanding shares during the year (number of shares in thousands) adjusted retrospectively to reflect the stock split | | | 82,917 | | | | 82,917 | | | | 82,917 | |
| | | | | | | | | | | | |
Weighted-average shares used to compute earnings per share (number of shares in thousands) | | | 82,917 | | | | 82,917 | | | | 82,917 | |
| | | | | | | | | | | | |
Earning per share—basic | | | 0.12 | | | | 0.08 | | | | 0.07 | |
Earning per share—diluted | | | 0.12 | | | | 0.08 | | | | 0.07 | |
| | | | | | | | | | | | |
26. GUARANTEES AND CONTINGENCIES
In the normal course of business, the Group may provide to operators and partners certain performance guarantees and/or financial performance guarantees, which are backed by commercial bank standby letters of credit. All outstanding guarantees in 2010 totaled €2.2 million at the maximum, with no individual balance greater than €0.6 million. These were issued to ensure compliance with local carriers and regulatory restrictions, mainly related to our promotion programs.
In principle, the Group would be liable for the amounts of these guarantees in the event the Group’s nonperformance permits termination of the related contract. All guarantees are tracked by the Legal Department and monitored on a monthly basis. Management believes the likelihood of termination for any of these contracts is unlikely, and the majority of the Group’s guarantees extend a maximum of one year. Management believes that the company is in compliance with the performance obligations under all material service contracts for which there is a performance guarantee.
F-40
The Group is subject to lawsuits, claims, investigations and proceedings that arise in the ordinary course of business. The Group records a provision for a loss when it believes it is both probable that a liability has been incurred and the amount can be reasonably estimated. Significant judgment is required to determine both probability and the estimated amount. Management reviews these provisions on a quarterly basis and adjusts these provisions to reflect the impact of negotiations, settlements, advice of legal counsel, rulings and other information. There are no unrecognized loss contingencies for which there is at least a reasonable possibility that a loss or an additional loss has been incurred. However, litigation is inherently unpredictable and is subject to significant uncertainties, some of which are beyond the Group’s control.
27. RELATED PARTIES
The Group did not enter into any material transactions with related parties for the periods presented. There are no material amounts due to or from related parties as of December 31, 2008, 2009 and 2010.
28. EVENTS AFTER THE REPORTING PERIOD
Management evaluated all subsequent events that occurred after the date of the statement of financial position and through the date the financial statements were authorized for issue on July 15, 2011.
Between January 19, 2011 and February 2, 2011 the Company, pursuant to separate, individual negotiations with three of its minority shareholders, purchased an aggregate of 77,500 shares from such shareholders for a total consideration of €2.78 million. The purchased shares were recorded as treasury stock and the transactions had the effect of increasing the amount of the Company’s treasury stock from 0.5% to 16.0% of its total share capital.
Under Portuguese law, the Company’s total treasury stock may not exceed 10% of its total share capital. Therefore, on February 23, 2011 the shareholders of the Company agreed (i) to effect a stock split pursuant to which the total share capital of the Company increased from 500 thousand to 5 million shares and (ii) to subsequently reduce the Company’s share capital in February 23, 2011 by an aggregate of 2 million shares, 0.8 million of which were treasury shares, which were retired in order to satisfy the Portuguese legal threshold concerning treasury stock.
As of February 23, 2011, share capital comprised of 3 million shares authorized, issued and outstanding at a par value of €0.50 each.
On April 18, 2011, the shareholders meeting approved the change of the number of shares from 3,000,000 to 30,000,000 changing also the par value from €0.5 to €0.05. In conjunction with this decision, it was approved the change of the Corporate Governance structure adopting an Audit Committee and the possibility to adopt an Executive Committee as part of the Board of Directors, was approved.
On July 14, 2011 the shareholders meeting approved the change of the number of shares from 30,000,000 shares to 50,000,000 shares changing also the par value from €0.05 to €0.03.
29. NEW INTERNATIONAL FINANCIAL REPORTING STANDARDS
The following standards and interpretation were effective in the fiscal year ended December 31, 2010:
The IASB issued an amendment to IAS 39, “Financial Instruments: Recognition and measurement—Eligible hedged items,” which was mandatory from July 1, 2009. This change clarifies the application of the existing principles that determine what risks or which cash-flows can be designated as a hedged item. The Group was not significantly impacted by adoption of this amendment.
Changes in the IFRS 1, “First time adoption of the International Financial Reporting Standards” and IAS 27, “Consolidated and Separated Financial Statements” were effective from July 1 2009. These changes allowed
F-41
entities adopting IFRS for the first time in the preparation of the individual accounts to use as deemed cost of the investments in subsidiaries, joint-ventures and associated companies, the respective fair value at the transition date to the IFRS or the carrying amount determined based on the previous accounting framework. The Group was not significantly impacted by adoption of this amendment.
The IASB issued in January 2008 an amendment to IFRS 3 (amended), “Business Combinations,” with mandatory application for fiscal years beginning after July 1 2009, although early adoption was permitted. The main impacts of the changes to these standards are: (i) the treatment of partial acquisitions where the non-controlling interests (previously defined as minority interests) will be measured at fair value (which implies also the recognition of goodwill attributable to non-controlling interests) or as an alternative allows for the attributable to non-controlling interest of the fair value of the net assets acquired (as currently required) to be measured at fair value; (ii) the step acquisition that require, at the time when the goodwill is determined, the revaluation against profit and loss, of the fair value of any non-controlling interest held previously to the acquisition when control is passed; (iii) the costs directly related to the acquisition of a subsidiary will be accounted in profit and loss; (iv) the changes in the estimates of the contingent prices are accounted in profit and loss and do not affect goodwill; and (v) the changes in percentages of subsidiaries held that do not result in a loss in control are accounted as equity changes. Additionally, following the changes to IAS 27, the accumulated losses in a subsidiary will be attributed to the non-controlling interests (recognition of negative non-controlling interests) and when a subsidiary is sold with a subsequent loss of control, the remaining non-controlling interests are measured at the fair value determined at the date of the transaction. Considering the Group had no business combinations, we were not significantly impacted by adoption of this amendment.
The International Financial Reporting Interpretations Committee (IFRIC) issued in July 2007 IFRIC 12, “Service Concession Arrangements”. This interpretation is mandatory for annual periods beginning on or after March 29, 2009. IFRIC 12 applies to public-to-private service concession arrangements. This interpretation will be applicable only when a) the grantor controls or regulates what services the operator must provide and b) the grantor controls any significant residual interest in the infrastructure at the term of the arrangement. Considering the nature of the contracts considered under this interpretation, the Group was not significantly impacted by adoption of this amendment.
The IFRIC issued in November 2008, IFRIC 17, “Distributions of Non-cash Assets to Owners, with effective application date to years started after July 1, 2009, early adoption allowed. This interpretation intends to clarify the accounting treatment of non-cash assets distribution to owners. It establishes that non-cash assets distributions must be accounted at fair value and the difference to the distributed assets carrying amount recognized in profit and loss in the period of the distribution. The Group was not significantly impacted by adoption of this amendment.
The IFRIC issued in November 2008, IFRIC 18, “Transfers of Assets from Customers,” with effective application date to years started after July 1, 2009, early adoption allowed. This interpretation intends to clarify the accounting treatment of agreements through which an entity receives assets from customers for its own use and with the intent of establishing a future connection of the clients to a network or of granting continued access to the supply of services and goods to customers.
The interpretation clarifies:
| | • | | The conditions in which an asset is within the scope of this interpretation; |
| | • | | The assets recognition and initial measurement; |
| | • | | The identification of the identifiable services (one or more services in exchange for the transferred asset); |
| | • | | Revenue recognition; and |
| | • | | Accounting of money transfers from customers. |
F-42
The Group was not significantly impacted by adoption of this amendment.
We have not early adopted the following new and revised standards, amendments or interpretations that have been issued but are not yet effective:
On October 28, 2010, the IASB issued amendments to IFRS 9 “Financial Instruments.” The amendments address the accounting for financial liabilities, specifically volatility in the income statement arising from measuring debt at fair value. With the new requirements, an entity choosing to measure a liability at fair value will present the portion of the change in its fair value due to changes in the entity’s own credit risk in the other comprehensive income section of the income statement, rather than within profit or loss. IFRS 9 is effective for financial statements in annual periods beginning on or after January 1, 2013. Early adoption of the amendments is permitted; however, entities that elect early adoption must also apply the financial asset requirements in IFRS 9. We are currently evaluating the impact of adoption on our consolidated financial statements.
In November 2009, IFRIC Interpretation 19, “Extinguishing Financial Liabilities with Equity Instruments”, or IFRIC 19, was issued. IFRIC 19 requires a gain or loss to be recognized when a liability is settled through the issuance of the entity’s own equity instruments. The amount of the gain or loss recognized in profit or loss will be the difference between the carrying value of the financial liability and the fair value of the equity instruments issued. If the fair value of the equity instruments cannot be reliably measured then the fair value of the existing financial liability is used to measure the gain or loss. IFRIC 19 must be applied in annual periods beginning on or after July 1, 2010. Earlier application is permitted. It must be applied retrospectively from the beginning of the earliest comparative period presented. We will apply IFRIC 19 effective April 1, 2011. We are currently evaluating the impact of adoption of this new standard on our consolidated financial statements.
In November 2009, the IASB issued a revised version of IAS 24, “Related party disclosures”. The amendment removes the requirement for government-related entities to disclose details of all transactions with the government and other government-related entities, and clarifies and simplifies the definition of a related party. The amended definition may require entities to provide additional related party disclosures. The revised standard is effective for annual periods beginning on or after January 1, 2011, with earlier application permitted. We are currently evaluating the impact of adoption of this new standard on our consolidated financial statements.
F-43
UNAUDITED CONDENSED CONSOLIDATED STATEMENTS OF INCOME
in Euro thousands, except shares and per share amounts
| | | | | | | | | | |
| | | | | Three Months ended
March 31, | |
| | | Note | | 2011 | | | 2010 | |
Revenue | | 3 | | | 47,384 | | | | 34,600 | |
Operating expenses | | | | | | | | | | |
Cost of service delivery | | 4 | | | (24,115 | ) | | | (18,798 | ) |
Commercial and production costs | | 5 | | | (16,216 | ) | | | (10,237 | ) |
Personnel costs | | 6 | | | (2,862 | ) | | | (2,269 | ) |
General and administrative | | 7 | | | (2,063 | ) | | | (1,631 | ) |
Tax expenses | | 8 | | | (333 | ) | | | (445 | ) |
Amortization and depreciation | | | | | (1,325 | ) | | | (932 | ) |
Provisions expense | | | | | (91 | ) | | | (46 | ) |
| | | | | | | | | | |
Total operating expenses | | | | | (47,005 | ) | | | (34,358 | ) |
| | | | | | | | | | |
Operating profit | | | | | 379 | | | | 242 | |
Finance income | | 9 | | | 108 | | | | 314 | |
Finance costs | | 9 | | | (423 | ) | | | (440 | ) |
| | | | | | | | | | |
| | | | | (315 | ) | | | (126 | ) |
| | | | | | | | | | |
Profit before income taxes | | | | | 64 | | | | 116 | |
| | | | | | | | | | |
Income tax gain/(expense) | | 13 | | | 179 | | | | (25 | ) |
| | | | | | | | | | |
Net income for the period | | | | | 243 | | | | 91 | |
| | | | | | | | | | |
Profit/(loss) attributable to controlling interests | | | | | 265 | | | | 211 | |
Profit/(loss) attributable to non-controlling interests | | | | | (22 | ) | | | (120 | ) |
| | | | | | | | | | |
| | | | | 243 | | | | 91 | |
| | | | | | | | | | |
Earnings per share | | | | | | | | | | |
Basic and Diluted (in Euros) | | 21 | | | — | | | | — | |
| | | | | | | | | | |
Weighted-average shares used to compute earnings per share: | | | | | | | | | | |
Basic and Diluted (number of shares in thousands) | | 21 | | | 65,319 | | | | 82,917 | |
| | | | | | | | | | |
See accompanying notes to condensed consolidated financial statements.
F-44
UNAUDITED CONDENSED CONSOLIDATED STATEMENTS OF COMPREHENSIVE INCOME
in Euro thousands, except shares and per share amounts
| | | | | | | | |
| | | Three Months ended
March 31, | |
| | | 2011 | | | 2010 | |
Net income for the year | | | 243 | | | | 91 | |
| | | | | | | | |
Exchange differences on translation | | | (1,332 | ) | | | 428 | |
| | | | | | | | |
Total comprehensive income | | | (1,089 | ) | | | 519 | |
| | | | | | | | |
Profit/ (loss) attributable to controlling interests | | | (981 | ) | | | 606 | |
Profit/( loss) attributable to non-controlling interests | | | (108 | ) | | | (87 | ) |
| | | | | | | | |
| | | (1,089 | ) | | | 519 | |
| | | | | | | | |
See accompanying notes to condensed consolidated financial statements.
F-45
UNAUDITED CONDENSED CONSOLIDATED STATEMENTS OF FINANCIAL POSITION
in Euro thousands, except shares and per share amounts
| | | | | | | | | | |
| | | | | At March 31, | | | At December 31, | |
| | | Note | | 2011 | | | 2010 | |
ASSETS | | | | | | | | | | |
Current assets | | | | | | | | | | |
Cash and cash equivalents | | 10 | | | 7,297 | | | | 8,610 | |
Trade receivables | | 11 | | | 24,284 | | | | 25,431 | |
Inventories | | | | | 58 | | | | 72 | |
Prepaid expenses and other assets | | 12 | | | 5,585 | | | | 3,238 | |
Current income tax assets | | 13 | | | 2,932 | | | | 3,280 | |
Other tax assets | | 14 | | | 5,179 | | | | 4,647 | |
| | | | | | | | | | |
| | | | | 45,335 | | | | 45,278 | |
Non-current assets | | | | | | | | | | |
Property and equipment | | | | | 2,704 | | | | 2,775 | |
Capitalized technology | | 15 | | | 6,737 | | | | 5,536 | |
Other intangible assets | | 15 | | | 1,719 | | | | 3,139 | |
Goodwill | | | | | 642 | | | | 642 | |
Deferred income tax assets | | 13 | | | 2,894 | | | | 2,119 | |
Other assets | | | | | 123 | | | | 87 | |
| | | | | | | | | | |
| | | | | 14,819 | | | | 14,298 | |
| | | | | | | | | | |
Total assets | | | | | 60,154 | | | | 59,576 | |
| | | | | | | | | | |
EQUITY and LIABILITIES | | | | | | | | | | |
Current liabilities | | | | | | | | | | |
Accounts payable | | 16 | | | 21,073 | | | | 20,084 | |
Liabilities related to factoring operations | | 17 | | | 1,244 | | | | 1,181 | |
Current portion of long term debt | | 19 | | | 4,332 | | | | 2,521 | |
Current portion of finance lease obligations | | 20 | | | 881 | | | | 1,038 | |
Current income tax liabilities | | 13 | | | 567 | | | | 535 | |
Other tax liabilities | | 14 | | | 1,426 | | | | 887 | |
| | | | | | | | | | |
| | | | | 29,523 | | | | 26,246 | |
Non-current liabilities | | | | | | | | | | |
Provisions | | 18 | | | 693 | | | | 699 | |
Long-term debt | | 19 | | | 9,392 | | | | 7,314 | |
Long-term portion of finance lease obligations | | 20 | | | 990 | | | | 1,036 | |
Deferred income tax liabilities | | 13 | | | 32 | | | | 269 | |
| | | | | | | | | | |
| | | | | 11,107 | | | | 9,318 | |
| | | | | | | | | | |
Total liabilities | | | | | 40,630 | | | | 35,564 | |
| | | | | | | | | | |
Equity | | | | | | | | | | |
Share capital (Par value of €0.03,
50,000,000 shares authorized, issued & outstanding
as of March 31, 2011;
83,333,333 shares authorized & issued and
82,916,667 outstanding as of December 31, 2010) | | 21 | | | 1,500 | | | | 2,500 | |
Treasury shares | | 21 | | | — | | | | (750 | ) |
Translation reserves | | 21 | | | (6,953 | ) | | | (5,707 | ) |
Retained earnings | | 21 | | | 23,536 | | | | 26,406 | |
| | | | | | | | | | |
Equity attributable to controlling interest stockholders | | | | | 18,083 | | | | 22,449 | |
Non-controlling interests | | 21 | | | 1,441 | | | | 1,563 | |
| | | | | | | | | | |
Total equity | | | | | 19,524 | | | | 24,012 | |
| | | | | | | | | | |
TOTAL EQUITY AND LIABILITIES | | | | | 60,154 | | | | 59,576 | |
| | | | | | | | | | |
See accompanying notes to condensed consolidated financial statements.
F-46
UNAUDITED CONDENSED CONSOLIDATED STATEMENT OF CASH FLOWS
in Euro thousands, except shares and per share amounts
| | | | | | | | |
| | | Period ended March 31 | |
| | | 2011 | | | 2010 | |
Operating activities | | | | | | | | |
Cash receipts from customers | | | 48,532 | | | | 29,894 | |
Cash paid to suppliers | | | (43,658 | ) | | | (26,036 | ) |
Cash paid to employees | | | (3,031 | ) | | | (2,269 | ) |
Other operational payables and receivables | | | (1,330 | ) | | | (1,034 | ) |
| | | | | | | | |
Income tax paid | | | (364 | ) | | | (1,441 | ) |
| | | | | | | | |
Cash flows from operating activities | | | 149 | | | | (886 | ) |
| | | | | | | | |
Investing activities | | | | | | | | |
Cash received from: | | | | | | | | |
Interest received | | | 34 | | | | 21 | |
Cash paid for: | | | | | | | | |
Capitalized technology | | | (1,034 | ) | | | (1,683 | ) |
Acquisition of property and equipment | | | (204 | ) | | | (200 | ) |
| | | | | | | | |
Cash flows from investing activities | | | (1,204 | ) | | | (1,862 | ) |
| | | | | | | | |
Financing activities | | | | | | | | |
Loan received | | | 4,330 | | | | 2,794 | |
Loan repayments | | | (443 | ) | | | (108 | ) |
Interest paid | | | (229 | ) | | | (431 | ) |
Dividends paid | | | — | | | | (624 | ) |
Share capital reduction | | | (600 | ) | | | — | |
Acquisition of own shares | | | (2,785 | ) | | | — | |
| | | | | | | | |
Cash flows from financing activities | | | 273 | | | | 1,631 | |
| | | | | | | | |
Decrease in cash and cash equivalents | | | (782 | ) | | | (1,117 | ) |
| | | | | | | | |
Cash and cash equivalents at January 1 | | | 8,610 | | | | 5,667 | |
| | | | | | | | |
Effect of exchange rate fluctuations on cash held | | | (531 | ) | | | 600 | |
| | | | | | | | |
Cash and cash equivalents at March 31 | | | 7,297 | | | | 5,150 | |
| | | | | | | | |
See accompanying notes to condensed consolidated financial statements.
F-47
UNAUDITED CONDENSED CONSOLIDATED STATEMENT OF CHANGES IN EQUITY
YEAR ENDED DECEMBER 31, 2010 AND THE THREE MONTHS ENDED MARCH 31, 2011
in Euro thousands, except shares and per share amounts
| | | | | | | | | | | | | | | | | | | | | | | | | | | | |
| | | Share
capital | | | Treasury share
reserve | | | Translation
reserve | | | Retained
earnings | | | Total equity
attributable to
controlling
interests | | | Non-controlling
interests | | | Total equity | |
Balance at 31 December 2009 | | | 2,500 | | | | (750 | ) | | | (5,357 | ) | | | 16,477 | | | | 12,870 | | | | 1,139 | | | | 14,009 | |
| | | | | | | | | | | | | | | | | | | | | | | | | | | | |
Profit for the year | | | — | | | | — | | | | — | | | | 9,938 | | | | 9,938 | | | | 1,067 | | | | 11,005 | |
Foreign currency translation adjustment | | | — | | | | — | | | | (350 | ) | | | — | | | | (350 | ) | | | (19 | ) | | | (369 | ) |
Other changes | | | — | | | | — | | | | — | | | | (9 | ) | | | (9 | ) | | | — | | | | (9 | ) |
| | | | | | | | | | | | | | | | | | | | | | | | | | | | |
Total comprehensive income for the year | | | — | | | | — | | | | (350 | ) | | | 9,929 | | | | 9,579 | | | | 1,048 | | | | 10,627 | |
| | | | | | | | | | | | | | | | | | | | | | | | | | | | |
Dividends paid in 2010 | | | — | | | | — | | | | — | | | | — | | | | — | | | | (624 | ) | | | (624 | ) |
| | | | | | | | | | | | | | | | | | | | | | | | | | | | |
Balance at 31 December 2010 | | | 2,500 | | | | (750 | ) | | | (5,707 | ) | | | 26,406 | | | | 22,449 | | | | 1,563 | | | | 24,012 | |
| | | | | | | | | | | | | | | | | | | | | | | | | | | | |
Profit for the period | | | — | | | | — | | | | — | | | | 265 | | | | 265 | | | | (22 | ) | | | 243 | |
Foreign currency translation adjustment | | | — | | | | — | | | | (1,246 | ) | | | — | | | | (1,246 | ) | | | (86 | ) | | | (1,332 | ) |
Other changes | | | — | | | | — | | | | — | | | | — | | | | — | | | | — | | | | — | |
| | | | | | | | | | | | | | | | | | | | | | | | | | | | |
Total comprehensive income for the year | | | — | | | | — | | | | (1,246 | ) | | | 265 | | | | (981 | ) | | | (108 | ) | | | (1,089 | ) |
| | | | | | | | | | | | | | | | | | | | | | | | | | | | |
Treasury shares purchase | | | — | | | | (2,785 | ) | | | — | | | | — | | | | (2,785 | ) | | | — | | | | (2,785 | ) |
Share capital reduction | | | (1,000 | ) | | | 3,535 | | | | — | | | | (3,135 | ) | | | (600 | ) | | | — | | | | (600 | ) |
Other changes | | | — | | | | — | | | | — | | | | — | | | | — | | | | (14 | ) | | | (14 | ) |
| | | | | | | | | | | | | | | | | | | | | | | | | | | | |
Balance at 31 March 2011 | | | 1,500 | | | | — | | | | (6,953 | ) | | | 23,536 | | | | 18,083 | | | | 1,441 | | | | 19,524 | |
| | | | | | | | | | | | | | | | | | | | | | | | | | | | |
See accompanying notes to condensed consolidated financial statements.
F-48
NOTES TO THE UNAUDITED CONDENSED CONSOLIDATED FINANCIAL STATEMENTS
1. ORGANIZATION
Description of Business
Tim w.e., SGPS, S.A. (“we,” “us,” “our,” “the Group,” “Company”) is a global provider of mobile monetization solutions to carriers, brands, media companies and governments, providing mobile marketing, mobile entertainment and mobile money products and services through our proprietary technology platforms.
We are a global provider of mobile monetization solutions to carriers, brands, media companies and governments, providing mobile marketing, mobile entertainment and mobile money products and services through our proprietary technology platforms. We leverage our broad connections to mobile operators and their users, along with our in-depth knowledge of local markets, to facilitate the monetization and distribution of content that is tailored to local preferences.
Group Structure
Tim w.e., SGPS, S.A. is a company domiciled in Portugal. The condensed consolidated financial statements of the Group as at and for the three months period ended March 31, 2011 comprise the Group and its subsidiaries and the Group’s interest in associates and jointly controlled entities.
The condensed consolidated financial statements of the Group are presented in Euro (“€”), which is the functional currency of the Group.
At March 31, 2011, the Group had direct and indirect interests in the following subsidiaries:
| | | | | | | | | | |
| | | Headquarters | | % ownership at March 31, | |
| | | | 2011 | | | 2010 | |
The principal activity if the following company is to be the holding company for the group | |
Tim we SGPS, SA | | Portugal | | | 100.0 | % | | | 100.0 | % |
|
Subsidiaries: For each of the following subsidiaries, the principal activity is the delivery of mobile marketing, mobile entertainment and mobile money services | |
Tim we Angola | | Angola | | | 49.0 | % | | | 49.0 | % |
Total Tim Argentina, S.R.L. | | Argentina | | | 95.0 | % | | | 95.0 | % |
Tim We Argentina | | Argentina | | | 95.0 | % | | | 95.0 | % |
Mobile Int. LLC | | Azerbeijan | | | 99.0 | % | | | — | |
Tim We Bolivia, S.R.L. | | Bolivia | | | 98.0 | % | | | 98.0 | % |
Total Spin Serviços de Telecomunicações, Lda. | | Brazil | | | 100.0 | % | | | 100.0 | % |
Bookmark Agência de Publicidade, Ltda. | | Brazil | | | 100.0 | % | | | — | |
Brasiltec | | Brazil | | | 99.0 | % | | | 99.0 | % |
Total Tim Chile Telec., Lda. | | Chile | | | 99.9 | % | | | 99.9 | % |
Tim We Asia | | China | | | 100.0 | % | | | 100.0 | % |
Tim We WFOE | | China | | | 100.0 | % | | | 100.0 | % |
Tim We Columbia. Lda | | Colombia | | | 99.9 | % | | | 99.9 | % |
Total Tim we, S.A. | | Costa Rica | | | 100.0 | % | | | 100.0 | % |
Tim We Republica Dominicana | | Dominican Republic | | | 99.9 | % | | | 99.9 | % |
Tim We FZ LLC | | Dubai | | | 100.0 | % | | | 100.0 | % |
Tim We Ecuador, S.A. | | Ecuador | | | 99.9 | % | | | 99.9 | % |
Tim We El Salvador | | El Salvador | | | 99.9 | % | | | 99.9 | % |
F-49
| | | | | | | | | | |
| | | Headquarters | | % ownership at March 31, | |
| | | | 2011 | | | 2010 | |
Tim We France | | France | | | 100.0 | % | | | 100.0 | % |
Total TIM Georgia | | Georgia | | | 100.0 | % | | | 100.0 | % |
TIMWE Hellas Limited Liability Company | | Greece | | | 99.5 | % | | | 99.5 | % |
Tim We Guatemala | | Guatemala | | | 98.0 | % | | | 98.0 | % |
Tim We Honduras | | Honduras | | | 99.9 | % | | | 99.9 | % |
Tim We Iran | | Iran | | | 100.0 | % | | | — | |
Tim We Irlanda | | Ireland | | | 100.0 | % | | | 100.0 | % |
TIM we Telecom | | Kazakhstan | | | 100.0 | % | | | 100.0 | % |
TIM w.e. Kenya Ltd | | Kenya | | | 55.0 | % | | | — | |
TIM w.e. Kyrgyzstan | | Kyrgyzstan | | | 100.0 | % | | | — | |
Tim We Luxemburgo | | Luxembourg | | | 100.0 | % | | | 100.0 | % |
Tim w.e. Malasya | | Malasya | | | 100.0 | % | | | — | |
Tim We Mexico | | Mexico | | | 92.5 | % | | | 90.0 | % |
Total TIM SRL | | Morocco | | | 100.0 | % | | | — | |
Tim we Moçambique | | Mozambique | | | 90.0 | % | | | 90.0 | % |
Total Tim Moçambique | | Mozambique | | | 51.3 | % | | | 51.3 | % |
Tim We Nicaragua | | Nicaragua | | | 99.0 | % | | | 99.0 | % |
TIM w.e. Nigeria Ltd | | Nigeria | | | 55.0 | % | | | — | |
Total Tim Panamá, S.A. | | Panama | | | 100.0 | % | | | 100.0 | % |
Total Tim Paraguay, S.A. | | Paraguay | | | 99.0 | % | | | 99.0 | % |
Total Tim We Peru, S.A.C. | | Peru | | | 99.9 | % | | | 99.9 | % |
Tim We Poland | | Poland | | | 100.0 | % | | | 100.0 | % |
Tekmob, Unipessoal Lda | | Portugal | | | 100.0 | % | | | 100.0 | % |
Tim We, S.A. | | Portugal | | | 100.0 | % | | | 100.0 | % |
Total Tim, Lda | | Portugal | | | 100.0 | % | | | 100.0 | % |
Tim We ID | | Portugal | | | 100.0 | % | | | 100.0 | % |
Tim we Consult | | Portugal | | | 90.0 | % | | | 90.0 | % |
Total Spin SRL | | Romania | | | 100.0 | % | | | 100.0 | % |
Tim We Russia | | Russia | | | 100.0 | % | | | — | |
Tim We Arabia Saudita | | Saudi Arabia | | | 95.0 | % | | | 95.0 | % |
Tim we servia | | Serbia | | | 100.0 | % | | | 100.0 | % |
Tim We SAF | | South Africa | | | 100.0 | % | | | 100.0 | % |
Servicios Tecnologicos Tim, S.L. | | Spain | | | 100.0 | % | | | 100.0 | % |
Tim we—Servicios de Telecomunicaciones Moviles SL | | Spain | | | 100.0 | % | | | — | |
TIMWE Iletisim Hizmetleri Ticaret Limited Sirketi | | Turkey | | | 100.0 | % | | | 100.0 | % |
TIM we Telecom LTD | | Ukraine | | | 100.0 | % | | | 100.0 | % |
Tim We Uruguay, S.A. | | Uruguay | | | 100.0 | % | | | 100.0 | % |
Tim We LLC | | USA | | | 100.0 | % | | | 100.0 | % |
Total Tim Venezuela, C.A. | | Venezuela | | | 100.0 | % | | | 100.0 | % |
2. ACCOUNTING POLICIES
Statement of compliance
The accompanying condensed consolidated financial statements of Tim w.e., SGPS, S.A. and its subsidiaries have been prepared in accordance with International Accounting Standard 34 (“IAS 34”), “Interim Financial Reporting” issued by the IASB.
These unaudited condensed consolidated interim financial statements do not include all of the information required for full annual financial statements, and should be read in conjunction with the consolidated financial statements of the Group as at and for the years ended December 31, 2010, 2009 and 2008, which have been
F-50
prepared in accordance with IFRS, as issued by the IASB. The accounting policies used in the condensed financial statements are consistent with those followed in the preparation of the Group’s consolidated financial statements for the years ended December 31, 2010, 2009 and 2008.
These condensed consolidated interim financial statements were approved by the Board of Directors on July 15, 2011.
Basis of consolidation
The condensed consolidated financial statements include the accounts of the Group and its subsidiaries. All intercompany transactions, balances, income and expenses are eliminated on consolidation. All Group entities prepared their financial statements as at March 31.
All financial statements were prepared by applying the same Group accounting and valuation principles.
Uses of estimates and judgments
During the three months ended March 31, 2011, management reassessed its estimates with no significant effect on the condensed consolidated financial statements.
Revenue Recognition
The Group recognizes revenue when the amount of revenue can be measured reliably, service delivery has been performed, it is probable that the economic benefits will flow to the Group, costs incurred can be measured reliably and collectability is reasonably assured.
The Group generates revenues principally from the sale of a wide range of mobile applications and content to mobile end users. Our platform facilitates mobile marketing, including solutions to execute and monitor mobile marketing campaigns and mobile payment services. It also includes the sale and delivery of mobile entertainment applications and content (e.g., games, mobile music) to mobile handset users. Revenue is derived from data delivery to, and transactions executed by, mobile handset users, with revenues and cost of delivery recognized upon data transfer.
The Group utilizes mobile network operators’ channels to distribute content and to collect payment from our customers.
In return, the mobile network operators are entitled to commissions, which are a percentage of the gross fees collected from the Group’s customers.
The Group evaluates our agreements with mobile carriers to determine whether to recognize our revenues on a gross or net basis. Pursuant to applicable accounting standards, our determination is based upon an assessment of whether we act as a principal or agent in providing our services. With respect to most of these arrangements we act as a principal in providing our services and therefore recognize revenues on a gross basis in our consolidated income statement and recognize the commissions retained by mobile carriers as a cost of revenues. With respect to the remainder of these arrangements we act as an agent and recognize our revenues on a net basis in our consolidated income statement.
Where we recognize revenues on a gross basis, we do so generally in reliance on the following factors:
| | • | | We are the primary obligor in the sale and are responsible for providing the product or service ordered by the mobile handset user (end-user); |
| | • | | We have latitude in establishing prices within ranges prescribed by the mobile operators; |
F-51
| | • | | We determine the nature, type, characteristics and specifications of the products and services we will be rendering; |
| | • | | We have the ability to control the selection of our content suppliers; and, |
| | • | | We assume credit risk of non-payment for all amounts billed to the end-user customers related to our services. |
Mobile marketing
We generate mobile marketing revenues from clients who use our platform to create, execute and measure mobile marketing campaigns. Usage-based fees are earned based on the number of SMS messages a campaign generates. We recognize revenues when individual SMS messages are tracked within our technology platform, which interfaces with, and receives instant verifications from, the mobile carriers.
Performance-based fees are variable fees that are tied to the consumer response that a particular campaign generates for a client and calculated based on contract-specific metrics—such as the number of coupons redeemed or leads in a given month—for the specific clients. We recognize revenues from performance-based campaigns based on response data for each month, as calculated by our platform traffic reports.
Mobile marketing revenues also include fees charged to clients for professional services relating to the implementation, execution and monitoring of customized mobile marketing and advertising campaigns. Such fees are typically paid over a fixed period corresponding to the duration of the campaign. We recognize these fees based on the percentage of completion of the campaign. In order to reliably measure the level of services performed for each contract, we compare services performed to date as a percentage of total services to be performed as well as the proportion that costs incurred to date compared to the estimated total costs of the campaign.
Mobile entertainment
We generate mobile entertainment revenues from end users who use our platform to access mobile entertainment services. Our mobile entertainment revenues include weekly and monthly usage-based fees charged to end users for access to content libraries and other services.
Delivery of mobile entertainment services is recorded by data transfer reports generated by our IT platform, which interfaces with, and receives instant verifications from, the mobile network operators’ systems. The operators also send us monthly billing statement confirmations, which we use as a basis for invoicing and for the measurement of revenue. Since the Group does not receive collection statements from mobile operators until 30 to 60 days after our monthly cut-off date, we usually estimate revenues for the last month of the period, based on information as recorded on our IT platforms. These platforms record all transactions carried out with mobile operators and historically represent a reliable source of information to perform revenue estimates for our business.
By the time the Group reports our financial results, we receive substantially all the monthly collection statements from the mobile operators and have recognized revenues and sent invoices based on these monthly statements. In the event that a monthly statement is not received at a period-end, we will recognize revenue based on the data transfer reports generated by our IT platform. Fees that have been invoiced are recorded in trade receivables and fees that have not been invoiced as of the reporting date but on which all revenue recognition criteria are met are accrued and reported as unbilled trade receivables.
Given the nature of our business model, we have no deferred revenue, since revenue is earned and recognized immediately upon mobile data transfer.
Our mobile entertainment revenues also include fees for portal management, which are paid by mobile carriers for providing their mobile end users with carrier-specific access to entertainment content. These fees primarily
F-52
include periodic fees charged for maintenance of a digital portal along with fees derived from revenue-sharing agreements. Revenue is measured by the total number of downloads from the portal, and the Company earns a fixed percentage of the total revenues generated by each portal.
Mobile money
We provide mobile billing solutions to consumer-facing micropayment providers, who provide mobile payment options to their customers through our billing connections with mobile carriers. We offer connectivity and bulk SMS packages, serving mainly as a technology intermediary between the micropayment provider, the mobile carrier and mobile end user. We earn a percentage of the transaction value that we charge for facilitating the mobile payment.
In some circumstances, we provide both the content and micropayment solution to the end user. We provide end users access to virtual online games and applications. These services are provided by our platform and the connections we have with different mobile carriers. Revenues and costs are recognized at the moment we receive a request by SMS text from the end user to purchase the product, at which time content and service are also delivered.
3. REVENUES AND GEOGRAPHIC DATA
Revenue is detailed as follows:
| | | | | | | | |
In Euros (‘000) | |
| | | March 31, | |
Revenues | | 2011 | | | 2010 | |
Sales of tangible goods | | | 8 | | | | 465 | |
Services rendered | | | 47,376 | | | | 34,135 | |
| | | | | | | | |
| | | 47,384 | | | | 34,600 | |
| | | | | | | | |
Our business is seasonal, with revenues generally lowest in the first quarter of the year and gradually building in the second and third quarters of the year, prior to declining again toward the end of the year as a result of the termination of seasonal campaigns, cash conservation and reduced activity around the Christmas and New Year holidays, which tends to carry over into the subsequent year as a result of Carnival holidays in Brazil and the summer season throughout Latin America, our primary market.
During the period of three months ended March 31, 2011 and 2010, the Group operated and managed its business as a single segment. We primarily derive revenue from customers that are located in a single location, attributed based on the geographic location of the mobile operator. The following table provides revenue by geographic area:
| | | | | | | | |
In Euros (‘000) | |
| | | March 31, | |
Revenues | | 2011 | | | 2010 | |
Portugal | | | 1,378 | | | | 1,541 | |
Brazil | | | 14,126 | | | | 7,894 | |
Colombia | | | 5,166 | | | | 2,593 | |
All other international | | | 26,714 | | | | 22,572 | |
| | | | | | | | |
| | | 47,384 | | | | 34,600 | |
| | | | | | | | |
During the period of three months ended March 31, 2011 the Group generated €5.3 million of our revenues from the billing system of one mobile carrier (three month period ended March 31, 2010: €3.9 million). In 2010 there was no single external customer directly responsible for greater than 10 percent of the Group’s revenues in any of the years presented.
F-53
The group’s long-lived assets consist primarily of property and equipment, intangible assets and goodwill. They are attributed to the geographic location in which they are located. Long-lived assets by geographic area as of March 31, 2011 and 2010 are as follows:
| | | | | | | | |
In Euros (‘000) | |
| | | March 31, | |
Long-lived Assets | | 2011 | | | 2010 | |
Portugal | | | 8,952 | | | | 8,547 | |
Brazil | | | 1,622 | | | | 1,223 | |
All Other | | | 1,228 | | | | 1,609 | |
| | | | | | | | |
| | | 11,802 | | | | 11,379 | |
| | | | | | | | |
4. COST OF SERVICE DELIVERY
Cost of service delivery is detailed as follows:
| | | | | | | | |
In Euros (‘000) | |
| | | March 31, | |
Cost of service delivery | | 2011 | | | 2010 | |
Cost of sales | | | 15 | | | | 331 | |
Cost of services | | | 24,100 | | | | 18,467 | |
| | | | | | | | |
| | | 24,115 | | | | 18,798 | |
| | | | | | | | |
Costs of service delivery comprise the amount of revenue share paid to operators for their services in facilitating our sales, access to their customer base, delivery via their mobile networks and billing to end-user mobile handset customers. This also includes distribution costs to brokers in markets where there are no direct agreements with operators.
5. COMMERCIAL AND PRODUCTION COSTS
Commercial and production costs are detailed as follows:
| | | | | | | | |
In Euros (‘000) | |
| | | March 31, | |
Commercial and production costs | | 2011 | | | 2010 | |
Commercial costs | | | 13,104 | | | | 8,878 | |
Production costs | | | 3,112 | | | | 1,359 | |
| | | | | | | | |
| | | 16,216 | | | | 10,237 | |
| | | | | | | | |
Commercial and production costs are paid to third party vendors primarily to execute media campaigns, to facilitate our sales and to create content.
The Group incurs production costs for our sales and marketing campaigns, which include participation incentives for mobile end-users.
F-54
6. PERSONNEL COSTS
The Group had 377 employees, as of March 31, 2011, our employees are based primarily in Portugal.
Personnel costs were comprised of:
| | | | | | | | |
In Euros (‘000) | |
| | | March 31, | |
Personnel Costs | | 2011 | | | 2010 | |
Directors wages | | | 278 | | | | 176 | |
Personnel wages | | | 2,422 | | | | 2,173 | |
Remuneration charges | | | 399 | | | | 347 | |
Other expenses | | | 491 | | | | 223 | |
| | | | | | | | |
| | | 3,590 | | | | 2,919 | |
| | | | | | | | |
Capitalized development costs—wages | | | (728 | ) | | | (650 | ) |
| | | | | | | | |
| | | 2,862 | | | | 2,269 | |
| | | | | | | | |
Personnel costs are composed of primarily salaries and bonuses. The Group has not instituted any pension plans or share-based payments in any of the years presented. Capitalized development costs—wages are directly attributable salaries and bonuses for employees specifically dedicated to development projects that qualify for capitalization as an intangible asset.
7. GENERAL AND ADMINISTRATIVE
General and administrative expenses are detailed as follows:
| | | | | | | | |
In Euros (‘000) | |
| | | March 31, | |
General and Administrative | | 2011 | | | 2010 | |
Travel | | | 626 | | | | 548 | |
Fees | | | 698 | | | | 511 | |
Rent | | | 48 | | | | 48 | |
Office Expenses | | | 469 | | | | 292 | |
Communications | | | 132 | | | | 125 | |
IT Expenses | | | 90 | | | | 107 | |
| | | | | | | | |
| | | 2,063 | | | | 1,631 | |
| | | | | | | | |
8. TAX EXPENSES
Tax expenses for the three month period ended March 31, 2011 were €0.3 million (March 31, 2010: €0.4 million). These expenses are federal taxes and social contributions levied on company operating margin by Latin American countries where we have significant sales operations.
F-55
9. FINANCE INCOME AND FINANCE COST
Finance income comprised of the following:
| | | | | | | | |
In Euros (‘000) | |
| | | March 31, | |
Finance income | | 2011 | | | 2010 | |
Interest income—third parties | | | 24 | | | | 20 | |
Foreign currency translation differences | | | 74 | | | | 293 | |
Other finance income | | | 10 | | | | 1 | |
| | | | | | | | |
| | | 108 | | | | 314 | |
| | | | | | | | |
Finance costs comprised of the following:
| | | | | | | | |
In Euros (‘000) | |
| | | March 31, | |
Finance costs | | 2011 | | | 2010 | |
Interest expense | | | (127 | ) | | | (111 | ) |
Foreign currency translation differences | | | (193 | ) | | | (10 | ) |
Other finance costs | | | (103 | ) | | | (319 | ) |
| | | | | | | | |
| | | (423 | ) | | | (440 | ) |
| | | | | | | | |
Foreign currency translation differences are primarily gains or losses on invoices sent in a functional currency that differs from the Euro.
10. CASH AND CASH EQUIVALENTS
Cash and cash equivalents of the Group are mainly denominated in Euros and U.S. dollars. Cash and cash equivalents comprise of the following:
| | | | | | | | |
In Euros (‘000) | |
| | | March 31, | | | December 31, | |
Cash and cash equivalents | | 2011 | | | 2010 | |
Petty cash | | | | | | | | |
Cash | | | 25 | | | | 81 | |
| | | | | | | | |
Bank deposits | | | | | | | | |
Current deposits | | | 5,810 | | | | 7,446 | |
Short-term deposits | | | 1,462 | | | | 1,083 | |
| | | | | | | | |
| | | 7,272 | | | | 8,529 | |
| | | | | | | | |
| | | 7,297 | | | | 8,610 | |
| | | | | | | | |
Cash and cash equivalents include time deposits with original maturities of 90 days or less.
F-56
11. TRADE RECEIVABLES
Trade receivables comprise of the following:
| | | | | | | | |
In Euros (‘000) | |
| | | March 31, | | | December 31, | |
Trade receivables | | 2011 | | | 2010 | |
Trade debtors | | | 12,020 | | | | 11,499 | |
Unbilled Revenue | | | 12,428 | | | | 14,056 | |
Allowance for doubtful accounts | | | (164 | ) | | | (124 | ) |
| | | | | | | | |
| | | 24,284 | | | | 25,431 | |
| | | | | | | | |
Unbilled receivables are a result of the timing of the Group’s invoices. The Group invoices based on end-user download, subscription and usage reports received from mobile operators. The Group receives these reports up to two months after the subscription and content delivery. The Group records revenue when earned, but bills with a time lag, which results in unbilled receivables.
Changes in the allowance for doubtful accounts during the three month period ended March 31, 2011 and the year ended December 31, 2010 were as follows:
| | | | | | | | |
In Euros (‘000) | |
| | | March 31, | | | December 31, | |
| | | 2011 | | | 2010 | |
Beginning balance | | | 124 | | | | 117 | |
Additions | | | 43 | | | | — | |
Foreign exchange differences | | | (3 | ) | | | 7 | |
| | | | | | | | |
Final balance | | | 164 | | | | 124 | |
| | | | | | | | |
12. PREPAID EXPENSES AND OTHER ASSETS
This caption relates to advanced payments to suppliers, other prepaid expenses and other receivables.
| | | | | | | | |
In Euros (‘000) | |
| | | March 31, | | | December 31, | |
Prepaid expenses and other assets | | 2011 | | | 2010 | |
Advanced payments to suppliers | | | 1,788 | | | | 1,758 | |
Deferred costs | | | 2,845 | | | | 904 | |
Other debtors | | | 952 | | | | 576 | |
| | | | | | | | |
| | | 5,585 | | | | 3,238 | |
| | | | | | | | |
13. TAXATION
The income tax in the statement of income included in the period of three months ended March 31, 2011 has a benefit of €0.2 million.
Income tax is recognised based on management’s best estimate of the weighted average annual income tax rate expected for the full financial year applied to the pre-tax income of the interim period. The gain recognized in the three months period ended March 31, 2011, relates to income tax assets in some subsidiaries having losses in the quarter, which have a higher income tax rate than the Group’s weighted average. Those tax losses are expected to be recovered.
F-57
In certain jurisdictions, the Group is required to prepay corporate income taxes and subsequently reverses any prepaid amounts upon the actual filing.
The current and deferred capitalization issue is detailed as follows:
| | | | | | | | | | | | | | | | |
In Euros (‘000) | |
| | | Assets | | | Liabilities | |
| | | March 31, | | | December 31, | | | March 31, | | | December 31, | |
Current income tax | | 2011 | | | 2010 | | | 2011 | | | 2010 | |
Current income tax | | | 2,932 | | | | 3,280 | | | | 567 | | | | 535 | |
Deferred income tax | | | 2,894 | | | | 2,119 | | | | 32 | | | | 269 | |
| | | | | | | | | | | | | | | | |
| | | 5,826 | | | | 5,399 | | | | 599 | | | | 804 | |
| | | | | | | | | | | | | | | | |
14. OTHER TAX ASSETS AND LIABILITIES
The Group also records in the statement of financial position value added tax and other taxes as a result of timing differences for tax payments.
Other tax assets
| | | | | | | | |
In Euros (‘000) | |
| | | March 31, | | | December 31, | |
Prepaid and other indirect taxes | | 2011 | | | 2010 | |
Value added tax and other local taxes | | | 3,194 | | | | 3,228 | |
Withholding retention tax | | | 1,693 | | | | 1,225 | |
Others | | | 292 | | | | 194 | |
| | | | | | | | |
| | | 5,179 | | | | 4,647 | |
| | | | | | | | |
Value added taxes and other local taxes are amounts that the Group is entitled to recover as a result of tax payment for services received from third party vendors that exceed tax payments for services delivered to the Group’s customers. These amounts will vary depending on the flow of services delivered and received within specific countries. Other taxes are comprised of withholdings on intercompany sales that may be utilized for future tax payments.
Other tax liabilities
| | | | | | | | |
In Euros (‘000) | |
| | | March 31, | | | December 31, | |
Other tax liabilities | | 2011 | | | 2010 | |
Value added tax | | | 436 | | | | 175 | |
Other taxes | | | 990 | | | | 712 | |
| | | | | | | | |
| | | 1,426 | | | | 887 | |
| | | | | | | | |
The Group accrues for amounts paid for corporate income taxes based on expected profits in specific tax jurisdictions. Value added taxes and other local taxes are amounts that the Group must pay as a result of required tax payments for services delivered to the Group’s customers that exceed tax payment for services received from third party vendors. Other taxes are primarily social security tax payments the Group collects from employees and must remit to the relevant tax authorities.
F-58
15. CAPITALIZED TECHNOLOGY AND OTHER INTANGIBLE ASSETS
During the three months ended March 31, 2011 the Group recognized internally capitalized assets amounting to €0.728 million on the development of new features on our proprietary mobile delivery and customer support platforms. During the same period it incurred amortizations of €1 million, related to the intangible assets.
16. ACCOUNTS PAYABLE
Accounts payable includes:
| | | | | | | | |
In Euros (‘000) | |
| | | March 31, | | | December 31, | |
AP and other current liabilities | | 2011 | | | 2010 | |
Trade accounts payable | | | 7,897 | | | | 11,842 | |
Accrued liabilities (current) | | | 11,697 | | | | 7,795 | |
Other liabilities | | | 1,479 | | | | 447 | |
| | | | | | | | |
| | | 21,073 | | | | 20,084 | |
| | | | | | | | |
Aside from trade accounts payable to suppliers for normal operations, the Group accrued current liabilities related to accrued salaries, vacation pay and bonuses.
17. LIABILITIES RELATED TO FACTORING OPERATIONS
| | | | | | | | |
In Euros (‘000) | |
| | | March 31, | | | December 31, | |
| | | 2011 | | | 2010 | |
Liabilities related to factoring operations | | | 1,244 | | | | 1,181 | |
| | | | | | | | |
| | | 1,244 | | | | 1,181 | |
| | | | | | | | |
The Group has factoring operations of trade receivables for specifically-identified customers to unrelated third-party banks, with recourse. These arrangements stipulate the transfer of all rights of the cash flows of the receivables to the bank. The Group passes all servicing responsibilities and credit risk of these receivables to the bank, which notifies the customer associated with the receivable in writing to remit payment to the bank and not to Tim w.e. However, the Group retains the risk associated with any unpaid invoices, including any late payment interest owed to the bank, until the customer pays their invoice. The interest rate for any delay in payment is Euribor 3 months plus a 1% spread.
We have determined that these transfers do not qualify for desrecognition because the Group has retained substantially all the risks of ownership for the receivables. The Group continues to recognize the receivables in our statement of financial position. The Group also recognizes a financial liability related to the factoring operations and considers the transfers as a secured borrowing with the pledge of receivables as collateral. The expenses are included in Financial Expenses on the Statement of Comprehensive Income.
These facilities contain customary affirmative and negative covenants as well as specific provisions related to the quality of the accounts receivables transferred. The banks have the right to cancel the factoring facility if these covenants are not met, at which time all outstanding debt would be payable by the group on demand. As of March 31, 2011, there were €1.2 million in secured borrowings under the facility.
F-59
18. PROVISIONS
Provisions are as follows:
| | | | | | | | |
In Euros (‘000) | |
| | | March 31, | | | December 31, | |
Provisions | | 2011 | | | 2010 | |
Provisions for legal and labor contingencies | | | 162 | | | | 162 | |
Provisions for other risks | | | 531 | | | | 537 | |
| | | | | | | | |
| | | 693 | | | | 699 | |
| | | | | | | | |
19. LOANS AND BORROWINGS
Details of long-term debt and short-term financing by facility are as follows:
| | | | | | | | | | | | | | | | | | |
| In Euros (‘000) | | | | | | As of March 31, | | | As of December 31, | | | |
| | | | | | | 2011 | | | 2010 | | | |
Bank | | Debt Outstanding | | Date of
Maturity | | Total
Facility | | | Amount
Outstanding | | | Amount
Outstanding | | | Covenants |
BBVA | | Bank loans 3 month Euribor + 1.50% | | November/12 | | | 2,000 | | | | 1,412 | | | | 1,609 | | | • Comply with the payment of all taxes, including Social Security payments • The Borrower shall not Sell, transfer or otherwise dispose more than 20% of its assets without the express consent of the Lenders • Financial Statements: It will send to the bank a copy of its financial statements not later than 120 days after the end of the financial period to which they are related • Ensure that its obligations under the Finance Documents will at all times rank at least pari passu with all other present and future unsecured and unsubordinated indebtedness, save for indebtedness preferred by law or as otherwise agreed by the Lenders |
| | | | | | |
Banco BPI | | Bank loan 3 month Euribor + 2.00% | | November/14 | | | 500 | | | | 500 | | | | 500 | | | • Ensure that the ratio Equity/Total Net Asset ratio is greater than 20% • Ensure that from TIMwe, SGPS, S.A. the Net Debt/EBITDA ratio does not exceed 2.5 and that the ratio (Equity + Shareholders Loans)/(Total Net Asset) ratio is greater than 20% |
| | | | | | |
Banco Popular | | Bank loan 3 month Euribor + 2.50% | | October/13 | | | 1,250 | | | | 883 | | | | 952 | | | • Comply with the payment of all taxes, including Social Security payments • Notify the Agent of any possibility of Event of Default • Provide details of any financial statements documentation required by the lender |
F-60
| | | | | | | | | | | | | | | | | | |
| In Euros (‘000) | | | | | | As of March 31, | | | As of December 31, | | | |
| | | | | | | 2011 | | | 2010 | | | |
Bank | | Debt Outstanding | | Date of
Maturity | | Total
Facility | | | Amount
Outstanding | | | Amount
Outstanding | | | Covenants |
Barclays Bank | | 3 month Euribor + 1.80% bank loan | | October/12 | | | 2,000 | | | | 1,076 | | | | 1,241 | | | • Comply with the payment of all taxes, including Social Security payments • Ensure that the Net Debt/EBITDA ratio does not exceed 2.5 • Failure to Pay: The Borrower fails to pay any sum due • Ensure that its obligations under the Finance Documents will at all times rank at least pari passu with all other present and future unsecured and unsubordinated indebtedness, save for indebtedness preferred by law or as otherwise agreed by the Lenders |
| | | | | | |
Banco Santander | | 3 month Euribor + 1.80% bank loan | | November/12 | | | 1,500 | | | | 1,000 | | | | 1,000 | | | • Failure to Pay: The Borrower fails to pay any sum payable by it under this agreement . Cross Default • Inhability to pay debts: The Borrower is over-indebted or is unable to pay is debts as they fall due • Provide details of any material litigation, arbitration or administrative proceedings that limits the borrowers access to their own assets • Comply with the payment of all taxes, including Social Security payments |
| | | | | | |
Banco BPI | | Commercial paper 12 month Euribor + 2.4% | | September/13 | | | 7,000 | | | | 3,000 | | | | — | | | • Ensure that in TIMwe, SGPS, SA the ratio (Equity + Shareholders Loans)/(Total Net Asset- Liquid Assets) ratio is equal or greater than 20% • Ensure that in TIMwe, SGPS, SA the Net Debt/EBITDA ratio does not exceed 2.5 • Failure to Pay: The Borrower fails to pay any sum payable by it under this agreement • Ownership Clause: the current stockholders must keep a higher than 50.1% Equity stake in the company • Comply with the payment of all taxes, including Social Security payments |
F-61
| | | | | | | | | | | | | | | | | | |
| In Euros (‘000) | | | | | | As of March 31, | | | As of December 31, | | | |
| | | | | | | 2011 | | | 2010 | | | |
Bank | | Debt Outstanding | | Date of
Maturity | | Total
Facility | | | Amount
Outstanding | | | Amount
Outstanding | | | Covenants |
Barclays Bank | | Commercial paper 12 month Euribor + 1.75% | | March/14 | | | 2,000 | | | | — | | | | — | | | • Ownership Clause: the current stockholders must keep a higher than 51% Equity stake in the company • Ensure that its obligations under the Finance Documents will at all times rank at least pari passu with all other present and future unsecured and unsubordinated indebtedness, save for indebtedness preferred by law or as otherwise agreed by the Lenders • Provide details of any material litigation, arbitration or administrative proceedings that limits the borrowers access to their own assets • Comply with the payment of all taxes, including Social Security payments |
| | | | | | |
Barclays Bank | | Overdraft program 3 month Euribor + 1.75% | | renew every 12 months | | | 1,000 | | | | 911 | | | | — | | | • Comply with the payment of all taxes, including Social Security payments • Ownership Clause: the current stockholders must keep a higher than 51% Equity stake in the company • Ensure that its obligations under the Finance Documents will at all times rank at least pari passu with all other present and future unsecured and unsubordinated indebtedness, save for indebtedness preferred by law or as otherwise agreed by the Lenders • Inability to pay debts: The Borrower is over-indebted or is unable to pay is debts as |
| | | | | | |
Banco BPI | | Overdraft program 1 month Euribor + 3.00% | | renew every 3 months | | | 3,000 | | | | 398 | | | | — | | | • Ownership Clause |
| | | | | | |
Banco Santander
Rio | | Overdraft program effective month interest of 1,48% | | renew monthly | | | 100 | | | | 17 | | | | — | | | • Inability to pay debts: The Borrower is over-indebted or is unable to pay is debts as under the agreement • Comply with the payment of all taxes . Failure to Pay: The Borrower fails to pay any sum payable by it under this agreement |
F-62
| | | | | | | | | | | | | | | | | | |
| In Euros (‘000) | | | | | | As of March 31, | | | As of December 31, | | | |
| | | | | | | 2011 | | | 2010 | | | |
Bank | | Debt Outstanding | | Date of
Maturity | | Total
Facility | | | Amount
Outstanding | | | Amount
Outstanding | | | Covenants |
Banco BPI | | Guaranteed loans 3 month Euribor + 2.75% | | September/16 | | | 2,000 | | | | 2,000 | | | | 2,000 | | | • Ensure that its obligations under the Finance Documents will at all times rank at least pari passu with all other present and future unsecured and unsubordinated indebtedness, save for indebtedness preferred by law or as otherwise agreed by the Lenders Negative Pledge: it will not without the the prior written approval of the Bank create or agree to create or permit to subsist any security interest on or over the whole or any part of its undertaking, assets or revenues (present or future) • Ensure that in TIMwe, SGPS, SA the ratio (Equity + Shareholders Loans)/(Total Net Asset- Liquid Assets) ratio is equal or greater than 20% • Ensure that in TIMwe, SGPS, SA the Net Debt/EBITDA ratio does not exceed 2.5 • Financial Statements: It will send to the bank a copy of its financial statements not later than 180 days after the end of the financial period to which they are related. • Comply with the payment of all taxes, including Social Security payments • Cross Default • Maintenance of a minimum of €5.000.000 of supplementary Capital |
| | | | | | |
Banco BPI | | Guaranteed loan 3 month Euribor + 1.75% | | June/16 | | | 1,500 | | | | 1,500 | | | | 1,500 | | | • Ensure that its obligations under the Finance Documents will at all times rank at least pari passu with all other present and future unsecured and unsubordinated indebtedness, save for indebtedness preferred by law or as otherwise agreed by the Lenders Negative Pledge: it will not without the the prior written approval of the Bank create or agree to create or permit to subsist any security interest on or over the whole or any part of its undertaking, assets or revenues (present or future) • Ensure that the ratio (Equity + Shareholders Loans)/(Total Net Asset-Liquid Assets) ratio is greater than 20% • Ensure that the Net Debt/EBITDA ratio from TIMwe, SGPS, S.A. does not exceed 2.5 • Financial Statements: It will send to the bank a copy of its financial statements not later than 180 days after the end of the financial period to which they are related. • Comply with the payment of all taxes, including Social Security payments • Cross Default |
F-63
| | | | | | | | | | | | | | | | | | |
| In Euros (‘000) | | | | | | As of March 31, | | | As of December 31, | | | |
| | | | | | | 2011 | | | 2010 | | | |
Bank | | Debt Outstanding | | Date of
Maturity | | Total
Facility | | | Amount
Outstanding | | | Amount
Outstanding | | | Covenants |
Banco BPI | | Guaranteed loan 3 month Euribor + 1.00% | | November/14 | | | 1,000 | | | | 1,000 | | | | 1,000 | | | Negative Pledge: it will not without the the prior written approval of the Bank create or agree to create or permit to subsist any security interest on or over the whole or any part of its undertaking, assets or revenues (present or future) • Ensure that its obligations under the Finance Documents will at all times rank at least pari passu with all other present and future unsecured and unsubordinated indebtedness, save for indebtedness preferred by law or as otherwise agreed by the Lenders • Comply with the payment of all taxes, including Social Security payments • Financial Statements: It will send to the bank a copy of its financial statements not later than 180 days after the end of the financial period to which they are related. From the Borrower • Ensure that the ratio Equity /Total Net Asset ratio is greater than 20% From TIMwe, SGPS, SA • Ensure that the ratio Equity /Total Net Asset ratio is greater than 20% • Ensure that the Net Debt/EBITDA ratio does not exceed 2.5 • Cross Default |
| | | | | | |
| Banco Espirito Santo | | Other loans 3 month Euribor + 1.50% | | October 2011 - December 2011 | | | 124 | | | | 27 | | | | 33 | | | • Failure to Pay: The Borrower fails to pay any sum payable by it under this agreement |
| | | | | | | | | | | | | | | | | | |
| | | | | | | 24,974 | | | | 13,724 | | | | 9,835 | | | |
| | | | | | | | | | | | | | | | | | |
| | Current portion | | | | | | | | | 4,332 | | | | 2,521 | | | |
| | Non-current portion | | | | | | | | | 9,392 | | | | 7,314 | | | |
| | | | | | | | | | | | | | | | | | |
| | | | | | | | | | | 13,724 | | | | 9,835 | | | |
| | | | | | | | | | | | | | | | | | |
20. LEASES
Finance leases relate to hardware for administrative and operating purposes with various technology vendors.
As at March 31, 2011 and December 31, 2010, the Group’s obligations are:
| | | | | | | | | | | | | | | | | | | | | | | | |
| In Euros (‘000) | |
| | | March 31, 2011 | | | December 31, 2010 | |
Leases | | Amount | | | Interest | | | Rent | | | Amount | | | Interest | | | Rent | |
Less than 1 year | | | 881 | | | | 53 | | | | 934 | | | | 1,038 | | | | 73 | | | | 1,111 | |
Between 1 and 5 years | | | 990 | | | | 40 | | | | 1,030 | | | | 1,036 | | | | 44 | | | | 1,080 | |
| | | | | | | | | | | | | | | | | | | | | | | | |
Total | | | 1,871 | | | | 93 | | | | 1,964 | | | | 2,074 | | | | 117 | | | | 2,191 | |
| | | | | | | | | | | | | | | | | | | | | | | | |
F-64
The Group leases vehicles and office space under non-cancelable leases that expire at various dates through 2014.
21. EQUITY
The Group’s equity is comprised of:
| | | | | | | | |
| In Euros (‘000) | |
| | | March 31, | | | December 31, | |
| | | 2011 | | | 2010 | |
Share capital | | | 1,500 | | | | 2,500 | |
Treasury share reserve | | | — | | | | (750 | ) |
Translation reserve | | | (6,953 | ) | | | (5,707 | ) |
Retained earnings | | | 23,536 | | | | 26,406 | |
| | | | | | | | |
Total equity attributable to controlling interests | | | 18,083 | | | | 22,449 | |
| | | | | | | | |
Non-controlling interests | | | 1,441 | | | | 1,563 | |
| | | | | | | | |
Total equity | | | 19,524 | | | | 24,012 | |
| | | | | | | | |
The Group’s shares are comprised of:
| | | | | | | | |
| | | Number of
shares | | | Amount in
Euros | |
Issued and fully paid: | | | | | | | | |
Common shares of €5.00 each At January 1, 2011 | | | 500,000 | | | | 2,500,000 | |
| | | | | | | | |
| | |
During the period: | | | | | | | | |
February 2011 Share split €5.00 to €0.50 each | | | 4,500,000 | | | | — | |
February 23, 2011 Share capital reduction | | | (2,000,000 | ) | | | (1,000,000 | ) |
| | | | | | | | |
Common shares of €0.50 each At March 31, 2011 | | | 3,000,000 | | | | 1,500,000 | |
| | | | | | | | |
| | |
During subsequent events: | | | | | | | | |
April 2011 Share split €0.50 to €0.05 each | | | 27,000,000 | | | | — | |
July 2011 Share split €0.05 to €0.03 each | | | 20,000,000 | | | | — | |
| | | | | | | | |
Common shares after subsequent events | | | 50,000,000 | | | | 1,500,000 | |
| | | | | | | | |
During a shareholders meeting held on May 17, 2010, a stock repurchase program was authorized, including the repurchase of 57,500 shares of the Group’s common stock. The repurchase occurred during 2011.
Between January 19, 2011 and February 2, 2011 the Company, pursuant to separate, individual negotiations with three of its minority shareholders, purchased an aggregate of 77,500 shares from such shareholders for a total consideration of €2.78 million. The purchased shares were recorded as treasury stock and the transactions had the effect of increasing the amount of the Company’s treasury stock from 0.5% to 16.0% of its total share capital.
Under Portuguese law, the Company’s total treasury stock may not exceed 10% of its total share capital. Therefore, on February 23, 2011 the shareholders of the Company agreed (i) to effect a stock split pursuant to which the total share capital of the Company increased from 500 thousand to 5 million shares and (ii) to subsequently reduce the Company’s share capital in February 23, 2011 by an aggregate of 2 million shares, 800 thousand of which were treasury shares, which were retired in order to satisfy the Portuguese legal threshold concerning treasury stock.
F-65
As of February 23, 2011, share capital comprised of 3,000,000 shares authorized, issued and outstanding at a par value of €0.50 each.
On April 18, 2011 the shares increased by a share split from 3,000,000 shares to 30,000,000 shares. On July 14, 2011 the shares increased by a share split from 30,000,000 shares to 50,000,000 shares.
Considering that certain of the share splits occurred post balance sheet, the shares outstanding and earnings per share have been retroactively adjusted to reflect the stock splits. The shares outstanding were not retroactively adjusted to reflect the share capital reduction given that there was a change in the Company’s resources arising in connection with such reduction, which results in the Company’s weighted average number of shares outstanding during the period (65,319,445) exceeding the shares outstanding as of July 15, 2011 (50,000,000), the date these financial statements were prepared.
The Group’s earnings per share are comprised of:
| | | | | | | | |
| | | March 31, | |
| | | 2011 | | | 2010 | |
Profit attributable to controlling interests (in thousands Euros) | | | 265 | | | | 211 | |
| | | | | | | | |
Weighted-average shares used to compute earnings per share
(number of shares in thousands) | | | 65,319 | | | | 82,917 | |
| | | | | | | | |
Earning per share—basic (in Euros) | | | 0.00 | | | | 0.00 | |
Earning per share—diluted (in Euros) | | | 0.00 | | | | 0.00 | |
| | | | | | | | |
The Group’s non-controlling interests comprised of:
| | | | | | | | |
| In Euros (‘000) | |
| | | March 31, | | | December 31, | |
Non-controlling interests | | 2011 | | | 2010 | |
Brasiltec | | | 928 | | | | 970 | |
Tim w.e. Angola | | | 351 | | | | 432 | |
Other Companies | | | 162 | | | | 161 | |
| | | | | | | | |
Total Non-controlling interests | | | 1,441 | | | | 1,563 | |
| | | | | | | | |
22. RELATED PARTIES
The Group did not enter into any material transactions with related parties for the periods presented. As of March 31, 2011, there are amounts €0.6 million due to shareholders regarding the share capital reduction.
23. EVENTS AFTER THE REPORTING PERIOD
Management evaluated all subsequent events that occurred after the date of the statement of financial position and through the date the financial statements were authorized for issue on July 15, 2011.
On April 18, 2011, the shareholders meeting approved the change of the number of shares from 3,000,000 to 30,000,000 changing also the par value from €0.50 to €0.05. In conjunction with this decision, it was approved the change of the Corporate Governance structure adopting an Audit Committee and the possibility to adopt an Executive Committee as part of the Board of Directors, was approved.
On July 14, 2011 the shareholders meeting approved the change of the number of shares from 30,000,000 shares to 50,000,000 shares changing also the par value from €0.05 to €0.03.
F-66
TIM W.E. SGPS, S.A.
Common Shares
Prospectus
Global Coordinators and Joint Bookrunners
Credit Suisse
Citigroup
Co-Lead Managers
Needham & Company, LLC
Pacific Crest Securities
Piper Jaffray
Santander
ThinkEquity LLC
, 2011.
Until , 2011, all dealers that buy, sell or trade in our common shares, whether or not participating in this offering, may be required to deliver a prospectus.This is in addition to the dealers’ obligation to deliver a prospectus when acting as underwriters and with respect to their unsold allotments or subscriptions.
Part II
Information not required in the prospectus
| Item 6. | Indemnification of directors and officers |
Under Portuguese law, when a director or officer acts within the scope of his or her authority, the corporation is responsible for any resulting liabilities or expenses.
| Item 7. | Recent sales of unregistered securities |
None.
| | (a) | The following documents are filed as part of this Registration Statement: |
| | |
1.1 | | Form of Underwriting Agreement* |
3.1 | | Bylaws |
4.1 | | Specimen certificate evidencing common shares |
5.1 | | Opinion of CCA Advogados as to the validity of the common shares |
8.1 | | Opinion of CCA Advogados as to Portuguese tax matters (included in Exhibit 5.1) |
8.2 | | Opinion of Davis Polk & Wardwell LLP as to U.S. tax matters |
10.1 | | Mobile Carrier Agreement—Vivo (Brazil) (English translation) |
10.2 | | Datacenter Agreement—Mainroad Information Technology (English translation) |
21.1 | | List of Subsidiaries |
23.1 | | Consent of KPMG & Associados—Sociedade de Revisores Oficiais de Contas, S.A. |
23.2 | | Consent of CCA Advogados (included in Exhibit 5.1) |
23.3 | | Consent of Davis Polk & Wardwell LLP (included in Exhibit 8.2) |
24.1 | | Powers of Attorney (included on signature page) |
99.1 | | TIM w.e. SGPS, S.A. Code of Ethics |
| * | To be filed by amendment. |
| | (b) | Financial statement schedules |
None.
| | (a) | The undersigned registrant hereby undertakes to provide to the underwriters at the closing specified in the underwriting agreements, certificates in such denominations and registered in such names as required by the underwriters to permit prompt delivery to each purchaser. |
| | (b) | Insofar as indemnification for liabilities arising under the Securities Act may be permitted to directors, officers and controlling persons of the registrant pursuant to the provisions referenced in Item 6 of this Registration Statement, or otherwise, the registrant has been advised that in the opinion of the U.S. Securities and Exchange Commission such indemnification is against public policy as expressed in the Act and is, therefore, unenforceable. In the event that a claim for indemnification against such liabilities (other than the payment by the registrant of expenses incurred or paid by a director, officer, or controlling person of the registrant in the successful defense of any action, suit or proceeding) is asserted by such director, officer or controlling person in connection with the securities being registered hereunder, the registrant will, unless in the opinion of its counsel the matter has been settled by controlling precedent, submit to a court of appropriate jurisdiction the question of whether such indemnification by it is against public policy as expressed in the Act and will be governed by the final adjudication of such issue. |
II-1
| | (c) | The undersigned registrant hereby undertakes that: |
| | (1) | For purposes of determining any liability under the Securities Act, the information omitted from the form of prospectus filed as part of this Registration Statement in reliance upon Rule 430A and contained in a form of prospectus filed by the Registrant pursuant to Rule 424(b)(1) or (4) or 497(h) under the Securities Act shall be deemed to be part of this Registration Statement as of the time it was declared effective. |
| | (2) | For the purpose of determining any liability under the Securities Act, each post-effective amendment that contains a form of prospectus shall be deemed to be a new Registration Statement relating to the securities offered therein, and the offering of such securities at that time shall be deemed to be the initial bona fide offering thereof. |
II-2
SIGNATURES
Pursuant to the requirements of the Securities Act of 1933, the Registrant certifies that it has reasonable grounds to believe that it meets all of the requirements for filing on Form F-1 and has duly caused this Registration Statement to be signed on its behalf by the undersigned, thereunto duly authorized, in Lisbon, Portugal, on July 28, 2011.
| | | | |
TIM w.e. SGPS, S.A. |
| |
By: | | /S/ DIOGO AHRENS TEIXEIRA SALVI |
| | Name: | | Diogo Ahrens Teixeira Salvi |
| | Title: | | Chief Executive Officer |
KNOW ALL BY THESE PRESENTS, that each person whose signature appears below constitutes and appoints Diogo Ahrens Teixeira Salvi and António Rafael de Brito Fouto, and each of them, as his true and lawful attorneys-in-fact and agents, each with the full power of substitution, for him and in his name, place or stead, in any and all capacities, to sign any and all amendments to this registration statement (including post-effective amendments), and to sign any registration statement for the same offering covered by this registration statement that is to be effective upon filing pursuant to Rule 462(b) promulgated under the Securities Act, and all post-effective amendments thereto, and to file the same, with exhibits thereto and other documents in connection therewith, with the Securities and Exchange Commission, granting unto said attorneys-in-fact and agents, and each of them, full power and authority to do and perform each and every act and thing requisite and necessary to be done in and about the premises, as fully to all intents and purposes as he might or could do in person, hereby ratifying and confirming all that said attorneys-in-fact and agents, or their or his substitute or substitutes, may lawfully do or cause to be done by virtue hereof.
Pursuant to the requirements of the Securities Act of 1933, this Registration Statement has been signed by the following persons in the capacities and on the dates indicated.
| | | | |
Signature | | Title | | Date |
| | |
/S/ DIOGO AHRENS TEIXEIRA SALVI Diogo Ahrens Teixeira Salvi | | CEO and Director (Principal Executive Officer) | | July 28, 2011 |
| | |
/S/ ANTÓNIO RAFAELDE BRITO FOUTO António Rafael de Brito Fouto | | Chief Financial Officer and Director (Principal Financial and Accounting Officer) | | July 28, 2011 |
| | |
/S/ RICARDO MANUEL BRÁS CALÇADO CARVALHO Ricardo Manuel Brás Calçado Carvalho | | Director | | July 28, 2011 |
| | |
/S/ PAULO JORGE PASSOS SALGADO Paulo Jorge Passos Salgado | | Director | | July 28, 2011 |
| | |
/S/ MARTIM AVILLEZDE AZEVEDO MENEZES Martim Avillez de Azevedo Menezes | | Director | | July 28, 2011 |
| | |
/S/ TOMÁSDE MELLO PAESDE VASCONCELOS Tomás de Mello Paes de Vasconcelos | | Director | | July 28, 2011 |
| | |
/S/ NUNO SILVÉRIO MARQUES Nuno Silvério Marques | | Director | | July 28, 2011 |
| | |
/S/ BERNARDO REYNOLDSDE CARVALHO Bernardo Reynolds de Carvalho | | Director | | July 28, 2011 |
| | |
/S/ DONALD PUGLISI Donald Puglisi | | Authorized Representative of TIM w.e. SGPS, S.A. in the United States | | July 28, 2011 |
II-3
Exhibit Index
| | |
| 1.1 | | Form of Underwriting Agreement* |
| 3.1 | | Bylaws |
| 4.1 | | Specimen certificate evidencing common shares |
| 5.1 | | Opinion of CCA Advogados as to the validity of the common shares |
| 8.1 | | Opinion of CCA Advogados as to Portuguese tax matters (included in Exhibit 5.1) |
| 8.2 | | Opinion of Davis Polk & Wardwell LLP as to U.S. tax matters |
| 10.1 | | Mobile Carrier Agreement—Vivo (Brazil) (English translation) |
| 10.2 | | Datacenter Agreement—Mainroad Information Technology (English translation) |
| 21.1 | | List of Subsidiaries |
| 23.1 | | Consent of KPMG & Associados—Sociedade de Revisores Oficiais de Contas, S.A. |
| 23.2 | | Consent of CCA Advogados (included in Exhibit 5.1) |
| 23.3 | | Consent of Davis Polk & Wardwell LLP (included in Exhibit 8.2) |
| 24.1 | | Powers of Attorney (included on signature page) |
| 99.1 | | TIM w.e. SGPS, S.A. Code of Ethics |
| * | To be filed by amendment. |
II-4