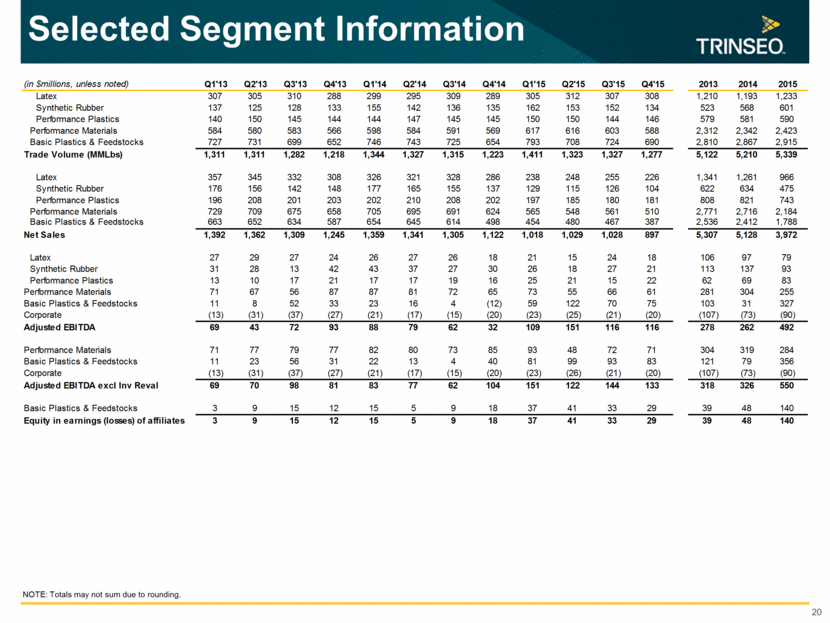
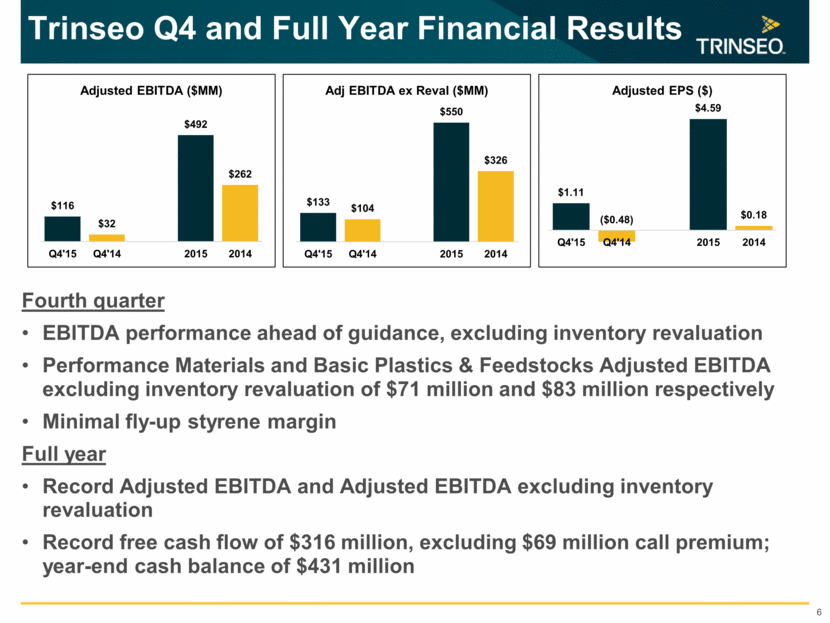
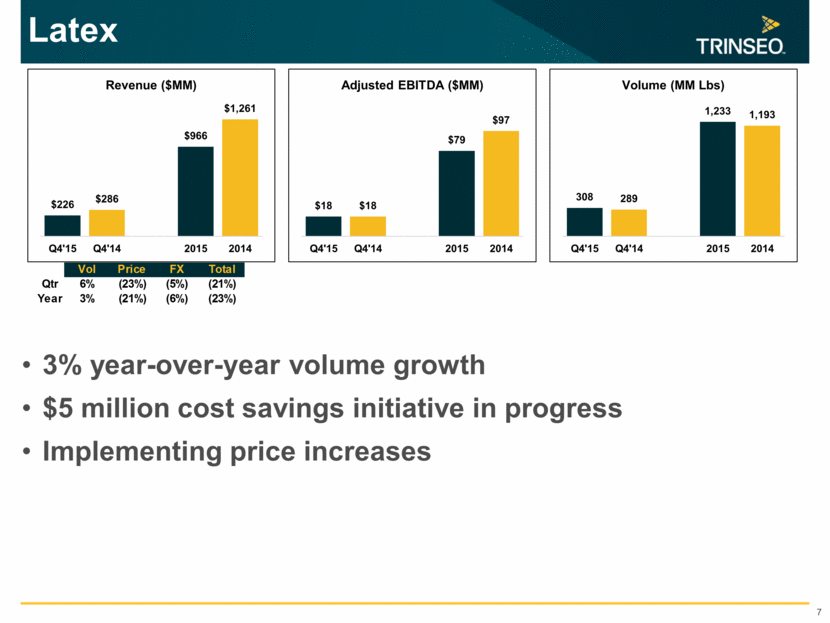
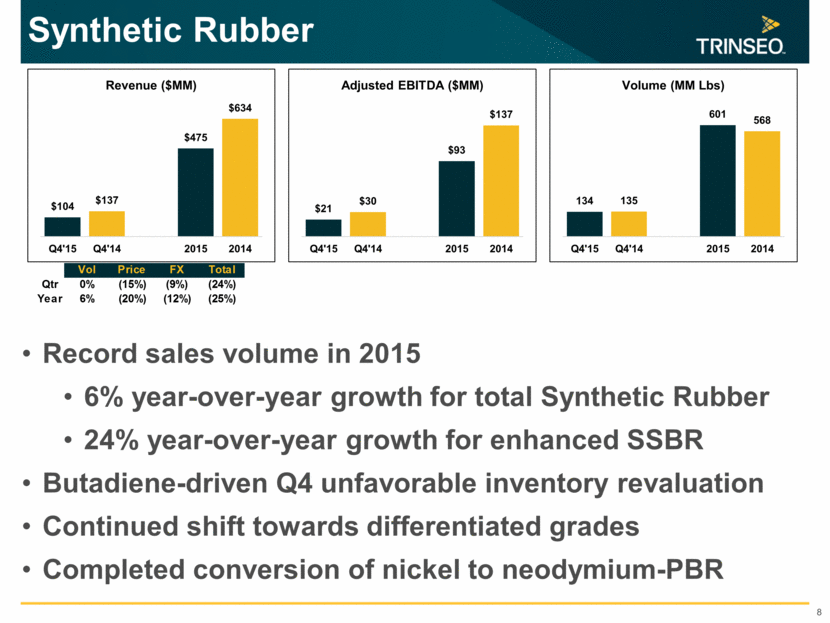
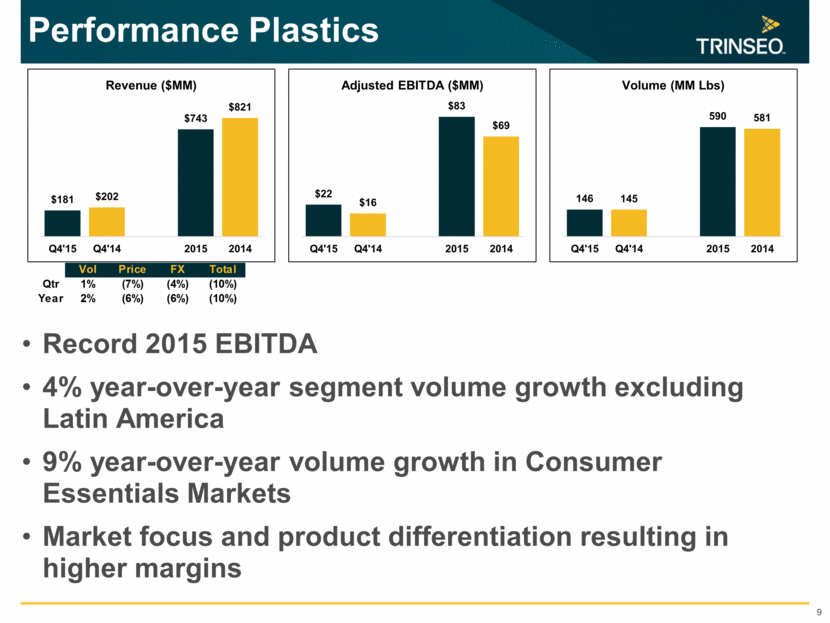
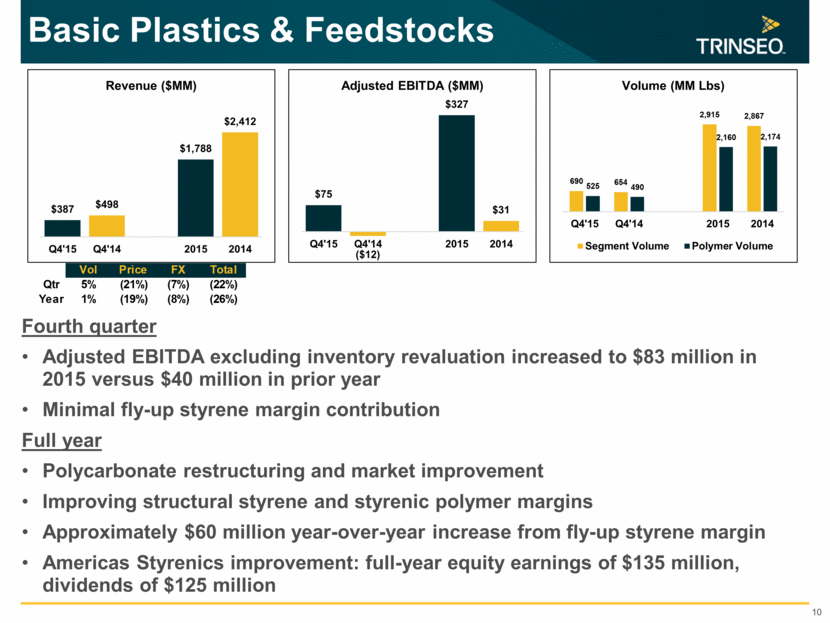
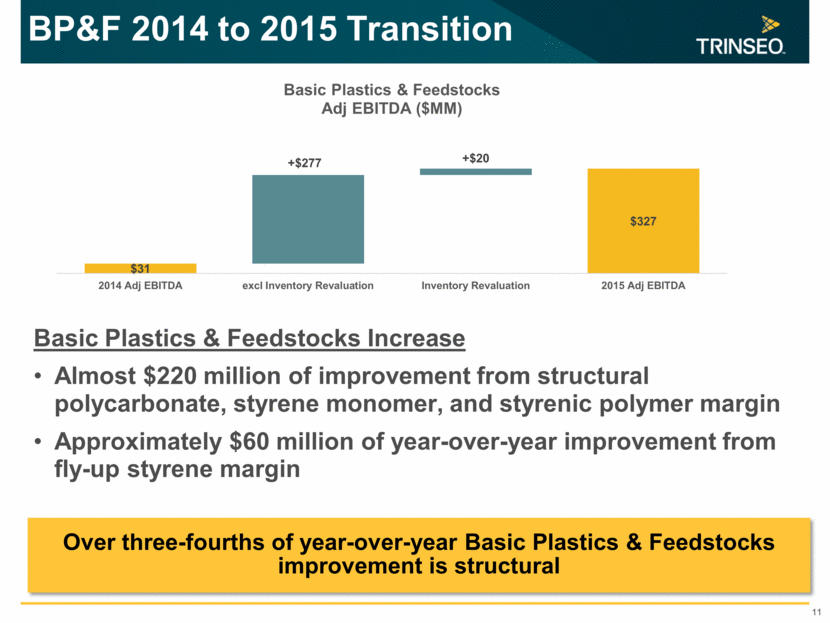
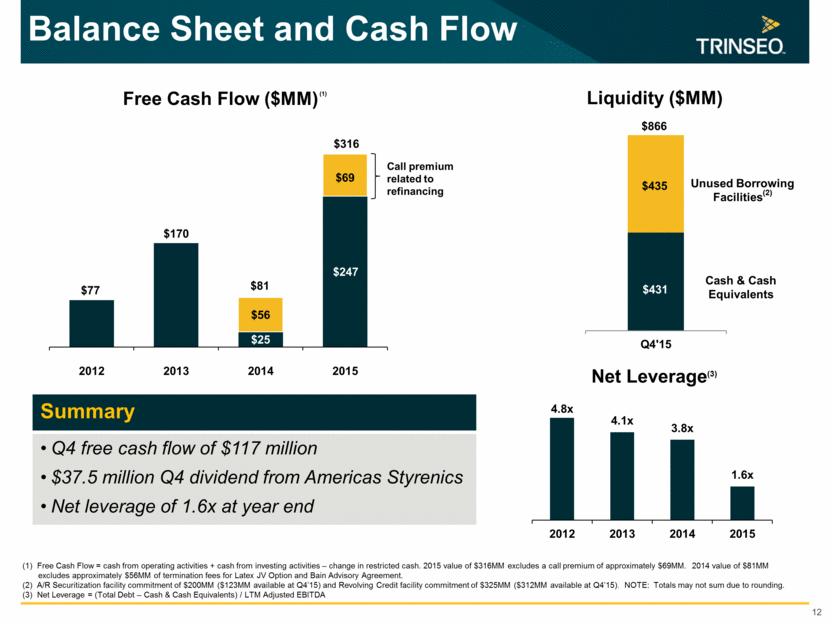
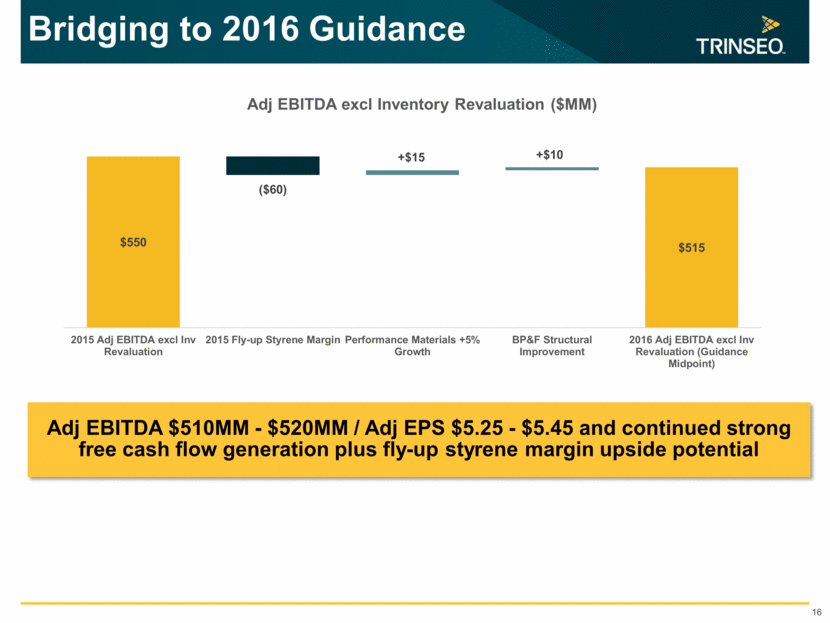
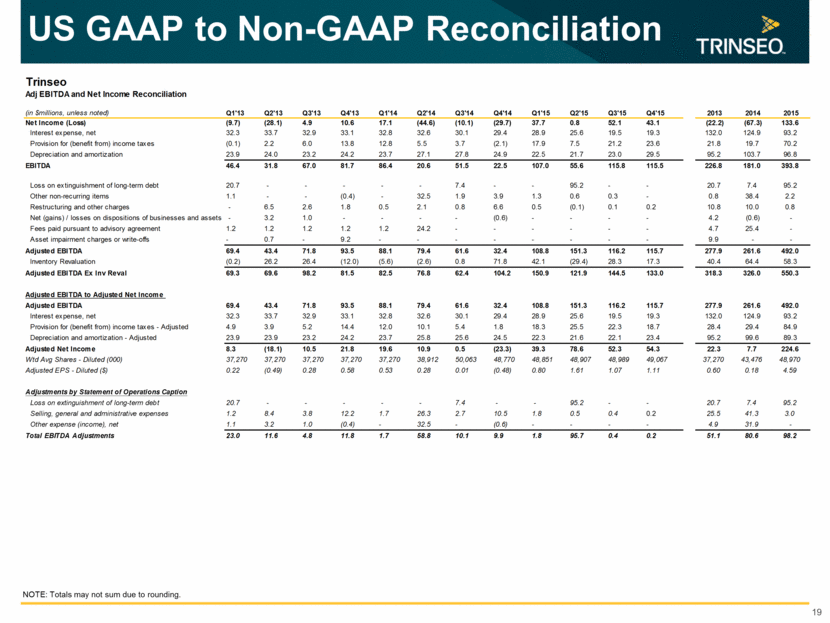
Selected Segment Information 20 NOTE: Totals may not sum due to rounding. (in $millions, unless noted) Q1'13 Q2'13 Q3'13 Q4'13 Q1'14 Q2'14 Q3'14 Q4'14 Q1'15 Q2'15 Q3'15 Q4'15 2013 2014 2015 Latex 307 305 310 288 299 295 309 289 305 312 307 308 1,210 1,193 1,233 Synthetic Rubber 137 125 128 133 155 142 136 135 162 153 152 134 523 568 601 Performance Plastics 140 150 145 144 144 147 145 145 150 150 144 146 579 581 590 Performance Materials 584 580 583 566 598 584 591 569 617 616 603 588 2,312 2,342 2,423 Basic Plastics & Feedstocks 727 731 699 652 746 743 725 654 793 708 724 690 2,810 2,867 2,915 Trade Volume (MMLbs) 1,311 1,311 1,282 1,218 1,344 1,327 1,315 1,223 1,411 1,323 1,327 1,277 5,122 5,210 5,339 Latex 357 345 332 308 326 321 328 286 238 248 255 226 1,341 1,261 966 Synthetic Rubber 176 156 142 148 177 165 155 137 129 115 126 104 622 634 475 Performance Plastics 196 208 201 203 202 210 208 202 197 185 180 181 808 821 743 Performance Materials 729 709 675 658 705 695 691 624 565 548 561 510 2,771 2,716 2,184 Basic Plastics & Feedstocks 663 652 634 587 654 645 614 498 454 480 467 387 2,536 2,412 1,788 Net Sales 1,392 1,362 1,309 1,245 1,359 1,341 1,305 1,122 1,018 1,029 1,028 897 5,307 5,128 3,972 Latex 27 29 27 24 26 27 26 18 21 15 24 18 106 97 79 Synthetic Rubber 31 28 13 42 43 37 27 30 26 18 27 21 113 137 93 Performance Plastics 13 10 17 21 17 17 19 16 25 21 15 22 62 69 83 Performance Materials 71 67 56 87 87 81 72 65 73 55 66 61 281 304 255 Basic Plastics & Feedstocks 11 8 52 33 23 16 4 (12) 59 122 70 75 103 31 327 Corporate (13) (31) (37) (27) (21) (17) (15) (20) (23) (25) (21) (20) (107) (73) (90) Adjusted EBITDA 69 43 72 93 88 79 62 32 109 151 116 116 278 262 492 Performance Materials 71 77 79 77 82 80 73 85 93 48 72 71 304 319 284 Basic Plastics & Feedstocks 11 23 56 31 22 13 4 40 81 99 93 83 121 79 356 Corporate (13) (31) (37) (27) (21) (17) (15) (20) (23) (26) (21) (20) (107) (73) (90) Adjusted EBITDA excl Inv Reval 69 70 98 81 83 77 62 104 151 122 144 133 318 326 550 Basic Plastics & Feedstocks 3 9 15 12 15 5 9 18 37 41 33 29 39 48 140 Equity in earnings (losses) of affiliates 3 9 15 12 15 5 9 18 37 41 33 29 39 48 140
