Exhibit 99.2
Second Quarter 2017 Financial Results August 3, 2017 ™ Trademark of Trinseo S.A. or its affiliates
Introductions & Disclosure Rules 2 Disclosure Rules Cautionary Note on Forward-Looking Statements. This presentation contains forward-looking statements including, without limitation, statements concerning plans, objectives, goals, projections, strategies, future events or performance, and underlying assumptions and other statements, which are not statements of historical facts or guarantees or assurances of future performance. Forward- looking statements may be identified by the use of words like “expect,” “anticipate,” “intend,” “forecast,” “outlook,” “will,” “may,” “might,” “potential,” “likely,” “target,” “plan,” “contemplate,” “seek,” “attempt,” “should,” “could,” “would” or expressions of similar meaning. Forward-looking statements reflect management’s evaluation of information currently available and are based on our current expectations and assumptions regarding our business, the economy and other future conditions. Because forward-looking statements relate to the future, they are subject to inherent uncertainties, risks and changes in circumstances that are difficult to predict. Factors that might cause such a difference include, but are not limited to, those discussed in our Annual Report on Form 10-K, under Part I, Item 1A — “Risk Factors” and elsewhere in that report. As a result of these or other factors, our actual results may differ materially from those contemplated by the forward-looking statements. Therefore, we caution you against relying on any of these forward-looking statements. The forward-looking statements included in this presentation are made only as of the date hereof. We undertake no obligation to publicly update or revise any forward-looking statement as a result of new information, future events or otherwise, except as otherwise required by law. This presentation contains financial measures that are not in accordance with generally accepted accounting principles in the US (“GAAP”) including Adjusted EBITDA, Adjusted Net Income, Adjusted EPS, and Free Cash Flow. We believe these measures provide relevant and meaningful information to investors and lenders about the ongoing operating results of the Company. Such measures when referenced herein should not be viewed as an alternative to GAAP measures of performance or liquidity. We have provided a reconciliation of these measures to the most comparable GAAP metric in the Appendix section of this presentation. This presentation shall not constitute an offer to sell or the solicitation of an offer to buy securities. Any securities issued pursuant to our refinancing will not be registered under the Securities Act and may not be sold in the United States absent registration or an applicable exemption therefrom. Introductions Chris Pappas, President & CEO Barry Niziolek, Executive Vice President & CFO David Stasse, Vice President, Treasury & Investor Relations
3 Key Points * See Appendix for reconciliation of non-GAAP measures. Q2 2017 Results at Guidance Midpoint Excluding Timing Impacts Business fundamentals remain strong Performance Materials in line with expectations Performance Materials on Track to Meet or Exceed Growth Target Acquisition of API in Performance Plastics Latex Binders improvement Synthetic Rubber SSBR expansion, pilot plant, and new products on time Debt Refinancing To be launched over next two weeks Expect a reduction in interest expense Dividend Increase and New Share Repurchase Authorization Dividend increase of 20% Repurchase authorization of 2 million shares Updating 2017 Guidance Net Income of $294MM to $302MM Adj EBITDA* of $550MM to $560MM Updated guidance fundamentally the same as our prior guidance, excluding timing impacts
API Plastics Acquisition 4 Strong position in soft-touch polymers such as Thermoplastic Elastomers (TPE) TPEs are often molded over rigid plastics such as ABS and PC/ABS – presenting opportunities for complementary technology product offerings Enables growth synergies across multiple end markets and geographies with similar applications to benefit customers Aligns with our Performance Materials growth strategy
Impact of Raw Material Price Changes 5 Q4’16 / Q1’17: Outage-driven price increases resulted in favorable net timing impacts; working capital build Q2’17 / Q3’17: As supply returns, price decreases resulting in unfavorable net timing impacts; expect working capital release Styrene Benzene Q4’16 / Q1’17 Q2’17 / Q3’17 Q4’16 / Q1’17 Q2’17 / Q3’17 Expanding net timing disclosure to include segment level detail to provide better transparency around these impacts $1,000 (50%) $450 (25%) $275 (25%) SOURCE: Western Europe Styrene, Benzene: ICIS. Western Europe Butadiene: IHS. Styrene: W. Europe Contract Monthly Market (Delivered W. Europe); Benzene: 50% W. Europe Spot Avg (CIF NW Europe / Basis ARA) and 50% W. Europe Contract – Market (FOB/CIF W. Europe); Butadiene: W. Europe Contract-Market (Del (-09EXW) W. Europe) Jan '16 Feb '16 Mar '16 Apr '16 May '16 Jun '16 Jul'16 Aug'16 Sep'16 Oct'16 Nov'16 Dec'16 Jan'17 Feb'17 Mar'17 Apr'17 May'17 Jun'17 Jul'17 Aug'17 Sep'17 Europe Butadiene ($/MT) Jan '16 Feb '16 Mar '16 Apr '16 May '16 Jun '16 Jul'16 Aug'16 Sep'16 Oct'16 Nov'16 Dec'16 Jan'17 Feb'17 Mar'17 Apr'17 May'17 Jun'17 Jul'17 Aug'17 Sep'17 Europe Styrene & Benzene ($/MT)
6 Note: Division and Segment Adjusted EBITDA excludes Corporate Adjusted EBITDA of ($22) million. Totals may not sum due to rounding. * Includes $23 million pre-tax unfavorable net timing impact; see Appendix for reconciliation of non-GAAP measures. ** Net Sales represents sales to external customers only; however, the majority of the Feedstocks segment Adj EBITDA* is driven by margin on internal transfers Q2 2017 Financial Results & Highlights Overall strong fundamental performance and business conditions Latex Binders improvement, particularly in Asia SSBR sales at record levels past 2 quarters Performance Plastics solid sales volume despite lower North America auto production Basic Plastics strong due to polystyrene restocking, Polycarbonate industry supply issues Styrene margins bottomed in May and rebounded in June Solid AmSty performance Performance Materials Net Sales: $656MM Adj EBITDA: $87MM Latex Binders Net Sales: $292MM Adj EBITDA: $36MM Synthetic Rubber Net Sales: $174MM Adj EBITDA: $28MM Performance Plastics Net Sales: $190MM Adj EBITDA: $23MM Basic Plastics & Feedstocks Net Sales: $489MM Adj EBITDA: $61MM Basic Plastics Net Sales: $382MM Adj EBITDA: $32MM Feedstocks Net Sales**: $107MM Adj EBITDA: ($1)MM Americas Styrenics Adj EBITDA: $30MM Net Income: $60MM Adj EBITDA*: $126MM EPS / Adj EPS*: $1.34 / $1.39
First Half 2017 Results 7 No net timing impact over the first half of the year Q1 and Q2 fundamentally similar results excluding net timing impacts *See Appendix for reconciliation of non-GAAP measures and definition of net timing. NOTE: Totals may not sum due to rounding. ($MM, unless noted) Q1 Q2 1st Half Net Income 117 60 177 Adjusted EBITDA* 182 126 308 Net Timing* (pre-tax) 22 (23) (0) EPS, diluted ($) 2.59 1.34 3.93 Adjusted EPS* ($) 2.42 1.39 3.82
Net sales in the second quarter increased 18% vs prior year driven primarily by the pass through of higher raw material costs Net Income and Adj EBITDA decreases vs prior year were driven primarily by pre-tax impacts of net timing (-$24 million) and lower styrene margin (-$17 million net of timing) Trinseo Q2 2017 Financial Results 8 * See Appendix for reconciliation of non-GAAP measures. Totals may not sum due to rounding. $126 $182 Q2'17 Q2'16 Adjusted EBITDA* ($MM) $1.34 $1.39 $2.00 $2.30 EPS Adj EPS* EPS ($) Q2'17 Q2'16 $1,145 $60 $970 $96 Net Sales Net Income Net Sales & Net Income ($MM) Q2'17 Q2'16
Higher Adj EBITDA vs prior year driven by stronger business fundamentals and cost management Lower YoY volume due to Brazil divestiture, destocking in North America coated paper market Latex Binders 9 $292 $232 Q2'17 Q2'16 Net Sales ($ MM) $36 $21 Q2'17 Q2'16 Adjusted EBITDA ($MM) 287 310 Q2'17 Q2'16 Volume (MM Lbs)
Record SSBR volumes in Q1 and Q2 Higher volume and better product mix increased Adj EBITDA vs prior year; more than offset by $7 million change in net timing Synthetic Rubber 10 $174 $111 Q2'17 Q2'16 Net Sales ($ MM) $28 $30 Q2'17 Q2'16 Adjusted EBITDA ($MM) 158 148 Q2'17 Q2'16 Volume (MM Lbs)
Net sales increase vs prior year driven by higher volumes in North America automotive and Asia consumer electronics Adj EBITDA YoY decline driven primarly by margin compression Performance Plastics 11 $190 $184 Q2'17 Q2'16 Net Sales ($ MM) $23 $38 Q2'17 Q2'16 Adjusted EBITDA ($MM) 148 154 Q2'17 Q2'16 Volume (MM Lbs)
Net sales increase vs prior year driven by the pass through of higher raw material costs Adj EBITDA lower than prior year driven primarily by $8 million change in net timing impacts Basic Plastics 12 $382 $363 Q2'17 Q2'16 Net Sales ($ MM) $32 $43 Q2'17 Q2'16 Adjusted EBITDA ($MM) 521 539 Q2'17 Q2'16 Volume (MM Lbs)
Adj EBITDA YoY decrease driven by lower styrene margins and $15 million change in net timing impacts As forecasted, margins bottomed in May and rebounded in June Feedstocks & Americas Styrenics 13 FEEDSTOCKS $8 million impact in Q2 sales from outage-related styrene purchases $38 million dividend received in Q2 AMERICAS STYRENICS ($1) $33 Q2'17 Q2'16 Adjusted EBITDA ($MM) $30 $38 Q2'17 Q2'16 Adjusted EBITDA ($MM)
Cash Generation 14 Year-to-Date Cash from operations of $37 million and Free Cash Flow* of negative $38 million includes over $200 million working capital outflow from raw material price increases Expect first half working capital build to reverse in the second half of the year due to falling raw material prices Total Year Currently forecasting cash from operations of ~$400 million and Free Cash Flow* of ~$240 million Cash assumptions $160 million capital expenditures $85 million taxes $75 million interest * See Appendix for reconciliation of non-GAAP measures.
Western Europe and Asia Styrene Margin Trends Western Europe Margin (1) SM Margin over Raw Materials Q2 to Q3 ~+$45/MT Styrene Ethylene Benzene $320 $287 $294 $254 $276 $393 $323 $501 $678 $482 $233 $319 $413 $428 $330 Jul-16 Aug-16 Sep-16 Oct-16 Nov-16 Dec-16 Jan-17 Feb-17 Mar-17 Apr-17 May-17 Jun-17 Jul-17 Aug-17 Sep-17 Asia Margin (2) SM Margin over Raw Materials Ethylene Benzene Styrene Q2 to Q3 ~+$35/MT $213 $188 $170 $190 $300 $225 $228 $270 $240 $152 $137 $241 $294 $170 $165 Jul-16 Aug-16 Sep-16 Oct-16 Nov-16 Dec-16 Jan-17 Feb-17 Mar-17 Apr-17 May-17 Jun-17 Jul-17 Aug-17 Sep-17 Trinseo’s Feedstocks reporting segment captures styrene monomer margin through both internally produced and cost-based purchases of styrene. Annually, we produce nearly 700 kilotons of styrene in Western Europe and purchase approximately 300 kilotons of styrene in Asia with cost-based economics. With all other inputs remaining equal, a $50 per metric ton change in styrene margins would be expected to impact the Feedstocks reporting segment’s annual Adjusted EBITDA by approximately $35 million in Europe and approximately $15 million in Asia. Other factors that could impact the Feedstocks segment Adjusted EBITDA include, but are not limited to, utilities, freight, manufacturing costs, overhead costs, discounts of styrene, benzene, and ethylene, as well as raw material timing. SOURCE: Western Europe Styrene, Benzene, Ethylene Prices: ICIS. Asia Styrene, Benzene, Ethylene prices: IHS. Styrene margin over raw materials: Trinseo. (1) Styrene: W. Europe Contract Monthly Market (Delivered W. Europe); Benzene: 50% W. Europe Spot Avg (CIF NW Europe / Basis ARA) and 50% W. Europe Contract – Market (FOB/CIF W. Europe); Ethylene: W. Europe Contract – Market Pipeline (Delivered W. Europe). (2) Styrene: NE Asia Avg Spot Posting (CFR China); Benzene: NE Asia Spot Avg (FOB S. Korea); Ethylene: NE Asia Spot Avg (CFR NE Asia). Styrene margin over raw materials: Styrene less (80% * Benzene) less (30% * Ethylene). 15
Sequentially lower due to seasonality, Q2 restocking Q3 2017 Guidance 16 Performance Materials Synthetic Rubber Latex Binders Performance Plastics Continued strong performance driven by tighter market conditions and cost actions Includes ~$30 million of unfavorable timing impacts as well as about $5 million of growth-related costs Increased seasonal demand in consumer electronics Raw materials moderating Corporate Net Income $50MM - $58MM; Adj EBITDA* $110MM - $120MM Assumes unfavorable pre-tax timing impact of $30MM, essentially all in Synthetic Rubber Adj EBITDA* ($MM) ~$30 * See Appendix for reconciliation of non-GAAP measures Basic Plastics & Feedstocks Feedstocks Basic Plastics Americas Styrenics In line with prior guidance ~$30 ~$15 Stronger sequential performance after Q2 sales of Q1 outage-related styrene purchases ~$35 ~($22) ~($5) ~$30 Assumptions
Includes ~$10 million of unfavorable timing impacts Lower margin due to higher raw material costs Full Year 2017 Guidance 17 Performance Materials Synthetic Rubber Latex Binders Performance Plastics Includes ~$5 million of unfavorable timing impacts Includes ~$20 million of full year unfavorable timing impacts $10 million growth-related costs in second half Corporate Prior Guidance * See Appendix for reconciliation of non-GAAP measures Basic Plastics & Feedstocks Feedstocks Basic Plastics Americas Styrenics Includes minimal timing impact Includes minimal timing impact Assumes Q4 styrene margins similar to Q3 Below prior guidance due to Q2 sales of Q1 outage-related styrene purchases Net Income $294MM - $302MM; Adj EBITDA* $550MM - $560MM ~$30MM unfavorable, full-year timing impact Updated Guidance ~$130 ~$125 ~$80 ~$125 ~($95) ~$110 ~$135 ~$125 ~$90 ~$115 ~$130 ~$70 ~$120 ~($95) Assumptions
Full Year Guidance Discussion 18 * See Appendix for reconciliation of non-GAAP measures and definition of net timing. NOTE: 2nd Half assumes the midpoint of our guidance. Totals may not sum due to rounding. First half to second half profitability decrease due to net timing as well as: Growth-related impacts, lower Latex Binders and styrene margin, seasonally lower volumes Partially offset by higher AmSty equity affiliate income ($MM, unless noted) 1st Half 2nd Half FY'17 Net Income 177 120 298 Adjusted EBITDA* 308 247 555 Net Timing* (pre-tax) (0) (30) (30) EPS, diluted ($) 3.93 2.67 6.60 Adjusted EPS* ($) 3.82 2.67 6.49
Guidance Bridges 19 Net Income: $337MM - $353MM Net Income: $294MM - $302MM Lower full-year guidance driven by change in net timing expectations $600 - $620 $550 - $560 ~($55) 2017 Prior Guidance Net Timing Impacts 2017 Current Guidance Adjusted EBITDA ($ MM)
Appendix
21 Raw Material Timing / Price Lag Represents the timing of raw material cost changes flowing through COGS versus current pricing Primarily key materials such as benzene, butadiene, and bisphenol-A RAW MATERIAL TIMING PRICE LAG Represents the difference in revenue between the current contractual price and the current period price Primarily key materials in pass-through pricing agreements such as styrene and butadiene June Example: Business with 60 days inventory & 30 days price lag June COGS based on April raw material price June revenue based on May raw material price Unfavorable net timing impact as revenue basis < cost basis ILLUSTRATIVE EXAMPLE COGS Basis (60-day lag) Revenue Basis (30-day lag) Raw Material Timing Impact Price Lag Impact Source: IHS / Butadiene: W. Europe Contract-Market (Del (-09EXW) W. Europe) Jan-17 Feb-17 Mar-17 Apr-17 May-17 Jun-17 Europe Butadiene ($/MT)
22 Cumulative Net Timing Impact Raw material timing and price lag tend to offset each other in Performance Materials Basic Plastics & Feedstocks typically impacted only by raw material timing $(42) $29 $(28) $(17) $(10) $13 $7 $20 $71 $(40) $34 $(10) $4 $17 $5 $(12) $(2) $(6) $(49) $17 Q1'15 Q2'15 Q3'15 Q4'15 Q1'16 Q2'16 Q3'16 Q4'16 Q1'17 Q2'17 Quarterly Raw Material Timing Quarterly Price Lag Cumulative Raw Material Timing Cumulative Price Lag $MM: Favorable / (Unfavorable)
Butadiene Price History 23 Source: IHS / Butadiene: W. Europe Contract-Market (Del (-09EXW) W. Europe) - 4,000 Jan-11 Jan-12 Jan-13 Jan-14 Jan-15 Jan-16 Jan-17 Europe Butadiene ($/MT)
US GAAP to Non-GAAP Reconciliation Profitability Guidance CURRENT GUIDANCE (1) PRIOR GUIDANCE Three Months Ended Year Ended Year Ended (In $millions, unless noted) Sep 30, 2017 Dec 31, 2017 Dec 31, 2017 Adjusted EBITDA 110 - 120 550 - 560 600 - 620 Interest expense, net (19) (74) (74) Provision for income taxes (16) - (18) (87) - (89) (97) - (101) Depreciation and amortization (25) (101) (100) Reconciling items to Adjusted EBITDA -- 6 8 Net Income 50 - 58 294 - 302 337 - 353 Reconciling items to Net Income -- (5) (8) Adjusted Net Income 50 - 58 288 - 296 329 - 345 Weighted avg shares - diluted (MM) 45.0 45.1 45.3 Adjusted EPS ($) 1.10 - 1.28 6.40 - 6.58 7.26 - 7.61 Free Cash Flow Three Months Ended Six Months Ended CURRENT GUIDANCE (1) Twelve Months Ended (In $millions) Jun 30, 2017 Jun 30, 2016 Jun 30, 2017 Jun 30, 2016 31-Dec-17 Cash provided by operating activities 62.3 94.8 36.6 179.7 400 Capital expenditures (38.2) (26.7) (74.3) (53.2) (160) Free Cash Flow 24.1 68.1 (37.7) 126.5 240 (1) Our current guidance does not include any estimates regarding the impact of potential refinancing activities on our future financial results. NOTE: For definitions of non-GAAP measures as well as descriptions of reconciling items from Net Income to Adjusted EBITDA and to Adjusted Net Income, refer to the accompanying Exhibit 99.1 – Press Release, July 2, 2017. Totals may not sum due to rounding. 24
(in $millions, unless noted) Q1'15 Q2'15 Q3'15 Q4'15 Q1'16 Q2'16 Q3'16 Q4'16 Q1'17 Q2'17 2014 2015 2016 Net Income (Loss) 37.7 0.8 52.1 43.1 76.7 95.8 67.3 78.5 117.3 60.2 (67.3) 133.6 318.3 Interest expense, net 28.9 25.6 19.5 19.3 18.9 18.8 18.8 18.4 18.2 18.7 124.9 93.2 75.0 Provision for (benefit from) income taxes 17.9 7.5 21.2 23.6 21.9 28.6 16.0 20.5 29.3 18.8 19.7 70.2 87.0 Depreciation and amortization 22.5 21.7 23.0 29.5 23.2 24.9 23.8 24.7 24.7 26.3 103.7 96.8 96.4 EBITDA 107.0 55.6 115.8 115.5 140.7 168.1 125.9 142.1 189.5 124.0 181.0 393.8 576.7 Loss on extinguishment of long-term debt - 95.2 - - - - - - - - 7.4 95.2 - Other items 1.3 0.6 0.3 - 1.8 0.3 0.3 (6.8) - 1.1 38.4 2.2 (4.4) Restructuring and other charges 0.5 (0.1) 0.1 0.2 0.7 1.1 16.8 4.9 2.1 1.1 10.0 0.8 23.5 Net (gains) / losses on dispositions of businesses and assets - - - - - 12.9 0.3 1.8 (9.9) - (0.6) - 15.1 Fees paid pursuant to advisory agreement - - - - - - - - - - 25.4 - - Adjusted EBITDA 108.8 151.3 116.2 115.7 143.2 182.4 143.3 142.0 181.7 126.2 261.6 492.0 610.9 Adjusted EBITDA to Adjusted Net Income Adjusted EBITDA 108.8 151.3 116.2 115.7 143.2 182.4 143.3 142.0 181.7 126.2 261.6 492.0 610.9 Interest expense, net 28.9 25.6 19.5 19.3 18.9 18.8 18.8 18.4 18.2 18.7 124.9 93.2 75.0 Provision for (benefit from) income taxes - Adjusted 18.3 25.5 22.3 18.7 22.4 28.8 21.4 22.0 29.5 19.2 29.4 84.9 94.6 Depreciation and amortization - Adjusted 22.3 21.6 22.1 23.4 22.6 24.9 23.3 24.7 24.2 25.8 99.6 89.3 95.4 Adjusted Net Income 39.3 78.6 52.3 54.3 79.3 109.9 79.8 76.9 109.8 62.5 7.7 224.6 345.9 Wtd Avg Shares - Diluted (000) 48,851 48,907 48,989 49,067 49,086 47,857 46,961 45,754 45,313 44,995 43,476 48,970 47,478 Adjusted EPS - Diluted ($) 0.80 1.61 1.07 1.11 1.62 2.30 1.70 1.68 2.42 1.39 0.18 4.59 7.28 Adjustments b y Statement of Operations Caption Loss on extinguishment of long-term debt - 95.2 - - - - - - - - 7.4 95.2 - Selling, general and administrative expenses 1.8 0.5 0.4 0.2 2.5 1.4 17.1 4.9 2.1 2.2 41.3 3.0 25.9 Other expense (income), net - - - - - 12.9 0.3 (5.0) (9.9) - 31.9 - 8.3 Total EBITDA Adjustments 1.8 95.7 0.4 0.2 2.5 14.3 17.4 (0.1) (7.8) 2.2 80.6 98.2 34.2 Free Cash Flow Reconciliation Cash provided by operating activities 84.9 94.8 145.0 79.0 (25.7) 62.3 117.2 353.2 403.7 Capital expenditures (26.4) (26.7) (29.5) (41.2) (36.0) (38.2) (98.6) (109.3) (123.9) Free Cash Flow 58.4 68.1 115.5 37.8 (61.7) 24.1 18.6 243.9 279.8
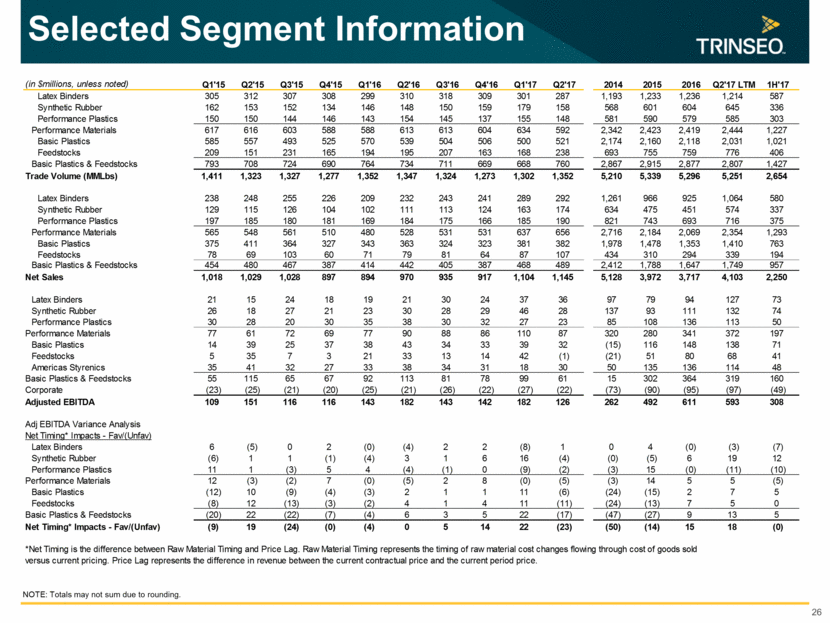
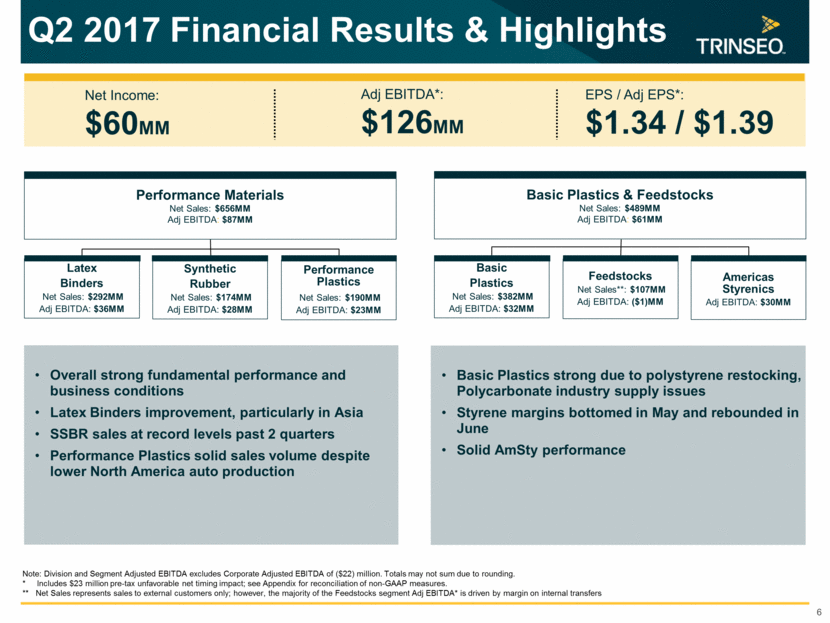
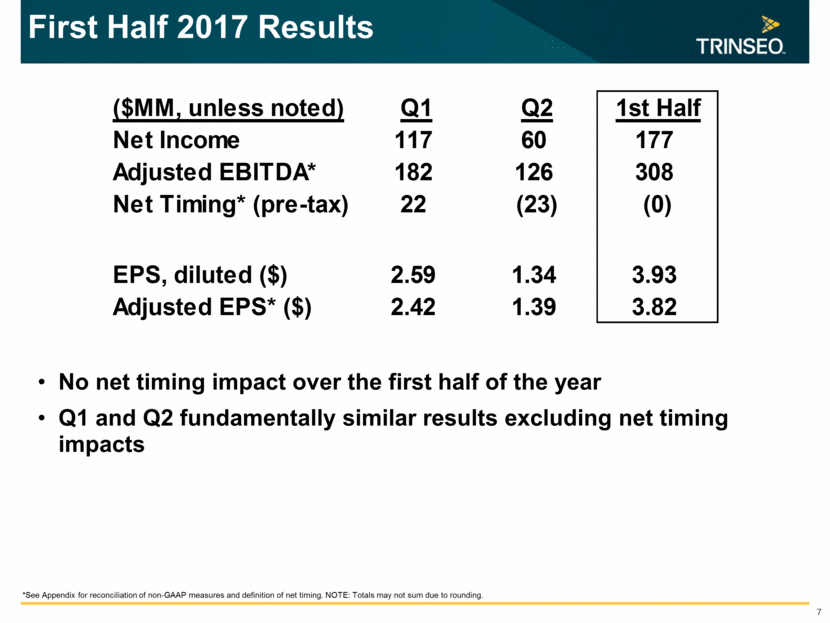
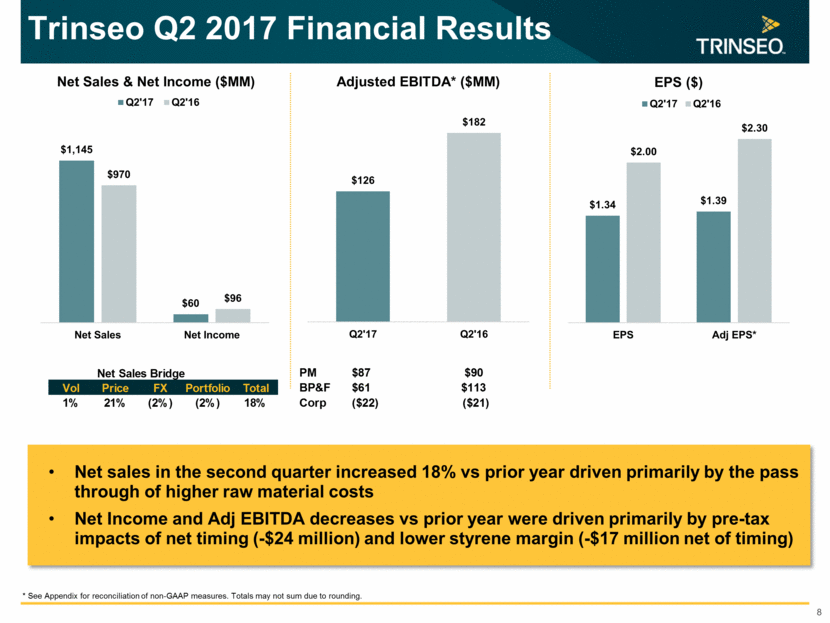
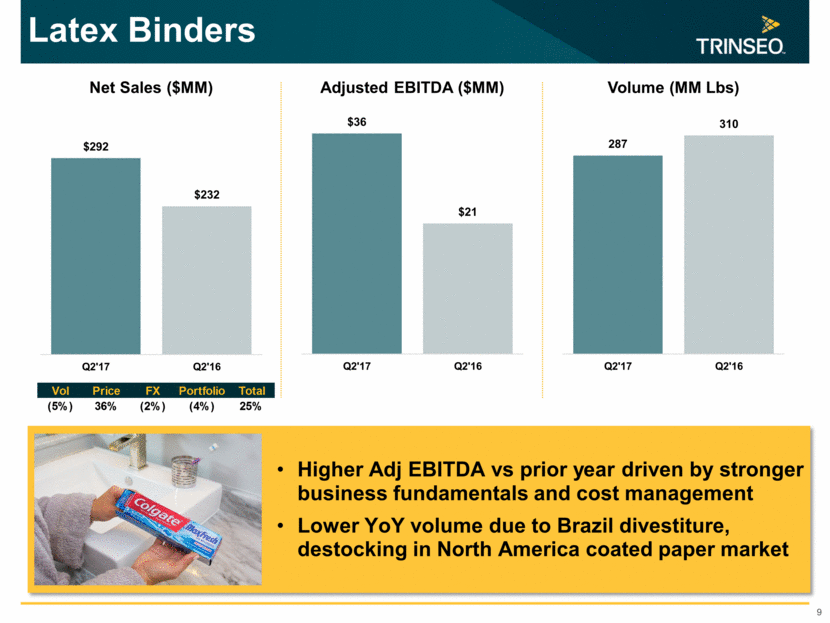
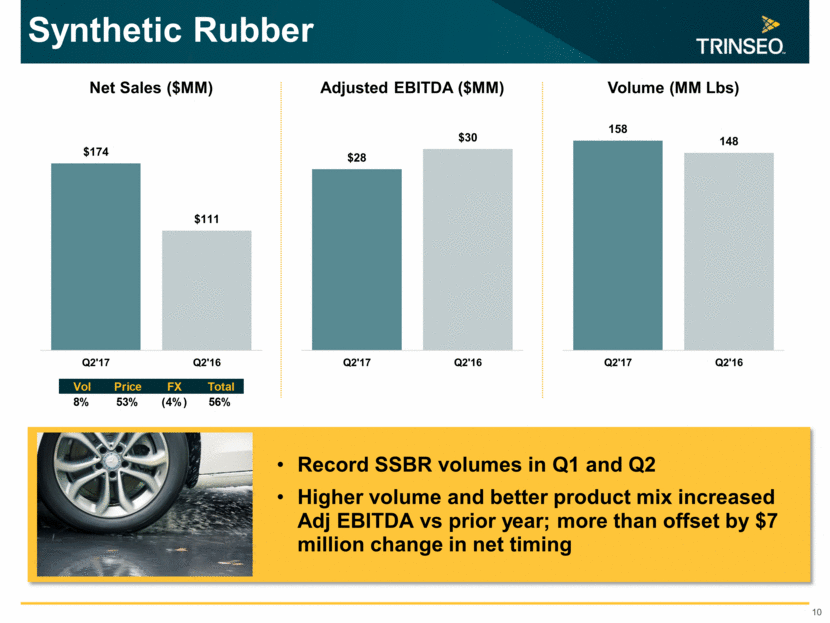
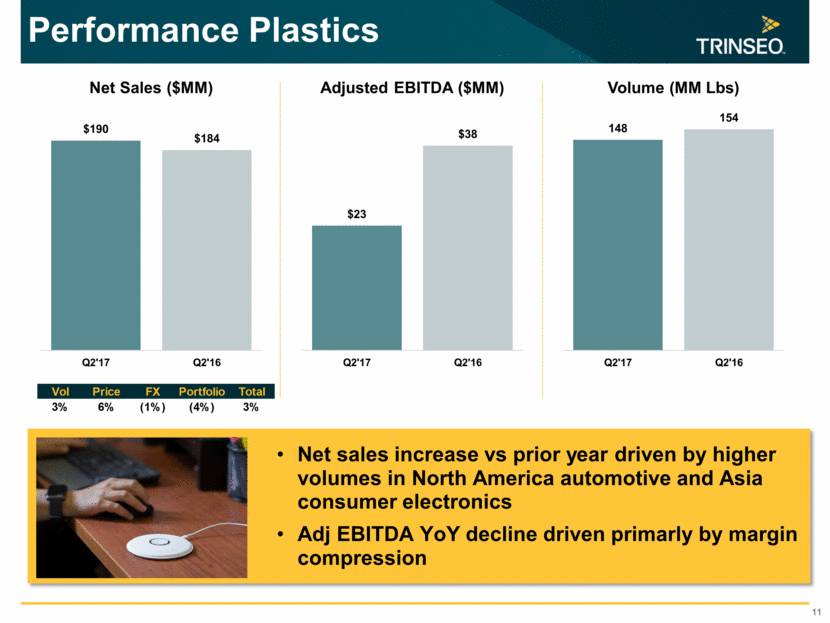
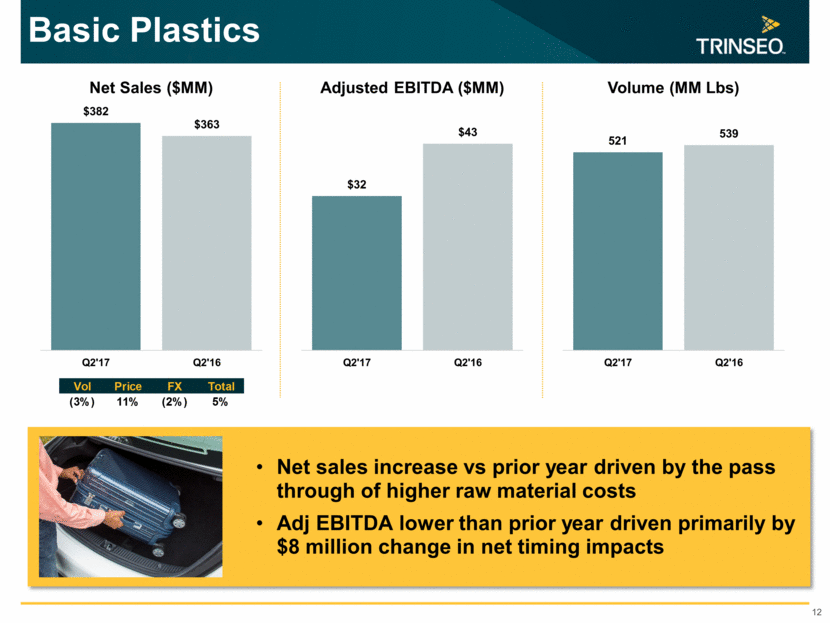
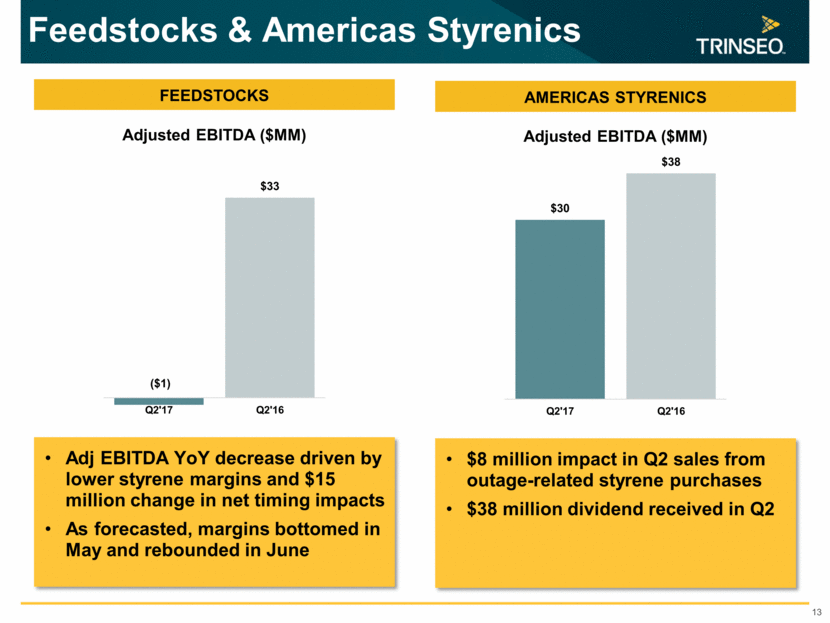
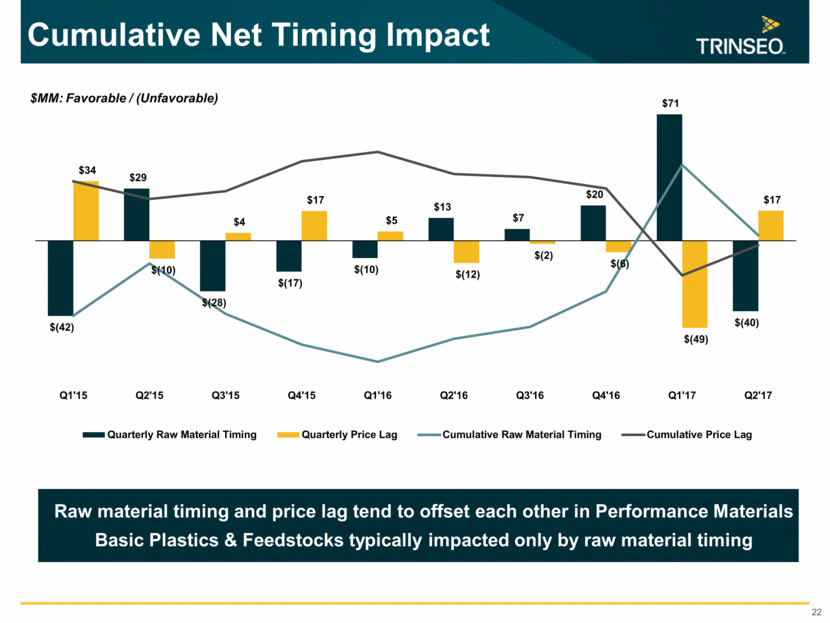
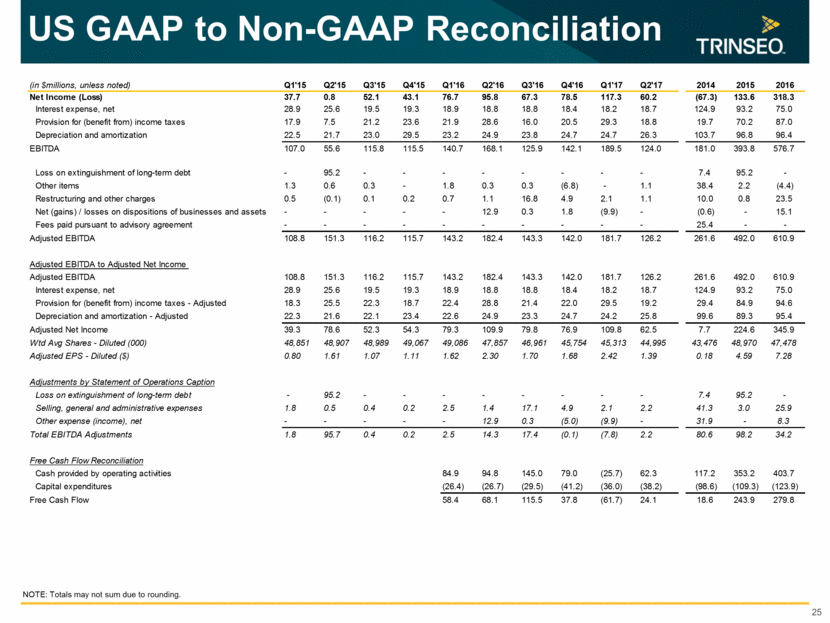
Selected Segment Information 26 NOTE: Totals may not sum due to rounding. (in $millions, unless noted) Q1'15 Q2'15 Q3'15 Q4'15 Q1'16 Q2'16 Q3'16 Q4'16 Q1'17 Q2'17 2014 2015 2016 Q2'17 LTM1H'17 Latex Binders 305 312 307 308 299 310 318 309 301 287 1,193 1,233 1,236 1,214 587 Synthetic Rubber 162 153 152 134 146 148 150 159 179 158 568 601 604 645 336 Performance Plastics 150 150 144 146 143 154 145 137 155 148 581 590 579 585 303 Performance Materials 617 616 603 588 588 613 613 604 634 592 2,342 2,423 2,419 2,444 1,227 Basic Plastics 585 557 493 525 570 539 504 506 500 521 2,174 2,160 2,118 2,031 1,021 Feedstocks 209 151231 165 194 195 207 163 168 238 693 755 759 776 406 Basic Plastics & Feedstocks 793 708 724 690 764 734 711 669 668 760 2,867 2,915 2,877 2,807 1,427 Trade Volume (MMLbs) 1,411 1,323 1,327 1,277 1,352 1,347 1,324 1,273 1,302 1,352 5,210 5,339 5,296 5,251 2,654 Latex Binders 238 248 255 226 209 232 243 241 289 292 1,261 966 925 1,064 580 Synthetic Rubber 129 115 126 104 102 111 113124 163 174 634 475 451 574 337 Performance Plastics 197 185 180 181 169 184 175 166 185 190 821 743 693 716 375 Performance Materials 565 548 561 510 480 528 531 531 637 656 2,716 2,184 2,069 2,354 1,293 Basic Plastics 375 411 364 327 343 363 324 323 381 382 1,978 1,478 1, 353 1,410 763 Feedstocks78 69 10 36 07 17 98 16 487 107 434 310 294 339 194 Basic Plastics & Feedstocks 454 480 467 387 414 442 405 387 468 489 2,412 1,788 1,647 1,749957 Net Sales 1,018 1,029 1,028897894970935917 1,104 1,145 5, 1283,972 3,717 4,1032,250 Latex Binders 21 15 24 18 19 21 30 24 37 36 97 79 94 127 73 Synthetic Rubber 26 18 27 21 23 30 28 29 46 28 137 93 111 132 74 Performance Plastics 30 28 20 30 35 38 30 32 27 23 85 108 136 113 50 Performance Materials 77 61 72 69 77 90 88 86 110 87 320 280 341 372 197 Basic Plastics 14 39 25 37 38 43 34 33 39 32 (15) 116 148 138 71 Feedstocks 5 35 73 21 33 13 14 42 (1) (21) 51 80 68 41 Americas Styrenics 35 41 32 27 33 38 34 31 18 30 50 13 51 36 114 48 Basic Plastics & Feedstocks 55 115 65 67 92 113 81 78 99 61 15 302 364 319 160 Corporate (23) (25) (21) (20) (25) (21) (26) (22) (27) (22) (73) (90) (95) (97) (49) Adjusted EBITDA 109 151 116 116 143 182 143 142 182 126 262 492 611 593 308 Adj EBITDA Variance AnalysisNet Timing* Impacts - Fav/ (Unfav) Latex Binders 6 (5) 02 (0) (4) 22 (8) 104 (0) (3) (7) Synthetic Rubber (6) 11 (1) (4) 31616 (4) (0) (5) 61912 Performance Plastics111 (3) 54 (4) (1) 0 (9) (2) (3) 15 (0) (11) (10) Performance Materials12 (3) (2) 7 (0) (5) 28 (0) (5) (3) 14 55 (5) Basic Plastics (12) 10 (9) (4) (3) 21111 (6) (24) (15) 275 Feedstocks (8) 12 (13) (3) (2) 41411 (11) (24) (13) 750 Basic Plastics & Feedstocks (20) 22 (22) (7) (4) 63522 (17) (47) (27) 9135 Net Timing* Impacts - Fav/ (Unfav) (9) 19 (24) (0) (4) 05 14 22 (23) (50) (14) 1518 (0) *Net Timing is the difference between Raw Material Timing and Price Lag. Raw Material Timing represents the timing of raw material cost changes flowing through cost of goods soldversus current pricing. Price Lag represents the difference in revenue between the current contractual price and the current period price.