 ™ Trademark Second Quarter 2014 Earnings Summary August 7, 2014 Exhibit 99.2 |
 2 Introductions & Disclosure Rules Disclosure Rules The forward looking statements contained in this presentation involve risks and uncertainties that may affect the Company's operations, markets, products, services, prices and other factors. These risks and uncertainties include, but are not limited to, economic, competitive, legal, governmental and technological factors. Accordingly, there is no assurance that the Company's expectations expressed in such forward looking statements will be realized. The Company assumes no obligation to provide revisions to any forward looking statements in this presentation should circumstances change. This presentation contains financial measures that are not in accordance with generally accepted accounting principles in the US (“GAAP”) including Adjusted EBITDA. We believe these measures provide relevant and meaningful information to investors and lenders about the ongoing operating results of the Company. Such measures when referenced herein should not be viewed as an alternative to GAAP measures of performance. We have provided a reconciliation of Adjusted EBITDA in the Appendix section of this presentation. Introductions Chris Pappas, President & CEO John Feenan, Executive Vice President & CFO David Stasse, Vice President, Treasury & Investor Relations |
 3 Agenda Business Overview Financial Review 2014 Focus Q&A |
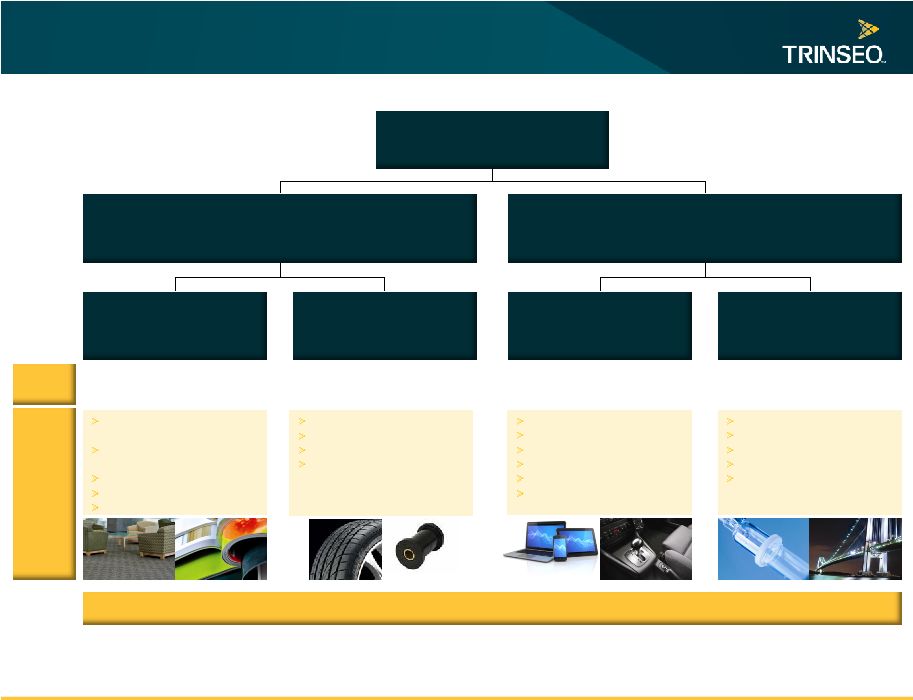 4 Trinseo Business Overview Engineered Polymers Revenue: $266MM Adj EBITDA: $5MM Styrenics Revenue: $590MM Adj EBITDA: $27MM Emulsion Polymers Revenue: $486MM Adj EBITDA: $64MM Plastics Revenue: $855MM Adj EBITDA: $32MM #3 Polystyrene Globally Leading Player Synthetic Rubber Revenue: $165MM Adj EBITDA: $37MM Top 3 SSBR Globally Q2’14 Revenue: $1,341MM Q2’14 Adj EBITDA: $79MM Latex Revenue: $321MM Adj EBITDA: $27MM #1 Globally in SB Latex Note: Division and Segment EBITDA excludes Corporate Segment Adjusted EBITDA of $(17)MM. Totals may not sum due to rounding. End markets Market position Performance tires Standard tires Polymer modification Technical rubber goods Coated paper and packaging board Carpet and artificial turf backings Tape saturation Cement modification Building products $5+ billion in annual revenue, world leader in the production of latex, rubber and plastics Appliances Consumer goods Construction/sheet Packaging Automotive Consumer electronics Automotive Consumer electronics Construction/sheet Electrical and lighting Medical devices |
 5 Key Styrene Raw Material Trends Europe (1) Source: IHS. (1) Styrene: 50% W. Europe Spot Avg (FOB W. Europe) and 50% W. Europe Contract Monthly Market (Delivered W. Europe); Benzene: 50% W. Europe Spot Avg (CIF NW Europe / Basis ARA) and 50% W. Europe Contract – Monthly Market (FOB/CIF W. Europe); Ethylene: W. Europe Contract – Market Pipeline (Delivered W. Europe). (2) Styrene: NE Asia Avg Spot Posting (CFR China); Benzene: NE Asia Spot Avg (FOB S. Korea); Ethylene: NE Asia Spot Avg (CFR NE Asia). Styrene Ethylene Benzene Styrene Ethylene Benzene Asia (2) |
 6 Key Butadiene Price Trends Butadiene Source: IHS. Asia: NE Asia Spot (CFR NE Asia) Europe: W. Europe Contract Market (ExW/Del pr09 W. Europe); NA: North America Contract Market (FOB US Gulf Coast). Europe NA Asia |
 ™ Trademark Financial Review John Feenan EVP & CFO |
 F/(U) vs. (in $millions, unless noted) Q2'14 Q1'14 Q2'13 Q1'14 Q2'13 Volume (MMlbs) 1,327 1,344 1,311 Revenue 1,341 1,359 1,362 (1)% (2)% Volume (1)% 0% Price (1)% (5)% FX 0% 3% Adjusted EBITDA 79 88 43 Adjusted EBITDA Margin 6% 6% 3% Adjusted Net Income 11 20 (18) Wtd Avg Shares Outstanding (000) 38,912 37,270 37,270 Adjusted EPS ($) 0.28 0.53 (0.49) Trinseo Quarterly Results 8 Note: Inventory revaluation EBITDA impact of $3MM, $6MM and $(26)MM for Q2’14, Q1’14, and Q2’13, respectively. Totals may not sum due to rounding. |
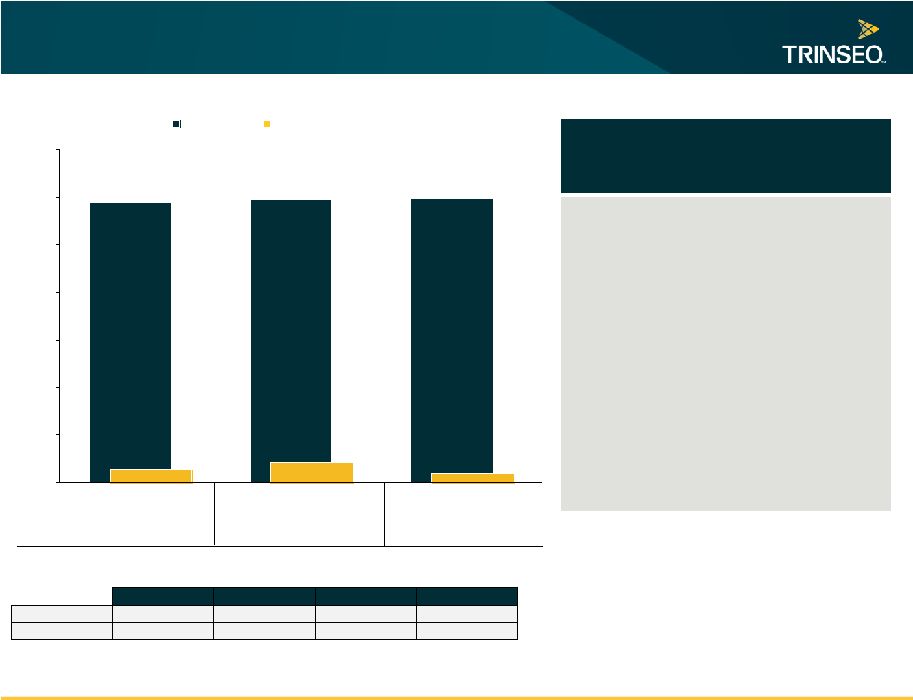
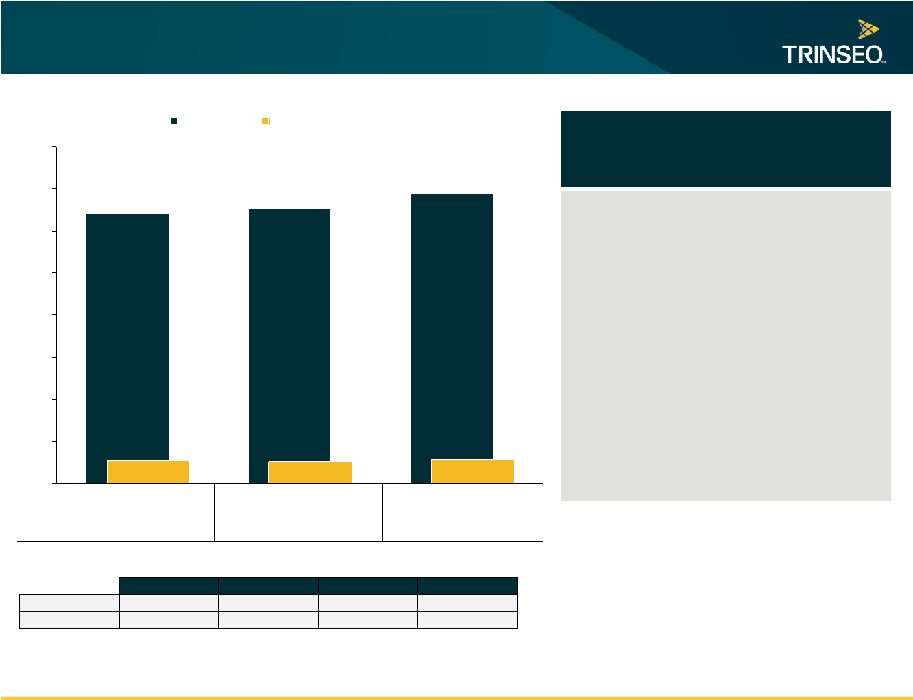 $321 $326 $345 $27 $26 $29 $0 $50 $100 $150 $200 $250 $300 $350 $400 Q2'14 Q1'14 Q2'13 Revenue Adjusted EBITDA 9 Latex $MM Note: Totals may not sum due to rounding. Volume in millions of pounds. Key Points • Difficult conditions in Europe and North America graphical paper • Offset by growth in carpet, Asia paper, and Performance Latex • New 25KT reactor in China on schedule and on budget Revenue Bridge Volume Price FX Total YoY (3)% (6)% 2% (7)% QoQ (1)% (1)% 0% (2)% Volume 295 299 305 |
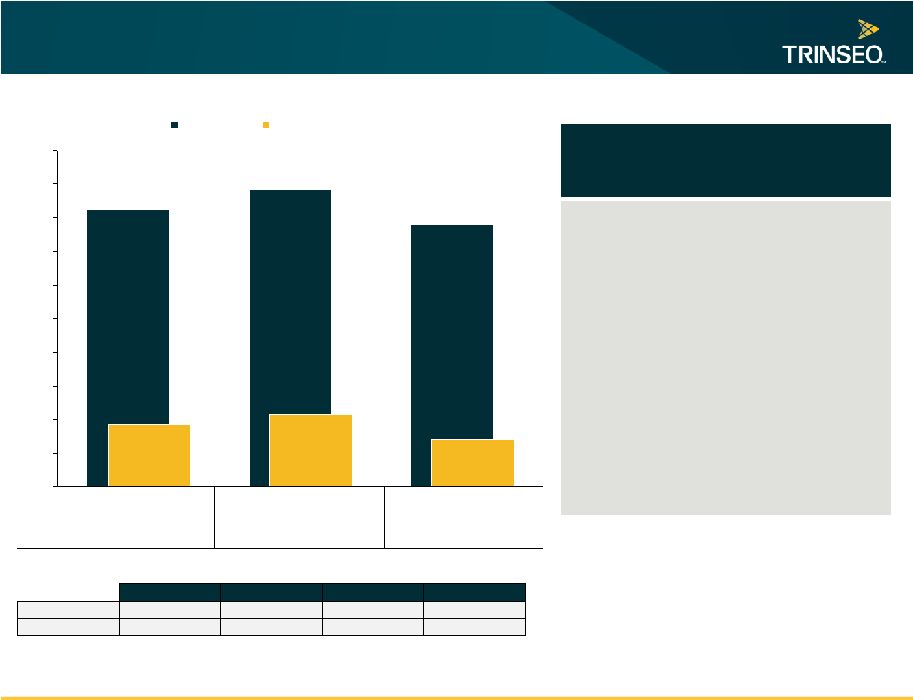 $165 $177 $156 $37 $43 $28 $0 $20 $40 $60 $80 $100 $120 $140 $160 $180 $200 Q2'14 Q1'14 Q2'13 Revenue Adjusted EBITDA 10 Synthetic Rubber $MM Note: Totals may not sum due to rounding. Volume in millions of pounds. Revenue Bridge Volume Price FX Total YoY 14% (13)% 4% 6% QoQ (10)% 3% 0% (7)% Key Points • Tire demand rebounding in Europe, China, and North America • Investing in additional SSBR • JSR capacity • Investing in higher margin products • Ni-PBR to Nd-PBR • Generation 4 SSBR • >30% YoY SSBR growth Volume 142 155 125 |
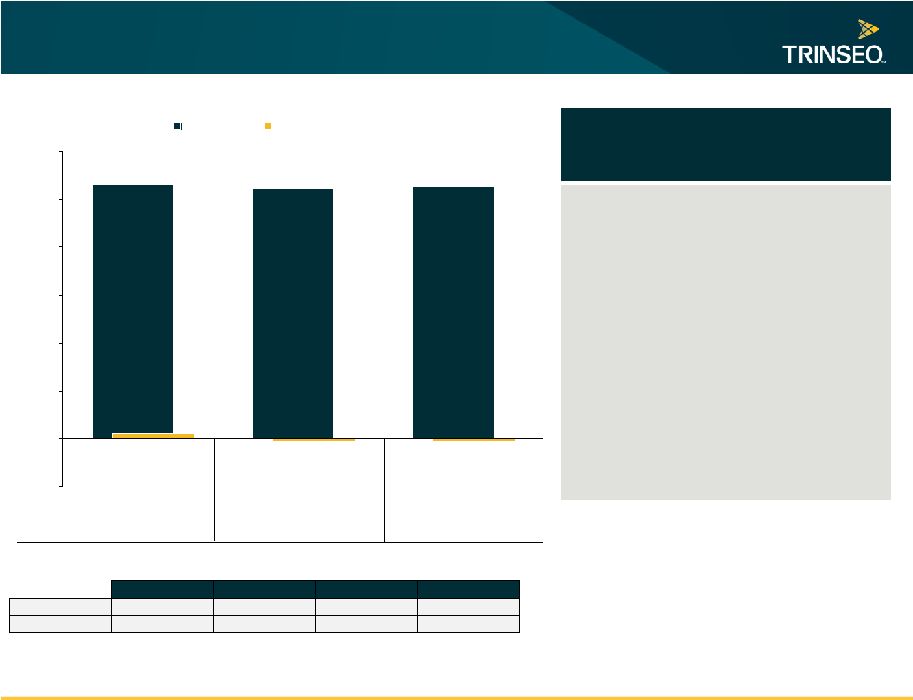
 $590 $594 $597 $27 $42 $21 $0 $100 $200 $300 $400 $500 $600 $700 Q2'14 Q1'14 Q2'13 Revenue Adjusted EBITDA 11 Styrenics $MM Note: Totals may not sum due to rounding. Volume in millions of pounds. Adjusted EBITDA includes earnings from equity affiliate (Americas Styrenics). Revenue Bridge Volume Price FX Total YoY (1)% (4)% 4% (1)% QoQ 1% (2)% 0% (1)% Key Points • JV earnings from AmSty $9MM lower sequentially – turnaround related • Asia styrene margins compressed end of Q2 • Q2 was high season for appliance market • Focused on controlling costs and driving margin in competitive environment • PS margins remain steady Volume 689 686 679 |
 $266 $262 $263 $5 $(2) $(3) $(50) $0 $50 $100 $150 $200 $250 $300 Q2'14 Q1'14 Q2'13 Revenue Adjusted EBITDA 12 Engineered Polymers $MM Note: Totals may not sum due to rounding. Volume in millions of pounds. Adjusted EBITDA includes earnings from equity affiliate (Sumika Styron). Revenue Bridge Volume Price FX Total YoY 0% (2)% 3% 1% QoQ 1% 1% 0% 1% Key Points • Global polycarbonate demand rebounding • Polycarbonate restructuring on track • Volume improving in electronics, medical, electrical & lighting • Strong automotive margins Volume 201 204 203 |
 13 Balance Sheet and Cash Flow Liquidity – Q2 End (excl Cash for Debt Paydown) Maturities – Jul 14, 2014 A/R Securitization (2) Revolver (2) Senior Secured Notes (1) Free Cash Flow = cash from operating activities + cash from investing activities – change in restricted cash (2) A/R Securitization facility commitment of $200MM and Revolving Credit facility commitment of $300MM ($293MM available at Q2’14). *$132.5 million face amount of bonds at 103 price plus $5 million accrued. NOTE: Totals may not sum due to rounding. Summary • Q2 breakeven free cash flow reflects $56 million outflow resulting from termination of Dow Emerging Markets JV option and Bain Advisory Agreement • Strong quarter-end liquidity of $675 million (excl cash used for debt paydown) • $142 million cash used for debt redemption on July 14* $MM Unused Borrowing Facility Cash & Cash Equivalents $MM $MM Free Cash Flow (1) |
 ™ Trademark 2014 Focus Chris Pappas President & CEO |
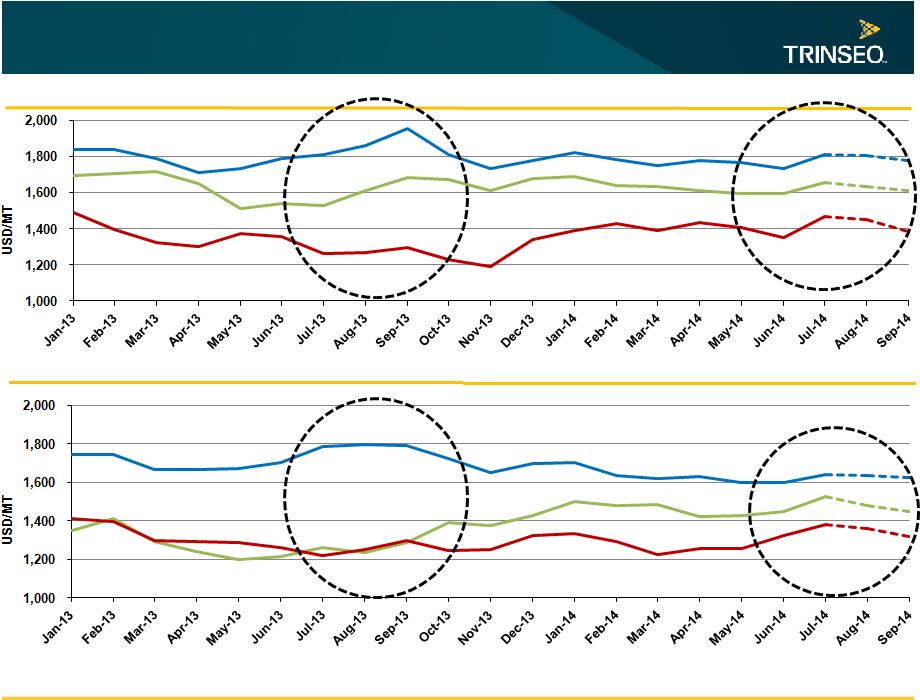 15 Key Styrene Raw Material Trends Europe (1) Source: IHS. (1) Styrene: 50% W. Europe Spot Avg (FOB W. Europe) and 50% W. Europe Contract Monthly Market (Delivered W. Europe); Benzene: 50% W. Europe Spot Avg (CIF NW Europe / Basis ARA) and 50% W. Europe Contract – Monthly Market (FOB/CIF W. Europe); Ethylene: W. Europe Contract – Market Pipeline (Delivered W. Europe). (2) Styrene: NE Asia Avg Spot Posting (CFR China); Benzene: NE Asia Spot Avg (FOB S. Korea); Ethylene: NE Asia Spot Avg (CFR NE Asia). Styrene Ethylene Benzene Styrene Ethylene Benzene Asia (2) |
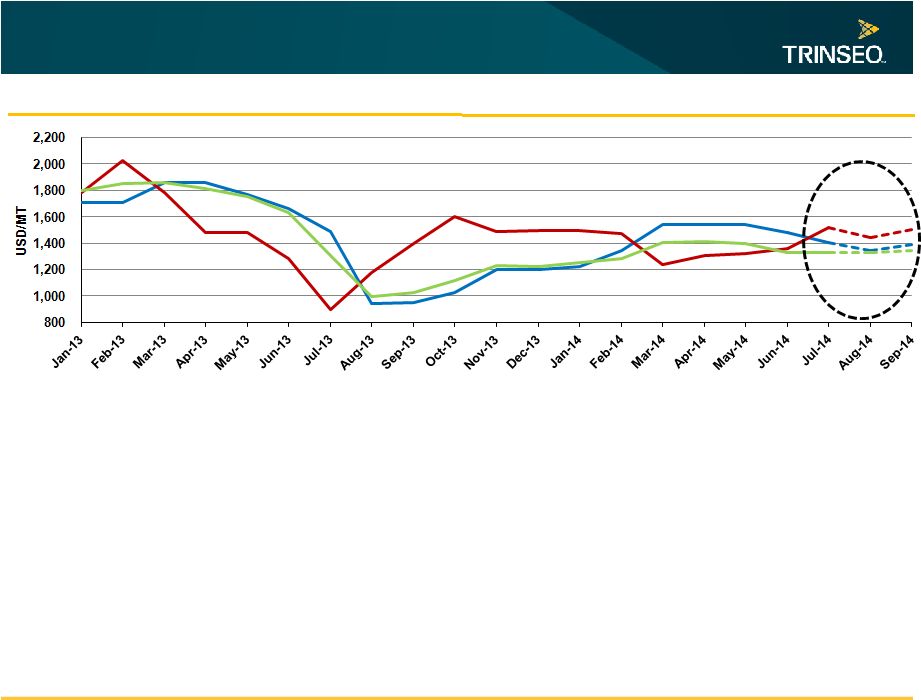 16 Key Butadiene Price Trends Butadiene Source: IHS. Asia: NE Asia Spot (CFR NE Asia) Europe: W. Europe Contract Market (ExW/Del pr09 W. Europe); NA: North America Contract Market (FOB US Gulf Coast). Europe NA Asia |
 17 Second Half Update Short-term headwinds Outage-driven benzene spike impacts styrene and polycarbonate margins in Q3 ESBR turnaround and unplanned outage Seasonality Underlying fundamentals remain strong Replacement tire market rebounding, SSBR growth strong Latex margins steady Polycarbonate demand and operating rates rising New volumes in performance latex, carpet, electrical and lighting compounds Expect 2014 Adjusted EBITDA to be comfortably ahead of 2013 |
 18 Sustainability Highlights 2013 SUSTAINABLE PRODUCTS SUSTAINABLE PERFORMANCE Potential weight reduction per car through innovative plastic solutions, which have been developed and implemented by Trinseo in 2013 6.7kg Reduction in energy consumption by using a LED bulb with Trinseo plastic lens, compared to traditional incandescent light 75% Reduction in fuel consumption when using low rolling resistance tires with SSBR rubber from Trinseo 3% Reduction in waste (vs. 2011 baseline) 26% Reduction in emissions of volatile organic chemicals (VOCs) (vs. 2012) 5% Reduction in emissions of non-VOC chemicals (vs. 2012) 2% Reduction in electricity use (vs. 2012) 2% Percent of Trinseo manufacturing plants with Triple Zero record: no injuries, no significant spills, no process safety incidents 54% Percent of Trinseo employees who completed ethics and compliance training 97% Percent of Trinseo plants with ISO 14001 certification 58% Percent of Trinseo sites with ISO 50001 certification 27% SUSTAINABLE OPERATIONS |
 19 Trinseo Value Drivers Profitable Growth Structural Changes Cyclical Upsides |
 ™ Trademark Q&A |
 ™ Trademark Appendix |
 22 US GAAP to Non-GAAP Reconciliation (in $millions, unless noted) Q1'12 Q2'12 Q3'12 Q4'12 Q1'13 Q2'13 Q3'13 Q4'13 Q1'14 Q2'14 Net Income (Loss) 30.1 1.9 (1.2) (0.5) (9.7) (28.1) 4.9 10.6 17.1 (44.6) Interest expense, net 25.7 26.6 28.6 29.1 32.3 33.7 32.9 33.1 32.8 32.6 Provision for (benefit from) income taxes 25.1 (6.1) 10.3 (11.8) (0.1) 2.2 6.0 13.8 12.8 5.4 Depreciation and amortization 20.9 22.0 20.0 22.7 23.9 24.0 23.2 24.2 23.7 27.2 EBITDA 101.8 44.4 57.7 39.5 46.4 31.8 67.0 81.7 86.4 20.6 Loss on extinguishment of long-term debt - - - - 20.7 - - - - - Other non-recurring items - - (0.7) - 1.1 - - (0.4) - 32.5 Restructuring and other charges 7.8 0.1 (0.4) - - 6.5 2.6 1.8 0.5 2.1 Net (gains) / losses on dispositions of businesses and assets - - - - - 3.2 1.0 - - - Fees paid pursuent to advisory agreement 1.1 1.2 1.1 1.2 1.2 1.2 1.2 1.2 1.2 24.2 Asset impairment charges or write-offs - - - - - 0.7 - 9.2 - - Adjusted EBITDA 110.7 45.7 57.7 40.7 69.4 43.4 71.8 93.5 88.1 79.4 Interest expense, net 25.7 26.6 28.6 29.1 32.3 33.7 32.9 33.1 32.8 32.6 Provision for (benefit from) income taxes - Adjusted 27.1 (4.0) 10.5 1.9 4.9 3.9 5.2 14.4 12.0 10.1 Depreciation and amortization - Adjusted 20.9 22.0 20.0 22.7 23.9 23.9 23.2 24.2 23.7 25.8 Adjusted Net Income 37.0 1.1 (1.4) (13.0) 8.3 (18.1) 10.5 21.8 19.6 10.9 Weighted Average Shares Outstanding (thousands) 137 3,092 23,679 37,270 37,270 37,270 37,270 37,270 37,270 38,912 Adjusted EPS ($) 270.53 0.34 (0.06) (0.34) 0.22 (0.49) 0.28 0.58 0.53 0.28 Adjustments by Statement of Operations Caption Loss on extinguishment of long-term debt - - - - 20.7 - - - - - Selling, general and administrative expenses 8.9 1.3 0.7 1.2 1.2 8.4 3.8 12.2 1.7 26.3 Other expense (income), net - - (0.7) - 1.1 3.2 1.0 (0.4) - 32.5 Total EBITDA Adjustments 8.9 1.3 - 1.2 23.0 11.6 4.8 11.8 1.7 58.8 |
 23 Selected Segment Information (in $millions, unless noted) Q1'12 Q2'12 Q3'12 Q4'12 Q1'13 Q2'13 Q3'13 Q4'13 Q1'14 Q2'14 Latex 330 317 327 301 307 305 310 288 299 295 Synthetic Rubber 125 106 116 130 137 125 128 133 155 142 Styrenics 664 652 679 614 669 679 644 597 686 689 Engineered Polymers 218 201 194 192 199 203 200 199 204 201 Trade Volume (MMLbs) 1,337 1,275 1,316 1,237 1,311 1,311 1,282 1,218 1,344 1,327 Latex 398 422 375 351 357 345 332 308 326 321 Synthetic Rubber 193 175 155 179 176 156 142 148 177 165 Styrenics 528 538 542 541 602 597 576 530 594 590 Engineered Polymers 278 274 255 249 256 263 259 260 262 266 Net Sales 1,396 1,409 1,327 1,320 1,392 1,362 1,309 1,245 1,359 1,341 Latex 27 39 33 27 27 29 27 24 26 27 Synthetic Rubber 44 24 19 24 31 28 13 42 43 37 Styrenics 49 (9) 24 19 25 21 67 52 42 27 Engineered Polymers 16 2 13 0 (1) (3) 2 2 (2) 5 Corporate (26) (11) (30) (29) (13) (31) (37) (27) (21) (17) Adjusted EBITDA 111 46 58 41 69 43 72 93 88 79 Inventory Revaluation (52) 9 2 2 (0) 26 26 (12) (6) (3) Adjusted EBITDA excl Inv Reval 59 55 60 43 69 70 98 81 83 77 NOTE: Segment balances may not sum to consolidated balances due to rounding. |