|
Exhibit 99.2 
|
Exhibit 99.2
Third Quarter 2014 Earnings Summary
November 14, 2014
™ Trademark
Introductions & Disclosure Rules
Introductions
Chris Pappas, President & CEO
John Feenan, Executive Vice President & CFO
David Stasse, Vice President, Treasury & Investor Relations
Disclosure Rules
The forward looking statements contained in this presentation involve risks and uncertainties that may affect the Company’s operations, markets, products, services, prices and other factors. These risks and uncertainties include, but are not limited to, economic, competitive, legal, governmental and technological factors. Accordingly, there is no assurance that the Company’s expectations expressed in such forward looking statements will be realized. The Company assumes no obligation to provide revisions to any forward looking statements in this presentation should circumstances change.
This presentation contains financial measures that are not in accordance with generally accepted accounting principles in the US (“GAAP”) including Adjusted EBITDA, Adjusted Net Income and Adjusted EPS. We believe these measures provide relevant and meaningful information to investors and lenders about the ongoing operating results of the Company. Such measures when referenced herein should not be viewed as an alternative to GAAP measures of performance. We have provided a reconciliation of Adjusted EBITDA, Adjusted Net Income and Adjusted EPS in the Appendix section of this presentation.
2
Agenda
Business Overview Financial Review Forward Focus Q&A
3
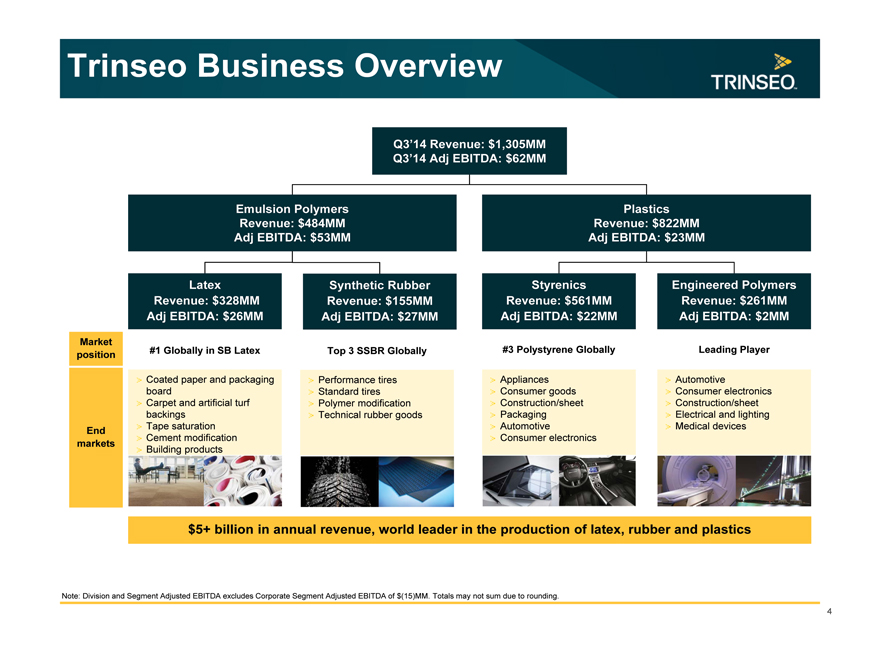
Trinseo Business Overview
Q3’14 Revenue: $1,305MM Q3’14 Adj EBITDA: $62MM
Emulsion Polymers Revenue: $484MM Adj EBITDA: $53MM
Plastics Revenue: $822MM Adj EBITDA: $23MM
Latex Revenue: $328MM
Adj EBITDA: $26MM
Synthetic Rubber Revenue: $155MM Adj EBITDA: $27MM
Styrenics Revenue: $561MM Adj EBITDA: $22MM
Engineered Polymers Revenue: $261MM
Adj EBITDA: $2MM
Market position
End markets
#1 Globally in SB Latex
Coated paper and packaging board Carpet and artificial turf backings Tape saturation Cement modification Building products
Top 3 SSBR Globally
Performance tires Standard tires Polymer modification Technical rubber goods
#3 Polystyrene Globally
Appliances Consumer goods Construction/sheet Packaging Automotive Consumer electronics
Leading Player
Automotive
Consumer electronics Construction/sheet Electrical and lighting Medical devices
$5+ billion in annual revenue, world leader in the production of latex, rubber and plastics
Note: Division and Segment Adjusted EBITDA excludes Corporate Segment Adjusted EBITDA of $(15)MM. Totals may not sum due to rounding.
4
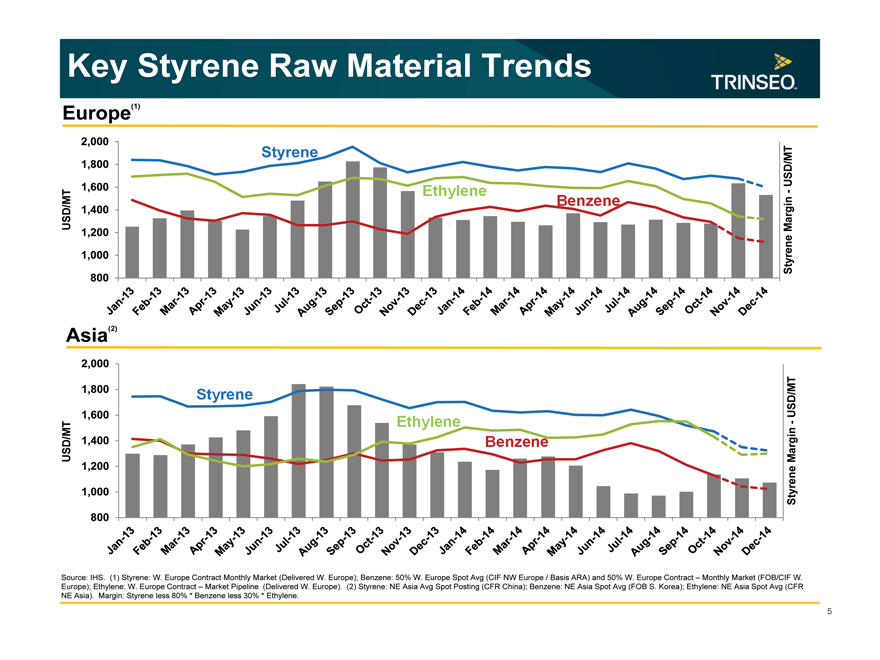
Key Styrene Raw Material Trends
Europe(1)
Styrene
Ethylene
Benzene
2,000
1,800
1,600 / MT USD 1,400 1,200
1,000
800
Jan-13 Feb-13 Mar-13 Apr-13 May-13 Jun-13 Jul-13 Aug-13 Sep-13 Oct-13 Nov-13 Dec-13
Jan-14 Feb-14 Mar-14 Apr-14 May-14 Jun-14 Jul-14 Aug-14 Sep-14 Oct-14 Nov-14 Dec-14
Styrene Margin—USD/MT
Asia(2)
Benzene
USD/MT
2,000 1,800 1,600 1,400 1,200 1,000 800
Jan-13 Feb-13 Mar-13 Apr-13 May-13 Jun-13 Jul-13 Aug-13 Sep-13 Oct-13 Nov-13 Dec-13
Jan-14 Feb-14 Mar-14 Apr-14 May-14 Jun-14 Jul-14 Aug-14 Sep-14 Oct-14 Nov-14 Dec-14
Styrene Margin—USD/MT
Source: IHS. (1) Styrene: W. Europe Contract Monthly Market (Delivered W. Europe); Benzene: 50% W. Europe Spot Avg (CIF NW Europe / Basis ARA) and 50% W. Europe Contract – Monthly Market (FOB/CIF W. Europe); Ethylene: W. Europe Contract – Market Pipeline (Delivered W. Europe). (2) Styrene: NE Asia Avg Spot Posting (CFR China); Benzene: NE Asia Spot Avg (FOB S. Korea); Ethylene: NE Asia Spot Avg (CFR NE Asia). Margin: Styrene less 80% * Benzene less 30% * Ethylene.
5
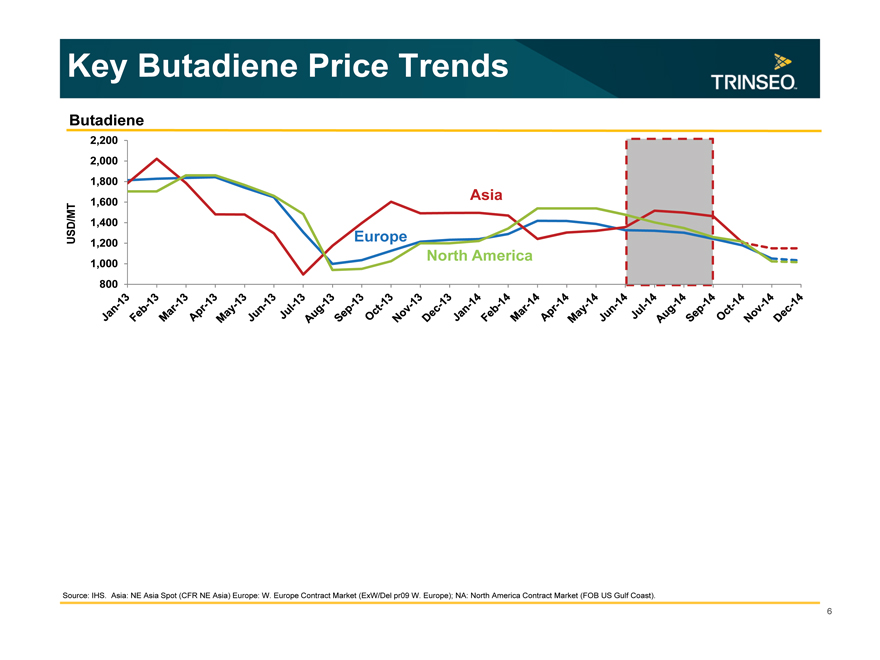
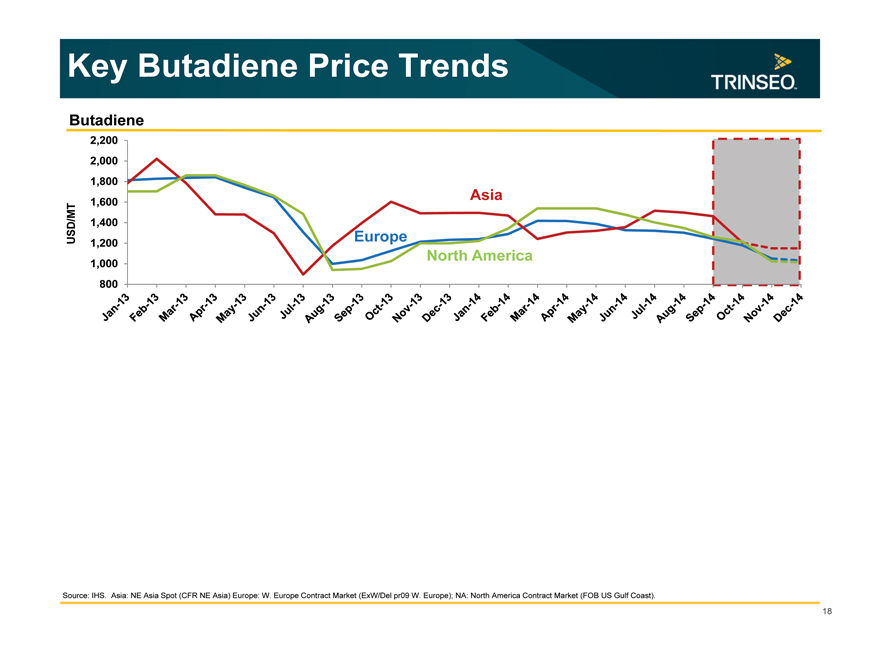
Key Butadiene Price Trends
Butadiene
USD/MT
2,200 2,000 1,800 1,600 1,400 1,200 1,000 800
Jan-13 Feb-13 Mar-13 Apr-13 May-13 Jun-13 Jul-13 Aug-13 Sep-13 Oct-13 Nov-13 Dec-13
Jan-14 Feb-14 Mar-14 Apr-14 May-14 Jun-14 Jul-14 Aug-14 Sep-14 Oct-14 Nov-14 Dec-14
Asia
Europe
North America
Source: IHS. Asia: NE Asia Spot (CFR NE Asia) Europe: W. Europe Contract Market (ExW/Del pr09 W. Europe); NA: North America Contract Market (FOB US Gulf Coast).
6
Financial Review
John Feenan EVP & CFO
™ Trademark
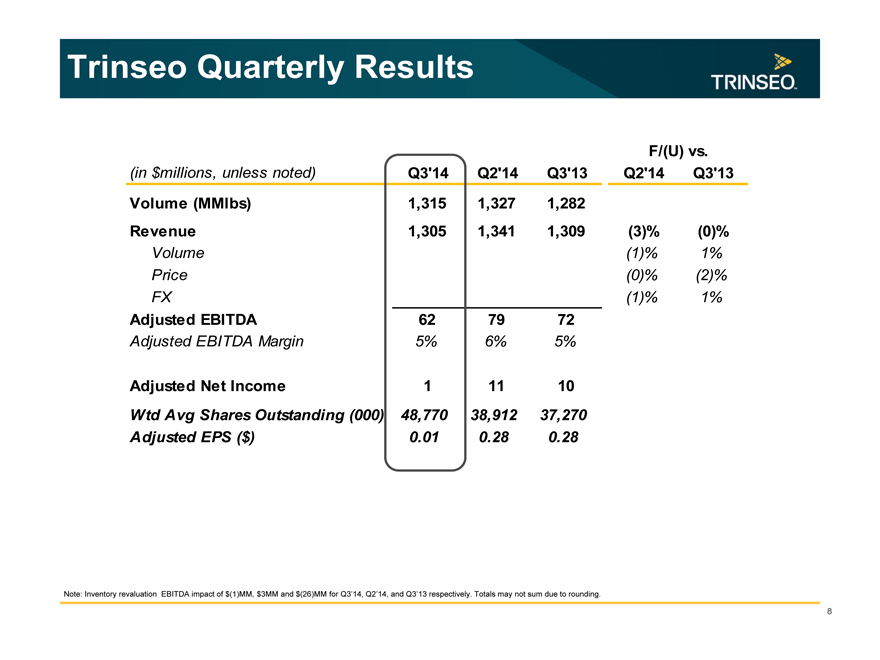
Trinseo Quarterly Results
F/(U) vs.
(in $millions, unless noted) Q3’14 Q2’14 Q3’13 Q2’14 Q3’13
Volume (MMlbs) 1,315 1,327 1,282
Revenue 1,305 1,341 1,309 (3)% (0)%
Volume (1)% 1%
Price (0)% (2)%
FX (1)% 1%
Adjusted EBITDA 62 79 72
Adjusted EBITDA Margin 5% 6% 5%
Adjusted Net Income 1 11 10
Wtd Avg Shares Outstanding (000) 48,770 38,912 37,270
Adjusted EPS ($) 0.01 0.28 0.28
Note: Inventory revaluation EBITDA impact of $(1)MM, $3MM and $(26)MM for Q3’14, Q2’14, and Q3’13 respectively. Totals may not sum due to rounding.
8
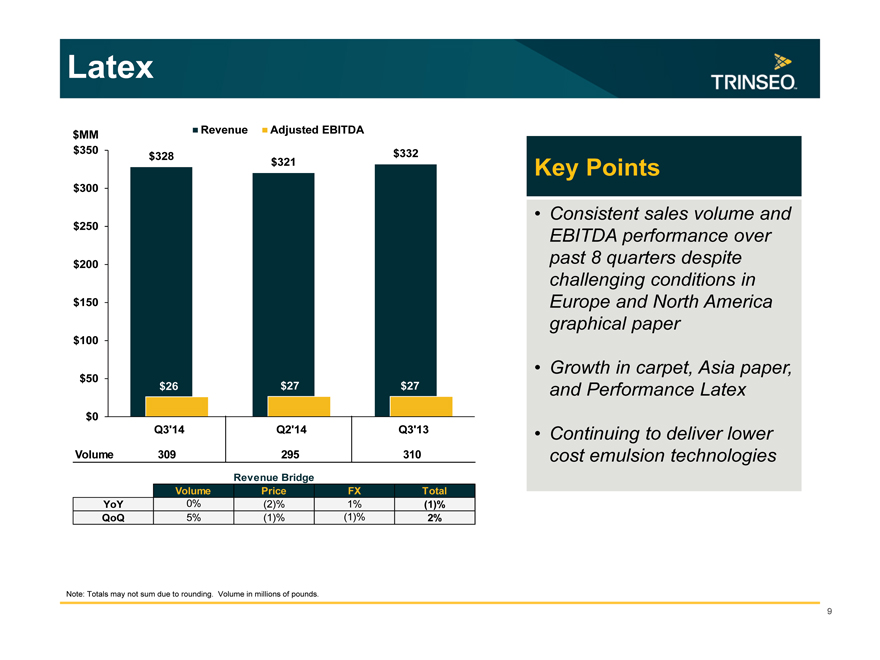
Latex
$MM $350
$300 $250 $200 $150 $100 $50 $0
Revenue Adjusted EBITDA
$328 $332 $321
$26 $27 $27 Q3’14 Q2’14 Q3’13
Volume 309 295 310
Revenue Bridge
Volume Price FX Total
YoY 0% (2)% 1% (1)%
QoQ 5% (1)% (1)% 2%
Key Points
Consistent sales volume and EBITDA performance over past 8 quarters despite challenging conditions in Europe and North America graphical paper
Growth in carpet, Asia paper, and Performance Latex
Continuing to deliver lower cost emulsion technologies
Note: Totals may not sum due to rounding. Volume in millions of pounds.
9
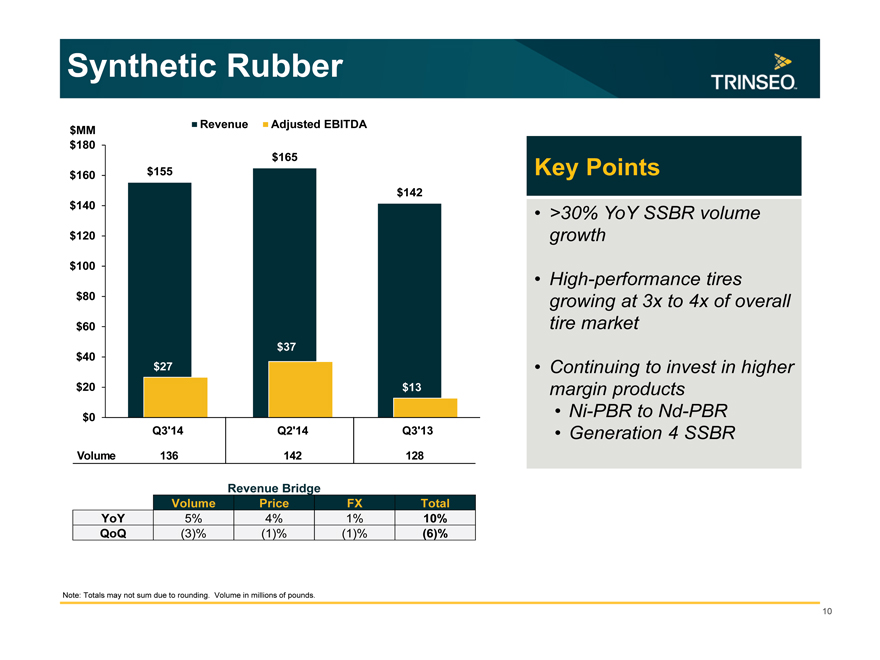
Synthetic Rubber
Revenue Adjusted EBITDA
$MM $180
$160 $140 $120 $100 $80 $60 $40 $20 $0
$165 $155 $142
$37 $27 $13
Q3’14 Q2’14 Q3’13
Volume 136 142 128
Revenue Bridge
Volume Price FX Total
YoY 5% 4% 1% 10%
QoQ (3)% (1)% (1)% (6)%
Key Points
>30% YoY SSBR volume growth
High-performance tires growing at 3x to 4x of overall tire market
Continuing to invest in higher margin products
Ni-PBR to Nd-PBR
Generation 4 SSBR
Note: Totals may not sum due to rounding. Volume in millions of pounds.
10
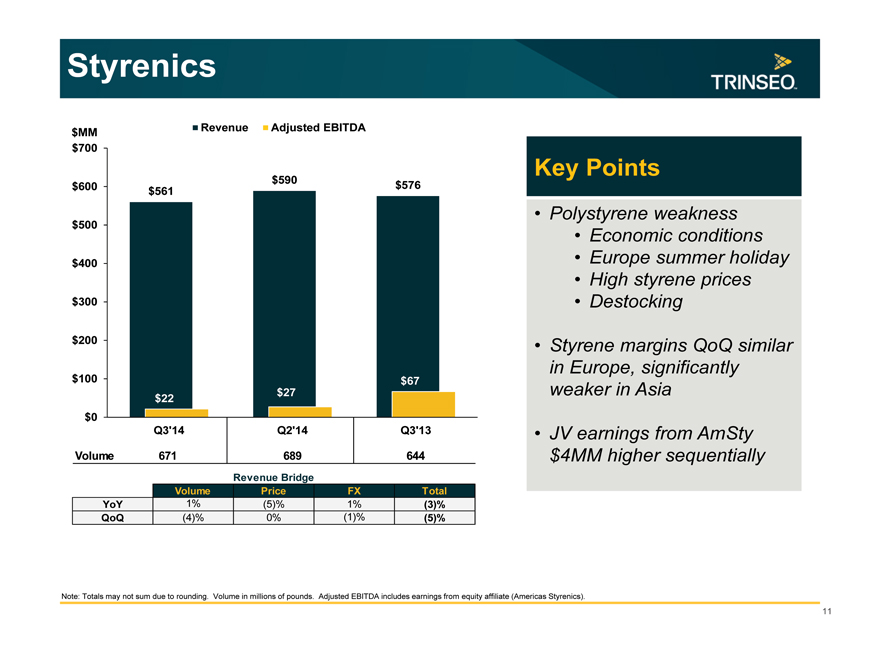
Styrenics
$MM Revenue Adjusted EBITDA
$700
$590
$600 $561 $576
$500
$400
$300
$200
$100 $67
$22 $27
$0
Q3’14 Q2’14 Q3’13
Volume 671 689 644
Revenue Bridge
Volume Price FX Total
YoY 1% (5)% 1% (3)%
QoQ (4)% 0% (1)% (5)%
Key Points
Polystyrene weakness
Economic conditions
Europe summer holiday
High styrene prices
Destocking
Styrene margins QoQ similar in Europe, significantly weaker in Asia
JV earnings from AmSty $4MM higher sequentially
Note: Totals may not sum due to rounding. Volume in millions of pounds. Adjusted EBITDA includes earnings from equity affiliate (Americas Styrenics).
11
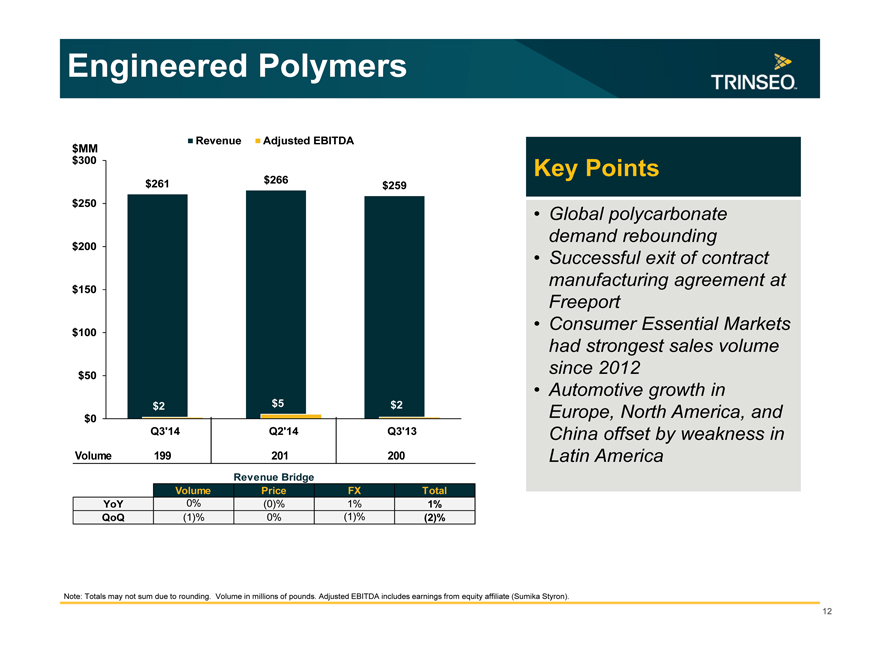
Engineered Polymers
Revenue Adjusted EBITDA
$MM
$300
$261 $266 $259
$250
$200
$150
$100
$50
$2 $5 $2
$0
Q3’14 Q2’14 Q3’13
Volume 199 201 200
Revenue Bridge
Volume Price FX Total
YoY 0% (0)% 1% 1%
QoQ (1)% 0% (1)% (2)%
Key Points
Global polycarbonate demand rebounding
Successful exit of contract manufacturing agreement at Freeport
Consumer Essential Markets had strongest sales volume since 2012
Automotive growth in Europe, North America, and China offset by weakness in Latin America
Note: Totals may not sum due to rounding. Volume in millions of pounds. Adjusted EBITDA includes earnings from equity affiliate (Sumika Styron).
12
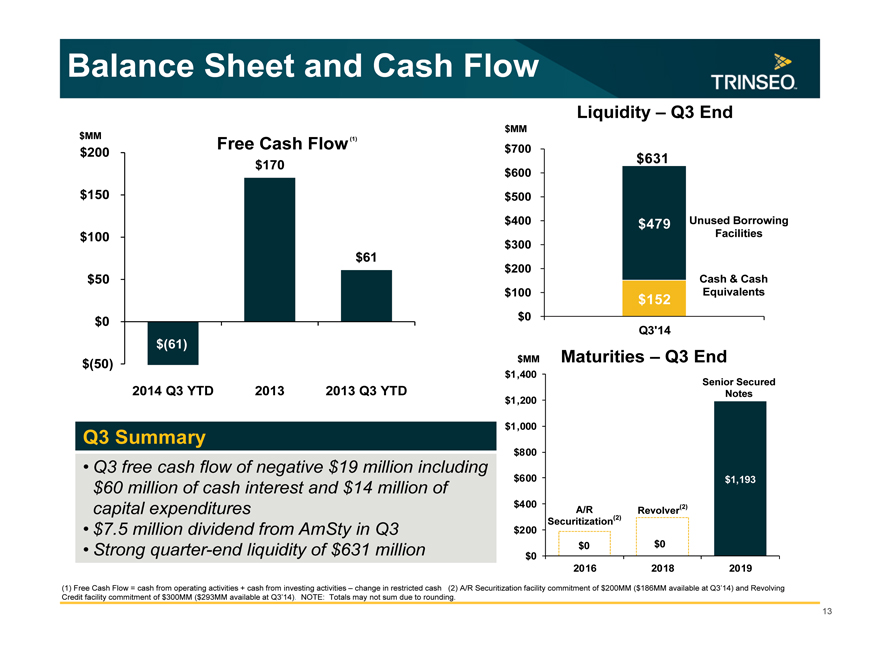
Balance Sheet and Cash Flow
$MM Free Cash Flow (1)
$200
$170
$150
$100
$61
$50
$0
$(61)
$(50)
2014 Q3 YTD 2013 2013 Q3 YTD
Q3 Summary
Q3 free cash flow of negative $19 million including $60 million of cash interest and $14 million of capital expenditures
$7.5 million dividend from AmSty in Q3
Strong quarter-end liquidity of $631 million
Liquidity – Q3 End
$MM
$700
$631
$600
$500
$400 $479 Unused Borrowing
Facilities
$300
$200
Cash & Cash
$100 Equivalents
$152
$0
Q3’14
$MM Maturities – Q3 End
$1,400
Senior Secured
$1,200 Notes
$1,000
$800
$600 $1,193
$400 (2)
A/R Revolver
Securitization(2)
$200
$0 $0
$0
2016 2018 2019
(1) Free Cash Flow = cash from operating activities + cash from investing activities – change in restricted cash (2) A/R Securitization facility commitment of $200MM ($186MM available at Q3’14) and Revolving Credit facility commitment of $300MM ($293MM available at Q3’14). NOTE: Totals may not sum due to rounding.
13
2014 Focus
Chris Pappas President & CEO
™ Trademark
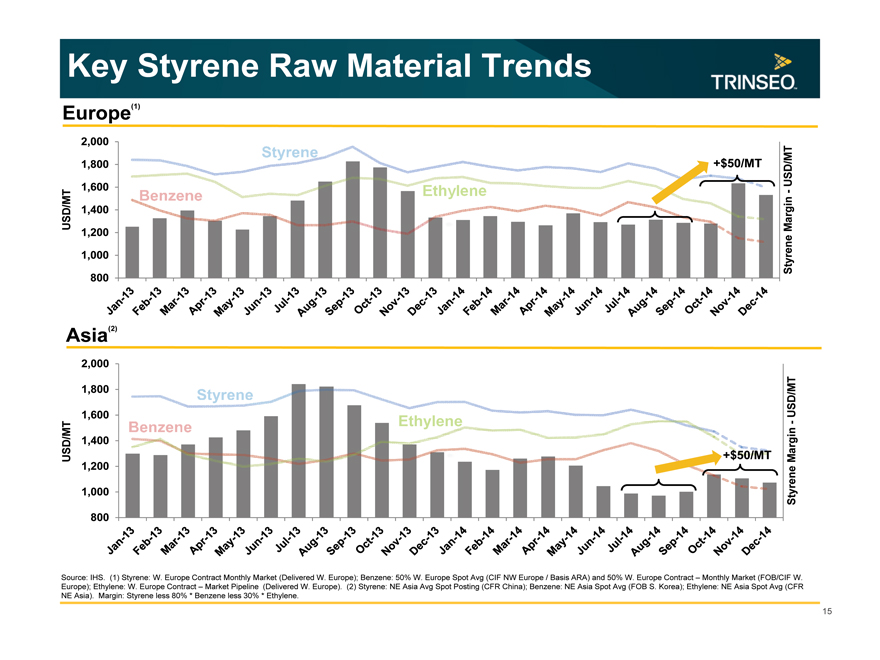
Key Styrene Raw Material Trends
Europe(1)
2,000
Benzene Styrene Ethylene
1,800 +$50/MT USD/MT
1,600
-
1,400
1,200
1,000 Styrene Margin - USD/MT
800
Jan-13 Feb-13 Mar-13 Apr-13 May-13 Jun-13 Jul-13 Aug-13 Sep-13 Oct-13 Nov-13 Dec-13
Jan-14 Feb-14 Mar-14 Apr-14 May-14 Jun-14 Jul-14 Aug-14 Sep-14 Oct-14 Nov-14 Dec-14
Asia(2)
2,000
1,800 USD/MT
1,600
Ethylene
1,400
+$50/MT
1,200
1,000 Styrene
Margin - USD/MT
800
Jan-13 Feb-13 Mar-13 Apr-13 May-13 Jun-13 Jul-13 Aug-13 Sep-13 Oct-13 Nov-13 Dec-13
Jan-14 Feb-14 Mar-14 Apr-14 May-14 Jun-14 Jul-14 Aug-14 Sep-14 Oct-14 Nov-14 Dec-14
Benzene Styrene
Source: IHS. (1) Styrene: W. Europe Contract Monthly Market (Delivered W. Europe); Benzene: 50% W. Europe Spot Avg (CIF NW Europe / Basis ARA) and 50% W. Europe Contract – Monthly Market (FOB/CIF W. Europe); Ethylene: W. Europe Contract – Market Pipeline (Delivered W. Europe). (2) Styrene: NE Asia Avg Spot Posting (CFR China); Benzene: NE Asia Spot Avg (FOB S. Korea); Ethylene: NE Asia Spot Avg (CFR NE Asia). Margin: Styrene less 80% * Benzene less 30% * Ethylene.
15
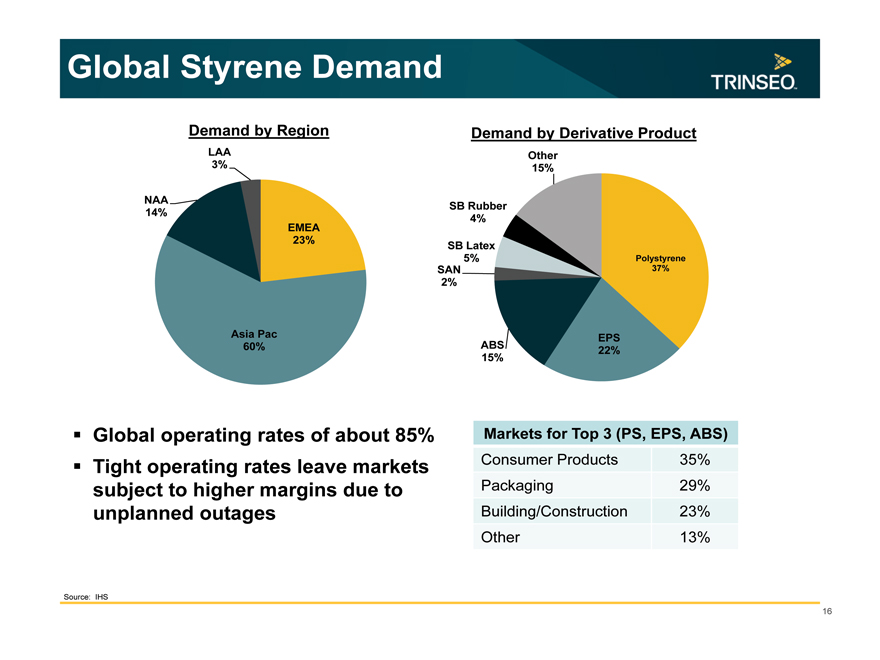
Global Styrene Demand
Demand by Region Demand by Derivative Product
LAA Other
3% 15%
NAA SB Rubber
14% 4%
EMEA
23% SB Latex
5% Polystyrene
SAN 37%
2%
Asia Pac EPS
60% ABS 22%
15%
Global operating rates of about 85% Tight operating rates leave markets subject to higher margins due to unplanned outages
Markets for Top 3 (PS, EPS, ABS)
Consumer Products 35%
Packaging 29%
Building/Construction 23%
Other 13%
Source: IHS
16
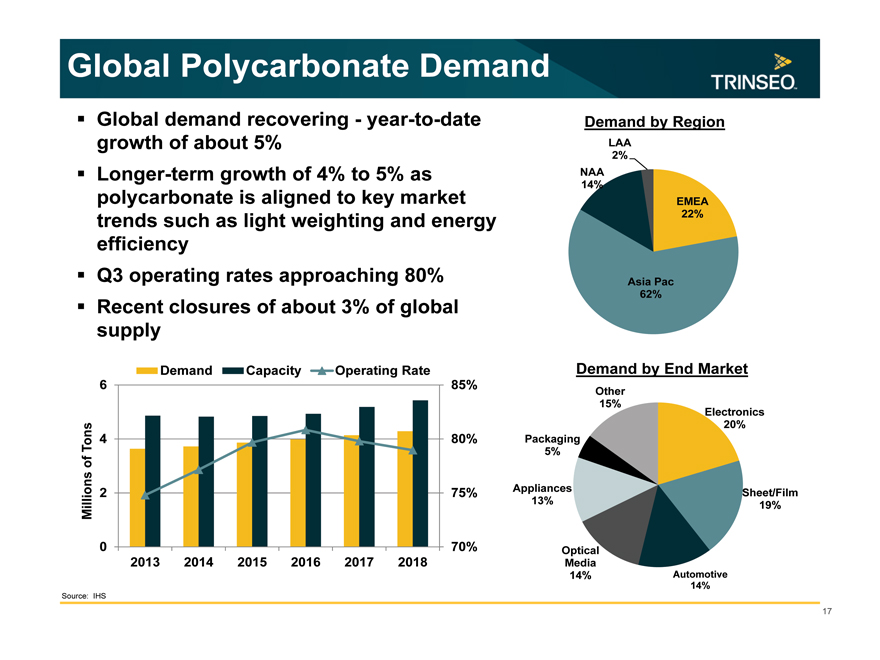
Global Polycarbonate Demand
Global demand recovering—year-to-date growth of about 5% Longer-term growth of 4% to 5% as polycarbonate is aligned to key market trends such as light weighting and energy efficiency Q3 operating rates approaching 80% Recent closures of about 3% of global supply
Demand Capacity Operating Rate
6 85%
Tons 4 80%
of
Millions 2 75%
0 70%
2013 2014 2015 2016 2017 2018
Demand by Region
LAA
2%
NAA
14%
EMEA
22%
Asia Pac
62%
Demand by End Market
Other
15%
Electronics
20%
Packaging
5%
Appliances Sheet/Film
13% 19%
Optical
Media
14% Automotive
14%
Source: IHS
17
Key Butadiene Price Trends
Butadiene
2,200
2,000
1,800
1,600 Asia
1,400
USD/MT Europe
1,200
1,000 North America
800
Jan-13 Feb-13 Mar-13 Apr-13 May-13 Jun-13 Jul-13 Aug-13 Sep-13 Oct-13 Nov-13 Dec-13
Jan-14 Feb-14 Mar-14 Apr-14 May-14 Jun-14 Jul-14 Aug-14 Sep-14 Oct-14 Nov-14 Dec-14
Source: IHS. Asia: NE Asia Spot (CFR NE Asia) Europe: W. Europe Contract Market (ExW/Del pr09 W. Europe); NA: North America Contract Market (FOB US Gulf Coast).
18
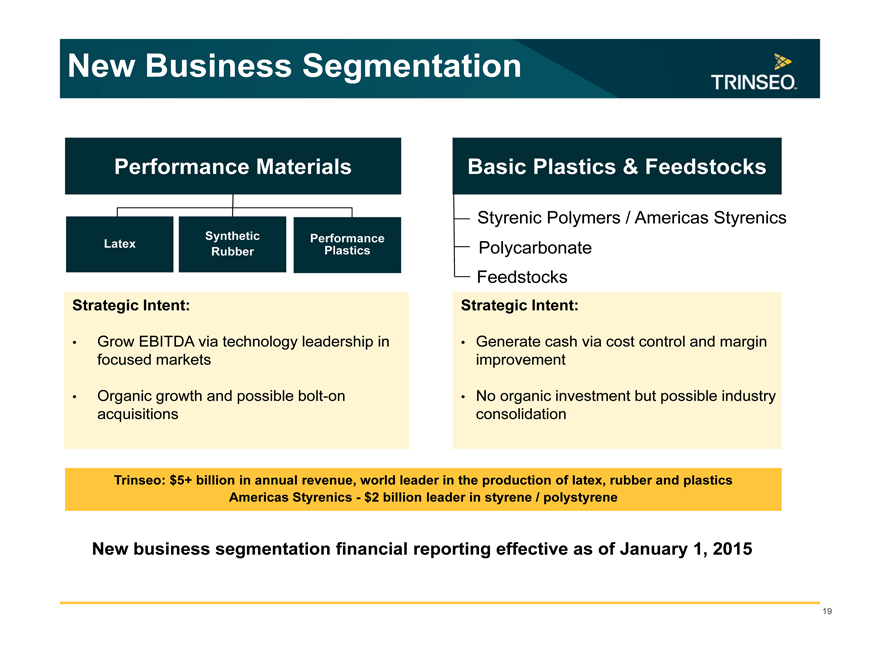
New Business Segmentation
Performance Materials
Latex Synthetic Performance
Rubber Plastics
Strategic Intent:
Grow EBITDA via technology leadership in focused markets
Organic growth and possible bolt-on acquisitions
Basic Plastics & Feedstocks
Styrenic Polymers / Americas Styrenics Polycarbonate Feedstocks
Strategic Intent:
Generate cash via cost control and margin improvement
No organic investment but possible industry consolidation
Trinseo: $5+ billion in annual revenue, world leader in the production of latex, rubber and plastics Americas Styrenics—$2 billion leader in styrene / polystyrene
New business segmentation financial reporting effective as of January 1, 2015
19
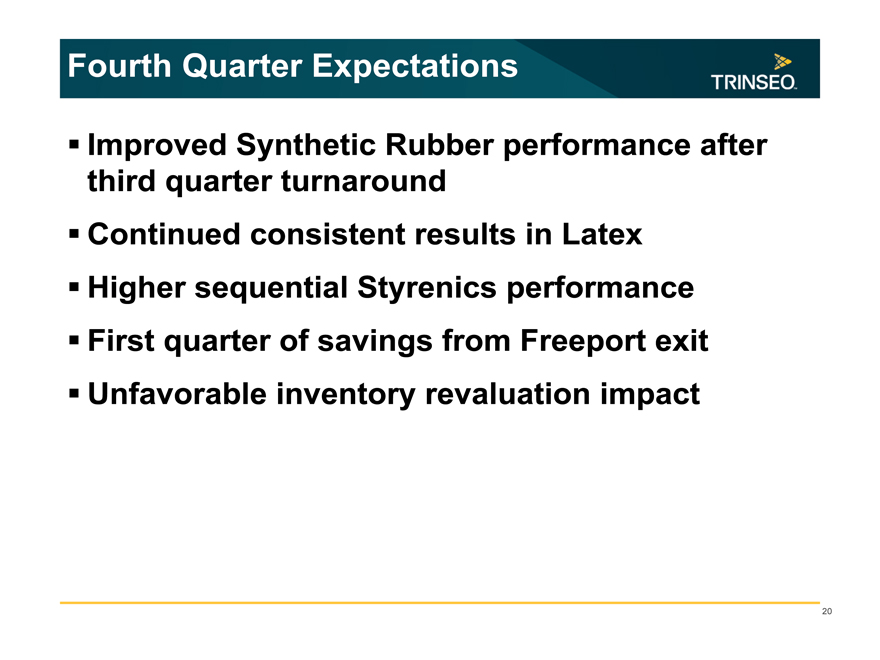
Fourth Quarter Expectations
Improved Synthetic Rubber performance after third quarter turnaround Continued consistent results in Latex Higher sequential Styrenics performance First quarter of savings from Freeport exit Unfavorable inventory revaluation impact
20
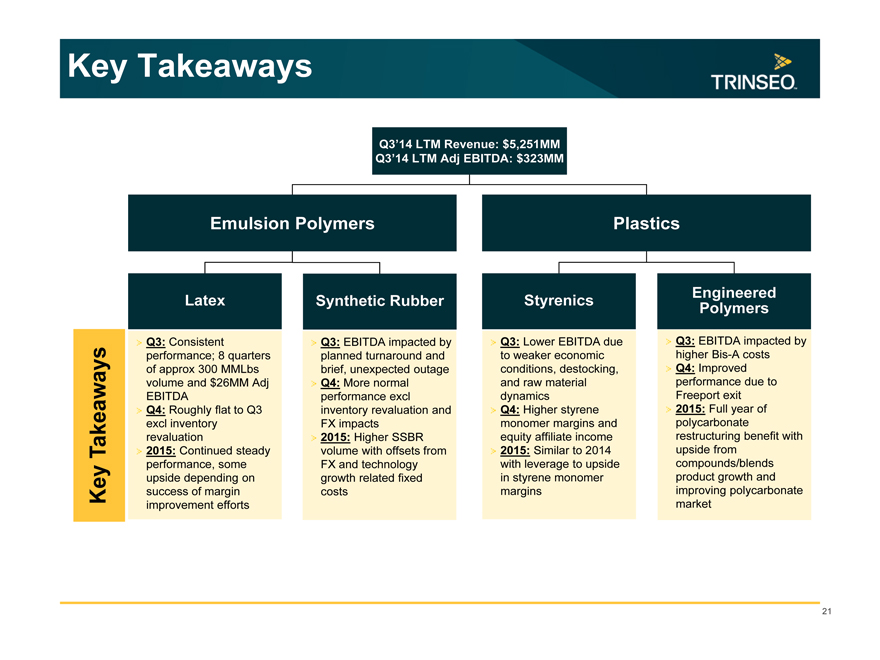
Key Takeaways
Q3’14 LTM Revenue: $5,251MM Q3’14 LTM Adj EBITDA: $323MM
Emulsion Polymers
Plastics
Latex Synthetic Rubber Styrenics
Engineered Polymers
Key Takeaways
Q3: Consistent performance; 8 quarters of approx 300 MMLbs volume and $26MM Adj EBITDA
Q4: Roughly flat to Q3 excl inventory revaluation 2015: Continued steady performance, some upside depending on success of margin improvement efforts
Q3: EBITDA impacted by planned turnaround and brief, unexpected outage Q4: More normal performance excl inventory revaluation and FX impacts 2015: Higher SSBR volume with offsets from FX and technology growth related fixed costs
Q3: Lower EBITDA due to weaker economic conditions, destocking, and raw material dynamics Q4: Higher styrene monomer margins and equity affiliate income 2015: Similar to 2014 with leverage to upside in styrene monomer margins
Q3: EBITDA impacted by higher Bis-A costs Q4: Improved performance due to Freeport exit 2015: Full year of polycarbonate restructuring benefit with upside from compounds/blends product growth and improving polycarbonate market
21
Q&A
™ Trademark
Appendix
™ Trademark
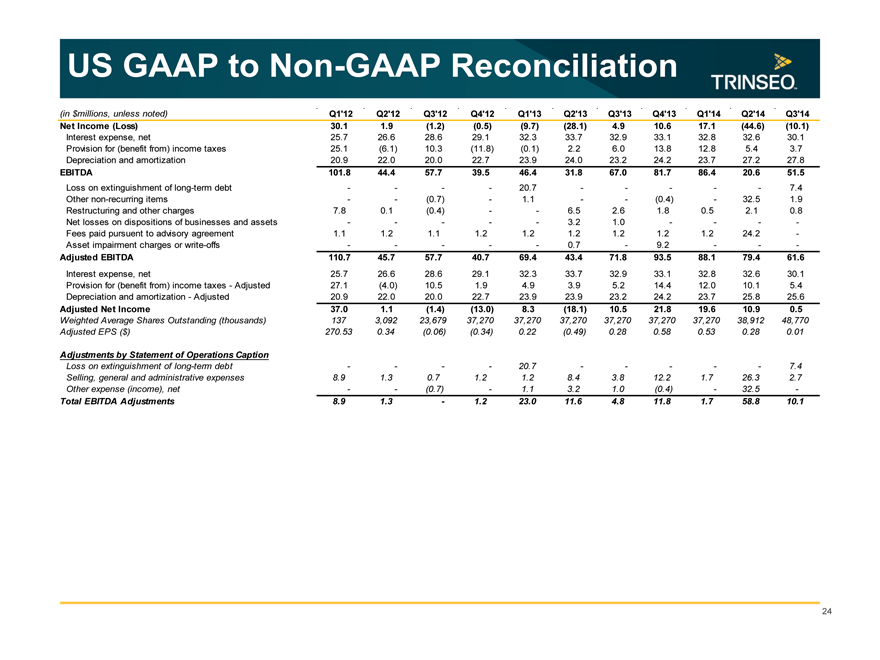
US GAAP to Non-GAAP Reconciliation
(in $millions, unless noted) Q1’12 Q2’12 Q3’12 Q4’12 Q1’13 Q2’13 Q3’13 Q4’13 Q1’14 Q2’14 Q3’14
Net Income (Loss) 30.1 1.9 (1.2) (0.5) (9.7) (28.1) 4.9 10.6 17.1 (44.6) (10.1)
Interest expense, net 25.7 26.6 28.6 29.1 32.3 33.7 32.9 33.1 32.8 32.6 30.1
Provision for (benefit from) income taxes 25.1 (6.1) 10.3 (11.8) (0.1) 2.2 6.0 13.8 12.8 5.4 3.7
Depreciation and amortization 20.9 22.0 20.0 22.7 23.9 24.0 23.2 24.2 23.7 27.2 27.8
EBITDA 101.8 44.4 57.7 39.5 46.4 31.8 67.0 81.7 86.4 20.6 51.5
Loss on extinguishment of long-term debt ———— 20.7 ————— 7.4
Other non-recurring items —— (0.7) — 1.1 —— (0.4) — 32.5 1.9
Restructuring and other charges 7.8 0.1 (0.4) —— 6.5 2.6 1.8 0.5 2.1 0.8
Net losses on dispositions of businesses and assets ————— 3.2 1.0 ——— -
Fees paid pursuent to advisory agreement 1.1 1.2 1.1 1.2 1.2 1.2 1.2 1.2 1.2 24.2 -
Asset impairment charges or write-offs ————— 0.7 — 9.2 —— -
Adjusted EBITDA 110.7 45.7 57.7 40.7 69.4 43.4 71.8 93.5 88.1 79.4 61.6
Interest expense, net 25.7 26.6 28.6 29.1 32.3 33.7 32.9 33.1 32.8 32.6 30.1
Provision for (benefit from) income taxes—Adjusted 27.1 (4.0) 10.5 1.9 4.9 3.9 5.2 14.4 12.0 10.1 5.4
Depreciation and amortization—Adjusted 20.9 22.0 20.0 22.7 23.9 23.9 23.2 24.2 23.7 25.8 25.6
Adjusted Net Income 37.0 1.1 (1.4) (13.0) 8.3 (18.1) 10.5 21.8 19.6 10.9 0.5
Weighted Average Shares Outstanding (thousands) 137 3,092 23,679 37,270 37,270 37,270 37,270 37,270 37,270 38,912 48,770
Adjusted EPS ($) 270.53 0.34 (0.06) (0.34) 0.22 (0.49) 0.28 0.58 0.53 0.28 0.01
Adjustments by Statement of Operations Caption
Loss on extinguishment of long-term debt ———— 20.7 ————— 7.4
Selling, general and administrative expenses 8.9 1.3 0.7 1.2 1.2 8.4 3.8 12.2 1.7 26.3 2.7
Other expense (income), net —— (0.7) — 1.1 3.2 1.0 (0.4) — 32.5 -
Total EBITDA Adjustments 8.9 1.3 — 1.2 23.0 11.6 4.8 11.8 1.7 58.8 10.1
24
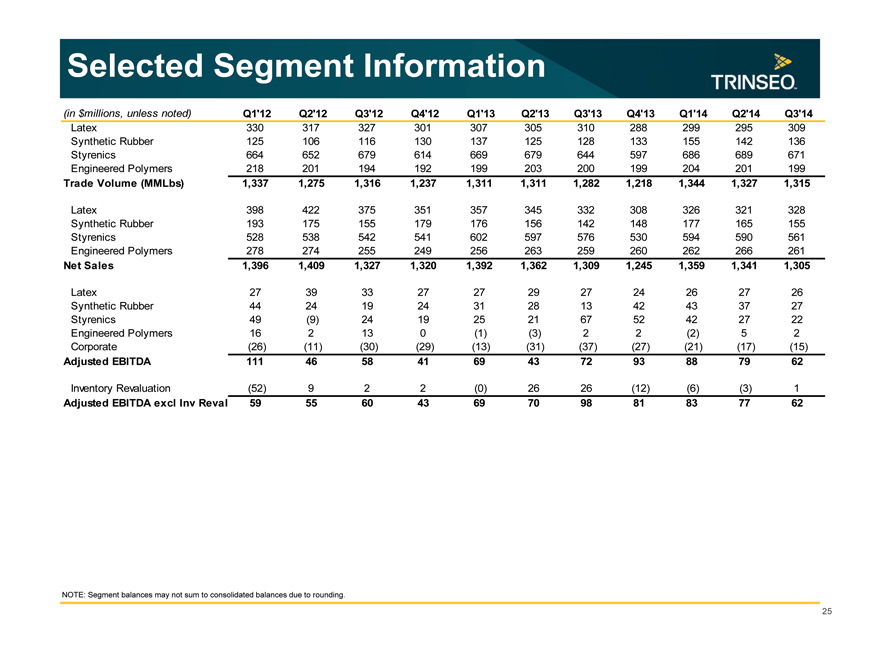
Selected Segment Information
(in $millions, unless noted) Q1’12 Q2’12 Q3’12 Q4’12 Q1’13 Q2’13 Q3’13 Q4’13 Q1’14 Q2’14 Q3’14
Latex 330 317 327 301 307 305 310 288 299 295 309
Synthetic Rubber 125 106 116 130 137 125 128 133 155 142 136
Styrenics 664 652 679 614 669 679 644 597 686 689 671
Engineered Polymers 218 201 194 192 199 203 200 199 204 201 199
Trade Volume (MMLbs) 1,337 1,275 1,316 1,237 1,311 1,311 1,282 1,218 1,344 1,327 1,315
Latex 398 422 375 351 357 345 332 308 326 321 328
Synthetic Rubber 193 175 155 179 176 156 142 148 177 165 155
Styrenics 528 538 542 541 602 597 576 530 594 590 561
Engineered Polymers 278 274 255 249 256 263 259 260 262 266 261
Net Sales 1,396 1,409 1,327 1,320 1,392 1,362 1,309 1,245 1,359 1,341 1,305
Latex 27 39 33 27 27 29 27 24 26 27 26
Synthetic Rubber 44 24 19 24 31 28 13 42 43 37 27
Styrenics 49 (9) 24 19 25 21 67 52 42 27 22
Engineered Polymers 16 2 13 0 (1) (3) 2 2 (2) 5 2
Corporate (26) (11) (30) (29) (13) (31) (37) (27) (21) (17) (15)
Adjusted EBITDA 111 46 58 41 69 43 72 93 88 79 62
Inventory Revaluation (52) 9 2 2 (0) 26 26 (12) (6) (3) 1
Adjusted EBITDA excl Inv Reval 59 55 60 43 69 70 98 81 83 77 62
NOTE: Segment balances may not sum to consolidated balances due to rounding.
25