 ™ Trademark Citi Basic Materials Conference December 2, 2014 Exhibit 99.2 |
 2 Introductions & Disclosure Rules Disclosure Rules The forward looking statements contained in this presentation involve risks and uncertainties that may affect the Company's operations, markets, products, services, prices and other factors. These risks and uncertainties include, but are not limited to, economic, competitive, legal, governmental and technological factors. Accordingly, there is no assurance that the Company's expectations expressed in such forward looking statements will be realized. The Company assumes no obligation to provide revisions to any forward looking statements in this presentation should circumstances change. This presentation contains financial measures that are not in accordance with generally accepted accounting principles in the US (“GAAP”) including Adjusted EBITDA. We believe these measures provide relevant and meaningful information to investors and lenders about the ongoing operating results of the Company. Such measures when referenced herein should not be viewed as an alternative to GAAP measures of performance. We have provided a reconciliation of Adjusted EBITDA in the Appendix section of this presentation. Introductions Chris Pappas, President & CEO David Stasse, Vice President, Treasury & Investor Relations |
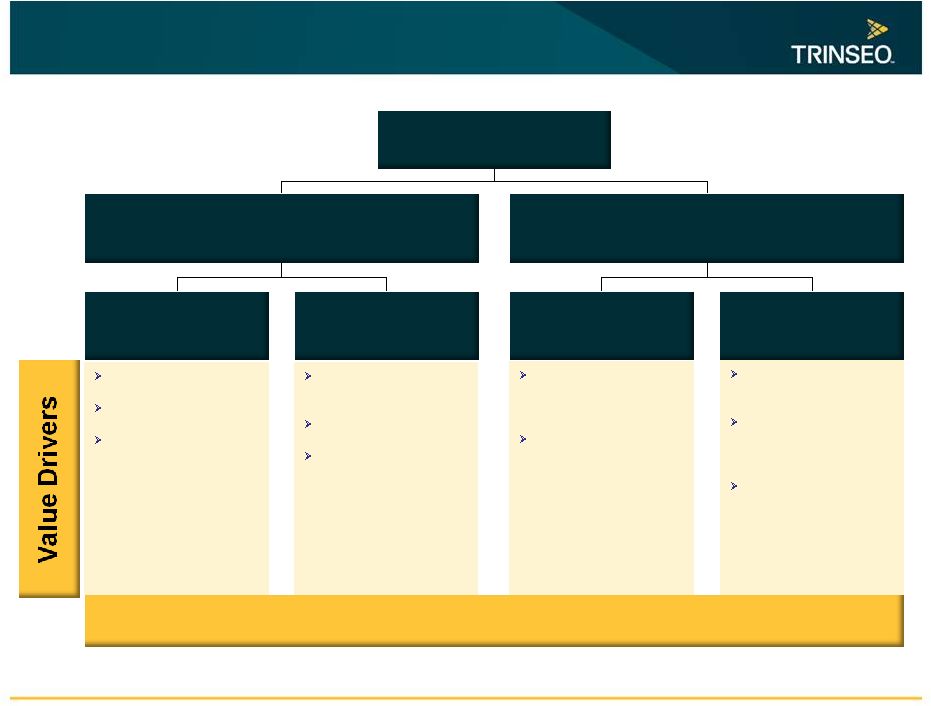 Investment Thesis 3 Engineered Polymers Styrenics Emulsion Polymers Revenue: $1,928MM Adj EBITDA: $252MM Plastics Revenue: $3,323MM Adj EBITDA: $149MM Synthetic Rubber Q3’14 LTM Revenue: $5,251MM Q3’14 LTM Adj EBITDA: $323MM Latex Consistent performance Strong cash generation Growth in Asia, carpet, performance latex Leveraged to high growth, performance tire market Incremental capacity Favorable mix shift Higher operating rate leading to improved margins Capacity rationalization Growing compounding business $35MM polycarbonate restructuring savings in 2015 Cyclical upside to improving polycarbonate market Note: Division and Segment EBITDA excludes Corporate unallocated Q3 ’14 LTM Adjusted EBITDA of $(79)MM. Totals may not sum due to rounding. Deleveraging, Refinancing to Meaningfully Reduce Cash Interest |
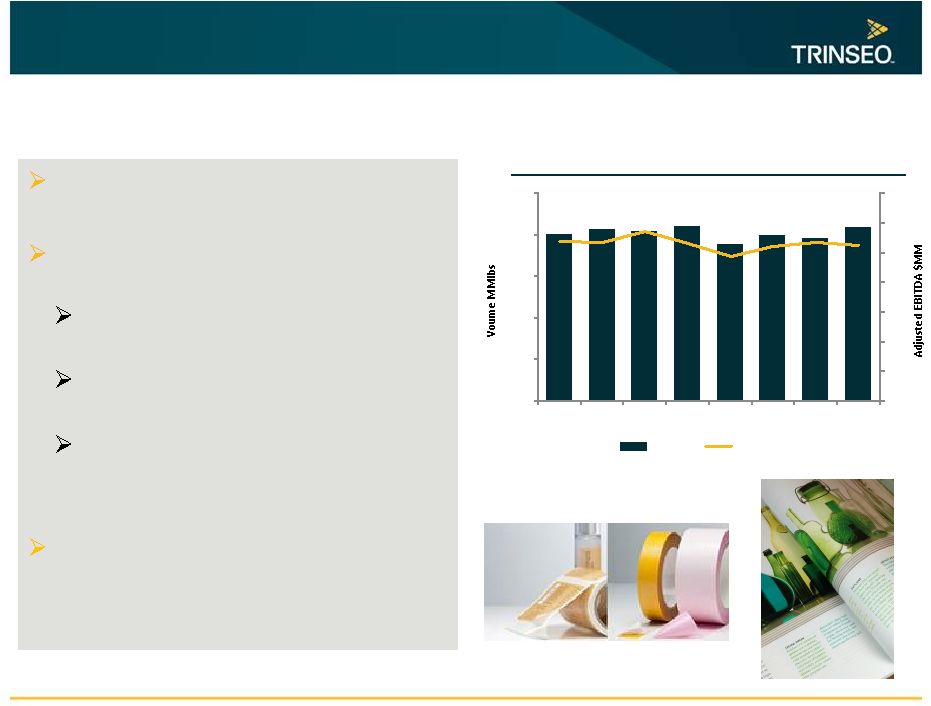 4 Latex Consistent results Three areas of focus: paper & board, carpet, and performance latex Growing carpet, paper board, Asia paper, performance latex Challenged paper markets in NA and Europe Additional TSE capacity in China in mid-2015 Cost advantaged technologies Volume / EBITDA 0 5 10 15 20 25 30 35 100 150 200 250 300 350 Q4 12 Q1 13 Q2 13 Q3 13 Q4 13 Q1 14 Q2 14 Q3 14 Volume Adj EBITDA |
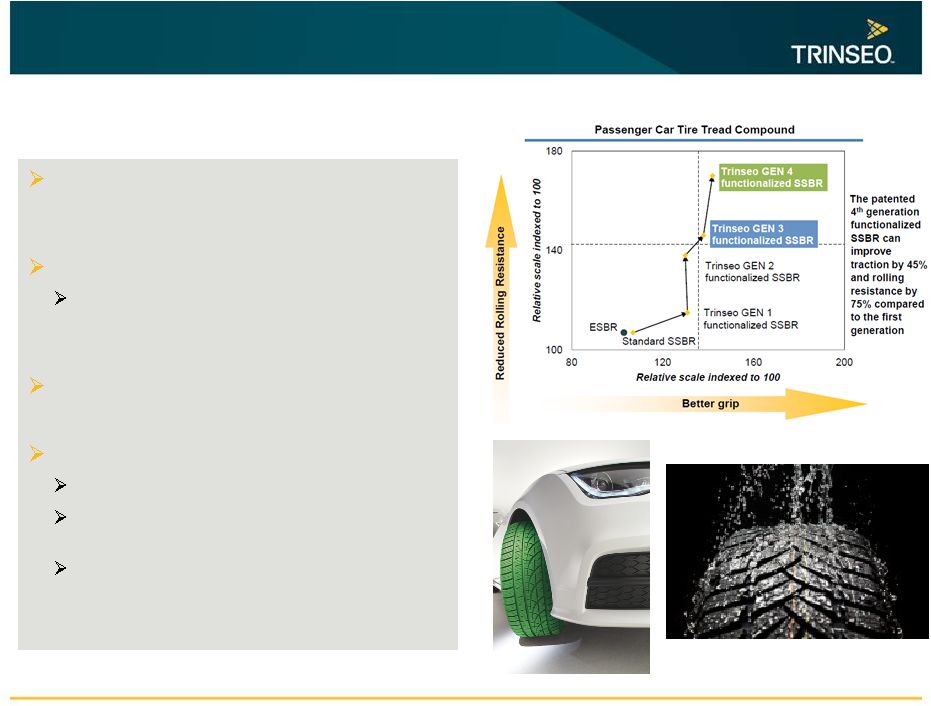 5 Synthetic Rubber Focused on high growth, performance tire market Technology leader in SSBR Provides superior tread properties such as wet grip, low rolling resistance, reduced noise Mix shift toward higher end products Investing in growth Purchased 25kt of capacity rights from JSR Converting Ni-PBR train to Nd-PBR to address demand for high performance tire walls Trialing Generation 4 enhanced SSBR |
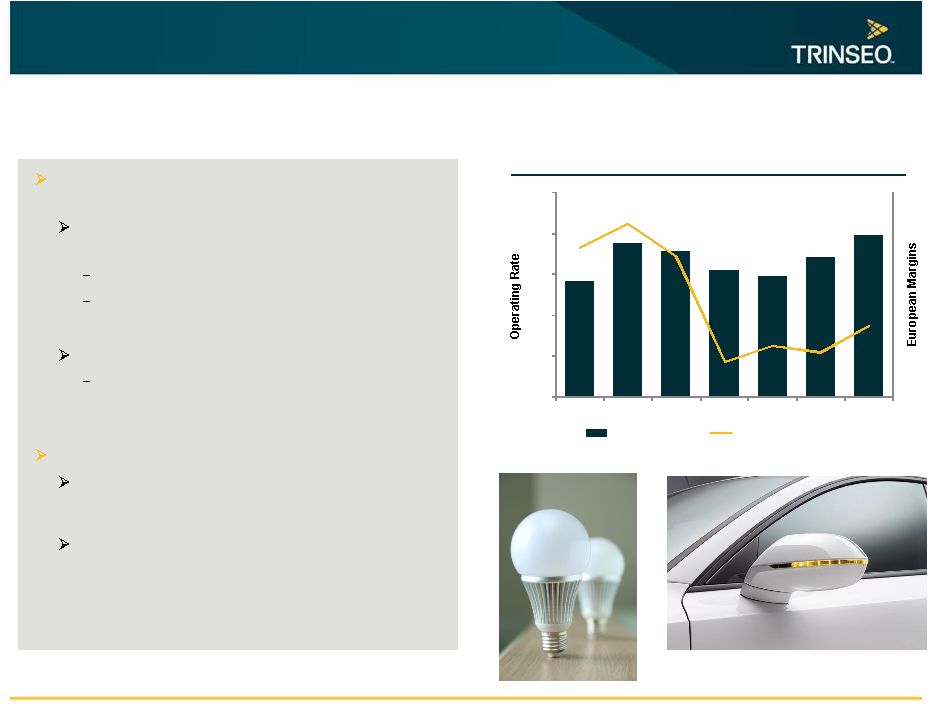 6 Engineered Polymers Source: IHS Growing demand for high-tech plastics focused on automotive and other growth markets Sustainable, long-standing relationships with automotive industry leaders Manufacturing facilities across four continents Focused on weight reduction, interior aesthetics Highly engineered compounds and blends Serves consumer electronics, medical, and electrical / lighting markets (CEM) Polycarbonate 2014 YTD global demand growth up 5% Operating rates approaching 80% Polycarbonate 74% 79% 78% 76% 75% 77% 80% 60% 65% 70% 75% 80% 85% 2009 2010 2011 2012 2013 2014 2015 Operating Rate European Margins |
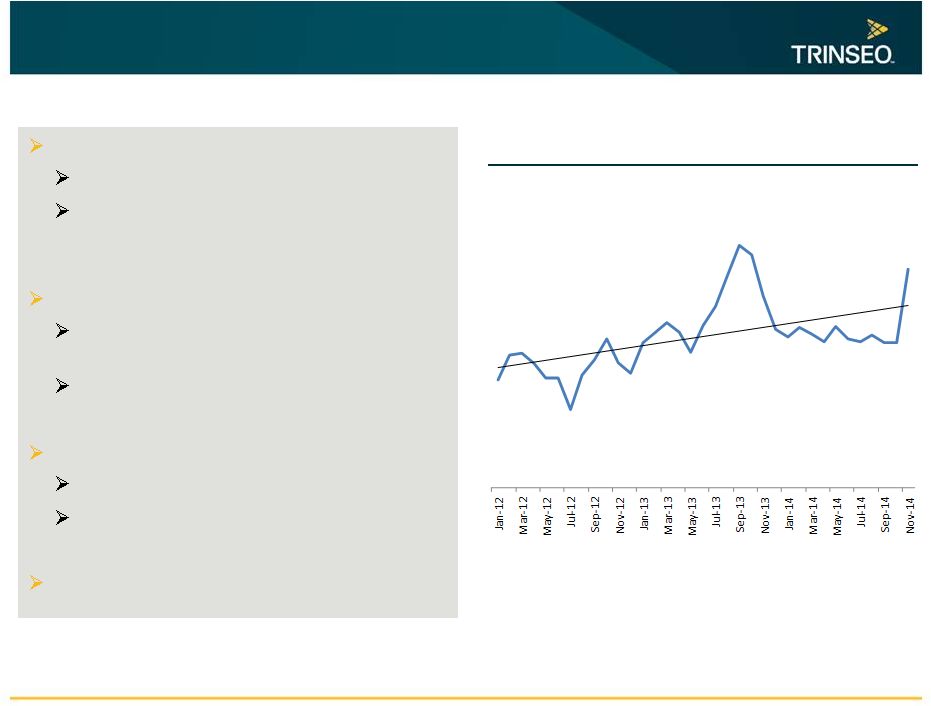 7 Styrenics Evolving industry structure New players focused on SM and PS margins Capacity rationalization and cyclical recovery will increase operating rates Styrenic polymers business with global scale Focused on appliances, packaging, and constructions Number 3 polystyrene globally Tightening styrene operating rates Leading to higher styrene margins Margin upside with outage-driven spikes Americas Styrenics provided $35mm in LTM dividends Source: IHS Europe Styrene Spread Over Raw Materials |
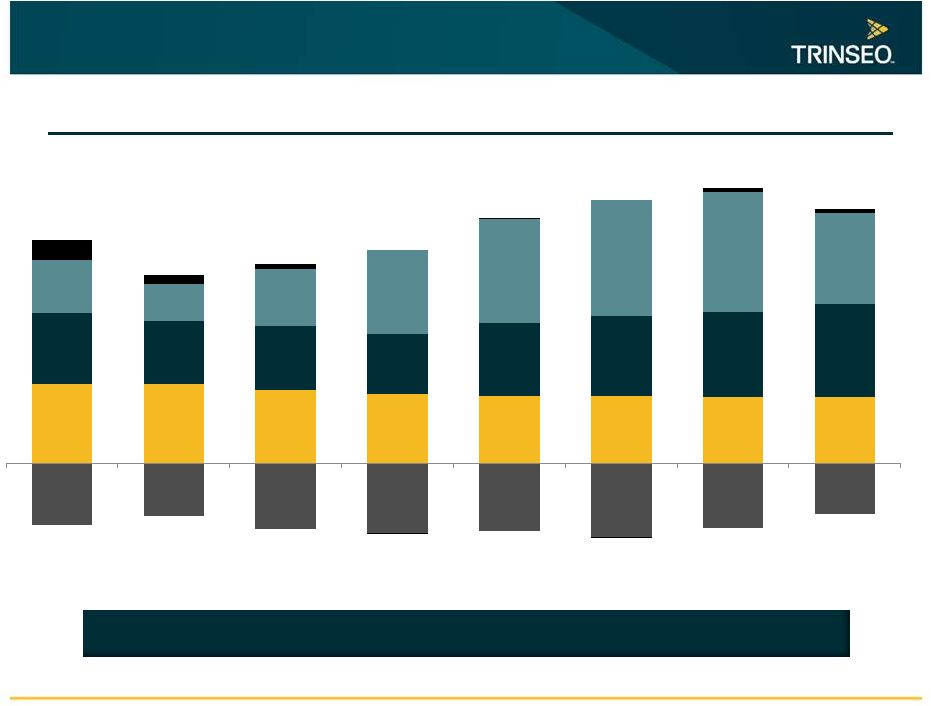 LTM Q4 2012 LTM Q1 2013 LTM Q2 2013 LTM Q3 2013 LTM Q4 2013 LTM Q1 2014 LTM Q2 2014 LTM Q3 2014 $255 $214 $211 $225 $278 $297 $333 $323 8 Financial Overview Source: see appendix for reconciliation to nearest GAAP metric Historical Quarterly Adjusted EBITDA Strong earnings momentum driven by growth in Synthetic Rubber, stable Latex business; full $35MM Polycarbonate savings in 2015 Styrenics Synthetic Rubber Latex Corp. Eng Polymers (millions) |
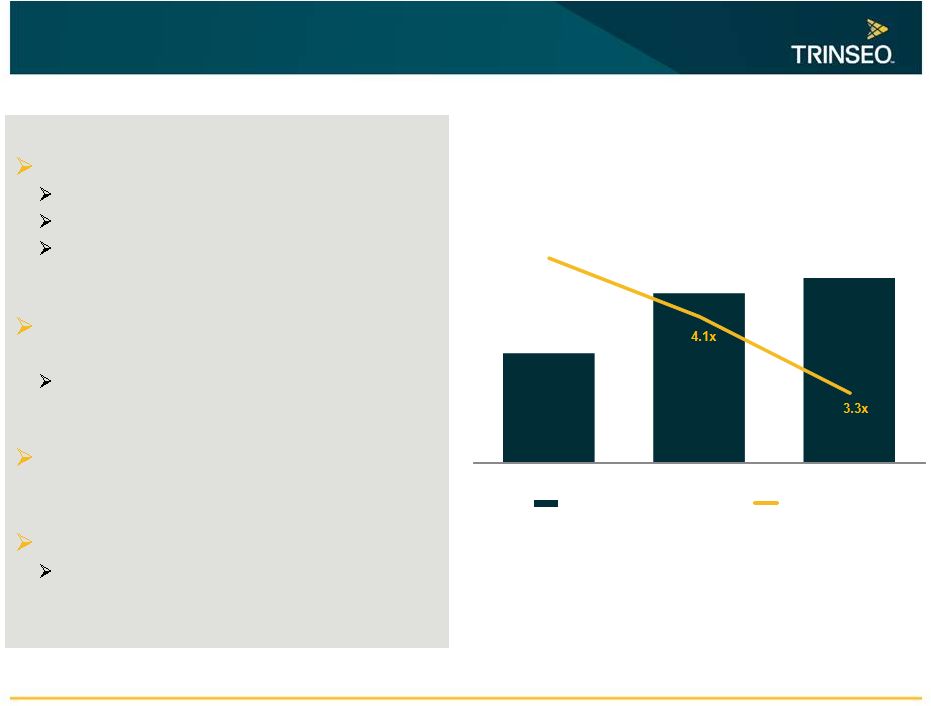 9 Cash Generation / Balance Sheet Consistent cash generation Focus on deleveraging Modest capex Growth opportunities to be pursued selectively Ability to refinance up to $1.193 billion of Senior Notes Potential to significantly lower interest costs (currently 8.75% coupon) Strong balance sheet with no long- term debt maturities until 2019 $631 million liquidity as of Q3 end Cash ($152MM), Revolver ($293MM), AR Facility ($186MM) 143 223 242 4.7x 2012 2013 Q3 14 LTM Adj EBITDA less Capex ($MM) Leverage Ratio |
 Value Drivers Structural • Polycarbonate restructuring • Deleveraging and refinancing • Consolidation and capacity rationalization Profitable Growth • Additional SSBR capacity • New SSBR and neodymium-PBR technology • China latex expansion • Automotive and CEM compounding Cyclical • Rising operating rates in styrene, polystyrene, polycarbonate • Macro recovery 10 |
 Appendix ™ Trademark |
 12 US GAAP to Non-GAAP Reconciliation Note: totals may not sum due to rounding Adj EBITDA and Net Income Reconciliation (in $millions, unless noted) Q4'12 LTM Q1'13 LTM Q2'13 LTM Q3'13 LTM Q4'13 LTM Q1'14 LTM Q2'14 LTM Q3'14 LTM Net Income (Loss) 30.3 (9.4) (39.5) (33.3) (22.2) 4.5 (12.0) (27.0) Interest expense, net 110.0 116.6 123.7 128.0 132.0 132.5 131.4 128.6 Provision for (benefit from) income taxes 17.5 (7.7) 0.6 (3.7) 21.9 34.7 38.0 35.6 Depreciation and amortization 85.6 88.5 90.6 93.8 95.3 95.1 98.3 102.9 EBITDA 243.4 187.9 175.3 184.7 226.9 266.8 255.7 240.1 Loss on extinguishment of long-term debt - 20.7 20.7 20.7 20.7 - - 7.4 Other non-recurring items (0.7) 0.5 0.5 1.1 0.7 (0.4) 32.1 34.0 Restructuring and other charges 7.4 (0.4) 6.0 9.0 10.8 11.3 7.0 5.2 Net (gains) / losses on dispositions of businesses and assets - - 3.2 4.2 4.2 4.2 1.0 0.0 Fees paid pursuent to advisory agreement 4.6 4.7 4.7 4.8 4.7 4.7 27.8 26.6 Asset impairment charges or write-offs - - 0.7 0.7 9.9 9.9 9.2 9.2 Adjusted EBITDA 254.8 213.5 211.2 225.3 278.1 296.8 332.8 322.5 |
 13 Selected Segment Information Note: totals may not sum due to rounding (in $millions, unless noted) Q1'12 Q2'12 Q3'12 Q4'12 Q1'13 Q2'13 Q3'13 Q4'13 Q1'14 Q2'14 Q3'14 2012 2013 2014 YTD Latex 330 317 327 301 307 305 310 288 299 295 309 1,275 1,210 904 Synthetic Rubber 125 106 116 130 137 125 128 133 155 142 136 477 523 433 Styrenics 664 652 679 614 669 679 644 597 686 689 671 2,608 2,588 2,047 Engineered Polymers 218 201 194 192 199 203 200 199 204 201 199 804 801 603 Trade Volume (MMLbs) 1,337 1,275 1,316 1,237 1,311 1,311 1,282 1,218 1,344 1,327 1,315 5,165 5,122 3,986 Latex 398 422 375 351 357 345 332 308 326 321 328 1,545 1,341 975 Synthetic Rubber 193 175 155 179 176 156 142 148 177 165 155 702 622 497 Styrenics 528 538 542 541 602 597 576 530 594 590 561 2,149 2,305 1,745 Engineered Polymers 278 274 255 249 256 263 259 260 262 266 261 1,056 1,038 788 Net Sales 1,396 1,409 1,327 1,320 1,392 1,362 1,309 1,245 1,359 1,341 1,305 5,452 5,307 4,006 Latex 27 39 33 27 27 29 27 24 26 27 26 125 106 79 Synthetic Rubber 44 24 19 24 31 28 13 42 43 37 27 111 113 107 Styrenics 49 (9) 24 19 25 21 67 52 42 27 22 83 165 91 Engineered Polymers 16 2 13 0 (1) (3) 2 2 (2) 5 2 32 0 5 Corporate (26) (11) (30) (29) (13) (31) (37) (27) (21) (17) (15) (96) (107) (52) Adjusted EBITDA 111 46 58 41 69 43 72 93 88 79 62 255 278 229 Inventory Revaluation (52) 9 2 2 (0) 26 26 (12) (6) (3) 1 (38) 40 (7) Adjusted EBITDA excl Inv Reval 59 55 60 43 69 70 98 81 83 77 62 217 318 222 |