EXHIBIT 99.2
Management’s Discussion and Analysis of Financial Condition and Results of Operations
Overview
We are a leading global materials company engaged in the manufacturing and marketing of synthetic rubber, latex, and plastics, including various specialty and technologically differentiated products. We have leading market positions in many of the markets in which we compete. We believe we have developed these strong market positions due to our technological differentiation, diverse global manufacturing base, long-standing customer relationships, commitment to sustainable solutions and competitive cost positions. We believe that growth in overall consumer spending and construction activity, increased demand in the automotive industry for higher fuel efficiency and lighter-weight materials, and improving living standards in emerging markets will result in growth in the global markets in which we compete. In addition, we believe our increasing business presence in developing regions such as China, Southeast Asia, Latin America and Eastern Europe further enhances our prospects.
We develop synthetic rubber, latex, and plastics products that are incorporated into a wide range of our customers’ products throughout the world, including tires and other products for automotive applications, carpet and artificial turf backing, coated paper and packaging board, food service packaging, appliances, medical devices, consumer electronics and construction applications, among others. We seek to regularly develop new and improved products and processes, supported by our strong patent portfolio, designed to enhance our customers’ product offerings. We have long-standing relationships with a diverse base of global customers, many of whom are leaders in their markets and rely on us for formulation, technological differentiation, and compounding expertise to find sustainable solutions for their businesses. Many of our products represent only a small portion of a finished product’s production costs, but provide critical functionality to the finished product and are often specifically developed to customer specifications. We believe these product traits result in substantial customer loyalty for our products.
Until January 1, 2015, we operated in four reporting segments: Latex, Synthetic Rubber, Styrenics and Engineered Polymers. Effective January 1, 2015, we reorganized our business under two new divisions called Performance Materials and Basic Plastics & Feedstocks. The Performance Materials division now includes the following reporting segments: Synthetic Rubber, Latex, and Performance Plastics. The Basic Plastics & Feedstocks division represents a separate segment for financial reporting purposes and includes styrenic polymers, polycarbonate, or PC, and styrene monomer. In addition, the Basic Plastics & Feedstocks division includes the results of our two 50%-owned joint ventures, Americas Styrenics LLC, or Americas Styrenics, and Sumika Styron Polycarbonate Limited, or Sumika Styron Polycarbonate. The following chart provides an overview of our new organizational structure.
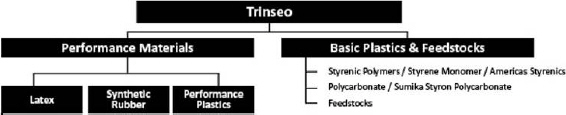
We believe that this new organizational structure better reflects the nature of our Company by grouping together segments with similar strategies, business drivers and operating characteristics. Our two new divisions are of similar size in terms of sales, but have different margin profiles, different strategic focus, different value drivers and different operating requirements. By organizing the Company in this way, we believe that we can manage and operate more effectively in order to accelerate the growth of our Performance Materials division and improve the profitability of our Basic Plastics & Feedstocks division. We also believe that this new organizational structure allows our investors to better understand the drivers of our business.
Management’s Discussion and Analysis of Financial Condition and Results of Operations has been recast from its previous presentation to reflect the Company’s new organizational structure.
Our major products include: styrene-butadiene latex, or SB latex, and styrene-acrylate latex, or SA latex, in our Latex segment; solution styrene-butadiene rubber, or SSBR, lithium polybutadiene rubber, or Li-PBR, emulsion styrene-butadiene rubber, or ESBR, and nickel polybutadiene rubber, or Ni-PBR, in our Synthetic Rubber segment; highly engineered compounds and blends products for automotive end markets, as well as consumer electronics, medical, and lighting, which we collectively call consumer essential markets (CEM) in our Performance Plastics segment; and PC, polystyrene, acrylonitrile-butadiene styrene, or ABS, and styrene-acrylonitrile, or SAN, in our Basic Plastics & Feedstocks segment.
We have significant manufacturing and production operations around the world, which allows us to serve our global customer base. As of December 31, 2014, our production facilities included 34 manufacturing plants (which included a total of 81 production
1
units) at 26 sites across 14 countries, including joint ventures and contract manufacturers. Our manufacturing locations include sites in high-growth emerging markets such as China, Indonesia and Brazil. Additionally, as of December 31, 2014 we operated 11 R&D facilities globally, including mini plants, development centers and pilot coaters, which we believe are critical to our global presence and innovation capabilities.
For the years ended December 31, 2014, 2013, and 2012, we generated approximately $5.1 billion in net sales and $67.3 million in net losses, $5.3 billion in net sales and $22.2 million in net losses, and $5.5 billion in net sales and $30.3 million in net income, respectively.
Industry Trends
We believe demand for our products is strongly correlated to growth in our customers’ end markets, which are expected to grow along with anticipated rising gross domestic product and industrial production. We believe growth in our markets is supported by improving living standards in emerging markets, the globalization of automotive platforms, improving fuel efficiency and the increasing demand for light-weight materials and upgraded automotive interior materials as well as wide-spread growth in the need for high performance lightweight materials for the electronics industry. We believe we are well-positioned to take advantage of these trends. For example, improving living standards are driving demand for coated paper in emerging markets, particularly in China. We have a leading SB latex position in China. As another example, we are following our current automotive customers to emerging markets with plans to supply them locally as part of their strategy to globalize automotive car platforms. In addition, in synthetic rubber, increasing fuel efficiency regulation is driving demand for SSBR, a key material for high-performance tires. We have a leading European market position in advanced SSBR, and have recently expanded capacity at our Schkopau, Germany facility.
We believe our business will continue to benefit from improving market dynamics in our industry. Companies have rationalized higher-cost capacity in many of our key product lines and there have been a number of consolidation activities, particularly in styrene, polystyrene, and SB latex. We believe that our markets will continue to experience a long-term trend towards consolidation which will create opportunities for our business given our scale and geographic reach. Developments in the market for certain of our raw materials have a substantial impact on our business.
2014 Highlights
In February 2014, the Company announced plans to add an additional 25 kMT of SB latex capacity at our facility in Zhangjiagang, China, which we expect to become operational in the second quarter of 2015 and will represent a 33% increase in our SB latex capacity in China. This expansion will allow us to capitalize on the expected growth in demand for latex in China’s paper and paperboard industry, forecast to grow in the next five years.
In March 2014, the Company entered into an agreement with material supplier JSR to acquire its current production capacity rights at the Company’s rubber production facility in Schkopau, Germany for a purchase price of €19.0 million (approximately $26.1 million). Prior to this agreement, JSR held 50% of the capacity rights of one of the Company’s three SSBR production trains in Schkopau. As a result, effective March 31, 2014, the Company had full capacity rights to this production train, enabling us to increase our capabilities to serve the global tire market.
In April 2014, the Company completed the sale of a portion of our land at our manufacturing site in Livorno, Italy for a purchase price of €4.95 million (approximately $6.8 million). This sale had no significant impact on the ongoing operations of the Company, but provided an opportunity to generate additional cash flows for the Company.
Also in April 2014, the Company announced plans for the conversion of our Ni-PBR production train in Schkopau, Germany, to neodymium polybutadiene rubber (“Nd-PBR”), which we expect to be completed and operational in the fourth quarter of 2015. Nd-PBR is a synthetic rubber used mainly in the production of tires as well as in a variety of other applications such as industrial rubber goods and polymer modification. Nd-PBR in ultra-high performance tires allows for the increase of elasticity, endurance and durability which results in improved rolling resistance in tires. The Nd-PBR conversion will allow us to further grow our rubber business and broaden our product range.
On May 30, 2014, our affiliates entered into an agreement with Dow to terminate the Latex JV Option Agreement, eliminating Dow’s right to exercise their option, and all other obligations of the Company thereunder, in exchange for a termination payment thereon of $32.5 million.
During the second quarter of 2014, the Company announced a planned restructuring within our Basic Plastics & Feedstocks segment to exit the commodity market for polycarbonate in North America and to terminate its existing arrangements with Dow regarding manufacturing services for the Company at Dow’s Freeport, Texas facility. The Company also entered into a new long-term
2
supply contract with a third party to supply polycarbonate in North America. These revised arrangements became operational in the fourth quarter of 2014. In addition, the Company has executed revised supply contracts for certain raw materials that are processed at its polycarbonate manufacturing facility in Stade, Germany, which is expected to take effect beginning January 1, 2015. These revised agreements are expected to facilitate improvements in our future results of operations of our Basic Plastics & Feedstocks segment.
On June 17, 2014, the Company completed an initial public offering of 11,500,000 ordinary shares at a price of $19.00 per share, receiving cash proceeds of $203.2 million from this transaction, net of underwriting discounts. These net proceeds were primarily used by the Company in July 2014 to repay $132.5 million in aggregate principal amount of our 8.750% Senior Notes due 2019 at a call premium of 103%, together with accrued and unpaid interest thereon, along with certain related contract termination and offering expenses and general corporate purposes.
Factors Affecting Our Operating Results
The following discussion sets forth certain components of our statements of operations as well as factors that impact those items.
Net Sales
We generate revenue from the sale of our products across all major geographic areas. Our net sales include total sales less estimates for returns and price allowances. Price allowances include discounts for prompt payment as well as volume-based incentives.
Our overall net sales are generally impacted by the following factors:
| | • | | fluctuations in overall economic activity within the geographic markets in which we operate; |
| | • | | fluctuations in raw material input costs and our ability to pass those on to customers, including the effects of a generally 30 to 60-day delay (or greater) in changes to our product prices in our Latex segment, Synthetic Rubber segment, Performance Plastics segment, and parts of our Basic Plastics & Feedstocks segment following changes to the relevant raw material prices affect our sales margins; |
| | • | | underlying growth in one or more of our core end markets, either worldwide or in particular geographies in which we operate; |
| | • | | changes in the level of competition faced by our products, including the substitution by customers of alternative products to ours and the launch of new products by competitors; |
| | • | | the type of products used within existing customer applications, or the development of new applications requiring products similar to ours; |
| | • | | the “mix” of products sold, including the proportion of new or improved products and their pricing relative to existing products; |
| | • | | changes in product sales prices (including volume discounts and cash discounts for prompt payment); |
| | • | | our ability to successfully develop and launch new products and applications; and |
| | • | | fluctuations in foreign exchange rates. |
While the factors described above impact net sales in each of our segments, the impact of these factors can differ for each segment, as described below. For more information about risks relating to our business refer to Item 1A—Risk Factors, included within the Company’s Annual Report on Form 10-K for the year ended December 31, 2014.
Cost of Sales
Our cost of sales consists principally of the following:
| | • | | Production Materials Costs. The costs of the materials we use in production are the largest element of our overall cost of sales. We seek to use our substantial volumes and global geographic scope to obtain the most favorable terms we can, but our production material costs are affected by global and local market conditions. |
| | • | | Employee Costs. These employee costs include the salary costs and benefit charges for employees involved in our manufacturing operations. These costs generally increase on an aggregate basis as production volumes increase, but may decline as a percent of net sales as a result of economies of scale associated with higher production volumes. |
3
| | • | | Sustaining Engineering Activity Costs. These costs relate to modifications of existing products for use by new customers in familiar applications. |
| | • | | Depreciation and Amortization Expense. Property, plant, equipment and definite-lived intangible assets are stated at cost and depreciated on a straight-line basis over their estimated useful lives. Property, plant and equipment, including leasehold interests, and intangible assets acquired through the Acquisition were recorded at fair value on the acquisition date, resulting in a new cost basis for accounting purposes. |
| | • | | Other. Our remaining cost of sales consists of: |
| | • | | customer-related development costs; |
| | • | | other general manufacturing expenses, such as expenses for utilities and energy consumption. |
The main factors that influence our cost of sales as a percent of net sales include:
| | • | | changes in the price of raw materials, and timing of corresponding price changes to our customers, which impact our sales margins; |
| | • | | the implementation of cost control measures aimed at improving productivity, reductions of fixed production costs, refinements in inventory management and purchasing cost of raw materials; and |
| | • | | the impact of FIFO method inventory treatment. |
Selling, General and Administrative Expenses
Our selling, general and administrative, or SG&A, expense consists of all expenditures incurred in connection with the sale and marketing of our products, as well as administrative overhead costs, including:
| | • | | salary and benefit costs for sales personnel and administrative staff, including stock-based compensation expense. Expenses relating to our sales personnel generally increase or decrease principally with changes in sales volume due to the need to increase or decrease sales personnel to meet changes in demand. Expenses relating to administrative personnel generally do not increase or decrease directly with changes in sales volume; |
| | • | | other administrative expenses, including expenses related to logistics, information systems and legal and accounting services; |
| | • | | general advertising expenses; |
| | • | | research and development expenses; and |
| | • | | other selling expenses, such as expenses incurred in connection with travel and communications. |
Changes in SG&A expense as a percent of net sales have historically been impacted by a number of factors, including:
| | • | | changes in sales volume, as higher volumes enable us to spread the fixed portion of our administrative expense over higher sales; |
| | • | | changes in the mix of products we sell, as some products may require more customer support and sales effort than others; |
| | • | | changes in our customer base, as new customers may require different levels of sales and marketing attention; |
| | • | | new product launches in existing and new markets, as these launches typically involve more intense sales activity before they are integrated into customer applications; |
| | • | | customer credit issues requiring increases to the allowance for doubtful accounts; and |
| | • | | the implementation of cost control measures aimed at improving productivity. |
4
Interest Expense, Net
Interest expense, net consists primarily of interest expense on institutional borrowings and other financing obligations and changes in fair value of interest rate derivative instruments, when outstanding. Interest expense, net also includes the amortization of deferred financing fees and debt discount associated with our financing agreements offset by interest income primarily associated with cash-on-hand. Factors affecting interest expense include fluctuations in the market interest rate, our borrowing activities and our outstanding debt balances.
Provision for Income Taxes
We and our subsidiaries are subject to income tax in the various jurisdictions in which we operate. While the extent of our future tax liability is uncertain, the impact of acquisition accounting, changes to the debt and equity capitalization of our subsidiaries, and the realignment of the functions performed and risks assumed by the various subsidiaries are among the factors that will determine the future book and taxable income of the respective subsidiary and the Company as a whole.
Results of Operations
Results of Operations for the Years Ended December 31, 2014, 2013 and 2012
The tables below set forth our historical results of operations, and these results as a percentage of net sales for the periods indicated:
| | | | | | | | | | | | |
| | | Year Ended December 31, | |
| (in millions) | | 2014 | | | 2013 | | | 2012 | |
Net sales | | $ | 5,128.0 | | | $ | 5,307.4 | | | $ | 5,451.9 | |
Cost of sales | | | 4,830.6 | | | | 4,949.4 | | | | 5,115.2 | |
| | | | | | | | | | | | |
Gross profit | | | 297.4 | | | | 358.0 | | | | 336.7 | |
Selling, general and administrative expenses | | | 232.6 | | | | 216.9 | | | | 182.0 | |
Equity in earnings of unconsolidated affiliates | | | 47.7 | | | | 39.1 | | | | 27.1 | |
| | | | | | | | | | | | |
Operating income | | | 112.5 | | | | 180.2 | | | | 181.8 | |
Interest expense, net | | | 124.9 | | | | 132.0 | | | | 110.0 | |
Loss on extinguishment of long-term debt | | | 7.4 | | | | 20.7 | | | | — | |
Other expense, net | | | 27.8 | | | | 27.9 | | | | 24.0 | |
| | | | | | | | | | | | |
Income (loss) before income taxes | | | (47.6 | ) | | | (0.4 | ) | | | 47.8 | |
Provision for income taxes | | | 19.7 | | | | 21.8 | | | | 17.5 | |
| | | | | | | | | | | | |
Net income (loss) | | $ | (67.3 | ) | | $ | (22.2 | ) | | $ | 30.3 | |
| | | | | | | | | | | | |
| | | | | | | | | | | | |
| | | Year Ended December 31, | |
| | | 2014 | | | 2013 | | | 2012 | |
Net sales | | | 100.0 | % | | | 100.0 | % | | | 100.0 | % |
Cost of sales | | | 94.2 | % | | | 93.3 | % | | | 93.8 | % |
| | | | | | | | | | | | |
Gross profit | | | 5.8 | % | | | 6.7 | % | | | 6.2 | % |
Selling, general and administrative expenses | | | 4.5 | % | | | 4.1 | % | | | 3.3 | % |
Equity in earnings of unconsolidated affiliates | | | 0.9 | % | | | 0.7 | % | | | 0.5 | % |
| | | | | | | | | | | | |
Operating income | | | 2.2 | % | | | 3.3 | % | | | 3.4 | % |
Interest expense, net | | | 2.4 | % | | | 2.5 | % | | | 2.0 | % |
Loss on extinguishment of long-term debt | | | 0.1 | % | | | 0.4 | % | | | 0.0 | % |
Other expense, net | | | 0.5 | % | | | 0.5 | % | | | 0.4 | % |
| | | | | | | | | | | | |
Income (loss) before income taxes | | | (0.8 | )% | | | (0.1 | )% | | | 1.0 | % |
Provision for income taxes | | | 0.4 | % | | | 0.4 | % | | | 0.3 | % |
| | | | | | | | | | | | |
Net income (loss) | | | (1.2 | )% | | | (0.5 | )% | | | 0.7 | % |
| | | | | | | | | | | | |
5
Year Ended December 31, 2014 Compared to the Year Ended December 31, 2013
Net Sales
Net sales for 2014 decreased by $179.4 million, or 3.4%, to $5,128.0 million from $5,307.4 million in 2013. Of the 3.4% decrease in net sales, 4.3% was due to lower selling prices, which was partially offset by a favorable currency impact of approximately 0.3% as the U.S. dollar weakened compared to the euro and a 0.5% increase in sales volume driven by the Synthetic Rubber segment. The overall decrease in selling prices was primarily due to the pass through of lower butadiene costs to our customers in Latex and Synthetic Rubber and styrene monomer to our customers in Latex and Basic Plastics & Feedstocks.
Cost of Sales
Cost of sales for 2014 decreased by $118.8 million, or 2.4%, to $4,830.6 million from $4,949.4 million in 2013. Of the 2.4% decrease, 0.7% was attributable to lower prices for raw materials, primarily butadiene and styrene monomer, while an additional 2.0% decrease was due to volume mix, as we had a decrease in higher cost products partially offsetting the increase in lower cost products. These decreases were partially offset by an unfavorable currency impact of approximately 0.3% due to the weakening of the U.S. dollar compared to the euro.
Gross Profit
Gross profit for 2014 decreased by $60.6 million, or 16.9%, to $297.4 million from $358.0 million in 2013. The decrease was primarily attributable to lower margins in the Basic Plastics & Feedstocks segment, driven by a reduction in the spread on styrene monomer production compared to the prior year. This decrease was partially offset by higher volume and margins in Synthetic Rubber.
Selling, General and Administrative Expenses
SG&A expenses for 2014 increased by $15.7 million, or 7.2%, to $232.6 million from $216.9 million in 2013. The increase in SG&A expenses was primarily due to $23.3 million in termination fees paid related to the Advisory Agreement with Bain Capital which terminated upon consummation of the initial public offering, or IPO, on June 17, 2014, and $10.1 million of accelerated depreciation and decommissioning charges incurred in connection with the restructuring of part of our Basic Plastics & Feedstocks segment to exit the commodity market for polycarbonate in North America. These increases were partially offset by higher restructuring charges incurred during the year ended December 31, 2013 of approximately $10.8 million related to the shutdown of our latex facility in Altona, Australia compared to charges of $2.8 million in 2014 for this shutdown, as well as a non-recurring charge in 2013 of $9.2 million from the impairment of fixed assets at our polycarbonate manufacturing plant in Stade, Germany. Other offsetting decreases in expenses included incentive compensation and other normal operating costs. The above one-time charges are discussed in further detail in our notes to the consolidated financial statements.
Equity in Earnings of Unconsolidated Affiliates
Equity in earnings of unconsolidated affiliates for 2014 was $47.7 million compared to equity in earnings of $39.1 million for 2013. Americas Styrenics equity earnings increased to $50.3 million in 2014 from $39.4 million in 2013, due to stronger operating performance driven by improved market conditions. These increased earnings were offset by reductions in the equity earnings of Sumika Styron Polycarbonate which decreased to equity in net losses of $2.5 million in 2014 from equity in net losses of $0.3 million in 2013.
Interest Expense, Net
Interest expense, net for the year ended December 31, 2014 was $124.9 million compared to $132.0 million for the year ended December 31, 2013. The decrease of $7.1 million is primarily attributable to the redemption of $132.5 million in aggregate principal amount of the Senior Notes in July 2014 as well as lower average borrowings and outstanding principal balances on both the Revolving Facility and the Accounts Receivable Securitization Facility during the year ended December 31, 2014 compared to the year ended December 31, 2013.
Loss on Extinguishment of Long-Term Debt
Loss on extinguishment of long-term debt was $7.4 million for the year ended December 31, 2014, related to the redemption of $132.5 million in aggregate principal amount of the Senior Notes in July 2014, using proceeds from the Company’s IPO. This loss was comprised of a $4.0 million call premium and a $3.4 million write-off of related unamortized debt issuance costs.
6
Loss on extinguishment of debt was $20.7 million for the year ended December 31, 2013, related to the extinguishment of our $1,239.0 million Term Loans under our Senior Secured Credit Facility, which was comprised of the write-off of existing unamortized deferred financing fees and original issue discount attributable to the Term Loans totaling $14.4 million and $6.3 million, respectively.
Other Expense, net
Other expense, net for the year ended December 31, 2014 was $27.8 million, which included a $32.5 million payment made to Dow in connection with the termination of the Latex JV Option Agreement (see Note 18 in the consolidated financial statements), slightly offset by net foreign exchange transaction gains of $4.2 million and other income.
During the year ended December 31, 2014, the Company recorded foreign exchange transaction gains of $32.4 million primarily driven by the remeasurement of our euro denominated payables due to the strengthening of the U.S. dollar against the euro during the period. Separately, beginning in the third quarter of 2014, the Company entered into foreign exchange forward contracts and recorded related losses of approximately $28.2 million, largely offsetting the above described gains.
Other expense, net for the year ended December 31, 2013 was $27.9 million, which consisted primarily of a $4.2 million loss on the sale of our expandable polystyrene (“EPS”) business within our Basic Plastics & Feedstocks segment and $18.9 million foreign exchange transaction losses primarily driven by the remeasurement of our euro payables to the U.S. dollar. The remaining other expenses, net include value-added taxes of approximately $2.5 million and other expenses.
Provision for Income Taxes
Provision for income taxes for 2014 totaled $19.7 million resulting in a negative effective tax rate of 41.4%. Provision for income taxes for 2013 totaled $21.8 million resulting in a negative effective tax rate of 5,921.0%.
The decrease in provision for income taxes was driven by a reduction in income before taxes, from $0.4 million of loss for the year ended December 31, 2013 to $47.6 million of loss for the year ended December 31, 2014. This decrease in the provision for income taxes was partially offset by a lower proportion of income before taxes attributable to non-U.S. jurisdictions, where the statutory income tax rate is lower than the U.S. statutory income tax rate.
Although the Company had losses before income taxes of $47.6 million for the year ended December 31, 2014, approximately $134.1 million of losses were generated primarily within our holding companies incorporated in Luxembourg, which did not provide a tax benefit to the Company and therefore unfavorably impacted the effective tax rate during the period. Included in these losses were non-deductible interest and stock-based compensation expenses, as well as certain one-time non-deductible expenses, such as a $32.5 million charge related to an agreement with Dow to terminate the Latex JV Option Agreement and approximately $18.6 million of fees related to the termination of the Advisory Agreement with Bain Capital (see Note 18 in the consolidated financial statements). Comparatively, the effective income tax rate for the year ended December 31, 2013 was impacted by losses of $97.2 million which were generated primarily in within our holding companies incorporated in Luxembourg, related to non-deductible interest and stock-based compensation expense.
Partially offsetting this unfavorable impact to the effective tax rate was a tax benefit recognized during the year ended December 31, 2014, as the Company effectively settled its 2010 and 2011 audits with the IRS and received a refund of $3.2 million in July 2014. As a result, the Company recorded a previously unrecognized tax benefit in the amount of $2.7 million, including penalties and interest, relating to its 2011 tax return filing. No similar tax benefits were recorded for the year ended December 31, 2013.
Year Ended December 31, 2013 Compared to the Year Ended December 31, 2012
Net Sales
Net sales for 2013 decreased by $144.5 million, or 2.7%, to $5,307.4 million from $5,451.9 million in 2012. Of the 2.7% decrease in net sales, 1.5% was due to lower sales volume and 2.8% was due to lower selling prices, which were offset by a 1.6% increase in sales due to favorable currency impact as the U.S. dollar weakened compared to the euro. The overall decrease in sales volume was primarily due to lower volumes in the Basic Plastics & Feedstocks, Performance Plastics, and Latex segments. The lower demand in Basic Plastics & Feedstocks was largely driven by increases in the selling price of our polystyrene products due to the pass through of price increases of our key raw material (styrene monomer). The decreased volumes in Performance Plastics were driven by lower demand from the consumer electronics market in Asia, while decreased volumes in Latex were driven by lower demand in the Europe and Asia paper markets. These were partially offset by higher sales volume in the Synthetic Rubber segment due to the SSBR capacity expansion. The overall decrease in selling price was due to the contractual pass through of lower butadiene cost in the Latex and Synthetic Rubber segments.
7
Cost of Sales
Cost of sales for 2013 decreased by $165.8 million, or 3.2%, to $4,949.4 million from $5,115.2 million in 2012. Of the 3.2% decrease, 1.9% was primarily attributable to lower sales volume and 3.2% was due to lower raw materials costs, primarily butadiene with some offset from higher styrene related costs. These decreases were partially offset by an unfavorable currency impact of approximately 1.6% and the remaining variance was due to increases in other manufacturing costs. The unfavorable currency impact was due to the U.S. dollar weakening as compared to the euro.
Gross Profit
Gross profit for 2013 increased by $21.3 million, or 6.3%, to $358.0 million from $336.7 million in 2012. The increase was primarily attributable to higher margin in the Basic Plastics & Feedstocks segment, with lower raw material cost, margin improvement initiatives, and improved market dynamics in styrenic polymers and styrene monomer, as well as new business from the SSBR expansion.
Selling, General and Administrative Expenses
SG&A expenses for 2013 increased by $34.9 million, or 19.2%, to $216.9 million from $182.0 million in 2012. The increase in SG&A expenses were primarily due to: i) $10.8 million restructuring expenses incurred during 2013 in connection with the closure of our latex manufacturing facility in Altona, Australia, which includes impairment of property, plant and equipment, termination benefits and contract termination costs; ii) a one-time charge of $9.2 million representing impairment of fixed assets at our polycarbonate manufacturing plant in Stade, Germany; and iii) $9.3 million of pension costs including a $2.1 million curtailment charge. These charges are discussed in further detail in our notes to the consolidated financial statements.
The remaining increases in our SG&A expenses were due to higher performance incentive compensation costs, general severance, and the impact of annual salary increases totaling $12.0 million, plus an unfavorable currency impact of approximately $2.6 million as the U.S. dollar weakened compared to the euro. Also, during 2012, we recorded an adjustment to reduce stock-based compensation expense by approximately $2.5 million relating to the correction of prior period grant date fair values of time-based and performance-based restricted stock awards. No similar adjustments occurred in 2013.
These increases were offset by approximately $7.5 million of special termination benefit charges incurred in 2012 and a $3.0 million benefit from a change in the estimate for our allowance for doubtful accounts in 2013.
Equity in Earnings of Unconsolidated Affiliates
Equity in earnings of unconsolidated affiliates for 2013 was $39.1 million compared to equity in earnings of $27.1 million for 2012. Americas Styrenics equity earnings increased to $39.4 million in 2013 from $27.0 million in 2012, due to stronger operating performance driven by improved market conditions. Sumika Styron Polycarbonate equity earnings decreased to equity in net losses of $0.3 million in 2013 from equity earnings of $0.1 million in 2012.
Interest Expense, Net
Interest expense, net for the year ended December 31, 2013 was $132.0 million compared to $110.0 million for the year ended December 31, 2012. The increase of $22.0 million was attributable to the higher outstanding principal and interest rate on the Senior Notes which bear an interest rate of 8.75% compared to 6.0% interest rate on the Term Loans for the comparative period in 2012. The Term Loans were repaid in January 2013 with the issuance of the Senior Notes. This increase was slightly offset by a decrease in interest expense from our Revolving Facility due to lower borrowings in 2013 compared to prior year.
Loss on Extinguishment of Long-Term Debt
Loss on extinguishment of debt was $20.7 million for the year ended December 31, 2013 related to the extinguishment of our $1,239.0 million Term Loans under our Senior Secured Credit Facility, which was comprised of the write-off of existing unamortized deferred financing fees and original issue discount attributable to the Term Loans totaling $14.4 million and $6.3 million, respectively. There was no loss on extinguishment of debt recognized during the year ended December 31, 2012.
Other Expense, net
Other expense, net for the year ended December 31, 2013 was $27.9 million, which consisted primarily of a $4.2 million loss on the sale of our EPS business within our Basic Plastics & Feedstocks segment and $18.9 million foreign exchange transaction losses primarily driven by the remeasurement of our euro payables to the U.S. dollar. The remaining other expenses, net include value-added taxes of approximately $2.5 million and other expense.
8
Other expense, net for the year ended December 31, 2012 was $24.0 million and included foreign exchange transaction losses of $22.8 million, which were primarily driven by the remeasurement of our euro payables to the U.S. dollar as well as unrealized losses on our foreign exchange forward contracts of approximately $3.8 million. In addition, we incurred approximately $2.3 million of third-party fees associated with the 2012 Amendment of our Senior Secured Credit Facility.
Provision for Income Taxes
Provision for income taxes for 2013 totaled $21.8 million resulting in a negative effective tax rate of 5,921.0%. Provision for income taxes for 2012 totaled $17.5 million resulting in an effective tax rate of 36.6%.
The 2013 effective tax rate was unfavorably impacted by non-deductible interest and stock-based compensation expenses, resulting in an unfavorable difference of $8.4 million from the U.S. statutory rate. Our effective tax rate was further impacted by the tax effect of losses of $16.4 million incurred in jurisdictions such as Australia, Brazil, and Luxembourg which did not provide a tax benefit to us due to valuation allowances.
Offsetting these unfavorable impacts were lower tax expenses of $17.3 million from Switzerland and Hong Kong, where the statutory income tax rate is lower than the U.S. statutory rate. In addition, in 2013, we received a non-taxable government subsidy of $12.2 million related to our capital expansion project at our rubber facility in Schkopau, Germany, which provided a favorable difference of $4.2 million from the U.S. statutory rate.
The increase from 2012 in provision for income taxes was primarily due to net loss before income tax in jurisdictions outside the United States of $25.6 million. Of this loss, $65.0 million was generated from our subsidiaries in Australia and Luxembourg where we either do not receive a benefit from certain shareholder expenses or we have valuation allowances. In 2012, losses from these jurisdictions were $24.8 million. The increased losses from Australia and Luxembourg are primarily due to restructuring charges incurred in connection with the shutdown of our latex manufacturing plant in Altona, Australia and a portion of increased interest expense from the issuance of our Senior Notes in January 2013. We also have an additional valuation allowance of $3.1 million recorded in Singapore and Brazil which were previously not provided for, noting that in 2012 we were favorably impacted by a release of valuation allowances of $14.4 million in Hong Kong and China.
Selected Segment Information
The following tables present net sales and EBITDA by segment and as a percentage of total net sales and net sales by segment, respectively, for the following periods:
| | | | | | | | | | | | |
| (in millions) | | Year Ended December 31, | |
| | 2014 | | | 2013 | | | 2012 | |
Net sales(1) | | | | | | | | | | | | |
Latex segment | | $ | 1,261.1 | | | $ | 1,341.4 | | | $ | 1,545.1 | |
Synthetic Rubber segment | | | 634.0 | | | | 622.1 | | | | 701.9 | |
Performance Plastics segment | | | 821.1 | | | | 807.6 | | | | 839.2 | |
Basic Plastics & Feedstocks segment | | | 2,411.8 | | | | 2,536.3 | | | | 2,365.7 | |
Corporate unallocated(2) | | | — | | | | — | | | | — | |
| | | | | | | | | | | | |
Total | | $ | 5,128.0 | | | $ | 5,307.4 | | | $ | 5,451.9 | |
| | | | | | | | | | | | |
EBITDA(3) | | | | | | | | | | | | |
Latex segment | | $ | 94.0 | | | $ | 95.4 | | | $ | 125.5 | |
Synthetic Rubber segment | | | 137.0 | | | | 113.5 | | | | 111.1 | |
Performance Plastics segment | | | 69.4 | | | | 61.6 | | | | 69.5 | |
Basic Plastics & Feedstocks segment | | | 23.9 | | | | 90.0 | | | | 44.9 | |
Corporate unallocated(2) | | | (143.3 | ) | | | (133.7 | ) | | | (107.6 | ) |
| | | | | | | | | | | | |
Total | | $ | 181.0 | | | $ | 226.8 | | | $ | 243.4 | |
| | | | | | | | | | | | |
9
| | | | | | | | | | | | |
| | | Year Ended December 31, | |
| | | 2014 | | | 2013 | | | 2012 | |
Net sales(1) | | | | | | | | | | | | |
Latex segment | | | 24.6 | % | | | 25.3 | % | | | 28.3 | % |
Synthetic Rubber segment | | | 12.4 | % | | | 11.7 | % | | | 12.9 | % |
Performance Plastics segment | | | 16.0 | % | | | 15.2 | % | | | 15.4 | % |
Basic Plastics & Feedstocks segment | | | 47.0 | % | | | 47.8 | % | | | 43.4 | % |
Corporate unallocated(2) | | | 0.0 | % | | | 0.0 | % | | | 0.0 | % |
| | | | | | | | | | | | |
Total | | | 100.0 | % | | | 100.0 | % | | | 100.0 | % |
| | | | | | | | | | | | |
EBITDA(3) | | | | | | | | | | | | |
Latex segment | | | 7.5 | % | | | 7.1 | % | | | 8.1 | % |
Synthetic Rubber segment | | | 21.6 | % | | | 18.2 | % | | | 15.8 | % |
Performance Plastics segment | | | 8.5 | % | | | 7.6 | % | | | 8.3 | % |
Basic Plastics & Feedstocks segment | | | 1.0 | % | | | 3.5 | % | | | 1.9 | % |
Corporate unallocated(2) | | | (2.8 | )% | | | (2.5 | )% | | | (2.0 | )% |
| | | | | | | | | | | | |
Total | | | 3.5 | % | | | 4.3 | % | | | 4.5 | % |
| | | | | | | | | | | | |
| (1) | Inter-segment sales have been eliminated. |
| (2) | Corporate unallocated includes corporate overhead costs, loss on extinguishment of long-term debt, and certain other income and expenses. Percentages for corporate unallocated are based on total sales. |
| (3) | EBITDA is a non-GAAP financial measure that we refer to in making operating decisions because we believe it provides meaningful supplemental information regarding our operational performance. We present EBITDA because we believe that it is useful for investors to analyze disclosures of our operating results on the same basis as that used by our management. We believe the use of EBITDA as a metric assists our board of directors, management and investors in comparing our operating performance on a consistent basis because it removes the impact of our capital structure (such as interest expense), asset base (such as depreciation and amortization) and tax structure. See a reconciliation of net income (loss) to EBITDA below: |
| | | | | | | | | | | | |
| (in millions) | | Year Ended December 31, | |
| | 2014 | | | 2013 | | | 2012 | |
Net income (loss) | | $ | (67.3 | ) | | $ | (22.2 | ) | | $ | 30.3 | |
Interest expense, net | | | 124.9 | | | | 132.0 | | | | 110.0 | |
Provision for income taxes | | | 19.7 | | | | 21.8 | | | | 17.5 | |
Depreciation and amortization | | | 103.7 | | | | 95.2 | | | | 85.6 | |
| | | | | | | | | | | | |
EBITDA | | $ | 181.0 | | | $ | 226.8 | | | $ | 243.4 | |
| | | | | | | | | | | | |
There are limitations to using financial measures such as EBITDA. Other companies in our industry may define EBITDA differently than we do. As a result, it may be difficult to use EBITDA, or similarly-named financial measures that other companies may use, to compare the performance of those companies to our performance. We compensate for these limitations by providing reconciliations of our EBITDA results to our net income (loss), which is determined in accordance with GAAP.
Latex Segment
We are a global leader in SB latex, holding a strong market position across the geographies and applications in which we compete, including the #1 position in SB latex in Europe and the #2 position in North America. We produce SB latex primarily for coated paper used in advertising and magazines, packaging board coatings, carpet and artificial turf backings, as well as a number of performance latex applications. In 2014, approximately half of our Latex segment’s sales were generated in Europe, 25% were generated in the United States, and the majority of the remaining net sales were in Asia.
Year Ended December 31, 2014 Compared to the Year Ended December 31, 2013
Net sales for 2014 decreased by $80.3 million, or 6.0%, to $1,261.1 million from $1,341.4 million for 2013. Of the 6.0% decrease in net sales, 4.9% was due to lower selling prices primarily from the pass through of lower butadiene and styrene cost and
10
1.3% from lower sales volume driven by lower sales to the Europe and North America paper markets, partially offset by higher sales to the Asia paper market as well as to the global flooring and performance latex markets. There was also a 0.2% favorable currency impact in 2014 compared to the prior year as the U.S. dollar weakened compared to the euro.
EBITDA for 2014 decreased by $1.4 million, or 1.5%, to $94.0 million from $95.4 million in 2013. Of this decrease, 10.1% was driven by lower sales volume and margins due to lower demand and continued increases in competition in coated paper markets. These decreases were partially offset by a decrease in non-recurring restructuring related charges of $8.0 million from 2013 (see Note 20 in the consolidated financial statements) in connection with the closure of the latex plant in Australia.
Year Ended December 31, 2013 Compared to the Year Ended December 31, 2012
Net sales for 2013 decreased by $203.7 million, or 13.2%, to $1,341.4 million from $1,545.1 million for 2012. Of the 13.2% decrease in net sales, approximately 9.6% was due to lower selling prices primarily from the pass through of lower butadiene cost as well as increased competition in the Europe and Asia paper markets.
Lower sales volume, approximately 4.7% of the total impact, was primarily driven by lower demand and increasing competition in the Europe and Asia paper markets. These decreases were partially offset by a 1.1% favorable currency impact as the U.S. dollar weakened compared to the euro.
EBITDA for 2013 decreased by $30.1 million, or 24.0%, to $95.4 million from $125.5 million in 2012. Of this decrease, 16.5% was driven by lower sales volume and margins due to lower demand and continued increases in competition in the Europe and Asia paper markets. An additional 8.6% of the decrease relates to restructuring charges of $10.8 million recorded in 2013 in connection with the closure of the latex plant in Australia.
Synthetic Rubber Segment
We are a significant producer of styrene-butadiene and polybutadiene-based rubber products and we have a leading European market position in SSBR. While 100% of our sales were generated in Europe in 2014, approximately 15% of these net sales were exported to Asia, 9% to Latin America and 8% to North America.
We have a broad synthetic rubber technology and product portfolio, focusing on specialty products, such as SSBR and Li-PBR, while also producing core products, such as ESBR and Ni-PBR. Our synthetic rubber products are extensively used in tires, with approximately 85% of our net sales from this segment in 2014 attributable to the tire market. We estimate that three quarters of these sales relate to replacement tires. We have strong relationships with many of the top global tire manufacturers and believe we have remained a supplier of choice as a result of our broad rubber portfolio and ability to offer technologically differentiated product and product customization capabilities. Other applications for our synthetic rubber products include polymer modification and technical rubber goods.
Year Ended December 31, 2014 Compared to Year Ended December 31, 2013
Net sales for 2014 increased by $11.9 million, or 1.9%, to $634.0 million from $622.1 million in 2013. Of the 1.9% increase in net sales, 8.6% was due to an increase in sales volume resulting from higher sales of SSBR to tire producers, and 0.6% was due to a favorable currency impact as the U.S dollar weakened compared to the euro. These increases were partially offset by lower selling prices due to the pass through of lower butadiene costs to customers, which decreased net sales by approximately 7.2%.
EBITDA for 2014 increased by $23.5 million, or 20.7%, to $137.0 million from $113.5 million for 2013. Higher volume, driven by higher SSBR sales, and margin, driven by favorable raw material cost timing, increased EBITDA by approximately 28.0%. In addition, currency had a favorable impact of approximately 0.5% as the U.S. dollar weakened compared to the euro. These increases were partially offset by higher fixed costs, which decreased EBITDA by approximately 7.6%, driven by a lower level of fixed cost absorption.
11
Year Ended December 31, 2013 Compared to the Year Ended December 31, 2012
Net sales for 2013 decreased by $79.8 million, or 11.4%, to $622.1 million from $701.9 million in 2012. Of the 11.4% decrease in net sales, 18.2%, net of an approximately 1.8% favorable currency impact as the U.S. dollar weakened compared to the euro, was due to lower selling prices mostly from lower butadiene costs passed through to customers and some reduction in selling prices due to weakened economic conditions in the tire market. The decrease was partially offset by an increase in sales volume of approximately 6.8% due to the SSBR capacity expansion completed in the fourth quarter of 2012 and lower sales in the second quarter of 2012 due to the scheduled plant turnaround.
EBITDA for 2013 increased by $2.4 million, or 2.2%, to $113.5 million from $111.1 million for 2012. Higher volume, from the SSBR expansion with some offset from a weaker tire market, contributed a 29.0% increase in EBITDA and a slightly favorable currency impact, as the U.S. dollar weakened compared to the euro, contributed 2.1%. These increases were offset by lower margins, driven by weaker tire market conditions and less favorable timing of contractual pass through of raw material prices, and higher fixed costs, due to SSBR capacity expansions, which contributed to a 28.9% decrease in EBITDA from 2012.
Performance Plastics Segment
Our Performance Plastics segment produces highly engineered compounds and blends for automotive end markets, as well as consumer electronics, medical, and lighting, which we collectively call consumer essential markets (CEM). Our strategy in this segment focuses on developing differentiated compounds and blends in line with key industry trends, such as light-weighting and improved aesthetics in automotive, increased recycled material content and a push toward LED lighting in CEM. Our history of innovation has contributed to long-standing relationships with customers who are recognized leaders in their respective end-markets. We have established a strong market presence in the global automotive and electronics sector, targeting both component suppliers and final product manufacturers.
In automotive end applications, we aim to maintain and develop sustainable, long-standing relationships with industry leaders, taking advantage of our production capacity located across Europe, Asia, North America, and Latin America to drive original equipment manufacturer, or OEM, platform design wins. We believe that the strategic locations of these facilities combined with close customer collaboration to develop offerings tailored to their needs offers us a strategic advantage in serving our customers.
In CEM, sales volume for 2014 was up 7% over 2013, driven largely by the consumer electronics industry in Asia and by significant progress during the year with our lighting customers, including materials for LED housings and lenses.
In 2014, we experienced growth in key markets, with a 5% increase in volume outside of Latin America, which experienced declines due to lower consumer confidence and higher interest rates. We continue to focus on our strategic plans to grow this segment through both current technologies and expanded offerings for car exteriors and semi-structural applications.
Year Ended December 31, 2014 Compared to Year Ended December 31, 2013
Net sales for 2014 increased by $13.5 million, or 1.7%, to $821.1 million from $807.6 million in 2013. Of the 1.7% increase in net sales, 1.6% was driven by an increase in sales volume from higher sales to the Europe, North America, and Asia automotive markets as well as the Asia electronics market. A favorable currency impact, as the U.S. dollar weakened compared to the euro, increased sales by 0.2%. These increases were partially offset by a 0.2% decrease in selling prices due primarily to the pass through of lower raw material cost.
EBITDA for 2014 increased by $7.8 million, or 12.7%, to $69.4 million from $61.6 million in 2013. This increase was primarily due to higher volume and margins in 2014 from sales of our compounds and blends products to the automotive and electronic markets which contributed to 28.1% of the increase. This increase was partially offset by increased fixed costs primarily related to additional resources focused on improving business performance and growth, which decreased EBITDA by 15.9%.
Year Ended December 31, 2013 Compared to the Year Ended December 31, 2012
Net sales for 2013 decreased by $31.6 million, or 3.8%, to $807.6 million from $839.2 million in 2012. Of the 3.8% decrease in net sales, 1.1% was driven by decreases in selling prices due to the pass through of lower raw material cost and 3.8% was driven by a decrease in volume due to lower sales to the automotive markets in Europe and North America as well as to the consumer electronics market in Asia. The weakening of the U.S. dollar compared to the euro had a favorable impact to our net sales of approximately 1.1%.
EBITDA for 2013 decreased by $7.9 million, or 11.4%, to $61.6 million from $69.5 million in 2012. This decrease is attributable mainly to lower sales volume to the automotive market in Europe and consumer electronics market in Asia and margins in our automotive products in Latin America which were unfavorably impacted by the strengthening of the U.S. dollar compared to the Brazilian real resulting in an approximate 6.5% negative impact to our EBITDA.
12
Basic Plastics and Feedstocks Segment
Our Basic Plastics & Feedstocks segment consists of styrenic polymers, including polystyrene, ABS, and SAN products, as well as PC and styrene monomer, which includes our internal production and sourcing of styrene, a raw material common in SB latex, synthetic rubber and styrenics products. We are a leading producer of polystyrene and mass ABS, or mABS, where we focus our efforts on differentiated applications such as the liners and encasements of appliances and consumer electronics including smartphones and tablets. Within these applications, we have worked collaboratively with customers to develop more advanced grades of plastics such as our high impact polystyrene, or HIPS, and mABS products. For example, we work with appliance manufacturers around the world to develop improved environmental stress crack resistant products and with our construction sheet customers on smooth ABS. These products offer superior properties, such as rigidity, insulation and colorability, and, in some cases, an improved environmental footprint compared to general purpose polystyrene or emulsion ABS. Through this segment we also serve the packaging and construction end-markets, where we have launched a new general purpose polystyrene product for improved performance in foam insulation applications.
PC has high levels of clarity, impact resistance and temperature resistance. PC can be used in its neat form (prior to any compounding or blending) for markets such as construction sheet, optical media and LED lighting. Additionally, PC can be compounded or blended with other polymers, such as ABS, which imparts specific performance attributes tailored to the product’s end-use. A significant portion of our PC is consumed in our Performance Plastics segment for the manufacture of our compounds and blends products. We continue to drive improvements in profitability of PC as a result of savings from our restructuring activities, as well as from improvements in industry supply and demand.
This segment also includes the results of our two 50%-owned joint ventures, Americas Styrenics and Sumika Styron Polycarbonate. We do not anticipate investing for organic growth in this segment in the near term. Rather, our strategy for this segment is focused on operational enhancements, margin improvement, and cash generation.
Year Ended December 31, 2014 Compared to Year Ended December 31, 2013
Net sales for 2014 decreased by $124.5 million, or 4.9%, to $2,411.8 million from $2,536.3 million in 2013. Of the 4.9% decrease in net sales, 4.5% was driven by decreases in selling prices primarily due to the pass through of lower styrene costs to customers and approximately 0.7% was due to a decrease in sales volume. These decreases were partially offset by a 0.4% favorable currency impact to our net sales as the U.S. dollar weakened compared to the euro.
EBITDA for 2014 decreased by $66.1 million, or 73.4%, to $23.9 million from $90.0 million in 2013. Of the 73.4% decrease, 97.9% was driven by lower margins due mainly to a reduction in the spread on styrene monomer production margins compared to prior year as well as lower PC margins from weaker market conditions. Also contributing to the decrease was a 12.0% reduction in sales volume, driven by lower sales in Europe and Asia polystyrene, which includes impacts from customer destocking in the latter half of the year with decreasing prices. These impacts were partially offset by a 22.2% increase in EBITDA due to lower fixed costs, primarily related to fixed cost savings from our exit of the Freeport, Texas polycarbonate contract manufacturing agreement net of $6.6 million of decommissioning charges incurred in connection with this exit. In addition, the decrease in EBITDA was partially offset by the one-time $9.2 million impairment of fixed assets charge at our polycarbonate manufacturing facility in Stade, Germany that was incurred in 2013 as well as an increase in equity earnings from our AmSty joint venture, which increased $10.9 million compared to the prior year.
Year Ended December 31, 2013 Compared to the Year Ended December 31, 2012
Net sales for 2013 increased by $170.6 million, or 7.2%, to $2,536.3 million from $2,365.7 million in 2012. Of the 7.2% increase in net sales, 6.2% was driven by increases in selling prices due to higher styrene monomer prices, as well as actions to increase selling prices to improve margins. Also, the weakening of the U.S. dollar compared to the euro had a favorable currency impact to our net sales of approximately 1.9%. These increases were partially offset by a 0.9% decrease in sales volume largely related to the divestiture of our EPS business to Ravago and the remainder driven by customers’ inventory optimization efforts, as a result of price increases in styrene monomer.
EBITDA for 2013 increased by $45.1 million, or 100.4%, to $90.0 million from $44.9 million in 2012. This increase was primarily due to higher margins in styrene monomer production, margin improvement initiatives, and more favorable industry dynamics with lower supply in Europe which contributed to a combined 100.6% increase in EBITDA from 2012. Also, higher volumes contributed to 9.9% of the increase and the weakening of the U.S. dollar compared to the euro had a net favorable currency impact of approximately 2.5%. These increases were partially offset by continued losses in the polycarbonate business as the market remains extremely competitive, especially given current unfavorable supply and demand dynamics. The increases were also partially offset by a loss of approximately $9.2 million related to the impairment of fixed assets at our polycarbonate manufacturing facility in Stade, Germany and a loss of $4.2 million on the sale of the EPS business completed in September 2013.
13
Other Important Performance Measures
We believe that the presentation of Adjusted EBITDA and Adjusted EBITDA excluding inventory revaluation provides investors with a useful analytical indicator of our performance and of our ability to service our indebtedness.
We define Adjusted EBITDA as income (loss) from continuing operations before interest expense, net; income tax provision; depreciation and amortization expense; loss on extinguishment of long-term debt; asset impairment charges; advisory fees paid to affiliates of Bain Capital; gains or losses on the dispositions of businesses and assets; restructuring and other non-recurring items. We describe these other costs in more detail below.
We present Adjusted EBITDA excluding inventory revaluation in order to facilitate the comparability of results from period to period by adjusting cost of sales to reflect the cost of raw material during the period, which is often referred to as the replacement cost method of inventory valuation. We believe this measure minimizes the impact of raw material purchase price volatility in evaluating our performance. Our approach to calculating inventory revaluation is intended to represent the difference between the results under the FIFO and the replacement cost methods. However, our calculation could differ from the replacement cost method if the monthly raw material standards are different from the actual raw material prices during the month and production and purchase volumes differ from sales volumes during the month. These factors could have a significant impact on the inventory revaluation calculation.
There are limitations to using financial measures such as Adjusted EBITDA and Adjusted EBITDA excluding inventory revaluation. These performance measures are not intended to represent cash flow from operations as defined by GAAP and should not be used as alternatives to net income (loss) as indicators of operating performance or to cash flow as measures of liquidity. Other companies in our industry may define Adjusted EBITDA and Adjusted EBITDA excluding inventory revaluation differently than we do. As a result, it may be difficult to use these or similarly-named financial measures that other companies may use, to compare the performance of those companies to our performance. We compensate for these limitations by providing reconciliations of these performance measures to our net income (loss), which is determined in accordance with GAAP.
Adjusted EBITDA and Adjusted EBITDA excluding inventory revaluation are calculated as follows for the years ended December 31, 2014, 2013, and 2012, respectively:
| | | | | | | | | | | | |
| | | Year Ended December 31, | |
| (in millions) | | 2014 | | | 2013 | | | 2012 | |
Net income (loss) | | $ | (67.3 | ) | | $ | (22.2 | ) | | $ | 30.3 | |
Interest expense, net | | | 124.9 | | | | 132.0 | | | | 110.0 | |
Provision for income taxes | | | 19.7 | | | | 21.8 | | | | 17.5 | |
Depreciation and amortization | | | 103.7 | | | | 95.2 | | | | 85.6 | |
| | | | | | | | | | | | |
EBITDA(a) | | $ | 181.0 | | | $ | 226.8 | | | $ | 243.4 | |
Loss on extinguishment of long-term debt | | | 7.4 | | | | 20.7 | | | | — | |
Asset impairment charges or write-offs(b) | | | — | | | | 9.9 | | | | — | |
Net loss (gain) on disposition of businesses and assets(c) | | | (0.6 | ) | | | 4.2 | | | | — | |
Restructuring and other charges(d) | | | 10.0 | | | | 10.8 | | | | 7.5 | |
Fees paid pursuant to advisory agreement(e) | | | 25.4 | | | | 4.7 | | | | 4.6 | |
Other non-recurring items(f) | | | 38.4 | | | | 0.8 | | | | (0.6 | ) |
| | | | | | | | | | | | |
Adjusted EBITDA | | $ | 261.6 | | | $ | 277.9 | | | $ | 254.9 | |
| | | | | | | | | | | | |
Inventory revaluation | | | 64.4 | | | | 40.4 | | | | (38.4 | ) |
| | | | | | | | | | | | |
Adjusted EBITDA, excluding inventory revaluation(g) | | $ | 326.0 | | | $ | 318.3 | | | $ | 216.5 | |
| | | | | | | | | | | | |
| (a) | We refer to EBITDA in making operating decisions because we believe it provides meaningful supplemental information regarding our operational performance. Other companies in our industry may define EBITDA differently than we do. As a result, it may be difficult to use EBITDA, or similarly-named financial measures that other companies may use, to compare the performance of those companies to our performance. We compensate for these limitations by providing reconciliations of our EBITDA results to our net income (loss), which is determined in accordance with GAAP. See the “—Selected Segment Information” for further detail. |
| (b) | Asset impairment charges or write-offs for the year ended December 31, 2013 relate primarily to a $9.2 million impairment charge for fixed assets at our polycarbonate manufacturing plant in Stade, Germany. See Note 7 in the consolidated financial statements for further discussion. |
14
| (c) | Net loss (gain) on disposition of businesses and assets for the years ended December 31, 2014 and 2013 of $(0.6) million and $4.2 million, respectively, relate to the sale of the Company’s EPS business, which closed in September 2013, and for which a contingent gain of $0.6 million was recorded during the fourth quarter of 2014. Refer to Note 3 in the consolidated financial statements for further discussion. |
| (d) | Restructuring and other charges for the years ended December 31, 2014 and 2013 were incurred primarily in connection with the shutdown of our latex manufacturing plant in Altona, Australia and the restructuring within our Basic Plastics & Feedstocks segment. Note that the accelerated depreciation charges incurred as part of the 2014 restructuring within our Basic Plastics & Feedstocks segment are included within the depreciation caption above, and therefore not included as a separate adjustment within this caption. Restructuring and other charges for the year ended December 31, 2012 relate primarily to the announced organizational restructuring program in 2012 that included changes to many employees’ roles and elimination of approximately 90 roles globally. See Note 20 in the consolidated financial statements for further discussion. |
| (e) | Represents fees paid under the terms of our advisory agreement with Bain Capital (the “Advisory Agreement”). For the year ended December 31, 2014, this includes a charge of $23.3 million for fees incurred in connection with the termination of the Advisory Agreement, pursuant to its terms, upon consummation of the Company’s IPO in June 2014. See Note 18 in the consolidated financial statements for further discussion. |
| (f) | Other non-recurring items incurred for the year ended December 31, 2014 include a one-time $32.5 million termination payment made to Dow in connection with the termination of our Latex JV Option Agreement. See Note 18 in the consolidated financial statements for further discussion. Additional amounts incurred during the year ended December 31, 2014 consist of costs related to the process of changing our corporate name from Styron to Trinseo. |
| (g) | See the discussion above this table for a description of Adjusted EBITDA, excluding inventory revaluation. |
Liquidity and Capital Resources
Cash Flows
The table below summarizes our primary sources and uses of cash for the years ended December 31, 2014, 2013, and 2012. We have derived the summarized cash flow information from our audited financial statements.
| | | | | | | | | | | | |
| | | Year Ended December 31, | |
| (in millions) | | 2014 | | | 2013 | | | 2012 | |
Net cash provided by (used in): | | | | | | | | | | | | |
Operating activities | | $ | 117.2 | | | $ | 211.3 | | | $ | 186.1 | |
Investing activities | | | (92.6 | ) | | | (33.4 | ) | | | (117.3 | ) |
Financing activities | | | 8.1 | | | | (220.2 | ) | | | (77.2 | ) |
Effect of exchange rates on cash | | | (8.4 | ) | | | 2.4 | | | | (0.6 | ) |
| | | | | | | | | | | | |
Net change in cash and cash equivalents | | $ | 24.3 | | | $ | (39.9 | ) | | $ | (9.0 | ) |
| | | | | | | | | | | | |
Operating Activities
Net cash provided by operating activities during the year ended December 31, 2014 totaled $117.2 million, with net cash provided by operating assets and liabilities totaling $61.1 million. The most significant components of the changes in operating assets and liabilities for the year ended December 31, 2014 of $61.1 million was a decrease in accounts receivable of $68.5 million and a decrease in inventories of $22.6 million, offset by a decrease in other liabilities of $22.0 million. The decrease in accounts receivable is primarily due to lower sales and higher collections during the fourth quarter of 2014, compared to the fourth quarter of 2013, primarily driven by decreasing raw material prices. Our other liabilities decreased mainly due to reductions in normal operating costs. Our operating cash flow for the year ended December 31, 2014 was negatively impacted by two significant one-time cash payments in the second quarter of 2014 totaling approximately $55.8 million related to the termination of our Latex JV Option Agreement with Dow and our Advisory Agreement with Bain Capital. Refer to Note 18 of the consolidated financial statements for further discussion.
Net cash provided by operating activities during the year ended December 31, 2013 totaled $211.3 million, with net cash provided by operating assets and liabilities totaling $92.5 million. The most significant components of the changes in operating assets and liabilities for the year ended December 31, 2013 of $92.5 million were increases in accounts payable and other current liabilities of $15.0 million, and a decrease in inventory of $55.4 million. Increase in accounts payable and other current liabilities was mainly due to timing of payments in the normal course of business plus lesser interest payments in 2013 on the Senior Notes as interest payments are due semi-annually in August and February each year compared to interest on the Term Loans which were paid quarterly
15
in the prior year. Decrease in inventory was due to lower raw materials prices during 2013, as well as a decrease in volumes compared to the fourth quarter of 2012, due to higher inventory volumes on hand at the end of 2012 resulting from our rubber capacity expansion project placed in operation in the fourth quarter of 2012. Additionally, in 2013 we received $22.5 million from our unconsolidated affiliate, AmSty, as a return on our investment. Overall, cash flow from operating activities was primarily driven by improvement in cash collection during the year and lesser cash outflow on purchases due to inventory build in 2012 and lower raw materials prices in 2013.
Net cash provided by operating activities during the year ended December 31, 2012 totaled $186.1 million, with net cash provided by operating assets and liabilities totaling $55.3 million. The most significant components of the changes in operating assets and liabilities for the year ended December 31, 2012 of $55.3 million were decreases in accounts receivable and income taxes payable of $84.7 million and $5.1 million, respectively, and increases in inventory and accounts payable and other current liabilities of $87.2 million and $67.9 million, respectively. Increases in inventory and accounts payable and other current liabilities are primarily due to increases in inventory during the fourth quarter of 2012 for our new rubber capacity expansion project placed in operation in October 2012. The decrease in accounts receivable reflects both a decrease in sales during the fourth quarter of 2012 driven by the decrease in sales volume as well as continued improvements in receivable collection efforts. In addition, despite the decreases in sales, we conserved the use of cash in our operations due to various cost savings initiatives implemented during the year. Net cash paid for income taxes during the year was approximately $20.4 million. Additionally, in 2012 we received $20.0 million in dividends from our unconsolidated affiliate, AmSty, as a return on our investment.
Investing Activities
Net cash used in investing activities for the year ended December 31, 2014 totaled $92.6 million consisting primarily of capital expenditures of $98.6 million, of which approximately $26.1 million (€19.0 million) was related to the Company’s acquisition of production capacity rights from JSR at its rubber production facility in Schkopau, Germany. These investing activities were partially offset by cash proceeds of $6.3 million from the sale of a portion of land at our manufacturing site in Livorno, Italy.
Net cash used in investing activities for the year ended December 31, 2013 totaled $33.4 million, consisting primarily of capital expenditures of $54.8 million during the period, net of proceeds received from a government subsidy of $18.8 million related to our capital expansion project at our rubber facility in Schkopau, Germany. Also offsetting these capital expenditures were cash proceeds of $15.2 million received from the sale of our EPS business during the year as well as cash proceeds of $7.9 million released from restrictions related to our accounts receivable securitization facility. Refer to Note 3 of the consolidated financial statements for details on the EPS business divestiture.
Net cash used in investing activities for the year ended December 31, 2012 totaled $117.3 million, consisting primarily of capital expenditures of $112.4 million, net of proceeds from a government subsidy of $6.1 million; $69.2 million of capital expenditures, net of subsidy, was related to our capital expansion project at our rubber facility in Schkopau, Germany.
Financing Activities
Net cash provided by financing activities during the year ended December 31, 2014 totaled $8.1 million. During the period, the Company completed the IPO of 11,500,000 ordinary shares at a price of $19.00 per share. As a result, the Company received net cash proceeds from the issuance of common stock of $198.1 million, which is net of underwriting discounts as well as advisory, accounting, and legal expenses directly related to the offering. In July 2014, using proceeds from the Company’s IPO, the Company redeemed $132.5 million in aggregate principal amount of the Senior Notes (see Note 12 of the consolidated financial statements for further details). In addition, we had net repayments of short-term borrowings of $56.9 million, which largely consisted of borrowings under our short-term revolving credit facility through our subsidiary in China. We also continue to utilize our Accounts Receivable Securitization Facility to fund our working capital requirements. For the year ended December 31, 2014, we had borrowings from our Accounts Receivable Securitization Facility of $308.6 million and repayments of $309.2 million, resulting in net repayments of $0.6 million due to changes in foreign currency exchange rates, as a portion of our borrowings under the Accounts Receivable Securitization Facility originate in euros.
Net cash used in financing activities during the year ended December 31, 2013 totaled $220.2 million. During the period, we repaid our outstanding Term Loans of $1,239.0 million using the proceeds from the issuance of $1,325.0 million in Senior Notes issued in January 2013. In connection with the issuance of the Senior Notes and the amendments to our Senior Secured Credit Facility and our Accounts Receivable Securitization Facility, we paid approximately $48.3 million of refinancing fees. In addition, during the period, we continued to utilize our Revolving Facility and our Accounts Receivable Securitization Facility to fund our working capital requirements. During the year ended December 31, 2013, our borrowings and repayments to our Revolving Facility were $405.0 million and $525.0 million, respectively, and we had net repayments to our Accounts Receivable Securitization Facility of $95.1 million.
16
Net cash used in financing activities during the year ended December 31, 2012 totaled $77.2 million. We had borrowings from our Revolving Facility and our Accounts Receivable Securitization Facility throughout the year to fund our working capital requirements, and repaid those borrowings from funds generated from operating activities. During the year ended December 31, 2012, our borrowings and repayments to our Revolving Facility were $1,105.0 million and $1,135.0 million, respectively, and our net repayments to our Accounts Receivable Securitization Facility were $16.4 million. Also, during the year ended December 31, 2012, we paid $147.0 million of the then outstanding Term Loans, of which $140.0 million was the required payment for the effectiveness of the fourth amendment to the Senior Secured Credit Facility. Further, in May 2012, we received an approximate $22.2 million equity contribution from our Parent in order to cure an event of default that occurred for the period ended March 31, 2012. In August 2012, we received a $140.0 million cash contribution from our Parent and used the proceeds to repay a portion of our then outstanding Term Loans (as mentioned above).
Indebtedness and Liquidity
The following table outlines our outstanding indebtedness as of December 31, 2014 and December 31, 2013 and the associated interest expense, including amortization of deferred financing fees and debt discounts, and effective interest rates for such borrowings at December 31, 2014 and December 31, 2013. Note that the effective interest rates below exclude the impact of deferred financing fee amortization.
| | | | | | | | | | | | | | | | | | | | | | | | |
| | | As of and for the Year ended
December 31, 2014 | | | As of and for the Year Ended
December 31, 2013 | |
| (dollars in millions) | | Balance | | | Effective
Interest
Rate | | | Interest
Expense | | | Balance | | | Effective
Interest
Rate | | | Interest
Expense | |
Senior Secured Credit Facility | | | | | | | | | | | | | | | | | | | | | | | | |
Term Loans | | $ | — | | | | n/a | | | $ | — | | | $ | — | | | | n/a | | | $ | 8.0 | |
Revolving Facility | | | — | | | | — | | | | 4.7 | | | | — | | | | 6.6 | % | | | 5.7 | |
Senior Notes | | | 1,192.5 | | | | 8.8 | % | | | 116.2 | | | | 1,325.0 | | | | 8.8 | % | | | 111.9 | |
Accounts Receivable Securitization Facility | | | — | | | | 2.7 | % | | | 4.3 | | | | — | | | | 3.1 | % | | | 5.6 | |
Other indebtedness | | | 9.7 | | | | 1.1 | % | | | 0.1 | | | | 11.4 | | | | 1.6 | % | | | 0.1 | |
| | | | | | | | | | | | | | | | | | | | | | | | |
Total | | $ | 1,202.2 | | | | | | | $ | 125.3 | | | $ | 1,336.4 | | | | | | | $ | 131.3 | |
| | | | | | | | | | | | | | | | | | | | | | | | |
Senior Secured Credit Facility
In January 2013, the Company amended its Senior Secured Credit Facility to, among other things, increase its Revolving Facility borrowing capacity from $240.0 million to $300.0 million, decrease the borrowing rate of the Revolving Facility through a decrease in the applicable margin rate from 4.75% to 3.00% as applied to base rate loans (which shall bear interest at a rate per annum equal to the base rate plus the applicable margin (as defined therein)), or 5.75% to 4.00% as applied to LIBO rate loans (which shall bear interest at a rate per annum equal to the LIBO rate plus the applicable margin and the mandatory cost (as defined therein), if applicable), and extend the maturity date to January 2018. Concurrently, the Company repaid its then outstanding Term Loans of $1,239.0 million using the proceeds from its sale of $1,325.0 million aggregate principal amount of the 8.750% Senior Notes issued in January 2013.
This amendment replaced the Company’s total leverage ratio requirement with a first lien net leverage ratio (as defined under the amended agreement) and removed the interest coverage ratio requirement. If the outstanding balance on the Revolving Facility exceeds 25% of the $300.0 million borrowing capacity (excluding undrawn letters of credit up to $10.0 million) at a quarter end, then the Company’s first lien net leverage ratio may not exceed 5.25 to 1.00 for the quarter ending March 31, 2013, 5.00 to 1.00 for the subsequent quarters through December 31, 2013, 4.50 to 1.00 for each of the quarters ending in 2014 and 4.25 to 1.00 for each of the quarters ending in 2015 and thereafter. As of December 31, 2014, the Company was in compliance with all debt covenant requirements under the Senior Secured Credit Facility.
There are no amounts outstanding under the Revolving Facility as of December 31, 2014. Available borrowings under the Revolving Facility totaled $293.3million (net of $6.7 million of outstanding letters of credit) as of December 31, 2014.
Senior Notes
In January 2013, the Company issued $1,325.0 million 8.750% Senior Notes. Interest on the Senior Notes is payable semi-annually on February 1st and August 1st of each year, which commenced on August 1, 2013. The notes will mature on February 1, 2019, at which time the principal amounts then outstanding will be due and payable. The proceeds from the issuance of the Senior Notes were used to repay all of the Company’s outstanding Term Loans and related refinancing fees and expenses.
17
The Company may redeem all or part of the Senior Notes at any time prior to August 1, 2015 by paying a call premium, plus accrued and unpaid interest to the redemption date. The Company may redeem all or part of the Senior Notes at any time after August 1, 2015 at a redemption price equal to the percentage of principal amount set forth below plus accrued and unpaid interest, if any, on the notes redeemed, to the applicable date of redemption, if redeemed during the twelve-month period beginning on of the year indicated below:
| | | | |
12-month period commencing August 1 in Year | | Percentage | |
2015 | | | 104.375 | % |
2016 | | | 102.188 | % |
2017 and thereafter | | | 100.000 | % |
In addition, at any time prior to August 1, 2015, the Company may redeem up to 35% of the original principal amount of the notes at a redemption price equal to 108.750% of the face amount thereof plus accrued and unpaid interest, if any, to the redemption date, with the net cash proceeds that the Company raises in certain equity offerings. The Company may also redeem, during any
12-month period commencing from the issue date until August 1, 2015, up to 10% of the original principal amount of the Senior Notes at a redemption price equal to 103% of the principal amount thereof, plus accrued and unpaid interest, if any, to, but not including, the date of redemption.
In July 2014, using proceeds from the Company’s IPO (see Note 12 to the consolidated financial statements), the Company redeemed $132.5 million in aggregate principal amount of the Senior Notes, including a 103% call premium totaling $4.0 million, together with accrued and unpaid interest thereon of $5.2 million. As a result of this redemption, during the third quarter of 2014 the Company incurred a loss on the extinguishment of debt of approximately $7.4 million, which includes the above $4.0 million call premium and a $3.4 million write-off of related unamortized debt issuance costs. Pursuant to the Indenture, the Company may redeem another 10% of the original principal amount of the Senior Notes prior to August 1, 2015.
The Senior Notes rank equally in right of payment with all of the Company’s existing and future senior secured debt and pari passu with the Company and the Guarantors’ (as defined below) indebtedness that is secured by first-priority liens, including the Company’s Senior Secured Credit Facility (as defined above), to the extent of the value of the collateral securing such indebtedness and ranking senior in right of payment to all of the Company’s existing and future subordinated debt. However, claims under the Senior Notes effectively rank behind the claims of holders of debt, including interest, under our Senior Secured Credit Facility in respect of proceeds from any enforcement action with respect to the collateral or in any bankruptcy, insolvency or liquidation proceeding. The Senior Notes are unconditionally guaranteed on a senior secured basis by each of our existing and future wholly-owned subsidiaries that guarantee our Senior Secured Credit Facility (other than our subsidiaries in France and Spain) (the “Guarantors”). The note guarantees rank equally in right of payment with all of the Guarantors’ existing and future senior secured debt and senior in right of payment to all of the Guarantors’ existing and future subordinated debt. The notes are structurally subordinated to all of the liabilities of each of our subsidiaries that do not guarantee the notes.
The indenture contains covenants that, among other things, limit the Company’s ability and the ability of the Company’s restricted subsidiaries to incur additional indebtedness, pay dividends or make other distributions, subject to certain exceptions. If the Senior Notes are assigned an investment grade by the rating agencies and the Company is not in default, certain covenants will be suspended. If the ratings on the Senior Notes decline to below investment grade, the suspended covenants will be reinstated. As of December 31, 2014, the Company was in compliance with all debt covenant requirements under the indenture.
Accounts Receivable Securitization Facility
In August 2010, Styron Receivables Funding Ltd., which we refer to as Styron Funding, a variable interest entity in which we are the primary beneficiary, entered into an accounts receivable securitization facility with HSBC Bank Plc. The initial facility permitted borrowings by our Swiss subsidiary guarantor, Styron Europe GmbH, which we refer to as Styron Europe, of up to a total of $160.0 million. Under the facility, Styron Europe will sell its accounts receivable from time to time to Styron Funding. In turn, Styron Funding may sell undivided ownership interests in such receivables to commercial paper conduits in exchange for cash. We have agreed to continue servicing the receivables for Styron Funding. Upon the sale of the interests in the accounts receivable by Styron Funding, the conduits have a first priority perfected security interest in such receivables and, as a result, the receivables will not be available to our creditors or those of our subsidiaries.
In May 2011, the accounts receivable securitization facility was amended to allow for the expansion of the pool of eligible accounts receivable to include a previously excluded German subsidiary. In May 2013, we further amended the accounts receivable securitization facility, which increased our borrowing capacity from $160.0 million to $200.0 million, extended the maturity date to May 2016, lowered our borrowing cost, and allows for the expansion of the pool of eligible accounts receivable to include our
18
previously not included U.S. and The Netherlands subsidiaries. As a result of the May 2013 amendment, in regards to outstanding borrowings, fixed interest charges decreased from 3.25% plus commercial paper rates to 2.60% plus variable commercial paper rates. In regards to available, but undrawn borrowings, fixed interest charges decreased from 1.50% to 1.40%.
As of December 31, 2014, there were no amounts outstanding under the Accounts Receivable Securitization Facility, with approximately $136.1 million of accounts receivable available to support this facility, based on the pool of eligible accounts receivable.
Other indebtedness
As of December 31, 2014, we had $7.6 million of outstanding borrowings under our short-term revolving credit facility through our subsidiary in China that provides for up to $15.0 million of uncommitted funds available for borrowings, subject to the availability of collateral. The facility is subject to annual renewal.
Our Senior Secured Credit Facility limits our foreign working capital facilities to an aggregate principal amount of $75.0 million and further limits our foreign working capital facilities in certain jurisdictions in Asia, including China, to an aggregate principal amount of $25.0 million, except as otherwise permitted by the Senior Secured Credit Facility.
Derivative Instruments
Foreign Exchange Forward Contracts
Certain subsidiaries have assets and liabilities denominated in currencies other than their respective functional currencies, which creates foreign exchange risk. Our principal strategy in managing exposure to changes in foreign currency exchange rates is to naturally hedge the foreign currency-denominated liabilities on our balance sheet against corresponding assets of the same currency such that any changes in liabilities due to fluctuations in exchange rates are offset by changes in their corresponding foreign currency assets. In order to further reduce our exposure, the Company also uses foreign exchange forward contracts to economically hedge the impact of the variability in exchange rates on our assets and liabilities denominated in certain foreign currencies. These derivative contracts are not designated for hedge accounting treatment. The Company does not hold or enter into financial instruments for trading or speculative purposes.
During 2012, the Company entered into foreign exchange forward contracts with a notional U.S. dollar equivalent amount of $82.0 million. These contracts were settled in February and May 2013 and no contracts were outstanding as of December 31, 2013. The Company recognized losses of $0.6 million and $4.8 million during the years ended December 31, 2013 and 2012, respectively, related to these contracts.
Beginning in the third quarter of 2014, the Company began to enter into various foreign exchange forward contracts, each with an original maturity of less than three months, and has continued with this program through the end of the year. As of December 31, 2014, the Company had open foreign exchange forward contracts with a net notional U.S. dollar equivalent of $102.5 million. The fair value of open foreign exchange forward contracts amounted to $4.9 million of net unrealized losses and $0.3 million of net unrealized gains as of December 31, 2014, which were recorded in “Accounts payable” and “Accounts receivable, net of allowance”, respectively, in the consolidated balance sheets.
As these foreign exchange forward contracts are not designated for hedge accounting treatment, changes in the fair value of underlying instruments are recognized in “Other expense (income), net” in the consolidated statements of operations. The Company recorded losses from settlements and changes in the fair value of outstanding forward contracts of $28.2 million during the year ended December 31, 2014. These losses largely offset net foreign exchange transaction gains of $32.4 million during the year which resulted from the remeasurement of the Company’s foreign currency denominated assets and liabilities. The cash settlements of these forward exchange forward contracts are included within operating activities in the consolidated statements of cash flows.
Capital Resources and Liquidity
Our sources of liquidity include cash on hand, cash flow from operations and amounts available under the Senior Secured Credit Facility and the Accounts Receivable Securitization Facility. We believe, based on our current level of operations, that these sources of liquidity will be sufficient to fund our operations, capital expenditures and debt service for at least the next twelve months.
Our liquidity requirements are significant due to our highly leveraged nature, as well as our working capital requirements. As of December 31, 2014, we had $1,202.2 million in outstanding indebtedness and $748.7 million in working capital. As of December 31, 2013, we had $1,336.4 million in outstanding indebtedness and $810.2 million in working capital. As of December 31, 2014 and December 31, 2013, we had $94.7 million and $74.0 million of foreign cash and cash equivalents on our balance sheet, respectively,
19
all of which is readily convertible into other foreign currencies, including the U.S. dollar. Our intention is not to permanently reinvest our foreign cash and cash equivalents. Accordingly, we record deferred income tax liabilities related to the unremitted earnings of our subsidiaries.
As discussed above, in January 2013, we repaid our outstanding Term Loans of $1,239.0 million through issuance of $1,325.0 million in Senior Notes. Concurrently, with this repayment, we amended our Senior Secured Credit Facility to increase our Revolving Facility borrowing capacity from $240.0 million to $300.0 million. Also, in May 2013, we amended our Accounts Receivable Securitization Facility to increase our borrowing capacity from $160.0 million to $200.0 million, extended the maturity date to May 2016, and expanded the pool of eligible accounts receivable to include previously excluded U.S. and The Netherlands subsidiaries. These amendments to our facilities provide for additional liquidity resources for us.
Our ability to raise additional financing and our borrowing costs may be impacted by short and long-term debt ratings assigned by independent rating agencies, which are based, in significant part, on our performance as measured by certain credit metrics such as interest coverage and leverage ratios.
We and our subsidiaries, affiliates or significant direct or indirect shareholders may from time to time seek to retire or purchase our outstanding debt through cash purchases in the open market, privately negotiated transactions, exchange transactions or otherwise. Such repurchases or exchanges, if any, will depend on prevailing market conditions, our liquidity requirements, contractual restrictions and other factors. The amounts involved may be material.
We cannot make assurances that our business will generate sufficient cash flow from operations or that future borrowings will be available to us under the Senior Secured Credit Facility in an amount sufficient to enable us to pay our indebtedness, or to fund our other liquidity needs. Further, our highly leveraged nature may limit our ability to procure additional financing in the future. As of December 31, 2014 and December 31, 2013, we were in compliance with all the covenants and default provisions under our borrowing arrangements.
We believe that funds provided by operations, our existing cash and cash equivalent balances, borrowings available under our Revolving Facility and our Accounts Receivable Securitization Facility will be adequate to meet planned operating and capital expenditures for at least the next 12 months under current operating conditions. However, if we were to undertake any significant acquisitions or investments, it may be necessary for us to obtain additional debt or equity financings. We may not be able to obtain such financing on reasonable terms, or at all.
Contractual Obligations and Commercial Commitments
The following table reflects our contractual obligations as of December 31, 2014. Amounts we pay in future periods may vary from those reflected in the table (in millions):
| | | | | | | | | | | | | | | | | | | | | | | | | | | | |
| | | Payments due by year | |
Contractual Obligations at December 31, 2014 | | 2015 | | | 2016 | | | 2017 | | | 2018 | | | 2019 | | | Thereafter | | | Total | |
Purchase commitments(1) | | $ | 1,299.0 | | | $ | 1,292.4 | | | $ | 1,421.4 | | | $ | 1,214.3 | | | $ | 1,238.5 | | | $ | 1,204.5 | | | $ | 7,670.1 | |
Long-term Indebtedness(2) | | | — | | | | — | | | | — | | | | — | | | | 1,192.5 | | | | — | | | | 1,192.5 | |
Interest payments on long-term debt(3) | | | 104.3 | | | | 104.3 | | | | 104.3 | | | | 104.3 | | | | 52.2 | | | | — | | | | 469.4 | |
Pension and other postretirement benefits(4) | | | 3.7 | | | | 4.3 | | | | 18.1 | | | | 5.0 | | | | 5.0 | | | | 38.4 | | | | 74.5 | |
Minimum operating lease commitments and other obligations(5) | | | 8.0 | | | | 5.5 | | | | 3.2 | | | | 2.8 | | | | 2.8 | | | | 12.6 | | | | 34.9 | |
Uncertain tax positions, including interest and penalties(6) | | | — | | | | — | | | | — | | | | — | | | | — | | | | 17.1 | | | | 17.1 | |
| | | | | | | | | | | | | | | | | | | | | | | | | | | | |
Total | | $ | 1,415.0 | | | $ | 1,406.5 | | | $ | 1,547.0 | | | $ | 1,326.4 | | | $ | 2,491.0 | | | $ | 1,272.6 | | | $ | 9,458.5 | |
| | | | | | | | | | | | | | | | | | | | | | | | | | | | |
| (1) | We have certain raw material purchase contracts where we are required to purchase certain minimum volumes at the then prevailing market prices. These commitments range from 1 to 6 years. In certain raw material purchase contracts, we have the right to purchase less than required minimums and pay a liquidated damages fee, or, in case of a permanent plant shutdown, to terminate the contracts. In such cases these obligations would be less than the obligations shown in the table above. |
| (2) | In January 2013, we issued $1,325.0 million aggregate principal of our 8.750% Senior Notes due 2019, of which we redeemed $132.5 million in July 2014, using proceeds from the Company’s IPO. The remaining Senior Notes will mature and be due in full on February 1, 2019. The above excludes other debt outstanding as of December 31, 2014 totaling $9.7 million, which is primarily short-term in nature. |
20
| (3) | Includes estimated interest on the 8.750% Senior Notes due 2019, which is payable semi-annually on February 1st and August 1st of each year, which commenced on August 1, 2013. After the redemption of $132.5 million in aggregate principal amounts of the Senior Notes in July 2014, the estimated annual payments are approximately $104.3 million. Estimated interest payments do not include the Revolving Facility or Accounts Receivable Securitization Facility as amounts outstanding under these facilities vary due to periodic borrowings and repayments. There are no amounts outstanding under either facility as of December 31, 2014. |
| (4) | Includes minimum contributions required to be made to the funded pension plans and expected benefit payments to the employees for unfunded pension plans. With respect to our minimum funding requirements under our pension obligations, we may elect to make contributions in excess of the minimum funding requirements in response to investment performance or changes in interest rates or when we believe that it is financially advantageous to do so and based on our other cash requirements. Our minimum funding requirements after 2014 will depend on several factors, including investment performance and interest rates. Our minimum funding requirements may also be affected by changes in applicable legal requirements. We also have payments due with respect to our postretirement benefit obligation. We do not fund our postretirement benefit obligation. Rather, payments are made as costs are incurred by covered retirees. We expect benefit payments related to our postretirement benefit obligation to be $3.4 million through 2024. Also included in the above is a $13.6 million expected benefit obligation for payments estimated to be payable in 2017 under the Company’s non-qualified supplemental employee retirement plan. See Note 16 to the consolidated financial statements for further discussion. |
| (5) | Excludes certain estimated future commitments under agreements with Dow, including a Second Amended and Restated Master Outsourcing Services Agreement (“SAR MOSA”) under which Dow provides administrative and operational services to us and 25-year site services agreements, as amended (“SSAs”) under which Dow provides utilities and site services to certain of our facilities co-located with Dow. |
The services provided pursuant to the SAR MOSA generally are priced per function, and we have the ability to terminate the services or any portion thereof, for convenience any time after June 1, 2015, subject to payment of termination charges. Services which are “highly integrated” follow a different process for evaluation and termination. In addition, either party may terminate for cause, which includes a bankruptcy, liquidation or similar proceeding by the other party, for material breach which is not cured, or by Dow in the event of our failure to pay for the services thereunder. In the event of a change of control, as defined in the agreement, Dow has the right to terminate the SAR MOSA. As of December 31, 2014, we estimate our minimum obligation under the SAR MOSA, excluding the impacts of inflation, to be approximately $20.0 million through June 2015 and $32.0 million thereafter. However, should we continue with this agreement after that date, we estimate our minimum cumulative obligation as of December 31, 2014 through the completion of the contract, excluding the impacts of inflation, would be approximately $282.0 million through December 31, 2020.
These agreements may be terminated at any time by agreement of the parties, or, by either party, for cause, including a bankruptcy, liquidation or similar proceeding by the other party, or under certain circumstances for a material breach which is not cured. In addition, we may terminate for convenience any services that Dow has agreed to provide to us that are identified in any site services agreement as “terminable” with 12 months prior notice to Dow, dependent upon whether the service is highly integrated into Dow operations. Highly integrated services are agreed to be nonterminable. With respect to “nonterminable” services that Dow has agreed to provide to us, such as electricity and steam, we generally cannot terminate such services prior to the termination date unless we experience a production unit shut down for which we provide Dow with 15-months prior notice, or upon payment of a shutdown fee. Upon expiration or termination, we would be obligated to pay a monthly fee to Dow, which obligation extends for a period of 45 (in the case of expiration) to 60 months (in the case of termination) following the respective event of each site services agreement. The agreements under which Dow receives services from us may be terminated under the same circumstances and conditions. Utilizing current year known costs and assuming that we continue with these agreements, we estimate our contractual obligations for the SSAs to be approximately $222.1 million annually for 2015 through 2018. Should we choose to continue these agreements, we estimate our minimum cumulative obligation would be approximately $5,213.6 million through June 2038.
See Note 18 to the consolidated financial statements for further details.
| (6) | Due to uncertainties in the timing of the effective settlement of tax positions with the respective taxing authorities, we are unable to determine the timing of payments related to its uncertain tax positions, including interest and penalties. Amounts are therefore reflected in “Thereafter”. |
Critical Accounting Policies and Estimates
Our discussion and analysis of results of operations and financial condition are based upon our financial statements. These financial statements have been prepared in accordance with GAAP. The preparation of these financial statements requires us to make estimates and judgments that affect the amounts reported in the financial statements. We base our estimates and judgments on historical experiences and assumptions believed to be reasonable under the circumstances and re-evaluate them on an ongoing basis.
21
Actual results could vary from our estimates under different assumptions or conditions. Our significant accounting policies, which may be affected by our estimates and assumptions, are more fully described in Note 2 to our consolidated financial statements in this Annual Report. An accounting policy is deemed to be critical if it requires an accounting estimate to be made based on assumptions about matters that are highly uncertain at the time the estimate is made, and if different estimates that reasonably could have been used, or changes in the accounting estimates that are reasonably likely to occur periodically, could materially impact the financial statements. Management believes the following critical accounting policies reflect our most significant estimates and assumptions used in the preparation of the financial statements.
Pension Plans and Postretirement Benefits
We have various company-sponsored retirement plans covering substantially all employees. We also provide certain health care and life insurance benefits mainly to certain retirees in the United States. The plans provide health care benefits, including hospital, physicians’ services, drug and major medical expense coverage, and life insurance benefits. We recognize the underfunded or overfunded status of a defined benefit pension or postretirement plan as an asset or liability in our balance sheet and recognize changes in the funded status in the year in which the changes occur through accumulated other comprehensive income, which is a component of shareholders’ equity.
A settlement is a transaction that is an irrevocable action that relieves the employer (or the plan) of primary responsibility for a pension or postretirement benefit obligation, and that eliminates significant risks related to the obligation and the assets used to effect the settlement. The Company does not record settlement gains or losses during interim periods when the cost of all settlements in a year is less than or equal to the sum of the service cost and interest cost components of net periodic pension cost for the plan in that year.
Pension benefits associated with these plans are generally based on each participant’s years of service, compensation, and age at retirement or termination. The discount rate is an important element of expense and liability measurement. We evaluate our assumptions at least once each year, or as facts and circumstances dictate, and make changes as conditions warrant.
We determine the discount rate used to measure plan liabilities as of the December 31 measurement date for the pension and postretirement benefit plans. The discount rate reflects the current rate at which the associated liabilities could be effectively settled at the end of the year. We set our rate to reflect the yield of a portfolio of high quality, fixed-income debt instruments that would produce cash flows sufficient in timing and amount to settle projected future benefits. Using this methodology, we determined a discount rate of 2.01% for pension and 6.40% for postretirement benefits to be appropriate as of December 31, 2014.
We determine the expected long-term rate of return on assets by performing a detailed analysis of historical and expected returns based on the underlying assets, which generally are insurance contracts. We also consider our historical experience with the pension fund asset performance. The expected return of each asset class is derived from a forecasted future return confirmed by current and historical experience. The weighted-average long-term rate of return assumption used for determining net periodic pension expense for 2014 was 2.83%, while the weighted-average long-term rate of return assumption used for determining net periodic pension expense for 2013 was 2.44%. The increase was primarily due to higher interest rates during 2014 on certain assets with guaranteed returns. Future actual pension expense will depend on the performance of the underlying assets and changes in future discount rates, among other factors.
Holding all other factors constant, a 0.25 percentage point increase (decrease) in the discount rate used to determine net periodic cost would decrease (increase) 2014 pension expense by approximately $1.9 million and $(2.0) million, respectively. Holding all other factors constant, a 0.25 percentage point increase (decrease) in the long-term rate of return on assets used to determine net periodic cost would decrease (increase) 2014 pension expense by approximately $0.2 million and $(0.2) million, respectively.
Plan assets are invested primarily in insurance contracts that provide for guaranteed returns. As of December 31, 2014 and 2013, respectively, plan assets totaled $92.6 million and $81.3 million. Investments in the pension plan insurance are valued utilizing unobservable inputs, which are contractually determined based on cash surrender values, returns, fees, and the present value of the future cash flows of the contracts, and are classified as Level 3 investments.
Stock-Based Compensation
Restricted Stock Awards issued by the Parent
Since June 17, 2010, our Parent granted various time-based and performance-based restricted stock awards (“Incentive Shares”) to certain officers and key members of management. Any related compensation associated with these awards is allocated to the Company from the Parent. With the adoption of the Company’s 2014 Omnibus Incentive Plan (see discussion below), there were no grants issued under the Parent’s restricted stock awards plan in 2014, and none are expected in future periods.
22
Prior to the completion of the Company’s IPO, on June 10, 2014 the Parent entered into agreements to modify the outstanding performance-based restricted stock awards held by the Company’s employees to remove the performance-based vesting condition associated with such awards related to the achievement of certain investment returns (while maintaining the requirement for a change in control or IPO). Henceforth, these awards will be described as the Company’s modified time-based restricted stock awards. Prior to this modification, the Company had not recorded any compensation expense related to these awards as the likelihood of achieving the existing performance condition of a change in control or IPO was not deemed to be probable.
Compensation expense related to time-based restricted stock awards is equivalent to the grant-date fair value of our Parent’s ordinary shares adjusted for the return of co-investment share and other equity investment amounts, as discussed below, and is recognized as compensation expense over the service period utilizing graded vesting.
Forfeitures are estimated at the time of grant and revised, if necessary, in subsequent periods if actual forfeitures differ from those estimates. Stock-based compensation expense recognized in our consolidated financial statements is based on awards that are ultimately expected to vest.
In addition, our Parent has a call right that gives it the option, but not the obligation, to repurchase vested stock at the then current fair value upon an employee’s termination, or at cost in certain circumstances. In 2013, as the result of certain employee terminations, the Parent repurchased a total of 3,372 previously vested time-based restricted stock awards at cost, resulting in a $0.9 million favorable adjustment to stock-based compensation expense. No such repurchases occurred in 2014 or 2012.
During 2011, certain co-investment shares were issued for a subscription price of $397.2 per share. During 2013, an additional 779 co-investment shares were issued for a subscription price of $0.01 per share. No issuances occurred during 2012 or 2014. All such shares are referred to herein as the “Co-Invest Shares”. Our Incentive Shares are issued for a subscription price of $0.01 per share.
Our Parent is a private company with no active public market for its ordinary shares. For grants made on June 17, 2010 and through the third quarter of 2010, the awards were valued using a share price derived from the purchase price of the acquired assets and liabilities on that date. For grants awarded or modified from the fourth quarter of 2010 through 2014, our Parent determined the estimated per share fair value of its ordinary shares using a contemporaneous valuation consistent with the American Institute of Certified Public Accountants 2013 Guide, “Valuation of Privately-Held Company Equity Securities Issued as Compensation” (the “Guide”). In conducting this valuation, our Parent considered all objective and subjective factors that it believed to be relevant, including its best estimate of its business condition, prospects, and operating performance. Within this contemporaneous valuation, a range of factors, assumptions, and methodologies were used. The significant factors included:
| | • | | the fact that, prior to June 2014, we and our Parent were private companies with illiquid securities; since our June 2014 IPO, the Company is now publicly traded, but the Parent (from whom incentive shares awarded) remains a private company; |
| | • | | our historical operating results; |
| | • | | our discounted future cash flows, based on our projected operating results; |
| | • | | valuations and historical stock price volatility of comparable public companies; and |
| | • | | the risk involved in the investment, as related to earnings stability, capital structure, competition and market potential. |
For all contemporaneous valuations of our Parent’s ordinary shares prior to our IPO in June 2014, management estimated, as of the grant date, our enterprise value on a continuing operations basis, using the income and market approaches, as described in the Guide. The income approach utilized a discounted cash flow (“DCF”) methodology based on our financial forecasts and projections. The market approach utilized the Guideline Public Company and Guideline Transactions methods.
For the DCF methodology, we prepared annual projections of future cash flows, generally over the next 5 years, with terminal year cash flows projected at long-term sustainable growth rates consistent with long-term inflationary and industry expectations. Our projections of future cash flows were based on our estimated net debt-free cash flows and were discounted to the valuation date using a weighted-average cost of capital estimated using market participant assumptions.
For the Guideline Public Company and Guideline Transactions methods, we identified a group of comparable public companies and recent transactions within the chemicals industry. For the comparable companies, we estimated market multiples based on trading prices and trailing 12 months EBITDA and projected future EBITDA. We then calculated a rolling two year average of these multiples, which were applied to our trailing 12 months and projected EBITDA. When selecting comparable companies, consideration was given to industry similarity, their specific products offered, financial data availability and capital structure.
23
For the comparable transactions, we estimated market multiples based on prices paid for the related transactions and trailing 12 months EBITDA. These multiples were then applied to our trailing 12 months EBITDA. The results of the market approaches corroborated the fair value determined using the income approach.
For valuations performed in 2014, primarily as a result of the June modification of performance-based awards discussed above, we applied a similar valuation methodology. However, rather than developing an estimate of the business enterprise value of the Parent using the methods discussed above, we derived the fair value using the market capitalization of the Company, based on the prevailing price of the Company’s publicly-traded stock, adjusted for net debt and other factors.
2014 Omnibus Incentive Plan
In connection with the IPO, the Company’s board of directors approved the Trinseo S.A. 2014 Omnibus Incentive Plan (“2014 Omnibus Plan”), adopted on May 28, 2014. Following the IPO, all equity-based awards granted by the Company will be granted under the 2014 Omnibus Plan which provides for awards of stock options, share appreciation rights, restricted stock, unrestricted stock, stock units, performance awards, cash awards and other awards convertible into or otherwise based on shares of the Company’s common stock. Only limited grants of restricted stock units to the Company’s two independent directors occurred in 2014.
Asset Impairments
As of December 31, 2014, net property, plant and equipment totaled $556.7 million, net identifiable finite-lived intangible assets totaled $165.4 million and goodwill totaled $34.6 million. Management makes estimates and assumptions in preparing the financial statements for which actual results will emerge over long periods of time. This includes the recoverability of long-lived assets employed in the business. These estimates and assumptions are closely monitored by management and periodically adjusted as circumstances warrant. For instance, expected asset lives may be shortened or impairment may be recorded based on a change in the expected use of the asset or performance of the related asset group.
We evaluate long-lived assets and identifiable finite-lived intangible assets for impairment whenever events or changes in circumstances indicate that the carrying amount of an asset or asset grouping may not be recoverable. When undiscounted future cash flows are not expected to be sufficient to recover an asset’s carrying value, the asset is written down to its fair value based on a discounted cash flow analysis utilizing market participant assumptions.
During the three months ended December 31, 2013, we determined that the long-lived assets at our polycarbonate manufacturing facility in Stade, Germany should be assessed for impairment driven primarily by continued losses experienced in our polycarbonate business. This assessment indicated that the carrying amount of the long-lived assets at this facility were not recoverable when compared to the expected undiscounted cash flows of our polycarbonate business. Based upon our assessment of fair value of this asset group, we fully impaired these assets as of December 31, 2013. The fair value of the asset group was determined under the income approach utilizing a discounted cash flow (“DCF”) model. The key assumptions used in the DCF model included growth rates and cash flow projections, discount rate, tax rate and an estimated terminal value.
As a result, in the year ended December 31, 2013, we recorded an impairment loss of approximately $9.2 million. The amount was recorded within “Selling, general and administrative expenses” in the consolidated statement of operations and was allocated entirely to the Basic Plastics & Feedstocks segment.
Through December 31, 2014, we have continued to assess the recoverability of certain assets, and concluded there are no events or circumstances identified by management that would indicate these assets are not recoverable. However, the current environment is subject to changing market conditions and requires significant management judgment to identify the potential impact to our assessment. If we are not able to achieve certain actions or our future operating results do not meet our expectations, it is possible that impairment charges may need to be recorded on one or more of our operating facilities.
Long-lived assets to be disposed of by sale are classified as held-for-sale and are reported at the lower of carrying amount or fair value less cost to sell, and depreciation is ceased. Long-lived assets to be disposed of in a manner other than by sale are classified as held-and-used until they are disposed.
Our goodwill impairment testing is performed annually as of October 1st at a reporting unit level. We perform more frequent impairment tests when events or changes in circumstances indicate that the fair value of a reporting unit has more likely than not declined below its carrying value. As of our annual assessment date of October 1, 2014, each of our reporting units had fair values that substantially exceeded the carrying value of their net assets, indicating that no impairment of goodwill is warranted.
An impairment loss generally would be recognized when the carrying amount of the reporting unit’s net assets exceeds the estimated fair value of the reporting unit. The estimated fair value of a reporting unit is determined using a discounted cash flow analysis. At December 31, 2014, our $34.6 million in total goodwill is allocated as follows to our reportable segments: $13.8 million to Latex, $9.5 million to Synthetic Rubber, $3.2 million to Performance Plastics and $8.1 million to Basic Plastics & Feedstocks.
24
Factors which could result in future impairment charges, among others, include changes in worldwide economic conditions, changes in technology, changes in competitive conditions and customer preferences, and fluctuations in foreign currency exchange rates. These factors are discussed in Item 7A—Quantitative and Qualitative Disclosures about Market Risk and Item 1A-Risk Factors included in the Company’s Annual Report on Form 10-K for the year-ended December 31, 2014.
Income Taxes
We account for income taxes using the asset and liability method. Under this method, deferred tax assets and liabilities are recognized for the future tax consequences of temporary differences between the carrying amounts and tax bases of assets and liabilities using enacted rates. The effect of a change in tax rates on deferred taxes is recognized in income in the period that includes the enactment date. Deferred taxes are provided on the outside basis differences and unremitted earnings of subsidiaries outside of Luxembourg. All undistributed earnings of foreign subsidiaries and affiliates are expected to be repatriated at December 31, 2014. Based on the evaluation of available evidence, both positive and negative, we recognize future tax benefits, such as net operating loss carryforwards and tax credit carryforwards, to the extent that realizing these benefits is considered to be more likely than not.
At December 31, 2014, we had a net deferred tax asset balance of $81.9 million, after valuation allowances of $66.9 million. In evaluating the ability to realize the deferred tax assets, we rely on, in order of increasing subjectivity, taxable income in prior carryback years, the future reversals of existing taxable temporary differences, tax planning strategies and forecasted taxable income using historical and projected future operating results. At December 31, 2014, we had deferred tax assets for tax loss carryforward of approximately $58.3 million, $3.3 million of which is subject to expiration in the years between 2015 and 2019. We continue to evaluate our historical and projected operating results for several legal entities for which we maintain valuation allowances on net deferred tax assets.
We are subject to income taxes in Luxembourg, the United States and numerous foreign jurisdictions, and are subject to audit within these jurisdictions. Therefore, in the ordinary course of business there is inherent uncertainty in quantifying our income tax positions. The tax provision includes amounts considered sufficient to pay assessments that may result from examinations of prior year tax returns; however, the amount ultimately paid upon resolution of issues raised may differ from the amounts accrued. Since significant judgment is required to assess the future tax consequences of events that have been recognized in our financial statements or tax returns, the ultimate resolution of these events could result in adjustments to our financial statements and such adjustments could be material. Therefore, we consider such estimates to be critical in preparation of our financial statements.
The financial statement effect of an uncertain income tax position is recognized when it is more likely than not, based on the technical merits, that the position will be sustained upon examination. Accruals are recorded for other tax contingencies when it is probable that a liability to a taxing authority has been incurred and the amount of the contingency can be reasonably estimated. Uncertain income tax positions have been recorded in “Other noncurrent obligations” in the consolidated balance sheets for the periods presented.
Management judgment is required in determining our provision for income taxes, our deferred tax assets and liabilities, and any valuation allowance recorded against our deferred tax assets. The valuation allowance is based on our estimates of future taxable income and the period over which we expect the deferred tax assets to be recovered. Our assessment of future taxable income is based on historical experience and current and anticipated market and economic conditions and trends. In the event that actual results differ from these estimates or we adjust our estimates in the future, we may need to adjust our valuation allowance, which could materially impact our financial position and results of operations.
Off-balance Sheet Arrangements
We do not have any off-balance sheet arrangements.
Recent Accounting Pronouncements
We describe the impact of recent accounting pronouncements in Note 2 to the consolidated financial statements, included elsewhere within this Annual Report.
25