Exhibit 99.2

Presentation of Supplemental Information
The information in this supplement should be read in conjunction with Aviv’s Annual Report on Form 10-K, Quarterly Reports on Form 10-Q, Current Reports on Form 8-K and other information filed with the Securities and Exchange Commission (“SEC”). You may access these filings on Aviv’s website, www.avivreit.com, or on the SEC’s website, www.sec.gov.
The information presented under “Definitions” is an integral part of this supplement.
This supplement may include forward-looking statements. Forward-looking statements can be identified by the use of words such as “may,” “should,” “expects,” “plans,” “anticipates,” “believes,” “estimates,” “predicts,” “intends,” “continue” or similar terminology. These forward-looking statements are made based on our current expectations and beliefs concerning future events affecting us and are subject to uncertainties and factors relating to our operations and business environment, all of which are difficult to predict and many of which are beyond our control, that could cause our actual results to differ materially from those matters expressed in or implied by these forward-looking statements. These uncertainties include, but are not limited to, uncertainties relating to the operations of our tenants, including those relating to reimbursement by government and other third-party payors, compliance with regulatory requirements and occupancy levels, regulatory, reimbursement and other changes in the healthcare industry, the performance and reputation of our tenants, our ability to successfully engage in strategic acquisitions and investments, the effect of general market, economic and political conditions, the availability and cost of capital, changes in tax laws and regulations affecting REITs and our ability to maintain our status as a REIT. Important factors that could cause actual results to differ materially from our expectations include those disclosed under “Risk Factors” and elsewhere in filings made by Aviv with the SEC.
Table of Contents
| | | | |
Company Information | | | 1 | |
| |
Portfolio Summary | | | 2-4 | |
| |
Debt Summary and Capitalization | | | 5 | |
| |
Investment Activity | | | 6 | |
| |
Definitions | | | 7 | |
Company Information
| | | | |
| Board of Directors |
| Craig M. Bernfield | | | | Norman R. Bobins |
| Chairman and Chief Executive Officer | | | | Non-Executive Chairman, The PrivateBank |
| Aviv REIT, Inc. | | | | and Trust Company |
| | |
| Michael W. Dees | | | | Alan E. Goldberg |
| Partner, Lindsay Goldberg LLC | | | | Co-Managing Partner, Lindsay |
| | | | Goldberg LLC |
| | |
| Susan R. Lichtenstein | | | | Mark B. McClellan, M.D., Ph.D. |
| SVP, Corporate Affairs, Chief Legal Officer and | | | | Chair in Health Policy Studies, Brookings |
| Secretary, Hill-Rom Holdings, Inc. | | | | Institution; Senior fellow and director of the |
| | | | Engelberg Center for Health Care Reform |
| | |
| Sharon O’Keefe | | | | Mark J. Parrell |
| President, University of Chicago Medical Center | | | | EVP and Chief Financial Officer, Equity |
| | | | Residential |
| | |
| Ben W. Perks | | | | James H. Roth |
| Former EVP and Chief Financial Officer, | | | | Chief Executive Officer, Huron Consulting |
| Navigant Consulting | | | | |
| | |
| J. Russell Triedman | | | | |
| Partner, Lindsay Goldberg LLC | | | | |
|
| Senior Management |
| | |
| Craig M. Bernfield | | | | Steven J. Insoft |
| Chairman and Chief Executive Officer | | | | President and Chief Operating Officer |
| | |
| James H. Lyman | | | | Leticia Chavez |
| Chief Financial Officer and Treasurer | | | | Executive Vice President, Administration |
| | |
| Samuel H. Kovitz | | | | Donna M. O’Neill |
| Executive Vice President, General | | | | Chief Information and Accounting Officer |
| Counsel and Secretary | | | | |
| | |
| Joshua J. Kochek | | | | Steven R. Levin |
| Vice President, Investments | | | | Vice President, Real Estate |
|
| Contact Information |
| | |
| Corporate Headquarters | | | | Investor Relations |
| 303 W Madison St., Suite 2400 | | | | David J. Smith |
| Chicago, IL 60606 | | | | Managing Director, Investor Relations & |
| 312-855-0930 | | | | Capital Markets |
| | | | dsmith@avivreit.com; 312-855-0930 |
1
Portfolio Summary
Dollars and square feet in thousands1
Portfolio Composition
| | | | | | | | | | | | | | | | | | | | | | | | |
| | | | | | | | | | | | | | | Annualized | | | | |
| | | Property | | | Number of | | | Square | | | Investment | | | Cash | | | % of | |
Property Type | | Count | | | Beds | | | Feet | | | (GBV) | | | Rent | | | Total Rent | |
Skilled Nursing | | | 223 | | | | 18,770 | | | | 6,942 | | | $ | 994,256 | | | $ | 116,758 | | | | 87.6 | % |
Senior Housing | | | 22 | | | | 1,381 | | | | 837 | | | | 119,399 | | | | 13,108 | | | | 9.8 | % |
Other Healthcare Properties | | | 18 | | | | 145 | | | | 97 | | | | 42,579 | | | | 3,358 | | | | 2.5 | % |
| | | | | | | | | | | | | | | | | | | | | | | | |
Total | | | 263 | | | | 20,296 | | | | 7,877 | | | $ | 1,156,234 | | | $ | 133,224 | | | | 100.0 | % |
| | | | | | | | | | | | | | | | | | | | | | | | |
Portfolio Performance
| | | | | | | | | | | | | | | | | | | | | | | | | | | | |
| | | EBITDARM | | | EBITDAR | | | | | | Facility Revenue Mix | | | EBITDAR | |
Core Portfolio | | Coverage | | | Coverage | | | Occupancy | | | Private Pay | | | Medicare | | | Medicaid | | | Margin | |
Skilled Nursing | | | 1.9x | | | | 1.5x | | | | 79.7 | % | | | 19.6 | % | | | 24.2 | % | | | 56.1 | % | | | 14.8 | % |
Senior Housing | | | 1.8x | | | | 1.6x | | | | 78.5 | % | | | 78.7 | % | | | 4.9 | % | | | 16.4 | % | | | 32.4 | % |
Other Healthcare Properties | | | 10.1x | | | | 8.9x | | | | 86.3 | % | | | 100.0 | % | | | 0.0 | % | | | 0.0 | % | | | 30.3 | % |
| | | | | | | | | | | | | | | | | | | | | | | | | | | | |
Total | | | 2.0x | | | | 1.6x | | | | 79.7 | % | | | 24.7 | % | | | 22.7 | % | | | 52.7 | % | | | 16.0 | % |
| | | | | | | | | | | | | | | | | | | | | | | | | | | | |
State Diversification
| | | | | | | | | | | | | | | | |
| | | | | | Investment | | | Annualized Rent | |
State | | Properties | | | (GBV) | | | Rent | | | % | |
Texas | | | 60 | | | $ | 200,776 | | | $ | 24,378 | | | | 18.3 | % |
California | | | 36 | | | | 166,166 | | | | 20,722 | | | | 15.6 | % |
Ohio | | | 17 | | | | 95,298 | | | | 13,361 | | | | 10.0 | % |
Connecticut | | | 6 | | | | 86,586 | | | | 8,864 | | | | 6.7 | % |
Missouri | | | 15 | | | | 75,827 | | | | 7,016 | | | | 5.3 | % |
Arkansas | | | 11 | | | | 62,770 | | | | 6,945 | | | | 5.2 | % |
Pennsylvania | | | 10 | | | | 79,184 | | | | 5,428 | | | | 4.1 | % |
New Mexico | | | 9 | | | | 29,586 | | | | 5,075 | | | | 3.8 | % |
Illinois | | | 8 | | | | 31,872 | | | | 4,661 | | | | 3.5 | % |
Washington | | | 10 | | | | 57,785 | | | | 4,621 | | | | 3.5 | % |
Other 19 States | | | 81 | | | | 270,384 | | | | 32,154 | | | | 24.1 | % |
| | | | | | | | | | | | | | | | |
| | | 263 | | | $ | 1,156,234 | | | $ | 133,224 | | | | 100.0 | % |
| | | | | | | | | | | | | | | | |
Operator Diversification
| | | | | | | | | | | | | | | | | | | | | | | | |
| | | Properties | | | Investment | | | Annualized Rent | | | | |
Operator (Location) | | Aviv | | | Total | | | (GBV) | | | Rent | | | % | | | States | |
Daybreak (Denton, TX) | | | 52 | | | | 66 | | | $ | 168,516 | | | $ | 20,882 | | | | 15.7 | % | | | 2 | |
Saber (Bedford Heights, OH) | | | 30 | | | | 72 | | | | 185,312 | | | | 19,942 | | | | 15.0 | % | | | 6 | |
EmpRes (Vancouver, WA) | | | 17 | | | | 46 | | | | 111,830 | | | | 12,470 | | | | 9.4 | % | | | 6 | |
Preferred Care (Plano, TX) | | | 17 | | | | 110 | | | | 69,007 | | | | 10,478 | | | | 7.9 | % | | | 12 | |
Sun Mar (Brea, CA) | | | 13 | | | | 25 | | | | 71,075 | | | | 8,934 | | | | 6.7 | % | | | 1 | |
Maplewood (Westport, CT) | | | 6 | | | | 6 | | | | 86,586 | | | | 8,864 | | | | 6.7 | % | | | 1 | |
Fundamental (Sparks, MD) | | | 11 | | | | 104 | | | | 65,101 | | | | 5,866 | | | | 4.4 | % | | | 13 | |
Deseret (Bountiful, UT) | | | 18 | | | | 29 | | | | 38,374 | | | | 4,782 | | | | 3.6 | % | | | 5 | |
Genesis (Kennett Square, PA) | | | 10 | | | | 413 | | | | 52,422 | | | | 4,334 | | | | 3.3 | % | | | 28 | |
Prestige Care (Vancouver, WA) | | | 9 | | | | 69 | | | | 15,948 | | | | 4,300 | | | | 3.2 | % | | | 7 | |
Other 26 Operators | | | 80 | | | | 368 | | | | 292,062 | | | | 32,372 | | | | 24.3 | % | | | | |
| | | | | | | | | | | | | | | | | | | | | | | | |
| | | 263 | | | | 1,308 | | | $ | 1,156,234 | | | $ | 133,224 | | | | 100.0 | % | | | | |
| | | | | | | | | | | | | | | | | | | | | | | | |
| (1) | Data as of September 30, 2013. Coverage, occupancy, margin and revenue mix information is provided on a trailing twelve month basis through June 30, 2013. Annualized cash rent for leases in place as of September 30, 2013 and includes income from a deferred financing lease. Totals may not add due to rounding. |
2
Portfolio Summary
Occupancy information as of June 30, 2013; Lease maturity schedule as of September 30, 2013
State Occupancy1
| | | | | | | | | | | | |
| | | Aviv | | | State | | | | |
State | | Occupancy | | | Average | | | Variance | |
Texas | | | 75.2 | % | | | 71.9 | % | | | 3.3 | % |
California | | | 90.6 | % | | | 84.9 | % | | | 5.7 | % |
Ohio | | | 84.7 | % | | | 84.5 | % | | | 0.2 | % |
Connecticut | | | 98.6 | % | | | NA | | | | NA | |
Missouri | | | 73.8 | % | | | 71.8 | % | | | 2.0 | % |
Arkansas | | | 71.7 | % | | | 73.0 | % | | | (1.3 | %) |
Pennsylvania | | | 85.0 | % | | | 90.6 | % | | | (5.6 | %) |
New Mexico | | | 81.4 | % | | | 82.6 | % | | | (1.2 | %) |
Illinois | | | 74.5 | % | | | 77.8 | % | | | (3.3 | %) |
Washington | | | 84.8 | % | | | 80.1 | % | | | 4.7 | % |
Lease Maturity Schedule2
| | | | | | | | |
| | | Number of | | | % of | |
Year | | Properties | | | Total Rent | |
2013 | | | 1 | | | | 0.0 | % |
2014 | | | 1 | | | | 0.2 | % |
2015 | | | 8 | | | | 2.4 | % |
2016 | | | 6 | | | | 2.4 | % |
2017 | | | 16 | | | | 4.0 | % |
Thereafter | | | 230 | | | | 91.0 | % |
| | | | | | | | |
Total | | | 262 | | | | 100.0 | % |
| | | | | | | | |
| (1) | State occupancy represents nursing facility occupancies per American Health Care Association. Aviv only has assisted living properties in Connecticut. |
| (2) | Lease expiration schedule excludes one property without a lease in place at September 30, 2013. |
3
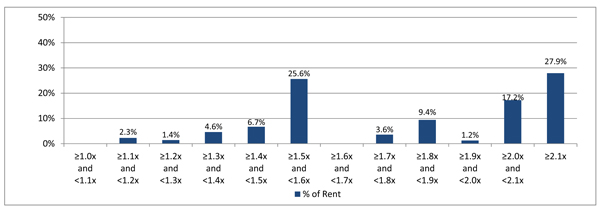
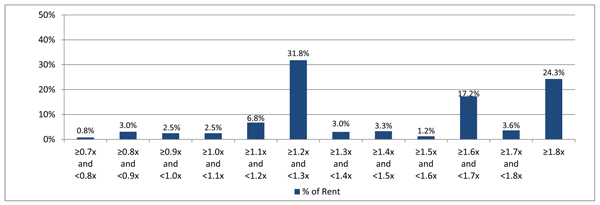
Portfolio Summary
Information for the trailing twelve month period ended June 30, 2013
EBITDARM Coverage Distribution
EBITDAR Coverage Distribution
4
Debt Summary and Capitalization
As of the quarter ended September 30, 2013; Dollars and shares/units in thousands
Debt Maturities1
| | | | | | | | | | | | | | | | |
| | | Senior Unsecured | | | Revolving | | | Mortgage | | | Total | |
Year | | Notes | | | Credit Facility | | | Debt | | | Debt | |
2013 | | $ | — | | | $ | — | | | $ | — | | | $ | — | |
2014 | | | — | | | | — | | | | — | | | | — | |
2015 | | | — | | | | — | | | | — | | | | — | |
2016 | | | — | | | | 95,000 | | | | — | | | | 95,000 | |
2017 | | | — | | | | — | | | | — | | | | — | |
Thereafter | | | 400,000 | | | | — | | | | 11,276 | | | | 411,276 | |
| | | | | | | | | | | | | | | | |
Subtotal | | $ | 400,000 | | | $ | 95,000 | | | $ | 11,276 | | | $ | 506,276 | |
(Discounts) and premiums, net | | | 2,862 | | | | — | | | | 2,435 | | | | 5,298 | |
| | | | | | | | | | | | | | | | |
Total debt | | $ | 402,862 | | | $ | 95,000 | | | $ | 13,712 | | | $ | 511,574 | |
| | | | | | | | | | | | | | | | |
Weighted average interest rate | | | | | | | | | | | | | | | 6.7 | % |
| | | | | | | | | | | | | | | | |
Weighted average maturity in years | | | | | | | | | | | | | | | 5.4 | |
| | | | | | | | | | | | | | | | |
Fixed and Floating Rate Debt
| | | | | | | | |
| | | Amount | | | % of Total | |
Fixed rate debt | | | | | | | | |
Senior unsecured notes | | $ | 400,000 | | | | 79.0 | % |
Mortgage debt | | | 11,276 | | | | 2.2 | % |
| | | | | | | | |
Total fixed rate debt | | $ | 411,276 | | | | 81.2 | % |
| | |
Floating rate debt | | | | | | | | |
Revolver | | $ | 95,000 | | | | 18.8 | % |
| | | | | | | | |
Total debt | | $ | 506,276 | | | | 100.0 | % |
| | | | | | | | |
Covenants for Senior Unsecured Notes2
| | | | | | |
Covenant | | Requirement | | Q3 2013 | |
Total debt / total assets | | No greater than 60% | | | 40 | % |
Secured debt / total assets | | No greater than 40% | | | 8 | % |
Interest coverage | | No less than 2.00x | | | 2.70x | |
Unencumbered assets / unsecured debt | | No less than 150% | | | 251 | % |
Enterprise Value
| | | | | | | | | | | | |
| | | Shares/units | | | | | | | |
| | | Outstanding | | | Price | | | Value | |
Common stock and OP units | | | 49,212 | | | $ | 22.80 | | | $ | 1,122,040 | |
Total debt | | | | | | | | | | | 511,574 | |
Cash and cash equivalents | | | | | | | | | | | (12,232 | ) |
| | | | | | | | | | | | |
Total enterprise value | | | | | | | | | | $ | 1,621,382 | |
| | | | | | | | | | | | |
| (1) | In October, the Company issued $250mm aggregate principal amount of 6% Senior Notes due 2021 and a portion of the proceeds were used to entirely pay down the revolving credit facility. |
| (2) | Covenants are calculated in accordance with the indenture governing the senior unsecured notes. |
5
Investment Activity
Data as of September 30, 2013 unless otherwise noted; Dollars in thousands
2013 Property Reinvestment and New Construction
| | | | | | | | | | | | |
Period | | Property
Reinvestment | | | New
Construction | | | Total | |
Third quarter | | $ | 1,993 | | | $ | 3,882 | | | $ | 5,875 | |
Second quarter | | | 3,011 | | | | 6,274 | | | | 9,285 | |
First quarter | | | 4,905 | | | | 1,824 | | | | 6,729 | |
| | | | | | | | | | | | |
| | | | | | | | | | $ | 21,889 | |
| | | | | | | | | | | | |
New Construction Projects
| | | | | | | | | | | | | | | | | | | | | | | | | | | | | | |
| | | | | | | | | | | | | | | | | Remaining | | | Total | | | | |
| | | Property | | | | | Opening | | | Acquisition | | | Spend Through | | | Costs to | | | Expected | | | Expected | |
Operator - Location | | Type | | Beds | | | Date | | | Costs | | | 9/30/2013 | | | be Spent | | | Cost | | | Yield | |
Daybreak - Eagle Lake, TX | | SNF | | | 80 | | | | Q1 2014 | | | $ | 101 | | | $ | 4,223 | | | $ | 1,476 | | | $ | 5,800 | | | | 11.0 | % |
Saber - Chatham, PA | | SNF | | | 120 | | | | Q1 2014 | | | | 2,200 | | | | 9,319 | | | | 681 | | | | 12,200 | | | | 11.0 | % |
Maplewood - Bethel, CT | | ALF | | | 80 | | | | Q1 2015 | | | | 2,400 | | | | 2,277 | | | | 14,223 | | | | 18,900 | | | | 9.5 | % |
| | | | | | | | | | | | | | | | | | | | | | | | | | | | | | |
Total | | | | | | | | | | | | $ | 4,701 | | | $ | 15,820 | | | $ | 16,380 | | | $ | 36,900 | | | | | |
| | | | | | | | | | | | | | | | | | | | | | | | | | | | | | |
2013 Acquisitions1
| | | | | | | | | | | | | | | | | | |
| | | Property | | | | | | | | | | | Initial | |
Period | | Type | | Location | | | Beds | | | Amount | | | Cash Yield | |
Fourth quarter (to date): | | | | | | | | | | | | | | | | | | |
November | | SNF | | | OH | | | | 636 | | | $ | 41,000 | | | | 9.9 | % |
November | | SNF | | | AR | | | | 74 | | | | 1,163 | | | | 11.0 | % |
October | | ALF | | | FL | | | | 230 | | | | 13,000 | | | | 10.0 | % |
October | | SNF | | | OH, IN | | | | 640 | | | | 35,900 | | | | 10.0 | % |
| | | | | |
Third quarter: | | | | | | | | | | | | | | | | | | |
September | | SNF | | | TX | | | | 96 | | | | 3,450 | | | | 11.0 | % |
August | | SNF | | | KY | | | | 107 | | | | 9,000 | | | | 10.6 | % |
| | | | | |
Second quarter: | | | | | | | | | | | | | | | | | | |
June | | SNF | | | OK | | | | 215 | | | | 6,200 | | | | 11.0 | % |
May | | SNF | | | OH | | | | 130 | | | | 14,350 | | | | 10.0 | % |
May | | ALF (Land) | | | CT | | | | N/A | | | | 2,400 | | | | N/A | |
April | | MOB | | | IN | | | | N/A | | | | 1,200 | | | | 11.0 | % |
April | | SNF | | | TX | | | | 80 | | | | 2,400 | | | | 11.0 | % |
April | | TBI | | | CA | | | | 6 | | | | 697 | | | | 9.5 | % |
April | | TBI | | | CA | | | | 6 | | | | 779 | | | | 9.5 | % |
| | | | | |
First quarter | | N/A | | | N/A | | | | 0 | | | | 0 | | | | 0.0 | % |
| | | | | | | | | | | | | | | | | | |
Total | | | | | | | | | 2,220 | | | $ | 131,539 | | | | 10.1 | % |
| | | | | | | | | | | | | | | | | | |
2012 Acquisitions
| | | | | | | | | | | | | | |
| | | | | | | | | | | Initial | |
Period | | Property Type | | Beds | | | Amount | | | Cash Yield | |
Fourth quarter | | SNF, ALF, TBI | | | 612 | | | $ | 38,867 | | | | 9.8 | % |
Third quarter | | SNF, LTACH, TBI | | | 294 | | | | 25,487 | | | | 10.3 | % |
Second quarter | | SNF, ALF | | | 1,959 | | | | 96,196 | | | | 10.1 | % |
First quarter | | SNF, ALF | | | 600 | | | | 23,775 | | | | 10.6 | % |
| | | | | | | | | | | | | | |
Total | | | | | 3,465 | | | $ | 184,325 | | | | 10.1 | % |
| | | | | | | | | | | | | | |
| (1) | Initial cash yield for 2013 acquisitions through fourth quarter to date excludes $2.4mm land parcel. |
6
Definitions
EBITDARM Coverage: Represents EBITDARM, which we define as earnings before interest, taxes, depreciation, amortization, rent expense and management fees allocated by the operator to one of its affiliates, of our operators for the applicable period, divided by the rent paid to us by our operators during each period.
EBITDAR Coverage:Represents EBITDAR, which we define as earnings before interest, taxes, depreciation, amortization and rent expense, of our operators for the applicable period, divided by the rent paid to us by our operators during such period. Assumes a management fee of 4%.
EBITDAR Margin: Represents the operator’s EBITDAR for the applicable period divided by the operator’s total revenue for the applicable period.
Enterprise Value: Represents equity market capitalization plus net debt. Equity market capitalization is calculated as the number of shares of common stock and units multiplied by the closing price of our common stock on the last day of the period presented. Net debt represents total debt less cash and cash equivalents.
Portfolio Occupancy:Represents the average daily number of beds at our properties that are occupied during the applicable period divided by the total number of beds at our properties that are available for use during the period.
Property Type:ALF = assisted living facility; LTACH = long-term acute care hospital; MOB = medical office building; TBI = traumatic brain injury facility; SNF = skilled nursing facility
State Average Occupancy: Represents the Nursing Facility State Occupancy Rate as reported by American Health Care Association (AHCA). AHCA occupancy data is calculated by dividing the sum of all facility patients in the state occupying certified beds by the sum of all the certified beds in the state reported at the time of the survey corresponding to the period presented. Aviv occupancy represents the state occupancy for the entire portfolio.
Yield: Represents annualized contractual or projected income to be received in cash divided by investment amount.
Portfolio metrics and other statistics are not derived from our financial statements but are operating statistics that we derive from reports that we receive from our operators pursuant to our triple-net leases. As a result, our portfolio metrics typically lag our own financial statements by approximately one quarter. In order to determine our portfolio metrics for the period presented, the metrics are stated only with respect to properties owned by us and operated by the same operator for the portion of the period we owned the properties and excludes assets held for sale, closed properties, properties under construction and, with certain exceptions for shorter periods, properties within 24 months of completion of construction. Accordingly, EBITDARM coverage, EBITDAR coverage, EBITDAR margin, portfolio occupancy and quality mix for the twelve months ended June 30, 2013 included 241 of the 262 properties in our portfolio as of June 30, 2013.
When we refer to the“total rent” of our portfolio, we are referring to the total monthly rent due under all of our triple-net leases as of the date specified, calculated based on the first full month following the specified date. We calculate“annualized rent” for properties during a period by utilizing the amount of rent under contract as of the last day of the period and assume that amount of rent was received in respect of such property throughout the entire period.
7