UNITED STATES
SECURITIES AND EXCHANGE COMMISSION
Washington, D.C. 20549
FORM 20-F
(Mark one)
| ¨ | REGISTRATION STATEMENT PURSUANT TO SECTION 12(b) OR (g) OF THE SECURITIES EXCHANGE ACT OF 1934 |
OR
| x | ANNUAL REPORT PURSUANT TO SECTION 13 OR 15(d) OF THE SECURITIES EXCHANGE ACT OF 1934 |
For the fiscal year ended December 31, 2012.
OR
| ¨ | TRANSITION REPORT PURSUANT TO SECTION 13 OR 15(d) OF THE SECURITIES EXCHANGE ACT OF 1934 |
OR
| ¨ | SHELL COMPANY REPORT PURSUANT TO SECTION 13 OR 15(d) OF THE SECURITIES EXCHANGE ACT OF 1934 |
for the transition period from __________ to ___________
Commission file number 001-35273
Cogo Group, Inc.
(Exact name of the Registrant as specified in its charter)
Cayman Islands
(Jurisdiction of incorporation or organization)
Room 1001, Tower C, Skyworth Building,
High-Tech Industrial Park,
Nanshan, Shenzhen 518057, PRC
Telephone: +86 (755) 2674-3210
(Address of principal executive offices)
Mr. Jeffrey Kang, Chief Executive Officer
Room 1001, Tower C, Skyworth Building
High-Tech Industrial Park
Nanshan, Shenzhen 518057, PRC
Telephone: +86 (755) 2674-3210
Facsimile: +86 (755) 2674-3522
(Name, Telephone, E-mail and/or Facsimile Number and Address of Company Contact Person)
Copies to:
Mitchell Nussbaum
Loeb & Loeb LLP
345 Park Avenue
New York, New York 10154
Telephone: (212) 407-4000
Fax: (212) 407-4990
Securities registered or to be registered pursuant to Section 12(b) of the Act:
ORDINARY SHARES, PAR VALUE $0.01
Securities registered or to be registered pursuant to Section 12(g) of the Act:
None.
Securities for which there is a reporting obligation pursuant to Section 15(d) of the Act:
None.
On December 31, 2012, the issuer had 31,110,922 ordinary shares outstanding.
Indicate by check mark if the registrant is a well-known seasoned issuer, as defined in Rule 405 of the Securities Act.
If this report is an annual or transition report, indicate by check mark if the registrant is not required to file reports pursuant to Section 13 or 15(d) of the Securities Exchange Act of 1934.
Indicate by check mark whether the registrant (1) has filed all reports required to be filed by Section 13 or 15(d) of the Securities Exchange Act of 1934 during the preceding 12 months (or for such shorter period that the registrant was required to file such reports), and (2) has been subject to such filing requirements for the past 90 days.
Indicate by check mark whether the registrant has submitted electronically and posted on its corporate Web site, if any, every Interactive Data File required to be submitted and posted pursuant to Rule 405 of Regulation S-T (§232.405 of this chapter) during the preceding 12 months (or for such shorter period that the registrant was required to submit and post such files).
Indicate by check mark whether the registrant is a large accelerated filer, an accelerated filer or a non-accelerated filer. See definition of “accelerated filer and large accelerated filer” in Rule 12b-2 of the Exchange Act.
| ¨ Large Accelerated filer | ¨ Accelerated filer | x Non-accelerated filer |
Indicate by check mark which basis of accounting the registrant has used to prepare the financial statements included in this filing:
| x US GAAP | ¨ | International Financial Reporting Standards as
issued by the International Accounting Standards
Board | ¨ Other |
If “Other” has been checked in response to the previous question, indicate by check mark which financial statement item the registrant has elected to follow.
If this is an annual report, indicate by check mark whether the registrant is a shell company (as defined in Rule 12b-2 of the Exchange Act).
Table of Contents
| | | | Page |
| | | | |
| PART I. | | | |
| ITEM 1. | | IDENTITY OF DIRECTORS, SENIOR MANAGEMENT AND ADVISERS | 2 |
| ITEM 2. | | OFFER STATISTICS AND EXPECTED TIMETABLE | 2 |
| ITEM 3. | | KEY INFORMATION | 2 |
| A. | | Selected financial data | 2 |
| B. | | Capitalization and Indebtedness | 4 |
| C. | | Reasons for the Offer and Use of Proceeds | 4 |
| D. | | Risk Factors | 4 |
| ITEM 4. | | INFORMATION ON THE COMPANY | 22 |
| ITEM 4A. | | UNRESOLVED STAFF COMMENTS | 32 |
| ITEM 5. | | OPERATING AND FINANCIAL REVIEW AND PROSPECTS | 33 |
| ITEM 6. | | DIRECTORS, SENIOR MANAGEMENT AND EMPLOYEES | 51 |
| A. | | Directors and senior management | 51 |
| B. | | Compensation | 52 |
| C. | | Board Practices | 55 |
| D. | | Employees | 57 |
| E. | | Share Ownership | 57 |
| ITEM 7. | | MAJOR SHAREHOLDERS AND RELATED PARTY TRANSACTIONS | 58 |
| A. | | Major shareholders | 58 |
| B. | | Related Party Transactions | 59 |
| C. | | Interests of Experts and Counsel | 60 |
| ITEM 8. | | FINANCIAL INFORMATION | 60 |
| A. | | Consolidated Statements and Other Financial Information | 60 |
| B. | | Significant Changes | 60 |
| ITEM 9. | | THE OFFER AND LISTING | 60 |
| A. | | Offer and Listing Details | 60 |
| B. | | Plan of Distribution | 60 |
| C. | | Markets | 61 |
| D. | | Dilution | 61 |
| E. | | Expenses of the Issue | 61 |
| ITEM 10. | | ADDITIONAL INFORMATION | 61 |
| A. | | Share Capital | 61 |
| B. | | Memorandum and Articles of Association | 61 |
| C. | | Material Contracts | 62 |
| D. | | Exchange controls | 62 |
| E. | | Taxation | 63 |
| F. | | Dividends and paying agents | 67 |
| G. | | Statement by experts | 67 |
| H. | | Documents on display | 67 |
| I. | | Subsidiary Information | 68 |
| ITEM 11. | | QUANTITATIVE AND QUALITATIVE DISCLOSURE ABOUT MARKET RISK | 68 |
| ITEM 12. | | DESCRIPTION OF SECURITIES OTHER THAN EQUITY SECURITIES | 69 |
| | | | |
| PART II. | | | |
| ITEM 13. | | DEFAULTS, DIVIDEND ARREARAGES AND DELINQUENCIES | 69 |
| ITEM 14. | | MATERIAL MODIFICATIONS TO THE RIGHTS OF SECURITY HOLDERS AND USE OF PROCEEDS | 69 |
| ITEM 15. | | CONTROLS AND PROCEDURES | 70 |
| ITEM 16. | | [RESERVED] | 71 |
| ITEM 16A. | | AUDIT COMMITTEE FINANCIAL EXPERT | 71 |
| ITEM 16B. | | CODE OF ETHICS. | 71 |
| ITEM 16C. | | PRINCIPAL ACCOUNTANT FEES AND SERVICES. | 72 |
| ITEM 16D. | | EXEMPTIONS FROM THE LISTING STANDARDS FOR AUDIT COMMITTEES. | 72 |
| ITEM 16E. | | PURCHASES OF EQUITY SECURITIES BY THE ISSUER AND AFFILIATED PURCHASERS. | 72 |
Table of Contents continued
| | | | Page |
| | | | |
| ITEM 16F. | | CHANGES IN REGISTRANT’S CERTIFYING ACCOUNTANT. | 73 |
| ITEM 16G. | | CORPORATE GOVERNANCE | 73 |
| | | | |
| PART III. | | | |
| ITEM 19. | | FINANCIAL STATEMENTS | 73 |
| ITEM 20. | | FINANCIAL STATEMENTS | 73 |
| ITEM 21. | | EXHIBITS | 73 |
FORWARD-LOOKING STATEMENTS
This Annual Report on Form 20-F (this “Annual Report”) contains “forward-looking statements” that represent our beliefs, projections and predictions about future events. All statements other than statements of historical fact are “forward-looking statements” including any projections of earnings, revenue or other financial items, any statements of the plans, strategies and objectives of management for future operations, any statements concerning proposed new projects or other developments, any statements regarding future economic conditions or performance, any statements of management’s beliefs, goals, strategies, intentions and objectives, and any statements of assumptions underlying any of the foregoing. Words such as “may”, “will”, “should”, “could”, “would”, “predicts”, “potential”, “continue”, “expects”, “anticipates”, “future”, “intends”, “plans”, “believes”, “estimates” and similar expressions, as well as statements in the future tense, identify forward-looking statements.
These statements are necessarily subjective and involve known and unknown risks, uncertainties and other important factors that could cause our actual results, performance or achievements, or industry results, to differ materially from any future results, performance or achievements described in or implied by such statements. Actual results may differ materially from expected results described in our forward-looking statements, including with respect to correct measurement and identification of factors affecting our business or the extent of their likely impact, the accuracy and completeness of the publicly available information with respect to the factors upon which our business strategy is based on the success of our business.
A variety of factors, some of which are outside our control, may cause our operating results to fluctuate significantly. They include:
| · | the availability and cost of products from our suppliers incorporated into our customized module design solutions; |
| · | changes in end-user demand for the products manufactured and sold by our customers; |
| · | general and cyclical economic and business conditions, domestic or foreign, and, in particular, those in China’s mobile handset, telecommunications equipment and digital media industries; |
| · | the rate of introduction of new products by our customers; |
| · | the rate of introduction of enabling technologies by our suppliers; |
| · | changes in our pricing policies or the pricing policies of our competitors or suppliers; |
| · | our ability to compete effectively with our current and future competitors; |
| · | our ability to manage our growth effectively, including possible growth through acquisitions; |
| · | our ability to enter into and renew key corporate and strategic relationships with our customers and suppliers; |
| · | changes in our relationship with any of our key customers; |
| · | changes in the favorable tax incentives enjoyed by our People’s Republic of China (“PRC”) operating companies; |
| · | foreign currency exchange rates fluctuations; |
| · | adverse changes in the securities markets; and |
| · | legislative or regulatory changes in the PRC. |
Although we believe that the expectations reflected in the forward-looking statements are reasonable, we cannot guarantee future results, levels of activity, performance or achievements. Our expectations are as of the date this Annual Report is filed, and we do not intend to update any of the forward-looking statements after the filing date to conform these statements to actual results, unless required by law.
Forward-looking statements should not be read as a guarantee of future performance or results, and will not necessarily be accurate indications of whether, or the times by which, our performance or results may be achieved. Forward-looking statements are based on information available at the time those statements are made and management’s belief as of that time with respect to future events, and are subject to risks and uncertainties that could cause actual performance or results to differ materially from those expressed in or suggested by the forward-looking statements. Important factors that could cause such differences include, but are not limited to, those factors discussed under the headings “Item 3. Key Information – Risk Factors”, “Item 5. Operating and Financial Review and Prospects”, “Item 4. Information on the Company” and elsewhere in this Annual Report.
This Annual Report should be read in conjunction with the audited financial statements of Cogo Group, Inc. (“we,” “Cogo” or the “Company”) and the accompanying notes thereto, which are included in Item 19 of this Annual Report.
PART I.
| ITEM 1. | IDENTITY OF DIRECTORS, SENIOR MANAGEMENT AND ADVISERS |
Not required.
| ITEM 2. | OFFER STATISTICS AND EXPECTED TIMETABLE |
Not required.
| A. | Selected financial data |
The following selected consolidated statement of comprehensive income/(loss) data for each of the years in the five-year period ended December 31, 2012 and selected consolidated balance sheet data as of December 31, 2012, 2011, 2010, 2009, and 2008, presented below are derived from our audited consolidated financial statements, which have been prepared in accordance with U.S. generally accepted accounting principles (“U.S. GAAP”) and have been audited by KPMG, an independent registered public accounting firm. The selected consolidated statement of comprehensive income/(loss) data for the years ended December 31, 2009 and 2008 and the selected consolidated balance sheet data as of December 31, 2010, 2009 and 2008 were derived from our audited financial statements which are not included in this Annual Report.
The selected consolidated financial statement data should be read in conjunction with our “Management’s discussion and analysis of financial condition and results of operations” and our audited consolidated financial statements and the related notes included elsewhere in this Annual Report.
The selected consolidated financial statement data are expressed in Renminbi (“RMB”), the national currency of the PRC. Solely for the convenience of the reader, the December 31, 2012 amounts have been translated into United States dollars (“USD”) at the closing rate in New York City on December 31, 2012 for cable transfers in RMB as certified for customers purposes by the Federal Reserve Bank of New York of USD1.0000 = RMB6.2301. No representation is made that the RMB could have been, or could be, converted into USD at that rate or at any other rate on December 31, 2012, or at any other date.
Selected Consolidated Statement of Comprehensive Income/(Loss) Data
| | | Year Ended December 31, | |
| | | 2012 USD | | | 2012 RMB | | | 2011 RMB | | | 2010 RMB | | | 2009 RMB | | | 2008 RMB | |
| | | (in thousands, except share and per share amounts) | |
| Net revenue | | | | | | | | | | | | | | | | | | | | | | | | |
| Product sales | | | 785,003 | | | | 4,890,649 | | | | 3,554,401 | | | | 2,554,991 | | | | 2,066,815 | | | | 1,931,845 | |
| Service revenue | | | — | | | | — | | | | — | | | | 34,527 | | | | 29,401 | | | | 27,695 | |
| | | | | | | | | | | | | | | | | | | | | | | | | |
| | | | 785,003 | | | | 4,890,649 | | | | 3,554,401 | | | | 2,589,518 | | | | 2,096,216 | | | | 1,959,540 | |
| Cost of sales | | | | | | | | | | | | | | | | | | | | | | | | |
| Cost of goods sold | | | (733,036 | ) | | | (4,566,886 | ) | | | (3,157,009 | ) | | | (2,194,901 | ) | | | (1,771,166 | ) | | | (1,624,101 | ) |
| Cost of services | | | — | | | | — | | | | — | | | | (27,971 | ) | | | (23,716 | ) | | | (18,664 | ) |
| | | | | | | | | | | | | | | | | | | | | | | | | |
| | | | (733,036 | ) | | | (4,566,886 | ) | | | (3,157,009 | ) | | | (2,222,872 | ) | | | (1,794,882 | ) | | | (1,642,765 | ) |
| Gross profit | | | 51,967 | | | | 323,763 | | | | 397,392 | | | | 366,646 | | | | 301,334 | | | | 316,775 | |
| Selling, general and administrative expenses | | | (25,421 | ) | | | (158,377 | ) | | | (188,083 | ) | | | (191,855 | ) | | | (124,842 | ) | | | (152,898 | ) |
| Research and development expenses | | | (16,457 | ) | | | (102,531 | ) | | | (101,639 | ) | | | (77,888 | ) | | | (67,504 | ) | | | (50,947 | ) |
| Provision for doubtful accounts | | | — | | | | — | | | | (2,325 | ) | | | (2 | ) | | | (35,992 | ) | | | (6,847 | ) |
| Net gain on settlement relating to the acquisition of Long Rise before goodwill impairment | | | — | | | | — | | | | — | | | | 43,676 | | | | — | | | | — | |
| Impairment loss of goodwill and intangible assets | | | — | | | | — | | | | (236,945 | ) | | | (21,422 | ) | | | — | | | | (33,759 | ) |
| Other operating income / (loss), net | | | 569 | | | | 3,546 | | | | (842 | ) | | | 463 | | | | 116 | | | | 214 | |
| | | | | | | | | | | | | | | | | | | | | | | | | |
| Income / (loss) from operations | | | 10,658 | | | | 66,401 | | | | (132,442 | ) | | | 119,618 | | | | 73,112 | | | | 72,538 | |
| Gain on disposal of subsidiaries | | | 90 | | | | 558 | | | | — | | | | — | | | | — | | | | — | |
| Interest expense | | | (4,186 | ) | | | (26,081 | ) | | | (20,152 | ) | | | (9,407 | ) | | | (1,963 | ) | | | (1,056 | ) |
| Interest income | | | 2,194 | | | | 13,668 | | | | 14,928 | | | | 14,693 | | | | 14,490 | | | | 27,895 | |
| | | | | | | | | | | | | | | | | | | | | | | | | |
| Earnings / (loss) before income taxes and extraordinary item | | | 8,756 | | | | 54,546 | | | | (137,666 | ) | | | 124,904 | | | | 85,639 | | | | 99,377 | |
| Income tax expense(1) | | | (937 | ) | | | (5,839 | ) | | | (11,553 | ) | | | (11,849 | ) | | | (9,207 | ) | | | (2,215 | ) |
| | | | | | | | | | | | | | | | | | | | | | | | | |
| Income / (loss) before extraordinary item | | | 7,819 | | | | 48,707 | | | | (149,219 | ) | | | 113,055 | | | | 76,432 | | | | 97,162 | |
| Extraordinary item, net of nil tax | | | — | | | | — | | | | — | | | | — | | | | 6,737 | | | | — | |
| | | | | | | | | | | | | | | | | | | | | | | | | |
| Net income / (loss) | | | 7,819 | | | | 48,707 | | | | (149,219 | ) | | | 113,055 | | | | 83,169 | | | | 97,162 | |
| Less net income attributable to noncontrolling interests | | | (3,945 | ) | | | (24,577 | ) | | | (7,386 | ) | | | (680 | ) | | | (2,945 | ) | | | (1,255 | ) |
| | | | | | | | | | | | | | | | | | | | | | | | | |
| Net income / (loss) attributable to Cogo Group, Inc. | | | 3,874 | | | | 24,130 | | | | (156,605 | ) | | | 112,375 | | | | 80,224 | | | | 95,907 | |
| Earnings / (loss) per share attributable to Cogo Group, Inc. | | | | | | | | | | | | | | | | | | | | | | | | |
| Income / (loss) before extraordinary item | | | 0.11 | | | | 0.66 | | | | (4.22 | ) | | | 3.01 | | | | 2.01 | | | | 2.49 | |
| Extraordinary item | | | — | | | | — | | | | — | | | | — | | | | 0.19 | | | | — | |
| | | | | | | | | | | | | | | | | | | | | | | | | |
| Basic | | | 0.11 | | | | 0.66 | | | | (4.22 | ) | | | 3.01 | | | | 2.20 | | | | 2.49 | |
| | | | | | | | | | | | | | | | | | | | | | | | | |
| Income / (loss) before extraordinary item | | | 0.11 | | | | 0.66 | | | | (4.22 | ) | | | 2.94 | | | | 1.95 | | | | 2.42 | |
| Extraordinary item | | | — | | | | — | | | | — | | | | — | | | | 0.18 | | | | — | |
| | | | | | | | | | | | | | | | | | | | | | | | | |
| Diluted | | | 0.11 | | | | 0.66 | | | | (4.22 | ) | | | 2.94 | | | | 2.13 | | | | 2.42 | |
| | | | | | | | | | | | | | | | | | | | | | | | | |
| Weighted average number of common shares outstanding | | | | | | | | | | | | | | | | | | | | | | | | |
| Basic | | | | | | | 36,355,124 | | | | 37,094,995 | | | | 37,275,427 | | | | 36,541,037 | | | | 38,488,861 | |
| | | | | | | | | | | | | | | | | | | | | | | | | |
| Diluted | | | | | | | 36,488,041 | | | | 37,094,995 | | | | 38,188,814 | | | | 37,673,351 | | | | 39,585,921 | |
| Selected Consolidated Balance Sheet Data | | As of December 31, | |
| | | 2012 USD | | | 2012 RMB | | | 2011 RMB | | | 2010 RMB | | | 2009 RMB | | | 2008 RMB | |
| | | (in thousands) | |
| Cash | | | 52,140 | | | | 324,839 | | | | 572,364 | | | | 699,650 | | | | 667,320 | | | | 686,379 | |
| Accounts receivable, net | | | 113,155 | | | | 704,968 | | | | 941,798 | | | | 681,911 | | | | 617,613 | | | | 497,992 | |
| Property and equipment, net | | | 2,811 | | | | 17,515 | | | | 17,891 | | | | 14,613 | | | | 14,406 | | | | 17,993 | |
| Total assets | | | 380,693 | | | | 2,371,758 | | | | 2,559,988 | | | | 2,322,017 | | | | 1,921,527 | | | | 1,686,810 | |
| Total current liabilities | | | 121,957 | | | | 759,812 | | | | 1,014,411 | | | | 600,905 | | | | 350,397 | | | | 257,662 | |
| Total liabilities | | | 125,369 | | | | 781,066 | | | | 1,039,838 | | | | 614,682 | | | | 369,505 | | | | 277,355 | |
| Total equity | | | 255,324 | | | | 1,590,692 | | | | 1,520,150 | | | | 1,707,335 | | | | 1,552,022 | | | | 1,409,455 | |
| (1) | Certain of our operating subsidiaries were entitled to tax holidays. The effect of the tax holiday increased our net income for 2012, 2011, 2010, 2009 and 2008 by RMB29.1 million (USD4.7 million), RMB33.9 million, RMB26.5 million, RMB29.5 million and RMB28.2 million, respectively (equivalent to basic earnings per share amount of RMB0.80 (USD0.13), RMB0.92, RMB0.71, RMB0.81 and RMB0.73 and a diluted earnings per share amount of RMB0.80 (USD0.13), RMB0.92, RMB0.69, RMB0.78 and RMB0.71 for the years ended December 31, 2012, 2011, 2010, 2009 and 2008, respectively. |
The following table sets forth information concerning exchange rates between the RMB and the U.S. dollar for the periods indicated. On April 12, 2013, the buying rate announced by Federal Reserve Statistical Release was RMB6.1914 to $1.00.
| | | Spot Exchange Rate | |
| Period | | Period Ended | | | Average (1) | | | Low | | | High | |
| | | (RMB per US$1.00) | |
| 2008 | | | 6.8225 | | | | 6.9477 | | | | 7.2946 | | | | 6.7800 | |
| 2009 | | | 6.8259 | | | | 6.8295 | | | | 6.8180 | | | | 6.8395 | |
| 2010 | | | 6.6000 | | | | 6.7603 | | | | 6.6000 | | | | 6.8305 | |
| 2011 | | | 6.2939 | | | | 6.4633 | | | | 6.2939 | | | | 6.6364 | |
| 2012 | | | 6.2301 | | | | 6.2990 | | | | 6.2265 | | | | 6.3684 | |
| September | | | 6.2848 | | | | 6.3200 | | | | 6.2848 | | | | 6.3489 | |
| October | | | 6.2372 | | | | 6.2627 | | | | 6.2372 | | | | 6.2877 | |
| November | | | 6.2265 | | | | 6.2221 | | | | 6.2221 | | | | 6.2454 | |
| December | | | 6.2301 | | | | 6.2328 | | | | 6.2251 | | | | 6.2502 | |
| 2013 (through April 12) | | | 6.1914 | | | | 6.2105 | | | | 6.1914 | | | | 6.2213 | |
| January | | | 6.2186 | | | | 6.2215 | | | | 6.2134 | | | | 6.2303 | |
| February | | | 6.2213 | | | | 6.2323 | | | | 6.2213 | | | | 6.2438 | |
| March | | | 6.2108 | | | | 6.2157 | | | | 6.2105 | | | | 6.2246 | |
| Source: | Federal Reserve Statistical Release |
| (1) | Annual averages, lows, and highs are calculated from month-end rates. Monthly averages, lows, and highs are calculated using the daily rates during the relevant period. |
| B. | Capitalization and Indebtedness |
Not required.
| C. | Reasons for the Offer and Use of Proceeds |
Not required.
You should carefully consider the following risk factors, together with all of the other information included in this annual report.
Risks Related to Our Business
Our operating results fluctuate from quarter to quarter.
Our quarterly revenue, income and other operating results have fluctuated in the past and may fluctuate significantly in the future due to a number of factors, including the following:
| · | the ability of our suppliers to meet our supply requirements; |
| · | the cancellation of large orders; |
| · | the time required for research and development; |
| · | changing design requirements resulting from rapid technology shifts; and |
| · | industry trends impacting the overall market for our customers’ end-products. |
As a result of these and other factors, our results of operations may vary on a quarterly basis and net revenue may be adversely affected from period to period. Our results of operations for a particular quarter may not be indicative of our future performance. If our operating results in a quarter fall below our expectations or the expectations of market analysts or investors, the price of our ordinary shares is likely to decrease.
Our operating results are substantially dependent on development of new customized module design solutions.
We may be unable to develop new customized module design solutions in a timely or cost-efficient manner, and these new solutions may fail to meet the requirements of our customers’ end-markets. If we fail to develop new solutions that help our customers respond to competitive pressures, achieve shorter time-to-market or broaden and improve their product offerings, we will lose business and our results of operations will be materially and adversely affected.
If our customers do not accept our proposed customized module design solutions or do not purchase from us the specified components contained in the proposed module reference design, our net revenue will be adversely affected.
While many of our proposed customized module design solutions are accepted by our customers, there is no obligation for customers to accept our proposed solutions. We dedicate personnel, management and financial resources to research and development and technical support in developing new customized module design solutions for our customers. The time frames for most research and development projects typically range from two to eighteen months. For product sales, because we do not charge a design fee, but rather generate revenue through the resale of specified components contained in our proposed reference designs, if our customers do not accept our proposed designs, we will fail to capitalize on the invested resources, time and effort that we expended on a project. Furthermore, our customers typically make purchases on a purchase order basis. Prior to submission of a purchase order, our customers are not obligated to purchase from us any quantity of specific components that we propose to sell in our proposed module reference design. Our customers may cancel or defer their purchase orders on short notice without significant penalty. Even if a customer accepts our proposed module reference design, the customer could bypass us and contract with our competitors or possibly our suppliers directly for the purchase of the specific components we otherwise had proposed to sell. The failure to accept our proposed module reference design, the loss of ongoing business from our customers or the transition away from us in favor of direct purchases from our competitors or suppliers could each result in our failure to realize potentially significant net revenue.
Reliance on our suppliers, with whom we often do not have long-term supply agreements, makes us vulnerable to the loss of one or more key suppliers or the delivery capabilities of our suppliers.
We typically rely on a limited number of key suppliers, and many customized module design solutions that we develop are designed around technology components provided by our suppliers. We typically do not have long-term supply agreements or other forms of exclusive arrangements with our suppliers. In 2012, for example, Broadcom, Sandisk, Freescale Semiconductor and Atmel accounted for approximately 45.7%, 9.6%, 6.9% and 5.8%, respectively, of our cost of sales. If we lose a key supplier or a supplier reduces the quantity of products it sells to us, does not maintain a sufficient inventory level of products required by us or is otherwise unable to meet our demand for its components, we may have to expend significant time, effort and other resources to locate a suitable alternative supplier and secure replacement components. For example, on one prior occasion, one of our key suppliers experienced an interruption in its production capacity due to a relocation of its production facilities, which resulted in its inability to meet our quarterly supply requirements. If suitable replacement components are unavailable, we may be forced to redevelop certain of our solutions, which ultimately may not be accepted by our customers.
Also, if our suppliers fail to introduce new products that keep up with new technologies, they may be surpassed by other suppliers entering the market with whom we may not have existing relationships. The costs and delays related to finding new suppliers or redeveloping solutions could significantly harm our business.
If we fail to attract and retain key personnel, particularly our chief executive officer, our business will be materially impaired and our financial condition and results of operations will suffer.
Our business greatly relies on the continued services of Jeffrey Kang, our principal shareholder and chief executive officer. Many relationships with our key suppliers and key customers have been developed by and continue to be maintained by Mr. Kang. Our future success will depend to a significant degree upon the performance and contribution of Mr. Kang and other members of our senior management team in areas including sales, research and development, information technology and finance. Therefore, our business and results of operations may be materially and adversely affected if Mr. Kang or another member of our senior management team leaves us, which they may do at any time. In addition, we will incur additional expenses to recruit and develop senior management members if one or more of our key employees are unwilling or unable to continue his or her employment with us. We do not maintain any life insurance covering our senior management or any of our key employees.
Our future success also depends on our ability to identify, attract, hire, train, retain and motivate highly-skilled personnel. If we cannot attract and retain the personnel we require at a reasonable cost, our cost of goods sold will increase and the profitability of our business could be negatively affected. Our business is especially dependent on sales, marketing, research and development, and services personnel. Competition in the PRC for executive-level and skilled technical and sales and marketing personnel is strong, and recruiting, training, and retaining qualified key personnel are important factors affecting our ability to meet our growth objectives. Should key employees leave our company, we may lose both an important internal asset and net revenue from customer projects in which those employees were involved.
Loss of key customers may adversely impact our net revenue.
We generate the majority of our net revenue from a small number of key customers, and we anticipate that a relatively small number of key customers will continue to account for a significant portion of our net revenue in the foreseeable future, particularly in the telecommunications equipment market. In 2012, our sales to ZTE, T&W Electronics, Yulong and Wuhan Research Institute of Post & Telecommunications accounted for approximately 16.1%, 9.7%, 5.6% and 4.2%, respectively, of our net revenue. Sales to our top 10 customers represented approximately 51.3% of our net revenue in 2012. Should we lose, receive reduced orders from, or experience any adverse change in our relationship with any of our key customers, or should they decide to use solutions provided by other companies, we will suffer a substantial loss in net revenue.
The end-markets in which we operate are highly competitive and fragmented. Competition may intensify in the future, and if we fail to compete effectively, our business will be harmed.
Pressures from current or future competitors could cause our solutions to lose market acceptance or require us to significantly reduce our sales prices to keep and attract customers. Our competitors often have longer operating histories, stronger customer and supplier relationships, larger technical staffs and sales forces, and/or greater financial, technical and marketing resources than we do. Although we believe that there are no direct competitors of any meaningful size who operate using the same business model as ours, we face indirect competition from:
| · | Other technology component suppliers. For each project, we work with one enabling technology component supplier to compete against other enabling technology component suppliers. Consequently, we indirectly compete against our suppliers’ competitors. For example, by working with JDS Uniphase, we compete against companies such as Avanex Corp. and Bookham Inc. in supplying optical transmission module design solutions. |
| · | Component manufacturers and distributors. We compete indirectly with component manufacturers such as Epcos AG, and component distributors such as Arrow Electronics, Inc. and Avnet Inc., which may seek to expand their product/service offerings to include customized module design solutions. |
We may also face indirect competition from customers and suppliers. Currently many of our customers and suppliers do not focus on customized module design. If our customers or suppliers decide to devote more time and resources to in-house module design, the demand for our solutions may decline. In addition, our customers may change their procurement strategy or decide to rely on us primarily for component delivery and not for integration or design work. Similarly, component suppliers may also seek to offer their component products or modules incorporating key components from our solutions directly to our customers. The loss of customers for our customized module design solutions as a result of these competitive factors would have a material adverse effect on our business, financial condition and results of operations.
As we expand our business, we intend to develop new customized module design solutions and technological capabilities in end-markets where we do not currently have extensive experience or technological capability. Failure to develop or execute this growth strategy will have a material adverse effect on our net revenue.
Prior to 2005, we derived substantially all of our net revenue from our customized module design solutions provided to customers in the mobile handset and telecommunications equipment end-markets. In 2005, we began targeting the digital media end-market. In 2006 and 2007, we began our own business of providing engineering service and software design, respectively. In 2008, we also started targeting the industrial business end-market. Our success in the digital media end-market will depend, in significant part, on our ability to continue to develop the necessary technological capability and to leverage our existing customer base that has expanded into this end-market. If we are unable to quickly develop technological expertise, increase our research and development capabilities and leverage our customer base as anticipated, our return on our investment with respect to these efforts may be lower than anticipated and our operating results may suffer. Finally, our customer base may not respond to our efforts to expand our proprietary capabilities and may be unwilling to utilize these enhanced capabilities.
We may be unable to manage rapid growth and a changing operating environment, which could adversely affect our ability to serve our customers and harm our business.
We have experienced rapid growth over the last five years, with our net revenue increasing from RMB1,960 million in 2008 to RMB4,891 million (USD785 million) in 2012. Our number of employees has increased from approximately 30 in 2001 to 540 as of December 31, 2012. We have limited operational, administrative and financial resources, which may be inadequate to sustain our current growth rate. If we are unable to manage our growth effectively, the quality of our solutions could deteriorate and our business may suffer. As our customer base increases and we enter new end-markets, we will need to:
| · | increase our investments in personnel, research and development capabilities, facilities and other operational areas; |
| · | continue training, motivating and retaining our existing employees, and attract and integrate new qualified employees; |
| · | develop and improve our operational, financial, accounting and other internal systems and controls; and |
| · | take enhanced measures to protect any proprietary technology or technological capability we develop. |
Any failure to manage our growth successfully could distract management’s attention and result in our failure to serve our customers and harm our business.
We face risks associated with future investments or acquisitions.
An important component of our growth strategy is to invest in or acquire businesses complementary to ours that will enable us to expand the solutions we offer to our existing target customer base, and that will provide opportunities to expand into new markets. We may be unable to identify suitable investment or acquisition candidates or to make these investments or acquisitions on a commercially reasonable basis, if at all. If we complete an investment or acquisition, we may not realize the anticipated benefits from the transaction.
Integrating an acquired company or technology is complex, distracting and time consuming, as well as a potentially expensive process. The successful integration of an acquisition would require us to:
| · | integrate and retain key management, sales, research and development, and other personnel; |
| · | incorporate the acquired products or capabilities into our offerings both from an engineering and sales and marketing perspective; |
| · | coordinate research and development efforts; |
| · | integrate and support pre-existing supplier, distribution and customer relationships; and |
| · | consolidate duplicate facilities and functions and combine back office accounting, order processing and support functions. |
The geographic distance between the companies, the complexity of the technologies and operations being integrated and the disparate corporate cultures being combined may increase the difficulties of combining an acquired company or technology. Acquired businesses are likely to have different standards, controls, contracts, procedures and policies, making it more difficult to implement and harmonize company-wide financial, accounting, billing, information and other systems. Management’s focus on integrating operations may distract attention from our day-to-day business and may disrupt key research and development, marketing or sales efforts.
Our acquisition strategy also depends on our ability to obtain necessary government approvals that may be required, as described under “—Risks Related to Doing Business in the PRC—Our acquisition strategy may be subject to SDRC approval under legislation enacted in 2004.”
Our competitive position could decline if we are unable to obtain additional financing to acquire businesses or technologies that are strategic for our success, or otherwise execute our business strategy.
We believe that our current cash will be sufficient to fund our working capital and capital expenditure requirements for at least the next twelve months. However, we may need to raise additional funds to support more rapid expansion, respond to competitive pressures, acquire complementary businesses or technologies or respond to unanticipated requirements. We cannot assure you that additional funding will be available to us in amounts or on terms acceptable to us. If sufficient funds are not available or are not available on acceptable terms, our ability to fund our expansion, take advantage of acquisition opportunities, develop or enhance our services or products, or otherwise respond to competitive pressures would be significantly limited.
If appropriate opportunities arise, we intend to acquire businesses, technologies, services or products that we believe are strategic for our success. Our competitive position could decline if we are unable to identify and acquire businesses or technologies that are strategic for our success in this market.
The unauthorized use of our intellectual property could have a material adverse impact on our net revenue.
Our in-house design engineering teams develop our customized module design solutions. We typically do not have patent or other intellectual property protection for our solutions, nor do we typically have non-disclosure or confidentiality agreements with most of our suppliers or customers to keep our design specifications confidential. Suppliers or other competitors may attempt to circumvent us by selling products or providing module design solutions directly to our customers. The unauthorized use by our suppliers or other competitors of our module design solution specifications or other intellectual property in the future would result in a substantial decrease in our net revenue. The validity, enforceability and scope of protection of intellectual property in the PRC is uncertain and still evolving, and PRC laws may not protect intellectual property rights to the same extent as the laws of some other jurisdictions, such as the United States. Moreover, litigation may be necessary in the future to enforce any intellectual property rights we may establish or acquire in the future, which could result in substantial costs and diversion of our resources, and have a material adverse effect on our business, financial condition and results of operations.
We became a public company through a share exchange with a non-operating public shell company, where we were the accounting acquirer and assumed all known and unknown potential liabilities of our predecessor entity.
Our July 2004 share exchange with Trident Rowan Group, Inc. (“Trident”) was accounted for as a reverse merger in which Comtech Group, a Cayman Islands company (“Comtech Cayman”) was deemed the accounting acquirer and Trident, which was originally incorporated in 1917, was the legal acquirer. We have retained all the known and unknown liabilities of Trident. There may be other potential liabilities about which we are not yet aware.
We continue to act as the guarantors of certain subsidiaries (the “Disposal Group”) that we sold to Envision Global Group (“Envision”), including Comtech Communication Technology (Shenzhen) Company Limited (“Comtech Communication”), Comtech International (Hong Kong) Limited (“Comtech Hong Kong”), Comtech Software Technology (Shenzhen) Company Limited (“Comtech Software”) and Epcot Multimedia Technology (SZ) Co. Ltd. (“Epcot”), for existing credit facilities granted to the Disposal Group and for certain suppliers and customers of the Disposal Group. If any of the Disposal Group entities fail to meet their repayment obligations, our operating results would be adversely affected by any amounts we could become liable to cover on their behalf.
Pursuant to a Sale and Purchase Agreement dated October 23, 2012 with Envision (the “Envision Agreement”), we sold certain subsidiaries, including Comtech Communication, Comtech Hong Kong, Comtech Software and Epcot, to Envision for a total consideration of USD78 million. The transactions contemplated by the Envision Agreement closed and the entire purchase price was fully received on November 15, 2012 (“Date of Sale”). In connection with the disposal, we agreed to continue to provide certain transitional guarantee services (the “Transitional Guarantee Services”), whereby we act as the guarantors of the Disposal Group and continue to provide and honor, from the Date of Sale until December 31, 2014 (unless earlier terminated by mutual consent): (i) guarantees given by us and our subsidiaries in favor of banks and financial institutions in respect of all existing credit facilities granted to the Disposal Group; and (ii) guarantees given by us and our subsidiaries in favor of the Disposal Group’s suppliers and customers subject to a maximum cap of USD60 million. In consideration of the Transitional Guarantee Services provided by us, Envision agreed to pay a guarantee service fee of USD250,000 (or pro-rated if terminated earlier) each 3 month-period following the Date of Sale.
If the Disposal Group or Envision fails to repay the banks or its suppliers or customers, we will become liable for the amounts owed by the Disposal Group under the terms of its agreements with such creditors, which could materially and adversely affect our operating results and financial condition.
We depend upon contractual agreements with the legal shareholders of Shenzhen Comtech International Limited (“Shenzhen Comtech”) and Shanghai Comtech Electronic Technology Company Limited (“Shanghai Comtech”) to conduct our business and receive payments through Shenzhen Comtech, Shanghai Comtech and Shanghai E&T System Company Limited (“Shanghai E&T”). Such contractual arrangements may not be as effective in providing operational control as direct ownership and may be difficult to enforce. Further, if the PRC government finds these contractual agreements violate or conflict with PRC governmental regulations, our business would be materially adversely affected.
At the time of its incorporation, foreign shareholding in a trading business such as Shenzhen Comtech could not exceed 65%. With subsequent PRC deregulation, foreign ownership of such a trading business can now reach 100%, and approval of foreign ownership of companies in the PRC engaged in commodity trading businesses—which includes agency trade, wholesale, retail and franchise operations is now delegated to local government agencies of the PRC Ministry of Commerce.
In order to exercise control over Shenzhen Comtech (a PRC operating company legally permitted to engage in a commodity trading business), without direct shareholding by us (a U.S.-listed company and therefore a foreign-invested entity), Honghui Li, our vice president, and Huimo Chen, the mother of our principal shareholder and chief executive officer, Jeffrey Kang, hold 99% and 1%, respectively, of the equity interests of Shenzhen Comtech, and through contractual agreements with us hold such equity interests exclusively for the benefit of our 100% directly owned subsidiary. Shenzhen Comtech, in turn owns a 19% equity interest in another of our PRC operating companies, Shanghai E&T, and Shanghai Comtech owns the remaining 81%. While we do not have any equity interest in either Shenzhen Comtech, or Shanghai Comtech or Shanghai E&T, through these contractual agreements, we enjoy voting control and are entitled to the economic interests associated with the equity interest in these three entities. These contractual agreements may not be as effective as direct ownership in providing us with control over Shenzhen Comtech, Shanghai Comtech and Shanghai E&T because we rely on the performance of legal shareholders under the agreements. If these shareholders fail to perform their respective obligations under the agreements, we may have to incur substantial costs and resources to enforce such agreements and may not be able to do so in any case. Further, the profits of Shenzhen Comtech, Shanghai Comtech and Shanghai E&T may not be able to be remitted outside the PRC due to foreign exchange controls. Also, we must rely on legal remedies under applicable law, which may not be as effective as those in the United States. Because we rely on Shenzhen Comtech, Shanghai Comtech and Shanghai E&T in conducting our business operations in the PRC, the realization of any of these risks relating to our corporate structure could result in a material disruption of our business, diversion of our resources and the incurrence of substantial costs, any of which could materially and adversely affect our operating results and financial condition.
Pursuant to the Envision Agreement, we sold certain subsidiaries, including Comtech Communication, Comtech Hong Kong, Comtech Software and Epcot, to Envision for a total consideration of USD78 million. The entire purchase price was received and the transactions contemplated by the Envision Agreement closed on November 15, 2012. One of our indirectly controlled subsidiaries, Shanghai Comtech, did not form part of the Disposal Group, but its 100% equity interest is held by one of entities in the Disposal Group. In order to retain control over Shanghai Comtech, we, through one of our 100% wholly-owned subsidiaries, entered into legal arrangements with the Disposal Group pursuant to which the Disposal Group agreed to hold the equity interest in Shanghai Comtech on behalf of our wholly-owned subsidiary and waive all rights and risks of ownership of the equity interests in favour of our wholly-owned subsidiary. Accordingly, we retain our control over Shanghai Comtech through such legal arrangements.
In the opinion of our PRC counsel, the ownership structure of Shenzhen Comtech and Shanghai Comtech and the contractual agreements among our 100% directly owned subsidiaries and legal shareholders do not violate existing PRC laws, rules and regulations. There are, however, substantial uncertainties regarding the interpretation and application of current or future PRC laws and regulations, including but not limited to the laws and regulations governing the validity and enforcement of these contractual agreements. Accordingly, we cannot assure you that PRC regulatory authorities will not determine that these contractual agreements violate or conflict with PRC laws or regulations.
If we or our PRC operating companies, Shenzhen Comtech, Shanghai Comtech and Shanghai E&T, are found to violate any existing or future PRC laws or regulations, the relevant regulatory authorities will have broad discretion in dealing with such violation, which would cause significant disruptions to our business operations or render us unable to conduct our business operations and may materially adversely affect our business, financial condition and results of operations.
Risks Related to Our Industry
Our inability to respond quickly and effectively to rapid technological advances and market demands would adversely impact our competitive position and our results of operations.
Historically, we have focused on the digital media and telecommunications equipment end-markets in the PRC. The digital media and telecommunications equipment end-markets are characterized by rapid technological advances, intense competition, frequent introduction of new products and services and consumer demand for greater functionality, lower costs, smaller products and better performance. We must constantly seek out new products and develop new solutions to maintain in our portfolio. We have experienced and will continue to experience some solution design obsolescence. We expect our customers’ demands for improvements in product performance to increase, which means that we must continue to improve our design solutions and develop new solutions to remain competitive and grow our business. Our failure to compete successfully for customers will result in price reductions, reduced margins or loss of market share, any of which would harm our business, results of operations and financial condition.
A large portion of our net revenue currently comes from sales to manufacturers in the cyclical digital media and telecommunications equipment end-markets and cyclical downturns could harm our operating results.
The digital media and telecommunications equipment end-markets in particular are highly cyclical and have experienced severe and prolonged downturns, often in connection with maturing product cycles and declines in general economic conditions. These downturns have been characterized by diminished product demand, production overcapacity, high inventory levels and accelerated erosion of average selling prices. The impact of slowing end-customer demand may be compounded by higher than normal levels of equipment and inventories among our customers and our customers’ adjustments in their order levels, resulting in increased pricing pressure.
In addition, our recent and significant growth in net revenue resulted, in large part, from the high growth in sales of industrial applications products in the PRC. These domestic manufacturers may not continue to grow their sales at historical levels, if at all. The stagnation or reduction in overall demand for industrial applications products would materially affect our results of operations and financial condition.
The digital media end-market is characterized by a short product lifecycle, making time-to-market and sensitivity to customer needs critical to our success and our failure to respond will harm our business.
Mobile handsets in the digital media end-market typically have a lifecycle of approximately six to twelve months before the technology becomes obsolete. Time-to-market, both with respect to our customers’ ability to supply consumers with timely and marketable products and our ability to provide our customers with a wide array of latest generation customized module design solutions, is critical to our success. As design cycles in the industry shorten, we face logistical challenges in providing our solutions in an increasingly shorter timeframe. If we are unable to respond to the shortened lifecycles and time-to-market, our business will suffer.
The global financial crisis could harm our product demands and adversely affect our results of operations.
Due to difficult market conditions, the level of consumer and information technology spending has declined and the demand for our mobile handsets business since the third quarter of 2008 has decreased. Furthermore, we may need to strategically lower our pricing in order to grow our business in a slowing economic environment.
Risks Related to Doing Business in the PRC
There are substantial risks associated with doing business in the PRC, including those set forth in the following risk factors.
Our operations may be adversely affected by the PRC’s economic, political and social conditions.
Substantially all of our operations and assets are located in the PRC and substantially all of our net revenue are derived from our operations in the PRC. Accordingly, our results of operations and future prospects are subject to economic, political and social developments in the PRC. In particular, our results of operations may be adversely affected by:
| · | changes in the PRC’s political, economic and social conditions; |
| · | changes in policies of the government or changes in laws and regulations, or the interpretation of laws and regulations; |
| · | changes in foreign exchange regulations; |
| · | measures that may be introduced to control inflation, such as interest rate increases; and |
| · | changes in the rate or method of taxation. |
The PRC economy has historically been a planned economy. The majority of productive assets in the PRC are still owned by various levels of the PRC government. In recent years the government has implemented economic reform measures emphasizing decentralization, utilization of market forces in the development of the economy and a high level of management autonomy. Such economic reform measures may be inconsistent or ineffectual, and we may not benefit from all such reforms. Furthermore, these measures may be adjusted or modified, possibly resulting in such economic liberalization measures being applied inconsistently from industry to industry, or across different regions of the country.
In the past twenty years, the PRC has been one of the world’s fastest growing economies in terms of gross domestic product, or GDP. This growth may not be sustainable. Moreover, a slowdown in the economies of the United States, the European Union and certain Asian countries may adversely affect economic growth in the PRC which depends on exports to those countries. Our financial condition and results of operations, as well as our future prospects, would be materially and adversely affected by an economic downturn in the PRC.
Our financial results benefit from tax concessions granted by the PRC government, the change to or expiration of which would materially change our results of operations.
Our results of operation may be adversely affected by changes to or expiration of tax holiday and preferential tax concessions that some of our PRC operating companies currently enjoy or expect to enjoy in the future. As a result of tax holiday and preferential tax rate incentives, our operations have been subject to relatively low tax liabilities. Tax that would otherwise have been payable without tax holiday treatment amounted to approximately RMB29.1 million (USD4.7 million) in 2012. For additional details regarding these tax incentives, please see “Item 5. Operating and Financial Review and Prospects—Taxation.”
Tax laws in the PRC are subject to interpretations by relevant tax authorities. The tax holiday treatment may not remain in effect or may change, in which case we may be required to pay the higher income tax rate generally applicable to Chinese companies, or such other rate as is required by the laws of the PRC.
On March 16, 2007, the National People’s Congress passed the Corporate Income Tax law (the “CIT law”), which revised the PRC statutory income tax rate to 25%. The CIT law was effective on January 1, 2008. Accordingly, our PRC subsidiaries are subject to income tax at 25% effective from January 1, 2008 unless otherwise specified. The CIT law and its relevant regulations provide a five-year transition period from January 1, 2008 for those companies which were established before March 16, 2007 and were entitled to preferential lower tax rates under the then effective tax regulations, as well as grandfathering certain tax holidays. The transitional tax rates are 20%, 22%, 24% and 25% for 2009, 2010, 2011 and 2012 onwards, respectively. For our subsidiaries located in Shenzhen Special Economic Zone, the PRC that were each entitled to a tax holiday of two-year tax exemption followed by three-year 50% tax reduction starting from the first profit making year from the PRC tax perspective, they are entitled to enjoy the transitional rates and continue their tax holidays until they expire. For the entities which had not commenced their respective tax holidays as of December 31, 2007, the CIT law and its relevant regulations require their tax holidays to begin on January 1, 2008.
The telecommunications equipment market is extensively regulated in the PRC.
The telecommunications equipment end-market accounted for 44.2% of our net revenue in 2012. PRC’s telecommunications industry is heavily regulated. Changes in regulations affecting sales of these customers could negatively affect the telecommunications equipment end-market for our solutions, which will materially harm our business.
PRC government control of currency conversion may affect our ability to meet foreign currency obligations.
Because the majority of our net revenue are denominated in Renminbi, any restrictions on currency exchange may limit our ability to use revenue generated in Renminbi to meet our foreign currency obligations, such as settling the purchase of materials which may be denominated in U.S. dollars. The principal regulation governing foreign currency exchange in the PRC is the Foreign Currency Administration Rules (1996), or the Rules, as amended. Under the Rules, once certain procedural requirements are met, Renminbi is convertible for current account transactions, including trade and service-related foreign exchange transactions and dividend payments, but not for capital account transactions, including direct investment, loans or investments in securities outside the PRC, without prior approval of the PRC State Administration of Foreign Exchange (“SAFE”), or its local counter-parts. Since a significant amount of our future revenues will continue to be denominated in Renminbi, any existing and future restrictions on currency exchange may limit our ability to utilize revenue generated in the PRC to fund our business activities outside of the PRC, if any, or expenditures denominated in foreign currencies, or our ability to meet our foreign currency obligations, which could have a material adverse effect on our business, financial condition and results of operations. We cannot be certain that the PRC regulatory authorities will not impose more stringent restrictions on the convertibility of Renminbi with respect to foreign exchange transactions.
PRC regulations relating to offshore investment activities by PRC residents may increase the administrative burden we face and create regulatory uncertainties that could restrict our overseas and cross-border investment activity, and a failure by our shareholders who are PRC residents to make any required applications and filings pursuant to such regulations may prevent us from being able to distribute profits and could expose us and our PRC resident shareholders to liability under PRC law.
In October 2005, SAFE promulgated regulations that require PRC residents and PRC corporate entities to register with and obtain approvals from relevant PRC government authorities in connection with their direct or indirect offshore investment activities. These regulations apply to our shareholders who are PRC residents in connection with our prior and any future offshore acquisitions.
The SAFE regulation required registration by March 31, 2006 of direct or indirect investments previously made by PRC residents in offshore companies prior to the implementation of the Notice on Issues Relating to the Administration of Foreign Exchange in Fund-Raising and Reverse Investment Activities of Domestic Residents Conducted via Offshore Special Purpose Companies on November 1, 2005. If a PRC shareholder with a direct or indirect stake in an offshore parent company fails to make the required SAFE registration, the PRC subsidiaries of such offshore parent company may be prohibited from making distributions of profit to the offshore parent and from paying the offshore parent proceeds from any reduction in capital, share transfer or liquidation in respect of the PRC subsidiaries, and may be prohibited from receiving capital contributions, shareholder loan or other payments from our offshore parent company, and may be further prohibited from making payments to or receiving payments from other overseas entities. Furthermore, failure to comply with the various SAFE registration requirements described above could result in liability under PRC law for foreign exchange evasion.
Some of our PRC resident shareholders may not have completed their registration with SAFE under the SAFE regulation, in part, due to confusion over the application of the SAFE regulation to our company. For example, in mid-2006, some of our PRC resident shareholders attempted to register with SAFE in Shenzhen under predecessor regulations to the SAFE regulation, but were informed by Shenzhen SAFE that the regulation did not apply to them. These PRC resident shareholders did not realize they might be required to register under the new SAFE regulations. Further, even if our PRC resident shareholders do apply for SAFE registration, they may not be able to obtain such registration at the discretion of SAFE due to various reasons including their failure to comply with the retroactive SAFE registration requirement prior to March 31, 2006, the statutorily prescribed deadline for compliance. The failure or inability of our PRC resident shareholders to obtain any required approvals or make any required registrations may subject us to fines and legal sanctions, prevent us from being able to make distributions or pay dividends or to receive capital contribution or shareholder loans, as a result of which our business operations and our ability to distribute profits to you or capitalize our operation in the PRC could be materially and adversely affected.
In December 2006, the People’s Bank of China promulgated the Administrative Measures of Foreign Exchange Matters for Individuals, or the PBOC Regulation, setting forth the respective requirements for foreign exchange transactions by PRC individuals under either the current account or the capital account. In January 2007, SAFE issued implementing rules for the PBOC Regulation, which, among other things, specified approval requirements for certain capital account transactions such as a PRC citizen’s participation in the employee stock ownership plans or stock option plans of an overseas publicly-listed company. On March 28, 2007, SAFE promulgated the Application Procedure of Foreign Exchange Administration for Domestic Individuals Participating in Employee Stock Holding Plan or Stock Option Plan of Overseas-Listed Company, or the Stock Option Rule. Under the Stock Option Rule, PRC citizens who are granted stock options by an overseas publicly-listed company are required, through a PRC agent or PRC subsidiary of such overseas publicly-listed company, to register with SAFE and complete certain other procedures. We and our PRC employees who have been granted stock options will be subject to the Stock Option Rule when our company becomes an overseas publicly-listed company. If we or our PRC optionees fail to comply with these regulations, we or our PRC optionees may be subject to fines and legal sanctions.
Our acquisition strategy may be subject to SDRC approval under legislation enacted in 2004.
The State Development and Reform Commission, or SDRC, promulgated a regulation in 2004 that requires SDRC approval in connection with direct or indirect offshore investment activities by individuals who are PRC residents and PRC corporate entities. This regulation may apply to our future offshore or cross-border acquisitions, as well as to the equity interests in offshore companies held by our PRC shareholders who are considered PRC residents. We intend to make all required application and filings, and will require the shareholders of the offshore entities in our corporate group who are considered PRC residents to make the application and filings, as required under the regulation and under any implementing rules or approval practices that may be established under this regulation. However, because this regulation lacks implementing rules, approval precedents or reconciliation with other approval requirements, it remains uncertain how this regulation, and any future legislation concerning offshore or cross-border transactions, will be interpreted and implemented by the relevant government authorities. The approval criteria by SDRC agencies for outbound investment by PRC residents are not provided under this regulation or other SDRC regulations. Accordingly, we cannot provide any assurances that we will be able to comply with, qualify under or obtain any approval as required by this regulation or other related legislations. Our failure or the failure of our PRC resident shareholders to obtain SDRC approvals may restrict our ability to acquire a company outside of the PRC or use our entities outside of the PRC to acquire or establish companies inside of the PRC, which could negatively affect our business and future prospects.
PRC laws and our corporate structure may restrict our ability to receive dividends and payments from, and transfer funds to, our PRC operating companies, which may negatively affect our results of operations and restrict our ability to act in response to changing market conditions.
Substantially all of our operations are conducted through our PRC operating companies. The ability of our PRC operating companies to make dividends and other payments to us may be restricted by factors such as changes in applicable foreign exchange and other laws and regulations. For example, under the regulations discussed above, the foreign exchange activities of our present or prospective PRC subsidiaries are conditioned upon the compliance with the SAFE registration requirements by the shareholders of our offshore entities who are PRC residents. Failure to comply with these SAFE registration requirements may substantially restrict or prohibit the foreign exchange inflow to and outflow from our PRC subsidiaries, namely Shenzhen Comtech, Shanghai Comtech, Shanghai E&T and Viewtran Technology (Shenzhen) Co. Ltd. (“Viewtran PRC”), including, remittance of dividends and foreign-currency-denominated borrowings by these PRC subsidiaries. In addition, our PRC operating companies are required, where applicable, to allocate a portion of their net profit to certain funds before distributing dividends, including at least 10% of their net profit to certain reserve funds until the balance of such fund has reached 50% of their registered capital. These reserves can only be used for specific purposes, including making-up cumulative losses of previous years, conversion to equity capital, and application to business expansion, and are not distributable as dividends. Our PRC operating companies are also required, where applicable, to allocate an additional 5% to 10% of their net profits to the common welfare fund. The net profit available for distribution from our PRC operating companies is determined in accordance with generally accepted accounting principles in the PRC, which may materially differ from a determination performed in accordance with U.S. GAAP. As a result, we may not receive sufficient distributions or other payments from these entities to enable us to make dividend distributions to our shareholders in the future, even if our U.S. GAAP financial statements indicate that our operations have been profitable. For additional details regarding the taxation risk of dividend distributions from our PRC operating companies, please see “Item 3. Key Information – Risk Factors – Our global income and your capital gain may be subject to PRC tax under the new PRC tax law, which may have an effect on our results of operations and your investments, respectively.”
We do not directly own the equity interests in: (i) Shenzhen Comtech, which accounted for approximately 0.6% of our net revenue in 2012; or (ii) Shanghai Comtech, which accounted for approximately 1.7% of our net revenue in 2012. Shenzhen Comtech and Shanghai Comtech own 19% and 81% equity interest in Shanghai E&T, respectively, which accounted for 2.2% of our net revenue in 2012. Honghui Li and Huimo Chen, the shareholders of Shenzhen Comtech, and the Disposal Group, the shareholder of Shanghai Comtech, have contractually agreed, among others things, to apply all dividends or other payments they receive from Shenzhen Comtech and Shanghai Comtech to payments to our 100% wholly-owned subsidiaries, or their designated entities, for valid and valuable consideration and to the extent permitted by applicable PRC law, including PRC foreign exchange law. PRC law and regulatory requirements would currently restrict the ability of the shareholders of Shenzhen Comtech and Shanghai Comtech, based solely upon the contractual agreements, to directly apply the dividends or other payments they receive from Shenzhen Comtech and Shanghai Comtech in U.S. dollars to payments to our 100% wholly-owned subsidiaries or in Renminbi to their designated entities in the PRC. For example, the PRC foreign exchange authorities would have discretion to review the adequacy of the consideration given in exchange for the application of any dividends or payments from Shenzhen Comtech and Shanghai Comtech to our 100% wholly-owned subsidiaries. If the legal shareholders fail to apply such dividends or other payments received from Shenzhen Comtech and Shanghai Comtech, which might include profit distributions from Shanghai E&T, to payments to our 100% wholly-owned subsidiaries or their designated entities, our financial condition would be negatively affected. Apart from the dividend distribution from our PRC subsidiaries to us, the transfer of funds from our company to our PRC operating companies, either as a shareholder loan or as an increase in registered capital or otherwise, is subject to registration or approval with or by PRC governmental authorities, including the relevant administration of foreign exchange and/or other relevant examining and approval authorities. These limitations on the free flow of funds between us and our PRC operating companies may restrict our ability to act in response to changing market conditions.
Fluctuations in exchange rates could adversely affect our business.
Because a substantial majority of our earnings and cash assets are denominated in Renminbi, fluctuations in the exchange rate between the U.S. dollar and the Renminbi will affect the relative purchasing power of any proceeds from financing and our balance sheet and earnings per share in U.S. dollars following such transaction. In addition, appreciation or depreciation in the value of the Renminbi relative to the U.S. dollar would affect our financial results reported in U.S. dollar terms without giving effect to any underlying change in our business or results of operations. Fluctuations in the exchange rate will also affect the relative value any dividend we may issue that will be exchanged into U.S. dollars and earnings from and the value of any U.S. dollar-denominated investments we make in the future. In addition, a depreciation of the Renminbi relative to the U.S. dollar would have the effect of reducing our U.S. dollar-translated net revenue and increasing the debt servicing requirements for our U.S. dollar-denominated debt. On the other hand, the appreciation of the Renminbi would make our customers’ products more expensive to purchase outside of the PRC because many of our customers are involved in the export of goods, which could adversely affect their sales, thereby eroding our customer base and adversely affecting our results of operations.
Since July 2005, the Renminbi has no longer been pegged to the U.S. dollar. Although currently the Renminbi exchange rate versus the U.S. dollar is restricted to a rise or fall of no more than 1.0% per day and the People’s Bank of China regularly intervenes in the foreign exchange market to prevent significant short-term fluctuations in the exchange rate, the Renminbi may appreciate or depreciate significantly in value against the U.S. dollar in the medium to long term. Moreover, it is possible that in the future, the PRC authorities may lift restrictions on fluctuations in the Renminbi exchange rate and lessen intervention in the foreign exchange market.
Very limited hedging transactions are available in the PRC to reduce our exposure to exchange rate fluctuations. To date, we have not entered into any hedging transactions in an effort to reduce our exposure to foreign currency exchange risk. While we may enter into hedging transactions in the future, the availability and effectiveness of these transactions may be limited and we may not be able to successfully hedge our exposure at all. In addition, our foreign currency exchange losses may be magnified by PRC exchange control regulations that restrict our ability to convert Renminbi into foreign currencies.
The legal system in the PRC has inherent uncertainties that may limit the legal protections available to you as an investor or to us in the event of any claims or disputes with third parties.
The legal system in the PRC is based on written statutes. Prior court decisions may be cited for reference but have limited precedential value. Since 1979, the central government has promulgated laws and regulations dealing with economic matters such as foreign investment, corporate organization and governance, commerce, taxation and trade. As PRC’s foreign investment laws and regulations are relatively new and the legal system is still evolving, the interpretation of many laws, regulations and rules is not always uniform and enforcement of these laws, regulations and rules involve uncertainties, which may limit the remedies available to you as an investor and to us in the event of any claims or disputes with third parties. In addition, any litigation in the PRC may be protracted and result in substantial costs and diversion of resources and management attention.
On August 8, 2006, six PRC regulatory agencies, including the Chinese Securities Regulatory Commission, or CSRC, promulgated the Regulation on Mergers and Acquisitions of Domestic Companies by Foreign Investors, which became effective on September 8, 2006. This new regulation, among other things, requires offshore special purpose vehicles, or SPVs, formed for overseas listing purposes through acquisitions of PRC domestic companies and controlled by PRC individuals, to obtain the approval of the CSRC prior to publicly listing their securities on an overseas stock exchange. We believe, based on the advice of our PRC counsel, that this regulation does not apply to us or any of our prior transactions or offerings and that CSRC approval is not required because such acquisition was completed long before September 8, 2006 when the new regulation became effective. On September 21, 2006, the CSRC published a notice specifying the documents and materials that are required to be submitted for obtaining CSRC approval. In the opinion of our PRC counsel, the new notice does not contradict its interpretation of the new regulation, nor does it add greater clarity to the applicability of the new regulation to us. Based on the advice we have received from our PRC counsel, we do not intend to seek CSRC approval in connection with any of our prior transactions, offerings, or the listing of our shares on NASDAQ.
There may be some uncertainty as to how this regulation will be interpreted or implemented. If the CSRC or other PRC regulatory body subsequently determines that the CSRC’s approval was required for any prior transactions or offerings, we may face sanctions by the CSRC or other PRC regulatory agencies. These regulatory agencies may impose fines and penalties on our operations in the PRC, limit our operation privileges in the PRC, delay or restrict the repatriation of the proceeds from any offerings into the PRC, restrict or prohibit payment or remittance of dividends by Comtech China, or take other actions that could have a material adverse effect on our business, financial condition, results of operations, reputation and prospects, as well as the trading price of our ordinary shares.
You may experience difficulties in effecting service of legal process and enforcing judgments against us and our management.
Substantially all of our operations and assets are located in the PRC. In addition, most of our directors, executive officers and some of the experts named in this document reside within the PRC, and many of the assets of these persons are also located within the PRC. As a result, it may not be possible to effect service of process within the United States or elsewhere outside the PRC upon these directors or executive officers or some of the experts named in this document, including with respect to matters arising under U.S. federal securities laws. Moreover, our PRC legal counsel has advised us that the PRC does not have treaties with the United States or many other countries providing for the reciprocal recognition and enforcement of court judgments. As a result, recognition and enforcement in the PRC of judgments of a court of the United States or any other jurisdiction, including judgments against us or our directors, executive officers, or the named experts, may be difficult or impossible.
The enforcement of civil liabilities against us may be more difficult than if we were a U.S. company.
We are a Cayman Islands company and all of our assets are and will be located outside the United States. As a result, investors could experience more difficulty enforcing judgments obtained against us in U.S. courts than would otherwise be the case for U.S. judgments obtained against a company organized in the United States. In addition, some claims may be more difficult to bring against us in Cayman Islands courts than it would be to bring similar claims against a U.S. company in a U.S. court.
As a Cayman Islands company and, because judicial precedent regarding the rights of shareholders is more limited under Cayman Islands law than under U.S. law, you may have less protection of your shareholder rights than you would under U.S. law.
We are a Cayman Islands company and our corporate affairs are governed by memorandum and articles of association, the Cayman Islands Companies Law and the common law of the Cayman Islands. The rights of shareholders to take action against our directors, actions by minority shareholders and the fiduciary responsibilities of our directors under Cayman Islands law are to a large extent governed by the common law of the Cayman Islands. The common law of the Cayman Islands is derived in part from comparatively limited judicial precedent in the Cayman Islands as well as from English common law, which has persuasive, but not binding, authority on a court in the Cayman Islands. The rights of our shareholders and the fiduciary responsibilities of our directors under Cayman Islands law are not as clearly established as they would be under statutes or judicial precedent in some jurisdictions in the United States. In particular, the Cayman Islands has a less developed body of securities laws than the United States. In addition, some U.S. states, such as Maryland or Delaware, have more fully developed and judicially interpreted bodies of corporate law than the Cayman Islands.
As a result of all of the above, public shareholders may have more difficulty in protecting their interests in the face of actions taken by management, members of the board of directors or controlling shareholders than they would as public shareholders of a U.S. company.
Our global income and your dividend/capital gain may be subject to PRC tax under the new PRC tax law, which may have an effect on our results of operations and your investment, respectively.
Under the new PRC tax law, effective January 1, 2008, an enterprise established outside of the PRC with “de facto management bodies” within the PRC is considered a resident enterprise and will be subject to the corporate income tax at the rate of 25% on its global income. The new PRC tax law does not, however, clearly define the term “de facto management bodies.” If the PRC tax authorities subsequently determine that we should be classified as a resident enterprise, then our global income may be subject to the corporate income tax at the rate of 25%.
Under the previous PRC tax law, dividend payments to foreign investors made by foreign-invested enterprises in the PRC are exempt from PRC withholding tax. We have been advised by our PRC counsel, Commerce & Finance Law Offices, that pursuant to the new PRC tax law which became effective on January 1, 2008, however, dividends payable from earnings accumulated beginning on January 1, 2008 by a PRC resident enterprise to its foreign corporate investors will be subject to a 10% withholding tax, unless any such foreign investor’s jurisdiction of incorporation has a tax treaty with the PRC that provides for a different withholding arrangement. According to the Agreement between the Mainland China and Hong Kong Special Administrative Region for the Avoidance of Double Taxation and the Prevention of Fiscal Evasion with respect to Taxes on Income and its relevant regulations, dividends paid by a PRC resident enterprise to its direct holding company in Hong Kong will be subject to withholding tax at a rate of no more than 5% (if the Hong Kong investor is the “beneficial owner” and owns directly at least 25% of the equity interest of the PRC resident enterprise). The new PRC tax law provides, however, that dividends distributed between qualified resident enterprises will be exempted. Dividends distributed between qualified resident enterprises refer to the dividends derived by a PRC resident enterprise from its direct investment in another PRC resident enterprise. In addition, we have been advised by our PRC counsel, Commerce & Finance Law Offices, that under the new PRC tax law, foreign corporate investors may be subject to a 10% PRC tax upon any gain they realize from the transfer of our ordinary shares, if such income is regarded as income from “sources within the PRC.” We have been advised by Commerce & Finance Law Offices that it is uncertain whether such income would be regarded as income from “sources within the PRC” because whether the Company would be regarded as a “PRC resident enterprise” is not clear. If we are required under the new PRC tax law to withhold PRC withholding tax on our dividends payable to our non-PRC shareholders, or such shareholders are subject to PRC tax on any gains on the transfer of their shares, the investment of such shareholders in our ordinary shares may be affected.
There is a risk that we could be treated as a foreign corporation for U.S. federal income tax purposes, which could result in significantly greater U.S. federal income tax liability to us.
Section 7874(b) of the Internal Revenue Code of 1986, as amended (the “Code”) generally provides that a corporation organized outside the United States that acquires, directly or indirectly, pursuant to a plan or series of related transactions, substantially all of the assets of a corporation organized in the United States, will be treated as a U.S. corporation for U.S. federal income tax purposes if (i) the acquiring corporation, together with all corporations connected to it by a chain of greater than 50% ownership by vote and value (the “expanded affiliated group”), does not have substantial business activities in the country in which the acquiring corporation is organized, compared to the total worldwide business activities of the expanded affiliated group, and (ii) shareholders of the acquired corporation, by reason of owning shares of the acquired corporation, own at least 80% of either the voting power or the value of the stock of the acquiring corporation after the acquisition.
If Section 7874(b) were determined not to apply to the redomestication merger that Cogo Group, Inc. (the Maryland corporation) effected in August 2011 (as such transaction is described in the section of this Annual Report entitled “Item 4. Information on the Company” and “Item 5. Operating and Financial Review and Prospects – Taxation – U.S.”), we would be treated as a foreign corporation for U.S. federal income tax purposes as a result of the redomestication merger and, among other things, Cogo Group, Inc. (the Maryland corporation) would be required to recognize gain (but not loss) under Section 367 of the Code equal to the excess, if any, of the fair market value of each of its assets over such asset’s adjusted tax basis at the effective time of the redomestication merger. Any U.S. federal income tax liability incurred by Cogo Group, Inc. (the Maryland corporation) as a result of such gain should become our liability by reason of the redomestication merger.
Although we expect that Section 7874(b) should apply to treat us as a U.S. corporation, rather than a foreign corporation, and, therefore, that Cogo Group, Inc. (the Maryland corporation) would not have recognized gain (or loss) as a result of the redomestication merger for U.S. federal income tax purposes, due to the absence of full guidance on how the rules of Section 7874(b) applies to the August 2011 redomestication merger (and our subsequent operations, as well as members of our expanded affiliated group), this result is not entirely free from doubt. The balance of this discussion (including the discussion in the section of this Annual Report entitled “Item 10. Additional Information – Taxation – United States Federal Income Taxation”) assumes that we will be treated as a U.S. corporation for U.S. federal income tax purposes.
Under the PRC CIT Law, we and/or our non-PRC subsidiaries may be classified as “resident enterprises” of the PRC. Such classification could result in PRC tax consequences to us, our non-PRC subsidiaries and/or our non-PRC resident shareholders.
On March 16, 2007, the National People’s Congress approved and promulgated a new tax law, the PRC Corporate Income Tax Law (“CIT Law”) which took effect on January 1, 2008. Under the CIT Law, enterprises are classified as resident enterprises and non-resident enterprises. An enterprise established outside of the PRC with “de facto management bodies” within the PRC is considered a “resident enterprise,” meaning that it can be treated in a manner similar to an enterprise organized under the laws of the PRC for PRC enterprise income tax purposes. The implementing rules of the CIT Law define “de facto management bodies” as a managing body that in practice exercises “substantial and overall management and control over the production and operations, personnel, accounting, and properties” of the enterprise; however, it remains unclear whether the PRC tax authorities would deem our managing body as being located within the PRC. Due to the short history of the CIT Law and lack of applicable legal precedents, the PRC tax authorities determine the PRC tax resident treatment of a foreign (non-PRC) company on a case-by-case basis.
If the PRC tax authorities determine that we are a “resident enterprise” or our Hong Kong subsidiaries are “resident enterprises” for PRC corporate income tax purposes, a number of PRC tax consequences could follow. First, we and/or our non-PRC subsidiaries may be subject to the corporate income tax at a rate of 25% on our and/or non-PRC subsidiaries’ worldwide taxable income, as well as PRC corporate income tax reporting obligations. Second, under the CIT Law and its implementing rules, dividends paid between “qualified resident enterprises” may be exempt from corporate income tax. However, so far it is unclear whether the dividends we may receive from our PRC subsidiaries through our non-PRC subsidiaries will constitute dividends between “qualified resident enterprises” and would therefore qualify for a tax exemption, because the definition of qualified resident enterprises is unclear and the relevant PRC government authorities have not yet issued guidance with respect to the processing of outbound remittances to entities that are treated as resident enterprises for PRC enterprise income tax purposes.
Finally, if we are determined to be a “resident enterprise” under the CIT Law, this could result in a PRC tax being imposed on dividends we pay to our enterprise or individual investors that are not tax residents of the PRC (“non-resident investors”) and gains derived by them from transferring our ordinary shares, if such income or gain is considered PRC-sourced income by the relevant PRC tax authorities. Such PRC tax would be imposed at a rate of 10% in the case of nonresident investors that are enterprises. In addition, a potential 20% PRC tax would be imposed on dividends we pay to our non-resident investors who are individuals and who: (i) are not domiciled in the PRC and who do not reside in the PRC; or (ii) are not domiciled in the PRC and have resided in the PRC for less than one year, to the extent that such dividends are deemed to be sourced within the PRC, and on gains derived by them from transferring our ordinary shares, if such gain is considered PRC-sourced income by the relevant PRC tax authorities. In such event, we may be required to withhold the applicable PRC income tax on any dividends paid to its non-resident investors. Our non-resident investors also may be responsible for paying the applicable PRC tax on any gain realized from the sale or transfer of our ordinary shares in certain circumstances. We would not, however, have an obligation to withhold PRC tax with respect to such gain under the PRC tax laws.
Moreover, the State Administration of Taxation (“SAT”) released Circular Guoshuihan No. 698 (“Circular 698”) on December 10, 2009 that reinforces the taxation of certain equity transfers by non-resident investors through overseas holding vehicles. Circular 698 is retroactively effective from January 1, 2008. Circular 698 addresses indirect equity transfers as well as other issues. According to Circular 698, where a non-resident investor that indirectly holds an equity interest in a PRC resident enterprise through a non-PRC offshore holding company indirectly transfers an equity interest in the PRC resident enterprise by selling an equity interest in the offshore holding company, and the latter is located in a country or jurisdiction where the actual tax burden is less than 12.5% or does not tax foreign income of its residents, the non-resident investor is required to provide the PRC tax authority in charge of that PRC resident enterprise with certain relevant information within 30 days of the execution of the equity transfer agreement. The tax authorities in charge will evaluate the offshore transaction for tax purposes. In the event that the tax authorities determine that such transfer is abusing forms of business organization and a reasonable commercial purpose for the offshore holding company other than the avoidance of PRC income tax liability is lacking, the PRC tax authorities will have the power to re-assess the nature of the equity transfer under the doctrine of substance over form. If SAT’s challenge of a transfer is successful, it may deny the existence of the offshore holding company that is used for tax planning purposes and subject the non-resident investor to PRC tax on the capital gain from such transfer. Since Circular 698 has a short history, there is uncertainty as to its application. We (or a non-resident investor) may become at risk of being taxed under Circular 698 and may be required to expend valuable resources to comply with Circular 698 or to establish that we (or such non-resident investor) should not be taxed under Circular 698, which could have a material adverse effect on our financial condition and results of operations. If the PRC tax authority determines that Circular 698 applies to us (or a non-resident investor), we (or a non-resident investor) will be obligated to make a tax return filing with the relevant PRC tax authority in accordance with PRC tax laws and regulations. Failure to do so will subject us (or a non-resident investor) to fines up to RMB10,000.
If any PRC tax applies to a non-resident investor, the non-resident investor may be entitled to a reduced rate of PRC tax under an applicable income tax treaty and/or a deduction for such PRC tax against such investor’s domestic taxable income or a foreign tax credit in respect of such PRC tax against such investor’s domestic income tax liability (subject to applicable conditions and limitations). Investors should consult their own tax advisors regarding the applicability of any such taxes, the effects of any applicable income tax treaties, and any available deductions or foreign tax credits.
Pursuant to the Envision Agreement, we sold certain subsidiaries, including PRC enterprises, to Envision for a total consideration of USD78 million. We allocated the total consideration to each of the disposed subsidiaries based on our best estimate, and the allocation did not result in any PRC tax consequences to us. But we may become at risk of being taxed under Circular 698 and may be required to expend valuable resources to comply with Circular 698 or to establish that we should not be taxed under Circular 698, which could have a material adverse effect on our financial condition and results of operations.
We make diminished filings with the SEC as a foreign private issuer which filings do not provide shareholders the same level of information that would normally be available to shareholders of United States public companies.
The term foreign private issuer means any foreign issuer other than a foreign government except an issuer with more than 50 percent of its outstanding voting securities held directly or indirectly of record by residents of the United States, and that meets any of the following conditions (i) the majority of the executive officers or directors are United States citizens or residents; (ii) more than 50 percent of the assets of the issuer are located in the United States; or (iii) the business of the issuer is administered principally in the United States. As of the date of this Annual Report, we do not meet any of the conditions in (i) – (iii). Accordingly, we file with the SEC as a foreign private issuer, and therefore we are exempted from certain SEC requirements, including
| · | The rules requiring the filing with the SEC of quarterly reports on Form 10-Q or Current Reports on Form 8-K; |
| · | The sections of the Exchange Act regulating the solicitation of proxies, consents or authorizations with respect to a security registered under the Exchange Act; |
| · | Provisions of Regulation FD aimed at preventing issuers from making selective disclosures of material information; and |
| · | The sections of the Exchange Act requiring insiders to file public reports of their ordinary share ownership and trading activities and establishing insider liability for profits realized from any “short swing” trading transactions (i.e., a purchase and sale, or a sale and purchase, of the issuer’s equity securities within less than six months). |
Therefore, holders of our ordinary shares may receive less information on our business and operations than do holders of securities of US domestic issuers.
As a foreign private issuer we may rely on exemptions from certain Nasdaq corporate governance standards applicable to U.S. issuers. This may afford less protection to holders of our ordinary shares.
The Nasdaq Listing Rules in general require listed companies to follow a stipulated set of corporate governance practices. As a foreign private issuer, we are permitted to, and we expect to, follow home country corporate governance practices instead of certain requirements of the Nasdaq Listing Rules, including, among others, the shareholder approval rules. Under Nasdaq Listing Rule 5635(c), shareholder approval is required prior to the issuance of securities when a stock option or purchase plan is to be established or materially amended or other equity compensation arrangement made or materially amended, pursuant to which stock may be acquired by officers, directors, employees, or consultants, subject to certain exceptions. This includes the issuance of shares to officers or directors in a private placement at a price less than market value, which is considered a form of equity compensation. The corporate governance practice in our home country, the Cayman Islands, does not require shareholder approval for the issuance of shares to officers or directors in a private placement at a price less than the greater of book value and market value, provided that the directors consider the issue price as representing fair value for the shares being issued. We may determine that it should instead rely upon such home country exemption in lieu of the Nasdaq requirement for shareholder approval of such share issuances. As a result of the above home country differences that we expect to follow, you may receive less shareholder protection from dilution and other matters than if we were not a foreign private issuer.
Our independent registered public accounting firm’s audit documentation related to their audited reports included in this annual report may include audit documentation located in China and, as such, you may be deprived of the benefits of inspection by U.S. authorities.
Our independent registered public accounting firm that issued an audit opinion in the financial statements included herein, as auditors of companies that are traded publicly in the United States and a firm registered with the U.S. Public Company Accounting Oversight Board (the “PCAOB”), is required by the laws of the United States to undergo regular inspections by the PCAOB. Since a significant portion of the audit is conducted in China and the work papers related to such portion are located in China, a jurisdiction where the PCAOB is currently unable to conduct inspections without the approval of the PRC authorities, the work papers of our auditors that are located in China are not currently inspected by the PCAOB.
The PCAOB has conducted inspections of certain firms outside of China and, as a part of the inspection process, has identified deficiencies in those firms’ audit procedures and quality control procedures. However, the PCAOB is currently unable to inspect an auditor’s audit work related to a company’s operations in China, where such documentation of the audit work is located in China. As a result, our investors may be deprived of the benefits of PCAOB’s oversight of our auditors through such inspections.
The inability of the PCAOB to conduct inspections of our auditors’ work papers in China makes it more difficult to evaluate the effectiveness of our auditor’s audit procedures or quality control procedures as compared to auditors outside of China that are subject to PCAOB inspections. Investors may consequently lose confidence in our reported financial information and procedures and the quality of our financial statements.
The SEC has brought administrative proceedings against five accounting firms in China recently, alleging that they refused to hand over documents to the SEC for ongoing investigations into certain other China-based companies. We were not and are not subject to any SEC investigations, nor are we involved in the proceedings brought by the SEC against the accounting firms. However, the PRC affiliate of our independent registered public accounting firm is one of the five accounting firms named in the SEC’s proceedings and we may be adversely affected by the outcome of the proceedings, along with other U.S.-listed companies audited by these accounting firms. If the SEC prevails in the proceedings, the PRC affiliate of our independent auditors and other four accounting firms in China that were named in the proceedings may be barred from practicing before the SEC and hence unable to continue to be the auditors for China-based companies like ourselves. If none of the China-based auditors are able to continue to be auditors for China-based companies listed in the U.S., we may not be able to meet the reporting requirements under the Exchange Act, which may ultimately result in our deregistration from the SEC and delisting from NASDAQ.
Risks Related to Our Ordinary Shares
Our principal shareholder and chief executive officer beneficially owns a substantial portion of our ordinary shares. As a result, the trading price for our ordinary shares may be depressed due to market perception that our principal shareholder and chief executive officer will be able to take actions that may be adverse to your interests.
Jeffrey Kang, our principal shareholder and chief executive officer, directly and through entities he controls, currently beneficially owns approximately 33.31% of our issued and outstanding ordinary shares. This significant concentration of share ownership may adversely affect the trading price of our ordinary shares because investors, often perceive a disadvantage in owning shares in a company with only one or very few controlling shareholders. Furthermore, Mr. Kang has the ability to significantly influence the outcome of all matters requiring shareholder approval, including the election of directors and approval of significant corporate transactions, such as mergers, consolidations or the sale of substantially all of our assets. This concentration of ownership may have the effect of delaying or preventing a change of control, including a merger, consolidation or other business combination involving us, or discouraging a potential acquirer from making a tender offer or otherwise attempting to obtain control, even if such a change of control would benefit you.
The trading prices of our ordinary shares have been and are likely to continue to be volatile, which could result in substantial losses to you.
The trading prices of our ordinary shares have been and are likely to continue to be volatile. Since January 1, 2006, the trading price of our ordinary shares on the Nasdaq Global Market has ranged from USD1.61 to USD22.15 per share, and the last reported sale price on April 12, 2013 was USD2.01 per share. The trading prices of our ordinary shares could fluctuate widely in response to factors beyond our control. In particular, the performance and fluctuation of the market prices of other companies with business operations located mainly in the PRC that have listed their securities in the United States may affect the volatility in the price of and trading volumes for our ordinary shares. Recently, a number of PRC companies have listed their securities, or are in the process of preparing for listing their securities, on U.S. stock markets. Some of these companies have experienced significant volatility, including significant price declines after their initial public offerings. The trading performances of these PRC companies’ securities at the time of or after their offerings may affect the overall investor sentiment towards PRC companies listed in the United States and consequently may impact the trading performance of our ordinary shares. These broad market and industry factors may significantly affect the market price and volatility of our ordinary shares, regardless of our actual operating performance.
In addition to market and industry factors, the price and trading volume for our ordinary shares may be highly volatile for specific business reasons. In particular, factors such as variations in our revenues, earnings and cash flow, announcements of new investments, cooperation arrangements or acquisitions or sales of large blocks of our ordinary shares, could cause the market price for our ordinary shares to change substantially. Any of these factors may result in large and sudden changes in the volume and trading price of our ordinary shares. In the past, following periods of volatility in the market price of a company’s securities, shareholders have often instituted securities class action litigation against that company. If we were involved in a class action suit, it could divert the attention of senior management, and, if adversely determined, could have a material adverse effect on our financial condition and results of operations.
Future sales of shares could have an adverse effect on the market price of our ordinary shares.
A significant portion of our ordinary shares are held by a small number of shareholders. Historically, trading volume of our ordinary shares has been relatively low. Sales by our current shareholders of a substantial number of shares could significantly reduce the market price of our ordinary shares. These sales could also impede our ability to raise future capital.
As of December 31, 2012, we had 31,110,922 ordinary shares outstanding, which shares will be able to be sold in the public market in the near future, subject to, with respect to ordinary shares held by affiliates and shares issued between 12 and 24 months ago, the volume restrictions and/or manner of sale requirements of Rule 144 under the Securities Act. These shares are freely tradable without restriction or further registration, subject to the related prospectus delivery requirements.
As of December 31, 2012, we had 1,184,769 stock options, equity share units, performance shares, warrants and shares which may result in a significant number of shares entering the public market and the dilution of our ordinary shares. In addition, in the event that any future financing should be in the form of securities convertible into, or exchangeable for, equity securities, investors may experience additional dilution upon the conversion or exchange of such securities.
| ITEM 4. | INFORMATION ON THE COMPANY |
History and Development of the Company
We provide customized module design solutions for a diverse set of applications and end markets, serving as a gateway for our technology component suppliers to access leading electronics manufacturers in the PRC. Our customized module design solutions allow our customers to take advantage of technology components from reputable suppliers in an efficient and cost-effective manner, effectively reducing their time-to-market and lowering their overall costs. Our close collaboration with our customers’ product development teams enables us to customize our suppliers’ technology components with module designs that meet our customers’ unique requirements. In addition, we offer technology and engineering as well as software design services in the PRC while we have expanded into the industrial business end-market.
We were incorporated in the Cayman Islands on April 12, 2011 under the name of “Cogo Group Cayman, Inc.” for the sole purpose of effectuating the redomestication of the our predecessor, Cogo Group, Inc., a Maryland corporation (“Cogo Maryland”).
The redomestication merger was approved by the shareholders of Cogo Maryland on July 25, 2011, pursuant to which each new ordinary share in Cogo Group Cayman, Inc. was issued in exchange for one share of common stock of Cogo Maryland held by the shareholders. The redomestication became effective August 4, 2011. After the closing of the redomestication merger, the Company changed its name to Cogo Group, Inc. and Cogo Maryland ceased to exist.
Cogo Maryland, formerly known as Trident, was incorporated in 1917. On July 22, 2004, Trident, which was a public reporting company that ceased operations in 2000, acquired all of the outstanding capital stock of Comtech Cayman, in exchange for the issuance of approximately 91.2% of the then-outstanding shares of its common stock to the shareholders of Comtech Cayman. On August 2, 2004, Trident changed its name from Trident to Comtech Group, Inc. and on May 13, 2008, further changed its name to Cogo Group, Inc.
Our registered office is c/o Abacus Management Limited, Ground Floor Elizabethan Square, George Town, P.O. Box 2499, Grand Cayman, KY1-1104 Cayman Islands.
Sale of Certain Subsidiaries to Envision
On October 23, 2012, we entered into a Sale and Purchase Agreement (the “Envision Agreement”) with Envision, an entity owned by Jeffrey Kang, our Chairman and Chief Executive Officer pursuant to which we would sell certain subsidiaries (the “Disposal Group”), representing approximately 28% of the Company’s revenues in 2012, to Envision for total consideration of USD78 million. The purchase price, which was based on the results of an independent appraisal, was to be paid in two installments, whereby USD10 million was to be paid at closing and the remaining USD68 million to be paid on or before December 31, 2012. The transactions contemplated by the Agreement closed on November 15, 2012 following the restructuring of certain of our subsidiaries, and the entire USD78 million purchase price was paid in full as of November 2012.
Pursuant to the terms of the Envision Agreement and a Services Agreement dated November 14, 2012, guarantees to banking institutions among our remaining subsidiaries and the Disposal Group will be maintained for a transitional period through December 31, 2014 in order to maintain better financing terms for both parties. We will charge a guarantee fee amounting to USD250,000, as determined with reference to the guarantee fee chargeable by banks, to Envision each quarter. We will also provide support and administrative services, including logistics, warehousing, accounting service, customer service, human resource service and IT services, to the Disposal Group. Service fees will be charged at pre-determined rates over usage and revenue generated by the Disposal Group as stipulated in the Services Agreement.
The Envision Agreement also contains a non-competition clause. Historically, the Company and the Disposal Group are led by different sales teams focusing on different geographical or end-product customers. Pursuant to the non-competition clause under the Envision Agreement, we and Envision agreed not to compete with each other’s business for a period of two years from closing, among others, particularly, we agreed not to compete with each other’s business involving the distribution of the product that the other party distributes or has distributed in the past and which is or is likely to be in competition with the other party or have any interest in any project or proposal in any such business or activity on behalf of or for the benefit of any person. Additionally, we and Envision agreed to make reasonable efforts to maintain the operations of Envision and its acquired subsidiaries in the ordinary course consistent with past practices and to preserve its relationships with its major customers, suppliers and others having business dealings with the acquired subsidiaries. For the year ended December 31, 2012, 2011 and 2010, the Disposal Group contributed approximately 28%, 33% and 35%, respectively, of our net sales. The impact from the disposal of certain subsidiaries was insignificant in 2012 results but it is expected to impact our operating results significantly from 2013 onwards.
Company Overview
We provide customized module design solutions for a diverse set of applications and end markets, serving as a gateway for our technology component suppliers to access leading electronics manufacturers in the PRC. Our customized module design solutions allow our customers to take advantage of technology components from reputable suppliers in an efficient and cost-effective manner, effectively reducing their time-to-market and lowering their overall costs. Our close collaboration with our customers’ product development teams provides us with a unique understanding of their needs, enabling us to customize our suppliers’ technology components with module designs that meet our customers’ needs.
We focus on the digital media, telecommunications equipment and industrial business end-markets in the PRC. In the digital media end-market, we provide mobile handset and module solutions for functionalities such as CMMB mobile TV, motion sensor, camera, power supply and bluetooth as well as solutions for high definition digital set-top box, GPS and solutions for Tablet. In the telecommunications equipment end-market, we provide solutions for public switched telephone network, or PSTN, switching, optical transmitters, electrical signal processing and optical signal amplification. In the industrial business end-market, we provide industrial solutions for the smart meter, smart grid, railway and auto-electronics sectors. Currently, we have approximately 2,100 customers, including many of the most established manufacturers in the digital media, telecommunications equipment and industrial business end-markets in the PRC such as ZTE, TCL and BYD. We work with original equipment manufacturers, or OEMs, as well as subsystem designers and contract manufacturers to provide solutions to support industry leaders like Huawei. In developing customized module design solutions for use in our customers’ products, we collaborate closely with over 30 suppliers of technology components, including many large multinational companies such as Broadcom, Sandisk, Freescale Semiconductor and Atmel. Additionally, in October 2006 we became one of the first the PRC-based companies to license software technology and have access to selected source codes relating to digital media directly from Microsoft.
Based on the customer’s specific requirements, we will propose a customized module reference design, which usually incorporates technology components from our suppliers. If the customer accepts our module reference design, it will generally agree to purchase specific components contained in our proposed design from us. However, our customers and their third-party contract manufacturers are responsible for the manufacture and assembly of the customized module based on our designs. Our business model is based on generating recurring revenue by reselling specific components required in our module reference designs. The difference between the purchase price we pay our suppliers for these components and our sales price to our customers for these components compensates us for our design, technical support and distribution services.
We continue to explore and identify new end-markets where we can leverage both our design and engineering expertise. For example, in January 2011, we acquired MDC Tech International Holdings Limited which provides us with a strong foothold in two fast growing industrial markets: health care and smart grid.
From 2010 to 2012, our net revenue grew from RMB2,589.5 million to RMB4,890.6 million (USD785.0 million), representing a compound annual growth rate, or CAGR, of 37.4%.
Competitive Strengths
We believe that our customized module design solutions allow our customers to more effectively utilize our suppliers’ enabling technology components, which in turn allows them to better compete in their targeted end-markets. We believe our competitive strengths include:
Broad customer base and deep customer relationships. Our broad customer base includes many major domestic telecommunications equipment, industrial business and digital consumer electronics manufacturers in the PRC and many of their supporting subsystem suppliers. Being a customized module design solution provider to our customers requires a time-consuming and difficult procurement qualification process, which we believe serves as a significant barrier to entry for other participants. We believe that these close customer relationships, together with our continued qualified solution provider status, facilitate better understanding of our customers’ time-to-market, technology and cost requirements. These relationships also present new business opportunities by enabling us to identify and capture additional revenue streams from our customers’ new growth areas.
Differentiated business model. We facilitate our customers’ use of technology components in their end-products, thus reducing both their time-to-market and overall costs. As we focus on providing solutions to meet our customers’ specific requirements, we believe that we are less vulnerable to risks associated with the development and adoption of new and unproven technology. We do not directly charge a design fee for our customized module solutions. Instead, we are compensated by a markup on the components recommended in our design solution, which is determined principally by the extent of the design work we provide.
Accumulated design solutions expertise.Over the years, we have developed an extensive portfolio of design solutions we can leverage to accommodate the needs of new clients or existing clients with changed needs. As such, we are able to achieve significant design cost efficiencies by reducing the need to invest the time or resources associated with designing a new solution. In addition, our engineers have also accumulated a significant amount of design and engineering expertise from working with various clients from our extensive customer base.
Strong relationships with enabling technology components suppliers. We work closely with more than 30 technology components suppliers, including major global components suppliers such as Broadcom, Sandisk, Freescale Semiconductor and Atmel. In addition to facilitating the customization of their technology components, our suppliers often rely on us as a means of penetrating new PRC-based electronics manufacturers via our existing domestic relationships.
Strategy
We intend to strengthen our position as a technology solution provider for customers in PRC’s digital media, telecommunications equipment and industrial business end-markets.
Leverage our strong customer relationships into new opportunities.In 2008, we began targeting the industrial business end-market to provide industrial solutions for the green energy and auto-electronics sectors. We have since then grown our revenues generated from this market from constituting 4.5% of our 2008 revenue to 17.9% of our 2012 revenue. We anticipate that sales related to the industrial business end-markets will generally have higher profit margins than our digital media and telecom equipment modules related sales, though such higher margins may decline over time as this industry matures. We will also look for opportunities to expand into new end markets that we believe represent significant growth opportunities.
Our success in the industrial business end-market will depend, in significant part, on our ability to leverage our existing customer base. We expect to continue to incur additional research and development expenses, through hiring additional engineering personnel to develop new solutions and expanding our intellectual property and technological capabilities, to meet the needs of our customers that have expanded into or are expected to expand into the industrial business end-market.
Strengthen our design and development capabilities. To meet the changing needs of our customers, which include increasingly shorter product life cycles, we intend to continue to improve and strengthen our in-depth and diversified solution development and design capabilities. We plan to continue investing resources to maintain the most experienced and skilled design team to preserve competitiveness within a frequently changing and challenging industry landscape. We expect to continue to incur additional research and development expenses, through hiring additional engineering personnel to develop new solutions and expanding our intellectual property and technological capabilities to meet the needs of our customers that have expanded into or are expected to expand into different end-markets, such as digital media and industrial business.
Enhance our competitiveness in new product areas through strategic alliances.We intend to broaden our product offerings by leveraging our existing design and engineering expertise as well as selectively entering into strategic alliances with third parties to complement our existing capabilities. For example, we entered into an arrangement with Microsoft whereby we will have the ability to license next generation software technology from Microsoft’s IP Ventures program and use Microsoft’s source codes to develop design solutions across a variety of digital media applications. We believe this arrangement will enhance our competitiveness in design solutions for digital media initiatives, targeting various end-markets including high definition digital set top-box, GPS, game console, smartphone and portable media player markets. We intend to continue working with third parties in ways that will enhance our competitiveness.
Make strategic investments and acquisitions. We intend to grow and expand our business by making strategic investments in and acquiring businesses complementary to ours that will enable us to expand the solutions we offer to our existing target customer base, and that will provide opportunities to expand into new markets. In particular, we plan to pursue opportunities where we expect to generate additional near-term revenue or expand our long-term growth opportunities by expanding our customer base or target end-markets. For example, in January 2011, we acquired MDC Tech International Holdings Limited which provides us with a strong foothold in two fast growing industrial markets: health care and smart grid. In 2009, we acquired 100% of Mega Smart Group Limited and its subsidiary, which engage in the development of industrial applications components in the PRC.
In November 2012, we sold a series of operating entities, representing approximately 28% of the Company’s revenue for the for the year ended December 31, 2012, to Envision, an entity controlled by Jeffrey Kang, the Company’s Chairman and Chief Executive Officer, for total consideration of USD78 million. Both Cogo and Envision will make reasonable efforts to maintain the operations of Envision in the ordinary course consistent with past practices and to preserve its relationships with its major customers, suppliers and others having business dealings with the Cogo. We intend to continue to strengthen our position as a technology solution provider for PRC customers in our end-markets.
Products and Technology
We provide customization of our suppliers’ technology components with module designs to suit each of our customers’ specific needs. Our customized module design solutions include:
| Digital Media Modules | | Telecommunications Equipment Modules | | Industrial Business Solutions |
| CMMB mobile TV | | Fixed line telecommunications network | | Smart Meter |
| Motion Sensor | | Data communications | | Smart Grid |
| Persistent storage | | Optical transmission | | Railways |
| Input / output | | Wireless base-station | | Auto-electronics |
| Sound system | | | | Health Care |
| Power supplies | | | | |
| Bluetooth | | | | |
| Multimedia | | | | |
| High definition digital set-top box | | | | |
| GPS | | | | |
| Multimedia module in portable media player | | | | |
| Multimedia module in home entertainment | | | | |
| Tablets functionality | | | | |
The following table sets forth the revenue contribution from our digital media, telecommunications equipment, industrial business and other services end-markets during 2010, 2011 and 2012.
| Market | | 2012 | | | 2011 | | | 2010 | |
| Digital media | | | 37.9 | % | | | 42.3 | % | | | 57.0 | % |
| Telecommunications equipment | | | 44.2 | % | | | 37.1 | % | | | 24.3 | % |
| Industrial business | | | 17.9 | % | | | 20.6 | % | | | 17.4 | % |
| Services revenue | | | 0.0 | % | | | 0.0 | % | | | 1.3 | % |
| Total | | | 100.0 | % | | | 100.0 | % | | | 100.0 | % |
Our research and development (“R&D”) unit has always been a driving component in our business and remains crucial in providing the best design solutions for our customers. We have a team of approximately 314 highly qualified design and application engineering specialists and other technical employees engaged in R&D related activities to develop new customized module solutions targeted at the wireless handset, telecommunications equipment, industrial business and digital media industries. In 2010, 2011 and 2012, we invested RMB77.9 million, RMB101.6 million and RMB102.5 million (USD16.5 million), respectively, for R&D purposes and we expect to continue to devote significant resources to supporting and enhancing the depth and capabilities of our R&D unit.
Customers
Our broad customer base includes many of the major domestic digital media, telecommunications equipment and industrial business manufacturers in the PRC. In addition, our customers include industry participants supporting these OEMs, such as subsystem designers and contract manufacturers in the PRC, as well as international manufacturers who have begun to manufacture end-products in the PRC for the domestic and international markets. Our three largest customers in the digital media market in terms of 2012 net revenue were ZTE, both a large domestic mobile handset manufacturer and one of the largest telecommunications equipment manufacturers in the PRC, T&W Electronics, a major broadband terminal equipment and digital consumer electronic provider in the PRC and Yulong, a leading developer and provider of integrated solutions for smartphone sets in the PRC. Our two largest customers from the telecommunications equipment industry in terms of 2012 net revenue were ZTE and Wuhan Research Institute of Post & Telecommunications, a major telecommunications equipment manufacturer in the PRC. Our customers in the industrial business end-market are mainly small and medium enterprises. During 2012, ZTE, T&W Electronics, Yulong, Wuhan Research Institute of Post & Telecommunications and BYD accounted for 16.1%, 9.7%, 5.6%, 4.2% and 2.9% of our net revenue, respectively.
As of December 31, 2012, our major customers by end-market were as follows:
| · | Digital Media—TCL, Yulong, ZTE and Tenda. |
| · | Telecommunications Equipment— ZTE, T&W Electronics and Wuhan Research Institute of Post & Telecommunications |
| · | Industrial Business—BYD and small and medium enterprises |
In 2010, 2011 and 2012, our top 10 customers to whom we sold directly, including several contract manufacturers used by some of our major end-market customers, were as follows:
| | | 2012 | | | 2011 | | | 2010 | |
| Customer Name | | Net Revenue | | | % of Net
Revenue
(%) | | | Net Revenue | | | % of Net
Revenue
(%) | | | Net Revenue | | | % of Net
Revenue
(%) | |
| | | (in millions, except for percentages) | |
| ZTE | | RMB | 785.9 | | | | 16.1 | | | RMB | 1,039.9 | | | | 29.3 | | | RMB | 672.6 | | | | 26.0 | |
| T&W Electronics | | | 472.6 | | | | 9.7 | | | | 255.5 | | | | 7.2 | | | | 132.2 | | | | 5.1 | |
| Yulong | | | 275.5 | | | | 5.6 | | | | 142.9 | | | | 4.0 | | | | 74.4 | | | | 2.9 | |
| Wuhan Research Institute of Post & Telecommunications | | | 206.1 | | | | 4.2 | | | | 157.2 | | | | 4.4 | | | | 121.6 | | | | 4.7 | |
| BYD | | | 141.7 | | | | 2.9 | | | | 63.9 | | | | 1.8 | | | | 51.9 | | | | 2.0 | |
| Tenda | | | 140.5 | | | | 2.9 | | | | 70.4 | | | | 2.0 | | | | * | | | | * | |
| TCL | | | 130.9 | | | | 2.7 | | | | 89.2 | | | | 2.5 | | | | 51.0 | | | | 2.0 | |
| Goertek | | | 130.6 | | | | 2.7 | | | | 63.1 | | | | 1.8 | | | | * | | | | * | |
| Beny Wave | | | 123.7 | | | | 2.5 | | | | * | | | | * | | | | * | | | | * | |
| Meizu | | | 99.5 | | | | 2.0 | | | | * | | | | * | | | | * | | | | * | |
| Skyworth Digital | | | * | | | | * | | | | 67.3 | | | | 1.9 | | | | 181.0 | | | | 7.0 | |
| Starnet Digital Technology | | | * | | | | * | | | | 54.8 | | | | 1.5 | | | | 40.9 | | | | 1.6 | |
| COSHIP | | | * | | | | * | | | | * | | | | * | | | | 49.1 | | | | 1.9 | |
| Shanghai Xiangnei Auto | | | * | | | | * | | | | * | | | | * | | | | 29.7 | | | | 1.1 | |
| Total | | RMB | 2,507.0 | | | | 51.3 | | | RMB | 2,004.2 | | | | 56.4 | | | RMB | 1,404.4 | | | | 54.3 | |
| * | Not a top 10 customer in the applicable year. |
The value of our technology solutions can be illustrated by specific examples of how we have worked closely with our customers and suppliers in leveraging our competitive position and unique business model to solidify and extend our existing business, as well as identify and capture new opportunities:
Applying our customized module design capabilities to new end-markets. We have leveraged our customized module design capabilities and our deep, multi-level customer relationships to follow our customers into new end-markets. Since 1995, we have been a provider of customized module design solutions for telecommunications equipment to ZTE, one of the largest telecommunications equipment manufacturers in the PRC. ZTE first sought to enter the mobile handset market in the PRC in 2000. Based on our working history with ZTE on telecommunications equipment solutions and on our proven design capabilities, ZTE selected us as a provider of customized module design solutions for their mobile handsets in 2000. Our total net revenue from ZTE was RMB785.9 million (USD126.1 million) in 2012.
Suppliers
We develop our customized module design solutions based on technology components provided by key technology and other suppliers in our target end-markets. We work with a list of more than 30 key suppliers, including:
| Supplier Name | | Product |
| Broadcom | | Various products including integrated circuit and Bluetooth |
| Freescale Semiconductor | | Microcontrollers |
| Atmel | | Microcontrollers |
| Sandisk | | Flash memory |
| Matsushita | | Switches, connectors, relay |
| Xilinx | | Microcontrollers |
In 2010, 2011 and 2012, based on cost, our major suppliers from whom we purchase components sold to our customers were as follows:
| Supplier Name | | 2012 | | | 2011 | | | 2010 | |
| | | % of Cost of sales (%) | |
| Broadcom | | | 45.7 | | | | 41.1 | | | | 37.7 | |
| Sandisk | | | 9.6 | | | | 7.8 | | | | 8.2 | |
| Freescale Semiconductor | | | 6.9 | | | | 8.1 | | | | 6.3 | |
| Atmel | | | 5.8 | | | | 7.8 | | | | 7.1 | |
| Matsushita | | | 3.4 | | | | 7.4 | | | | 9.3 | |
We have established long-standing relationships with our key suppliers. For example, we have worked with Matsushita since our inception in 1995. While we depend on our key suppliers, we believe that we can find alternative suppliers within a reasonable amount of time without significantly altering our proposed solutions. For further information concerning our reliance on Broadcom, Matsushita and other key suppliers, see “Item 3. Key Information – Risk Factors—Reliance on our suppliers, with whom we often do not have long-term supply agreements, makes us vulnerable to the loss of one or more key suppliers or the delivery capabilities of our suppliers.”
Development of collaborative relationships with key component suppliers. We have expanded our business by collaborating with our key component suppliers and incorporating our suppliers’ technology components into our module reference designs to provide customized solutions for different OEM customers. For example, demand for flash memory integrated circuits has increased as the need for high volume storage has grown rapidly due to the more advanced data services offered over wireless networks onto mobile handsets. We developed a storage module by incorporating our supplier’s flash memory products, customizable for each customer according to their varying design criteria. Through this approach, we were able to customize each module to provide optimal functionality to a variety of OEM customers. Our ability to bring this solution to each of these OEM customers:
| · | allow our customers to optimize their mobile handsets by incorporating flash memory technology in a fast and cost-efficient fashion; |
| · | allow this supplier to penetrate the PRC market and specific OEM customers, without having to design and manufacture separate flash memory products; and |
| · | reinforce and broaden our relationship with this key component supplier. |
Sales and Marketing
We generate sales of our customized module design solutions through our direct sales force, consisting of approximately 132 sales directors, account managers and sales support staff as of December 31, 2012. Our sales directors are responsible for establishing sales strategy and setting objectives for specific customer accounts. Each account manager is dedicated to a specific customer account and is responsible for the day-to-day management of that customer relationship. Account managers work closely with customers and, in many cases, provide on-site support. Account managers often attend our customers’ internal meetings related to production, engineering design and quality assurance to ensure that our customers’ expectations are appropriately interpreted and communicated to our operations group, and ultimately met or exceeded throughout the design process. Account managers also work with our customers to identify and meet their cost and design-to-delivery cycle time objectives.
Our new business development account managers initiate and maintain long-term, multi-level relationships with customer accounts and work closely with customers on new business opportunities throughout the design-to-delivery cycle.
Competition
We believe that the principal competitive factors affecting the markets for our customized module design solutions and engineering services include:
| · | understanding our customers’ time-to-market, technology and cost requirements; |
| · | access to technology providers; |
| · | customer relationships; and |
We believe that we compare favorably with respect to each of these criteria. In addition, while we do not believe that there are any direct competitors of any meaningful size that operate using the same business model as ours, we face indirect competition from the following:
Other technology component suppliers. For each project, we work with suppliers to compete against other technology component suppliers. Consequently, we indirectly compete against our suppliers’ competitors. For example, by working with JDS Uniphase, we compete indirectly against companies such as Avanex and Bookham in supplying optical transmission module designs.
Component manufacturers and distributors. We compete indirectly with component manufacturers such as Epcos, and component distributors such as Arrow Electronics, Inc. and Avnet, Inc., which may seek to expand their product/service offerings to include customized module design solutions. We believe that these large component manufacturers and distributors have not historically engaged in customized module design, and therefore we believe that it is not one of their core competencies.
We may also face indirect competition from customers and suppliers. Currently many of our customers and suppliers do not focus on customized module design. If our customers or suppliers decide to devote more time and resources to in-house module design, the demand for our solutions may decline. In addition, our customers may change their procurement strategy or decide to rely on us primarily for component delivery and not for integration or design work. Similarly, component suppliers may also seek to offer their component products or modules incorporating key components from our solutions directly to our customers.
Government Regulations
The telecommunications industry in the PRC is heavily regulated. The Ministry of Information Industry, which is the primary telecommunications industry regulator in the PRC, is responsible for formulating policies and regulations for the telecommunications industry including on matters such as tariffs and service quality, granting telecommunications licenses, allocating frequency spectrum and numbers, formulating interconnection and settlement arrangements between telecommunications operators, and enforcing industry regulations. Telecommunications operators are subject to various regulatory requirements and failure to comply with such requirements may subject them to mandatory penalties or other punitive measures, any of which could have a material adverse effect on their operations and financial condition.
Organizational Structure
The following chart illustrates our organizational structure as of December 31, 2012:
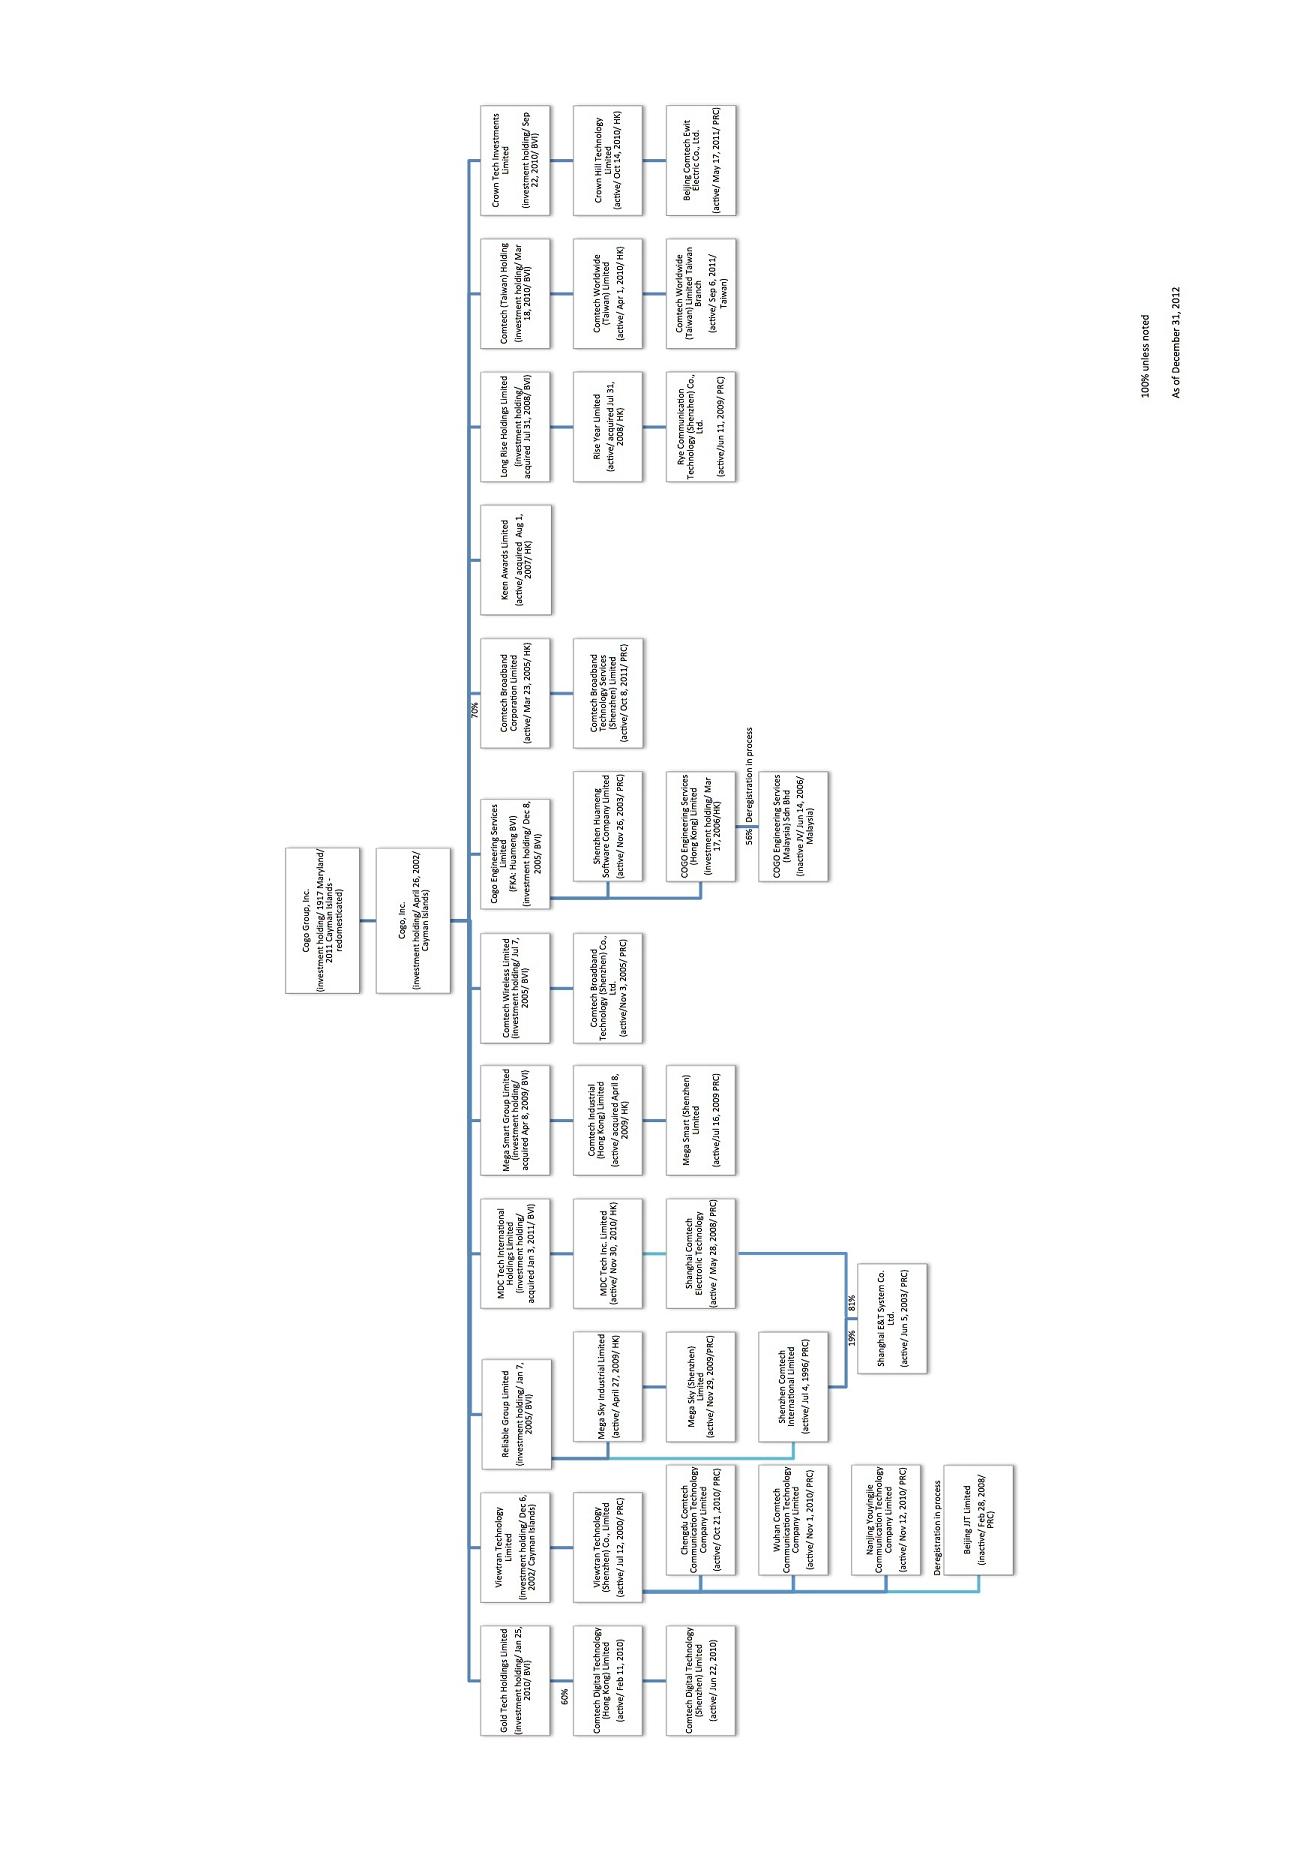
The following table sets forth our subsidiaries which principally affect our results of operations and financial condition as of December 31, 2012 and 2011:
| Name of Company | | Place of incorporation
or establishment | | Attributable equity interest
held | | | Principal activity |
| | | | | 2012 | | | 2011 | | | |
Comtech Broadband Technology (Shenzhen) Co., Ltd.
(Formerly known as “Comloca Technology (Shenzhen) Company Limited”) (“Comtech Broadband SZ”) | | PRC | | | 100 | % | | | 100 | % | | Sales of electronics components and related products |
| | | | | | | | | | | | | |
| Comtech Broadband Corporation Limited (“Comtech Broadband”) | | Hong Kong | | | 70 | % | | | 70 | % | | Sales of electronics components and related products |
| | | | | | | | | | | | | |
| Comtech Communication Technology (Shenzhen) Company Limited (“Comtech Communication”) | | PRC | | | 0 | % | | | 100 | % | | Sales of electronics components and related products (note a) |
| | | | | | | | | | | | | |
| Comtech International (Hong Kong) Limited (“Comtech Hong Kong”) | | Hong Kong | | | 0 | % | | | 100 | % | | Sales of electronics components and related products (note a) |
| | | | | | | | | | | | | |
| Comtech Software Technology (Shenzhen) Company Limited (“Comtech Software”) | | PRC | | | 0 | % | | | 100 | % | | Sales of electronics components and related products and research and development of software products (note a) |
| | | | | | | | | | | | | |
| Epcot Multimedia Technology (SZ) Co. Ltd. (“Epcot”) | | PRC | | | 0 | % | | | 100 | % | | Provision of media communication and collaboration platforms and solutions (note a) |
| | | | | | | | | | | | | |
| Shenzhen Comtech International Limited (“Shenzhen Comtech”) | | PRC | | | 100 | % | | | 100 | % | | Sales of electronics components and related products (note b) |
| | | | | | | | | | | | | |
| Shanghai Comtech Electronic Technology Company Limited (“Shanghai Comtech”) | | PRC | | | 100 | % | | | 100 | % | | Sales of electronics components and related products (note a) |
| | | | | | | | | | | | | |
| Shanghai E&T System Company Limited (“Shanghai E & T”) | | PRC | | | 100 | % | | | 100 | % | | Sales of electronics components and related products (note c) |
| | | | | | | | | | | | | |
| Shenzhen Huameng Software Company Limited (“Huameng PRC”) | | PRC | | | 100 | % | | | 100 | % | | Provision of technology and engineering services, outsourcing, network system integration and related training and maintenance services |
| | | | | | | | | | | | | |
| Viewtran Technology (Shenzhen) Co., Limited (“Viewtran PRC”) | | PRC | | | 100 | % | | | 100 | % | | Provision of media communication and collaboration platforms and solutions |
| | | | | | | | | | | | | |
| Comtech Digital Technology (Hong Kong) Limited (“Comtech Digital”) | | Hong Kong | | | 60 | % | | | 60 | % | | Sales and development of digital and industrial applications, microcontrollers and complementary products |
| | | | | | | | | | | | | |
| Comtech Industrial (Hong Kong) Limited (“Comtech Industrial”) | | Hong Kong | | | 100 | % | | | 100 | % | | Sales and development of industrial applications, microcontrollers and complementary products |
| | | | | | | | | | | | | |
| Mega Sky (Shenzhen) Limited (“Mega Sky SZ”) | | PRC | | | 100 | % | | | 100 | % | | Provision of industrial and microcontroller based system solutions and research and development of software products |
| Name of Company | | Place of incorporation
or establishment | | Attributable equity interest
held | | | Principal activity |
| | | | | 2012 | | | 2011 | | | |
| Mega Smart (Shenzhen) Limited (“Mega Smart SZ”) | | PRC | | | 100 | % | | | 100 | % | | Provision of industrial and microcontroller based system solutions on customer, industrial, automotive, smart meter and smart grid markets |
| Note a | Pursuant to the Envision Agreement dated October 23, 2012, we sold certain subsidiaries, including Comtech Communication, Comtech Hong Kong, Comtech Software and Epcot, to Envision for a total consideration of USD78 million. The entire purchase price was fully received and transactions contemplated by the Envision Agreement closed on Date of Sale. |
One of our indirectly controlled subsidiaries, Shanghai Comtech, did not form part of the Disposal Group but its 100% equity interest is held by one of entities in the Disposal Group. In order to retain control over Shanghai Comtech, we, through one of our wholly-owned subsidiaries, entered into legal arrangements with the Disposal Group pursuant to which the Disposal Group agrees to hold the equity interest in Shanghai Comtech on behalf of our wholly-owned subsidiary, and waive its full rights and risks of ownership of the equity interests in favour of our wholly-owned subsidiary. Accordingly, we retain our control over Shanghai Comtech through such legal arrangements.
| Note b | We exercise our control over Shenzhen Comtech through legal arrangements between Shenzhen Comtech’s legal shareholders and our wholly-owned subsidiary. The legal shareholders of Shenzhen Comtech are Huimo Chen, the mother of Jeffrey Kang, and Honghui Li, the Vice President of the Group, who hold 1% and 99% equity interest in Shenzhen Comtech respectively. The legal shareholders agree to hold the equity interest in Shenzhen Comtech on behalf of our wholly-owned subsidiary, and waive their full rights and risks of ownership of the equity interests in favor of our wholly-owned subsidiary. |
| Note c | Prior to January 1, 2012, the legal shareholders of Shanghai E&T were Shenzhen Comtech and Honghui Li with equity interests of 95% and 5% respectively. Honghui Li entered into and was bound by legal arrangements, similar to those as described in note (b), with our wholly-owned subsidiary relating to his holding of 5% equity interest in Shanghai E&T and agreed to hold on behalf of our wholly-owned subsidiary waiving his full rights and risks of ownership of the equity interests in favor of our wholly-owned subsidiary. |
| | On January 1, 2012, we instructed Shenzhen Comtech and Honghui Li to transfer 76% and 5% of their respective equity interest in Shanghai E&T to Shanghai Comtech. After the transfer, the legal shareholders of Shanghai E&T are Shenzhen Comtech and Shanghai Comtech, subsidiaries which we exercise our controls through legal arrangements (see notes (a) and (b)), with equity interest of 19% and 81% respectively. |
Property, Plant and Equipment
We lease properties with a total area of approximately 142,000 square feet in 25 locations in the PRC including Shenzhen, Shanghai, Beijing, Hangzhou, Wuhan, Suzhou, Chengdu, Nanjing, Xi’an, Taiwan and Hong Kong. Approximately 36,000 square feet is for our corporate headquarters located in Shenzhen, approximately 52,000 square feet is for our research and development centers in Shenzhen and Shanghai and approximately 54,000 square feet is for our representative offices located in the other cities. These leases have remaining terms ranging from 3 to 18 months.
We believe that our existing facilities and equipment are well maintained and in good operating condition, and are sufficient to meet our needs for the foreseeable future.
| ITEM 4A. | UNRESOLVED STAFF COMMENTS |
None.
| ITEM 5. | OPERATING AND FINANCIAL REVIEW AND PROSPECTS |
The following discussion of our financial condition and results of operations should be read in conjunction with our audited consolidated financial statements and the notes to those financial statements appearing elsewhere in this Annual Report. This discussion contains forward-looking statements that involve significant risks and uncertainties. As a result of many factors, such as those set forth under “Forward Looking Statements” and “Item 3. Key Information – Risk Factors” and elsewhere in this Annual Report, our actual results may differ materially from those anticipated in these forward-looking statements.
Overview
We provide customized module design solutions for a diverse set of applications and end markets, serving as a gateway for our technology component suppliers to access leading electronics manufacturers in the PRC. Our customized module design solutions allow our customers to take advantage of technology components from reputable suppliers in an efficient and cost-effective manner, effectively reducing their time-to-market and lowering their overall costs. Our close collaboration with our customers’ product development teams provides us with a unique understanding of their needs, enabling us to customize our suppliers’ technology components with module designs that meet our customers’ requirements.
We focus on the digital media, telecommunications equipment and industrial business end-markets in the PRC. In the digital media end-market, we provide mobile handset and module solutions for functionalities such as CMMB mobile TV, motion sensor, camera, power supply and Bluetooth as well as solutions for high definition digital set-top box, GPS and solutions for Tablet. In the telecommunications equipment end-market, we provide solutions for PSTN switching, optical transmitters, electrical signal processing and optical signal amplification; in the industrial business end-market, we provide industrial solutions for the green energy, auto-electronics and health care sectors. Currently, we have approximately 2,100 customers, including many of the most established manufacturers in the digital media, telecommunications equipment and industrial business end-markets in the PRC such as ZTE, TCL and BYD. We work with original equipment manufacturers, or OEMs, as well as subsystem designers and contract manufacturers to provide solutions to support industry leader like Huawei. In developing customized module design solutions for use in our customers’ products, we collaborate closely with over 30 suppliers of technology components, including many large multinational companies such as Broadcom, Sandisk, Freescale Semiconductor and Atmel. Additionally, in October 2006, we became one of the first PRC-based companies to license software technology and have access to selected source codes directly from Microsoft.
Prior to 2012, we had two reportable operating segments: product sales consisting of revenues generated by providing customized module design solutions focusing primarily in the digital media, telecommunications equipment and industrial business end-markets, and service revenue, generated by providing technology and engineering services, network system integration and related training and maintenance services.
We did not generate external service revenue for the years ended December 31, 2012 and 2011. Due to the decreasing significance of service revenue segment, there was a change in the reporting information about our operating segments in 2012. The available financial information that is evaluated regularly by the chief operating decision maker in allocating resources and in assessing performance does not differentiate the product sales segment and service revenue segment. Thus, the service revenue segment is not considered to be a reportable segment for the year ended December 31, 2012. Therefore, we operate in a single business segment as the revenue and profit are derived entirely from sales of components of digital media components (such as network protection devices and data storage), telecommunication system equipment and industrial applications end-markets. Accordingly, no operating segment information is presented for the year ended December 31, 2012.
Sale of Certain Subsidiaries to Envision
On October 23, 2012, we entered into a Sale and Purchase Agreement (the “Envision Agreement”) with Envision, an entity owned by Jeffrey Kang, our Chairman and Chief Executive Officer pursuant to which we would sell certain subsidiaries (the “Disposal Group”), representing approximately 28% of the Company’s revenues in 2012, to Envision for total consideration of USD78 million. The purchase price, which was based on the results of an independent appraisal, was to be paid in two installments, whereby USD10 million was to be paid at closing and the remaining USD68 million to be paid on or before December 31, 2012. The transactions contemplated by the Agreement closed on November 15, 2012 following the restructuring of certain of our subsidiaries, and the entire USD78 million purchase price was paid in full as of November 2012.
Pursuant to the terms of the Envision Agreement and a Services Agreement dated November 14, 2012, guarantees to banking institutions among our remaining subsidiaries and the Disposal Group will be maintained for a transitional period through December 31, 2014 in order to maintain better financing terms for both parties. We will charge a guarantee fee amounting to USD250,000, as determined with reference to the guarantee fee chargeable by banks to Envision each quarter. We will also provide support and administrative services, including logistics, warehousing, accounting service, customer service, human resource service and IT services, to the Disposal Group. Service fee will be charged at pre-determined rates over usage and revenue generated by the Disposal Group as stipulated in the Services Agreement.
The Envision Agreement also contains a non-competition clause, pursuant to which we and Envision agreed not to compete with each other’s business for a period of two years from closing. Additionally, we and Envision agreed to make reasonable efforts to maintain the operations of Envision and its acquired subsidiaries in the ordinary course consistent with past practices and to preserve its relationships with its major customers, suppliers and others having business dealings with the acquired subsidiaries.
Principal Factors Affecting Our Results of Operations
The major factors affecting our results of operations and financial condition include:
Revenue mix. Our net revenue and gross profit are affected by our product mix. Over the last year, telecommunications equipment related sales, which have generally lower profit margins than our digital module related sales and our industrial business module related sales, have constituted a greater portion of our total net revenue as compared to the previous years.
Growth in end-market industries. The rapid growth of the domestic telecommunications equipment, industrial business and digital media end-markets have been important growth drivers for PRC’s electronics manufacturing industries. Specific markets that we expect to experience continued growth are the data communications market, consisting of asymmetric digital subscriber line (ADSL) modems and Voice over Internet Protocol (VoIP) equipment; the routers and network security equipment markets; the optical transmission systems market; the fixed line telecommunications network market, as well as the digital media market particularly relating to digital TV and GPS. Increased domestic consumer spending power has contributed to rapid growth in these markets. This growth in domestic consumer spending power in turn has driven, and we believe will continue to drive, growth in the electronics manufacturing businesses supporting hardware OEMs, including those engaged in the customized design of module solutions such as ourselves. However, these industries and the respective domestic manufacturers that operate in these industries may not continue to grow their sales at historical levels, if at all. The stagnation or reduction in overall demand for telecommunications equipment, industrial business and digital media products could materially affect our results of operations.
Increase in exports. We believe that the development of a highly-skilled, low-cost manufacturing base has also enabled PRC’s domestic telecommunications equipment and digital consumer electronics manufacturers to be competitive in the global marketplace. As an example, ZTE, a major manufacturer of mobile handset and telecommunications equipment in the PRC, as well as other telecommunications equipment and mobile handset manufacturers, have also begun to expand overseas. We believe that growth in the export market will likely have a positive effect on our results of operations and financial condition, as it should increase the demand for our solutions, particularly among our digital media clients.
Growth by entering new end-markets, strengthening in-house capabilities and leveraging our customer base. In 2008, we began targeting the industrial business end-market by providing industrial solutions for the green energy and auto-electronics sectors. Since then the revenues generated from this market have grown from 4.5% of our 2008 revenue to 17.9% of our 2012 revenue. We anticipate that sales related to the industrial business end-markets will generally have higher profit margins than our digital media and telecommunications equipment modules related sales, though such higher margins may decline over time as this industry matures. We will also look for opportunities to expand into new end-markets that we believe represent significant growth opportunities.
Our success in the industrial business end-market will depend, in significant part, on our ability to leverage our existing customer base. We expect to continue to incur additional research and development expenses, through hiring additional engineering personnel to develop new solutions and expanding our intellectual property and technological capabilities, to meet the needs of our customers that have expanded into or are expected to expand into the industrial business end-market.
General economic and market conditions.Due to market conditions, the level of consumer and information technology spending has declined and reduced the demand for our mobile handsets since the third quarter of 2008. Furthermore, our profit margins have been reduced since we strategically lowered our pricing in order to grow the business in a slowing economic environment.
Net Revenue
Product sales
For product sales, we do not charge our customers an independent design fee. Instead, our business model is to generate revenue by reselling a limited number of specific components required in our module reference design. The difference between the purchase price we pay our suppliers for these components and our sales price to the customer for these components compensates us for our design, technical support and distribution services. Our net revenue is net of a 17% value-added tax, or VAT. Costs incurred for the design of modules are expensed as incurred and recorded as research and development expense in the Company’s consolidated statements of comprehensive income/(loss).
Our broad and diversified customer base includes many of the major telecommunications equipment, industrial business and digital consumer electronics manufacturers in the PRC. In addition, our customers include industry participants supporting these OEMs, such as subsystem designers and contract manufacturers in the PRC, as well as international manufacturers who have begun to manufacture end-products in the PRC for the domestic and international market. Our two largest customers from the telecommunications equipment industry in terms of 2012 net revenue were ZTE, one of the largest telecommunications equipment manufacturers in the PRC, and Wuhan Research Institute of Post & Telecommunications, a major telecommunications equipment manufacturer in the PRC. Our largest customers in the digital media end-market in terms of 2012 net revenue was ZTE, T&W Electronics, a major broadband terminal equipment and digital consumer electronic provider in the PRC, and Yulong, one of the leading developers and providers of integrated solutions for smartphone sets in the PRC. Our largest customer from the industrial end-market in terms of 2012 net revenue was BYD, a leading high-tech enterprise in the PRC specializing in information technology, automobile and new energy. During 2012, ZTE, T&W Electronics, Yulong, Wuhan Research Institute of Post & Telecommunications and BYD accounted for 16.1%, 9.7%, 5.6%, 4.2% and 2.9% of our net revenue, respectively.
Our net revenue are subject to seasonal fluctuation and periods of increased demand. All product module sales are typically highest in the fourth quarter of the year due to desire by OEMs to spend remaining budgets allocated for a given period, usually on an annual basis. Net revenue has historically been lowest in the first quarter of the year due to the Chinese New Year holiday and the general reduction in sales following the holiday season. The digital media industry also experiences cyclical fluctuations, as well as fluctuations in how quickly certain new digital media products and technologies are adopted by the market. These sales patterns may not be indicative of future sales performance.
Service Revenue
We provide technology and engineering services, and related training and maintenance services to our customers. We generate revenue when our services are rendered and acknowledged by our customers. Our service revenue is net of business tax.
Cost of Sales
Our cost of sales comprises cost of goods sold and cost of services.
Cost of Goods Sold
Cost of goods sold primarily consists of the purchase of components from suppliers. We develop our customized module design solutions based on specific technology components purchased from suppliers in our target end-markets. Our list of over 30 key suppliers includes Broadcom (integrated circuit and Bluetooth), Sandisk (Flash memory), Freescale Semiconductor (automotive solutions), Atmel (industrial solutions) and Matsushita (switches). We typically make purchases from our suppliers only after we have received customer orders, enabling us to maintain adequate inventory levels and, in turn, minimize risks typically associated with holding excessive inventory. During 2012, based on cost of sales, we purchased approximately 45.7%, 9.6%, 6.9% and 5.8% of the components sold to our customers from Broadcom, Sandisk, Freescale Semiconductor and Atmel and its affiliated entities, respectively. If we lose a key supplier, or a supplier reduces the quantity of products it sells to us, does not maintain a sufficient inventory level of products required by us or is otherwise unable to meet our demands for its components, we may have to expend significant time, effort and other resources to locate a suitable alternative supplier and secure replacement components. Even if we are able to find a replacement supplier, we may be required to redevelop the customized module design solution to effectively incorporate the replacement components.
Cost of Services
Cost of services consists of direct staff costs and other direct related costs for providing engineering and technology services including support and materials.
Operating Expenses
Selling, General and Administrative Expenses
Our selling expenses include expenditures to promote our new module solutions and gain a larger customer base, personnel expenses and travel and entertainment costs related to sales and marketing activities, and freight charges. We expense all these expenditures as they are incurred. Selling expenses are expected to continue to grow in the future as we diversify by developing and acquiring new design capabilities and expanding into new end-markets. Also included in selling expenses is allowance for doubtful accounts.
General and administrative expenses include compensation and benefits for our general and administrative staff, professional fees, amortization of intangible assets, foreign exchange losses and general travel and entertainment costs. We expense all general and administrative expenses as they are incurred. We expect that general and administrative expenses will continue to increase for the foreseeable future as a result of our expected continued growth and the continuing costs of complying with U.S. rules and regulations necessary to maintain our listing in the United States.
Research and Development Expenses
Research and development expenses consist primarily of salaries and related costs of the employees engaged in research, design and development activities; the costs for design and testing; the cost of parts for prototypes; equipment depreciation; and third party development expenses. We expense research and development expenses as they are incurred. As of December 31, 2012, we had approximately 314 engineers and other technical employees engaged in research and development related activities to develop new customized module design solutions targeted at the telecommunications equipment, industrial business and digital media industries. As a result of additional costs incurred in developing new customized module design solutions, research and development expenses were higher in 2012 than they were in 2011, and we expect that our research and development expenses, including those relating to the planned hiring of additional research and development personnel, will increase in the future as we seek to expand our business by developing new customized module design solutions and penetrating new end-markets, and as we seek to grow our engineering services business.
Noncontrolling Interests
Noncontrolling interests consisted of 40% and 30% of the outstanding equity interest in Comtech Digital and Comtech Broadband, respectively. For the year ended December 31, 2012, approximately 62.6% of our total net revenue was generated through Comtech Broadband. Comtech Digital generated 3.5% of our total net revenue for the year 2012.
Taxation
We and our subsidiaries file separate income tax returns.
The United States of America (“U.S.”)
Cogo Maryland was incorporated in the United States, and was subject to United States federal income taxes. On August 4, 2011, Cogo Maryland redomesticated from the State of Maryland, U.S., to the Cayman Islands, through a redomestication merger with and into its indirect wholly owned subsidiary, Cogo Group Cayman, Inc., a company formed on April 12, 2011 under the laws of the Cayman Islands (“Cogo Cayman”). Assuming (as discussed below) that Cogo Cayman will be treated as a U.S. corporation for U.S. federal income tax purposes, Cogo Maryland should not recognize gain or loss as a result of the redomestication merger.
Section 7874(b) of the Code generally provides that a corporation organized outside the United States that acquires, directly or indirectly, pursuant to a plan or series of related transactions, substantially all of the assets of a corporation organized in the United States, will be treated as a U.S. corporation for U.S. federal income tax purposes if (i) the acquiring corporation, together with all corporations connected to it by a chain of greater than 50% ownership by vote and value (the “expanded affiliated group”), does not have substantial business activities in the country in which the acquiring corporation is organized, compared to the total worldwide business activities of the expanded affiliated group, and (ii) shareholders of the acquired corporation, by reason of owning shares of the acquired corporation, own at least 80% of either the voting power or the value of the stock of the acquiring corporation after the acquisition (ignoring for this purpose certain shares of the acquiring corporation held by members of its expanded affiliated group and, pursuant to regulations under Section 7874, counting as shares certain options or warrants). If Section 7874(b) were to apply to the redomestication merger, then Cogo Cayman, as the surviving entity, would be subject to U.S. federal income tax on its worldwide taxable income following the redomestication merger as if it were a U.S. corporation, and Cogo Maryland should not recognize gain (or loss) as a result of the redomestication merger for U.S. federal income tax purposes.
After the completion of the redomestication merger, it was not expected that any shares of Cogo Cayman were held by any member of an expanded affiliated group that includes Cogo Cayman. In addition, after the redomestication merger, as a result of which Cogo Cayman directly acquired all of the assets of the Cogo Maryland, it was expected that the former stockholders of Cogo Maryland (including option or warrant holders treated as owning shares of common stock of Cogo Maryland pursuant to the regulations under Section 7874) should be considered to own, by reason of owning (or being treated as owning) stock of the Cogo Maryland, more than 80% of the voting power and the value of Cogo Cayman’s ordinary shares (including any options or warrants treated as ordinary shares of Cogo Cayman pursuant to the regulations promulgated under Section 7874). Moreover, after the redomestication merger, it was expected that the expanded affiliated group that would include Cogo Cayman would not conduct any substantial business activities in the Cayman Islands as compared to the total worldwide business activities of such expanded affiliated group. Accordingly,we expect that Section 7874(b) should apply and that Cogo Cayman would be treated as a U.S. corporation for U.S. federal income tax purposes. However, due to the absence of full guidance on how the rules of Section 7874(b) would apply to the transactions contemplated by the redomestication merger (and the subsequent operations of Cogo Cayman, as well as members of its expanded affiliated group), this result is not entirely free from doubt. If, for example, Section 7874(b) were determined not to apply to the redomestication merger, and Cogo Cayman were treated as a foreign corporation for U.S. federal income tax purposes as a result of the redomestication merger, then, among other things, Cogo Maryland would be required to recognize gain (but not loss) under Section 367 of the Code equal to the excess, if any, of the fair market value of each of its assets over such asset’s adjusted tax basis at the effective time of the redomestication merger. The balance of this discussion (including the discussion in the section of this Annual Report entitled “Item 10. Additional Information – Taxation – United States Federal Income Taxation”) assumes that we will be treated as a U.S. corporation for U.S. federal income tax purposes.
Cayman Islands and British Virgin Islands
Under the current laws of the Cayman Islands and the British Virgin Islands, our subsidiaries that are incorporated in the Cayman Islands and the British Virgin Islands are not subject to tax on income or capital gains. In addition, upon payments of dividends by these companies, no Cayman Islands or British Virgin Islands withholding tax will be imposed.
Hong Kong
Our subsidiaries that are incorporated in Hong Kong are subject to Hong Kong Profits Tax. The applicable profits tax rate is 16.5% for 2010, 2011 and 2012. The payments of dividends by Hong Kong companies are not subject to any Hong Kong withholding tax.
PRC
On March 16, 2007, the National People’s Congress passed the CIT Law, which revised the PRC statutory income tax rate to 25%. The CIT Law was effective on January 1, 2008. Accordingly, our PRC subsidiaries are subject to income tax at 25% effective from January 1, 2008 unless otherwise specified.
Prior to January 1, 2008, Shenzhen Comtech, Comtech Communication, Comtech Software, Comtech Broadband SZ, Epcot, Huameng PRC and Viewtran PRC (collectively the “Shenzhen Subsidiaries”), being entities located in the Shenzhen Special Economic Zone, were entitled to the preferential tax rate of 15%. In addition, the Shenzhen Subsidiaries, being production oriented foreign investment enterprises, were each entitled to a tax holiday of two-year tax exemption followed by three-year 50% tax reduction starting from the first profit making year from the PRC tax perspective (“2+3 tax holiday”) under the then effective tax regulations.
The CIT law and its relevant regulations provide a five-year transition period from January 1, 2008 for the Shenzhen Subsidiaries which were established before March 16, 2007 and were entitled to preferential lower tax rates under the then effective tax regulations, as well as grandfathering certain tax holidays. The transitional tax rates are 18%, 20%, 22%, 24% and 25% for 2008, 2009, 2010, 2011 and 2012 onwards, respectively.
Certain subsidiaries located in the Shenzhen Special Economic Zone, including Comtech Broadband SZ, Huameng PRC, Mega Sky SZ and Mega Smart SZ, were each granted a 2+3 tax holiday and were subject to income tax at rates ranging from 0% to 12.5% for the year ended December 31, 2012.
As a result of the incentives above, our operations have historically been subject to relatively low tax liabilities, which increase in the near future. See “Item 3. Key Information – Risk Factors – Our financial results benefit from tax concessions granted by the PRC government, the change to or expiration of which would materially change our results of operations.” Our effective tax rate was 10.7%, (8.4)% and 9.5% in 2012, 2011 and 2010, respectively. The negative rate in 2011 was mainly attributed to significant non-deductible items including impairment of goodwill of RMB236.9 million.
Basis of Presentation
On August 4, 2011, we redomesticated from the State of Maryland, U.S., to the Cayman Islands, through a redomestication merger with and into its indirect wholly owned subsidiary, Cogo Cayman, a company formed on April 12, 2011 under the laws of the Cayman Islands. On July 25, 2011, Cogo Cayman changed its name to Cogo Group, Inc. The consolidated financial position, results of operations and cash flows for all periods presented that arose prior to August 4, 2011 relate to those of Cogo Maryland.
In the July 2004 share exchange with Trident, the stockholders of Comtech Cayman received in exchange for our business approximately 91.2% of the then-outstanding common stock of Trident. This share exchange transaction was accounted for as a reverse acquisition in which Comtech Cayman was deemed the accounting acquirer and Trident was deemed the legal acquirer. In connection with the share exchange, we changed our name to Comtech Group, Inc. from Trident. On May 13, 2008, we changed our name to Cogo Group, Inc.
As a result of the share exchange transaction:
| · | the historical financial statements of Trident for periods prior to the date of the share exchange transaction are no longer presented; |
| · | the historical financial statements for periods prior to the date of the transaction are those of Comtech Cayman, as the accounting acquirer; |
| · | all references to the financial statements apply to the historical financial statements of Comtech Cayman prior to the transaction; and |
| · | the number of our ordinary shares have been restated retroactively to reflect the share exchange ratio as of the date of the share exchange transaction. |
In order to exercise control over Shenzhen Comtech (a PRC operating company legally permitted to engage in a commodity trading business), without direct shareholding by us (a U.S.-listed company and therefore a foreign-invested entity), we entered into contractual agreement with Honghui Li, our vice president, and Huimo Chen, the mother of Jeffrey Kang, our chief executive officer, so that we exercise control over Shenzhen Comtech. We also entered into a contractual agreement with Comtech (China) Holding Limited (a subsidiary disposed in November 2012) such that we exercise control over Shanghai Comtech. Shenzhen Comtech and Shanghai Comtech, in turn, jointly own Shanghai E&T.
In accordance with the contractual arrangements as described above, we have exclusive authority over all decision making related to the ongoing, major, or central operations of Shenzhen Comtech and Shanghai Comtech (collectively, the “Subsidiaries held under Deeds”). The relevant rights on decision making are forfeited by the legal shareholders under the legal arrangements. We also have exclusive authority over all decision making related to the total sharing of profit or loss of the Subsidiaries held under Deeds as well as the ability to establish and implement policy for dissolving them. In addition, we have the rights to sell or transfer the shareholding of the Subsidiaries held under Deeds. These rights are forfeited by the legal shareholders under the legal arrangements. We have significant financial interests in the Subsidiaries held under Deeds that provide us with the right to receive income, both as ongoing revenue and as proceeds from the sale of its interests in the Subsidiaries held under Deeds, in an amount that fluctuates based on the performance of the operations of the Subsidiaries held under Deeds and the change in the fair value thereof. Based on the above, in conformity with U.S. GAAP, we have effective ownership and control over the Subsidiaries held under Deeds and, therefore, the financial position and results of operations of the Subsidiaries held under Deeds are consolidated into our consolidated financial statements. For additional details regarding these contractual agreements, see “Item 7. Major Shareholders and Related Party Transactions – Related Party Transactions.”
Critical Accounting Policies and Estimates
The preparation of our consolidated financial statements requires us to make estimates and judgments that affect the reported amounts of our assets, liabilities, revenue and expenses. These estimates are based on our historical experience and on various other assumptions that we believe to be reasonable. Estimates are evaluated on an ongoing basis, but actual results may differ from these estimates.
Critical accounting policies are those that, in management’s view, are most important in the portrayal of our financial condition and results of operations. Those that require significant judgments and estimates include:
Business Combinations. In 2011, we acquired a 100% equity interest in MDC. Prior to 2011, our significant acquisitions included the acquisition of a 70% equity interest in Long Rise, the acquisition of the remaining 45% equity interest in Comtech Broadband, the acquisition of 100% equity interest in Keen Awards which the consideration payable was contingent upon achieving certain agreed earning levels over an agreed measurement period, the acquisition of the 100% equity interest in Viewtran, and the acquisition of the 100% equity interest in Mega Smart.
We have adopted ASC 805,Business Combinations,in connection with the acquisition of MDC in 2011. For our acquisitions, we allocate the cost of an acquired entity to the assets acquired and the liabilities assumed based on their estimated fair value on the date of acquisition. This process is commonly referred to as the purchase price allocation. As part of the purchase price allocation, we are required to determine the fair value of any identifiable intangible assets acquired. The determination of the fair value of the intangible assets acquired involves certain judgments and estimates. These judgments can include, but are not limited to, the cash flows that an asset is expected to generate in the future. A change in the amount allocated to identifiable intangible assets would have an offsetting effect on the amount of goodwill recognized from the acquisition and would change the amount of amortization expense recognized related to those identifiable intangible assets.
The fair values of our identifiable intangible assets were determined by us with inputs from our independent appraisers using mainly the income approach. Future cash flows are predominately based on the historical pricing and expense levels, taking into consideration the relevant market size, growth factors and expected industry growth. The resulting cash flows are then discounted at a rate approximating our weighted average cost of capital.
Valuation of Long-Lived Assets.We assess the impairment of long-lived assets, which include goodwill, identifiable intangible assets, and property and equipment (“P&E”), at least annually for goodwill or whenever events or changes in circumstances indicate that the carrying value may not be recoverable for all long-lived assets. Changes in the underlying business could adversely affect the fair value of the enterprise and intangible asset and P&E asset groups. Important factors which could require an impairment review include: (i) underperformance relative to expected historical or projected future operating results; (ii) changes in the manner of use of the assets or the strategy for our overall business; (iii) negative industry or economic trends; (iv) our enterprise fair value relative to net book value.
Our impairment evaluation of identifiable intangible assets and P&E includes an analysis of estimated future undiscounted net cash flows expected to be generated by the assets over their remaining estimated useful lives. If the estimated future undiscounted net cash flows are insufficient to recover the carrying value of the assets over the remaining estimated useful lives, we record an impairment loss in the amount by which the carrying value of the assets exceeds the fair value. We determine fair value based on either market quotes, if available, or discounted cash flows using a discount rate commensurate with the risk inherent in our current business model for the specific asset being valued. Major factors that influence our cash flow analysis are our estimates for future revenue and expenses associated with the use of the asset. Different estimates could have a significant impact on the results of our evaluation. If, as a result of our analysis, we determine that our amortizable intangible assets or other long-lived assets have been impaired, we will recognize an impairment loss in the period in which the impairment is determined. Any such impairment charge could be significant and could have a material negative effect on our results of operations.
Our impairment evaluation of goodwill was based on comparing the fair value to the carrying value of our reporting units. The reporting units’ fair value was measured using a combination of the market and income approaches. If we fail to deliver new products, if the products fail to gain expected market acceptance, or if market conditions fail to materialize as anticipated, our revenue and cost forecasts may not be achieved and we may incur charges for goodwill impairment, which could be significant and could have a material negative effect on our results of operations. Please refer to “Impairment loss of goodwill” under “Results of operations” below for details of impairment loss of goodwill recorded in 2011.
The net book values of these tangible and intangible long-lived assets at December 31, 2012 and 2011 were as follows:
| | | Years ended December 31, | |
| | | 2012 | | | 2011 | |
| | | Amount (in millions) | |
| Property and equipment, net | | USD | 2.8 | | | RMB | 17.5 | | | RMB | 17.9 | |
| Intangible assets, net | | | 20.7 | | | | 128.8 | | | | 154.1 | |
| | | | | | | | | | | | | |
| Total net book value | | USD | 23.5 | | | RMB | 146.3 | | | RMB | 172.0 | |
Allowance for Doubtful Accounts. We establish an allowance for doubtful accounts primarily based upon the age of receivables and factors surrounding the credit risk of specific customers. We generally do not require collateral or other security from our customers. As of December 31, 2012, our accounts receivable balance was RMB731.8 million (USD117.5 million), net of a RMB26.8 million (USD4.3 million) allowance for doubtful accounts. As our business grows, we expect our accounts receivable balance to increase, as could our allowance for doubtful accounts. If the financial condition of our customers deteriorates, our uncollectible accounts receivable could exceed our current or future allowances.
Share-based Compensation. We applied ASC 718,Compensation—Stock Compensation. ASC 718 requires that all share-based compensation be recognized as an expense in the consolidated financial statements and that such cost be measured at the fair value of the award and requires compensation cost to reflect estimated forfeitures. The determination of the fair value of share-based compensation awards on the date of grant using an option-pricing model is affected by our stock price as well as assumptions regarding a number of complex and subjective variables, including our expected stock price volatility over the term of the awards, actual and projected share option exercise behaviors, risk-free interest rate and expected dividends. Furthermore, we estimate forfeitures at the time of grant and record share-based compensation expense only for those awards that are expected to vest. If actual forfeitures differ from those estimates, we revise the estimates used in subsequent periods which will affect the amount of employee share-based compensation expenses we recognize in our consolidated financial statements. Compensation cost is recognized on a straight line basis over the requisite service period, which is generally the same as the vesting period. Since the adoption of ASC 718, we have only granted equity share unit and performance shares to minimize the level of estimation. Our share-based compensation expense for the years ended December 31, 2012 and 2011 was RMB65.9 million (USD10.6 million) and RMB66.7 million, respectively.
We currently use authorized shares and shares of a subsidiary to satisfy share award exercises.
Write-down for Obsolete Inventories. We record inventory write-downs for estimated obsolescence or unmarketable inventory in an amount equal to the difference between the cost of inventory and its estimated realizable value based upon assumptions about future demand and market conditions. Management records a write-down against inventory based on several factors, including expected sales price of the item and the length of time the item has been in inventory. If actual demand and market conditions are less favorable than those projected by management, additional inventory write-down could be required. In that event, our gross margin would be reduced.
Taxation. We provide for income taxes in accordance with the provisions of ASC 740,Income Taxes. Deferred tax assets and liabilities are recognized consistent with the asset and liability method required by ASC 740. Our deferred tax assets and liabilities primarily result from temporary differences between the amounts recorded in our consolidated financial statements and the tax basis of our assets and liabilities.
At each balance sheet date, we assess the need to establish a valuation allowance that reduces deferred tax assets when it is more likely than not that all, or some portion, of the deferred tax assets will not be realized. A valuation allowance would be based on all available information including our assessment of uncertain tax positions and projections of future taxable income from each tax-paying component in each jurisdiction, principally derived from business plans and available tax planning strategies. The deferred tax asset balance is analyzed regularly by management. Based on these analyses, we have determined that our deferred tax asset is irrecoverable and full valuation allowance is provided as of December 31, 2012. Projections of future taxable income incorporate several assumptions of future business and operations that are apt to differ from actual experience. If, in the future, our assumptions and estimates that resulted in our forecast of future taxable income for each tax-paying component prove to be incorrect, the valuation allowance against our deferred tax asset may be adjusted.
We adopted the provisions of ASC 740-10-25 and as a result, we apply a more likely than not recognition threshold for all tax uncertainties. ASC 740-10-25 only allows the recognition of those tax benefits that have a greater than 50% likelihood of being sustained upon examination by the taxing authorities. As of December 31, 2012, all uncertain tax positions were considered to be more likely than not to be sustained upon examination by the relevant authorities. If, in the future, our assumptions and estimates that resulted in the determination of sustainability prove to be incorrect, a tax expense adjustment may be necessary.
Results of Operations
Year ended December 31, 2012 compared to year ended December 31, 2011
Net Revenue.Total net revenue increased by RMB1,336.2 million (USD214.5 million), or 37.6%, in 2012 when compared to 2011. The increase was mainly due to the continued expansion in the Telecommunications equipment and Industrial business end-markets.
Product Sales
Details of product sales by product type for the years ended December 31, 2012 and 2011 were as follows:
| | | Years ended December 31, | |
| | | 2012 | | | 2011 | | | | |
| | | | | | | | | % of Net | | | | | | % of Net | | | % | |
| | | Amount | | | Revenue | | | Amount | | | Revenue | | | Change | |
| | | (in millions, except for percentages) | |
| Digital media | | USD | 297.2 | | | RMB | 1,851.6 | | | | 37.9 | % | | RMB | 1,503.1 | | | | 42.3 | % | | | 23.2 | % |
| Telecommunications equipment | | | 346.9 | | | | 2,161.4 | | | | 44.2 | % | | | 1,318.2 | | | | 37.1 | % | | | 64.0 | % |
| Industrial business | | | 140.9 | | | | 877.6 | | | | 17.9 | % | | | 733.1 | | | | 20.6 | % | | | 19.7 | % |
| Total product sales | | USD | 785.0 | | | RMB | 4,890.6 | | | | 100.0 | % | | RMB | 3,554.4 | | | | 100.0 | % | | | 37.6 | % |
Product sales for the year ended 2012 was RMB4,890.6 million (USD785.0 million), or RMB1,336.2 million (USD214.5 million) higher than the year ended 2011. Digital media related sales increased by RMB348.5 million (USD55.9 million), or 23.2%, telecommunications equipment related sales increased by RMB843.2 million (USD135.3 million), or 64.0%, and industrial business related sales increased by RMB144.5 million (USD23.2 million), or 19.7%. The increase in product sales was mainly attributable to the increase in sales in the telecommunications equipment end-market resulting from the increase in investments in the 3G telecommunications infrastructure in the PRC. It was also attributable to the Group’s continued effort and strategic focus in the expansion of the industrial business end-market, the increased sales volume as a result of growing demand from some existing customers such as T&W Electronics and Yulong, and promising new lines of business such as automotive, HDTV, smart meters, smart grid and 3G handset access. The sale of medical equipment and components of the smart grid business resulting from the acquisition of MDC also contributed to the increase. The contribution to total net revenue by digital media sales in 2012 increased to RMB1,851.6 million (USD297.2 million), or 37.9% of total net revenue, from RMB1,503.1 million, or 42.3% of total net revenue in 2011. The contribution to total net revenue by telecommunications equipment sales in 2012 increased to RMB2,161.4 million (USD346.9 million), or 44.2% of total net revenue, from RMB1,318.2 million, or 37.1% of total net revenue in 2011. The contribution to total net revenue by industrial business sales increased, from RMB733.1 million or 20.6% in 2011, to RMB877.6 million (USD140.9 million) or 17.9% of total net revenue in 2012.
The continued revenue growth across all of the end markets was also attributable to an increase in our customer base, particularly the small and medium enterprises (“SME”). For the year ended December 31, 2012, the Group had more than 2,000 customers, of which more than 90% represented SME customers.
Gross Profit. Gross profit was RMB323.8 million (USD52.0 million) in 2012, a decrease of RMB73.6 million (USD11.8 million), or 18.5%, when compared to RMB397.4 million in 2011. Gross margin was 6.6% in 2012, compared to 11.2 % in 2011. The decrease in gross profit and gross margin are primarily attributable to change in revenue mix, of which the digital media and telecommunications equipment end-markets related sales had a relatively lower margin.
Selling, General, Administrative, Research & Development (“R&D”) Expenses and provision for doubtful accounts.Selling, general and administrative, R&D expenses, provision for doubtful accounts, impairment loss of goodwill and intangible assets were RMB260.9 million (USD41.9 million) for the year ended December 31, 2012, or 50.7% lower than those of the prior year. The expenses for the years ended December 31, 2012 and 2011 were as follows:
| | | Years ended December 31, | |
| | | 2012 | | | 2011 | |
| | | | | | % of Net | | | | | | % of Net | |
| | | Amount | | | Revenue | | | Amount | | | Revenue | |
| | | (in millions, except for percentages) | |
| Selling expenses | | USD | 7.7 | | | RMB | 48.1 | | | | 1.0 | % | | RMB | 64.9 | | | | 1.8 | % |
| General and administrative expenses | | | 17.7 | | | | 110.3 | | | | 2.2 | % | | | 123.3 | | | | 3.4 | |
| R&D expenses | | | 16.5 | | | | 102.5 | | | | 2.1 | % | | | 101.6 | | | | 2.9 | |
| Provision for doubtful accounts | | | — | | | | — | | | | — | | | | 2.3 | | | | 0.1 | |
| Impairment loss of goodwill | | | — | | | | — | | | | — | | | | 236.9 | | | | 6.7 | |
| | | | | | | | | | | | | | | | | | | | | |
| Total | | USD | 41.9 | | | RMB | 260.9 | | | | 5.3 | % | | RMB | 529.0 | | | | 14.9 | % |
Selling, General and Administrative Expenses.The decrease in selling expenses in 2012 of RMB16.8 million (USD2.7 million), or 25.9%, was mainly attributable to the reduced staff within the sales team.
The decrease in general and administrative expenses of RMB13.0 million (USD2.1 million), or 10.5%, was primarily attributable to the share-based compensation cost of RMB16.5 million (USD2.6 million), as compared to share-based compensation cost of RMB22.1 million for the same period of 2011. The decrease in general and administrative expenses was also contributed by the decrease in amortization of intangible assets from RMB28.6 million in 2011 to RMB25.3 million (USD4.1 million).
R&D Expenses. R&D expenses increased in 2012 by RMB0.9 million (USD0.1 million), or 0.9%, as compared to 2011. The increase was primarily attributable to increase in share-based compensation cost of RMB5.7 million (USD0.9 million), partly offset by the decrease in staff salaries, as a result of reduced R&D personnel and engineers.
Provision for Doubtful Accounts. No additional charge against doubtful accounts was made in 2012, as compared to RMB2.3 million made in 2011. Management assessed that no additional charge of doubtful accounts is required in 2012.
Impairment loss of goodwill.During 2011, as a result of the continued significant decline in the price of the Company’s shares of common stock, the Company’s aggregate market value was significantly lower than the aggregate carrying value of the Company’s reporting units. Accordingly, the Company determined that the carrying amounts of goodwill exceeded their respective implied fair values of nil and recorded a goodwill impairment charge of RMB236.9 million in 2011. There was no impairment loss of other long-lived assets in 2012.
Interest Expense.Interest expense increased in 2012 by RMB5.9 million (USD0.9 million) or 29.4%, as compared to 2011. The increase in interest expense was attributable to an increase in the average bank borrowing balances and the increase in average interest rate as compared to 2011.
Interest Income. Interest income in 2012 amounted to RMB13.7 million (USD2.2 million), compared to RMB14.9 million in 2011. The decrease by RMB1.2 million (USD0.2 million) was mainly attributable to a decrease in average term deposit as compared to 2011.
Income Tax. The effective tax rate for 2012 was 10.7% compared to (8.4)% for 2011.The negative rate in 2011 was mainly attributed to significant non-deductible items including impairment of goodwill of RMB236.9 million.
Noncontrolling Interests.Noncontrolling interests consisted of 30% and 40% of the outstanding equity interest in Comtech Broadband and Comtech Digital. For the year ended December 31, 2012, net income attributable to noncontrolling interests amounted to RMB24.6 million (USD3.9 million).
Net Income/(Loss) and Earnings/(Loss) Per Share attributable to Cogo Group, Inc. As a result of the above items, net income attributable to Cogo Group, Inc. for 2012 was RMB24.1 million (USD3.9 million), compared to net loss attributable to Cogo Group, Inc. of RMB156.6 million in 2011. We reported basic and diluted per share earnings of RMB0.66 (USD0.11) and RMB0.66 (USD0.11) for 2012, based on 36,355,124 and 36,488,041 outstanding weighted average shares, respectively, compared to basic and diluted per share loss of RMB4.22 for 2011, based on 37,094,995 outstanding weighted average shares.
Year ended December 31, 2011 compared to year ended December 31, 2010
Net Revenue.Total net revenue increased by RMB964.9 million, or 37.3%, in 2011 when compared to 2010. The increase was mainly due to the continued expansion in the Telecommunications equipment and Industrial business end-markets.
Product Sales
Details of product sales by product type for the years ended December 31, 2011 and 2010 were as follows:
| | | Years ended December 31, | |
| | | 2011 | | | 2010 | | | | |
| | | (in millions, except for percentage) | |
| | | Amount | | | % of Net
Revenue | | | Amount | | | % of Net
Revenue | | | % Change | |
| Digital Media | | RMB | 1,503.1 | | | | 42.3 | % | | RMB | 1,474.3 | | | | 57.0 | % | | | 2.0 | % |
| Telecommunications equipment | | | 1,318.2 | | | | 37.1 | | | | 630.1 | | | | 24.3 | | | | 109.2 | |
| Industrial business | | | 733.1 | | | | 20.6 | | | | 450.6 | | | | 17.4 | | | | 62.7 | |
| | | | | | | | | | | | | | | | | | | | | |
| Total product sales | | RMB | 3,554.4 | | | | 100.0 | % | | RMB | 2,555.0 | | | | 98.7 | % | | | 39.1 | % |
Product sales for the year ended 2011 was RMB3,554.4 million, or RMB999.4 million higher than the year ended 2010. Digital media related sales increased by RMB28.8 million, or 2%, telecommunications equipment related sales increased by RMB688.1 million, or 109.2%, and industrial business related sales increased by RMB282.5 million, or 62.7%. The increase in product sales was mainly attributable to the increase in sales in the telecommunications equipment end-market resulting from the increase in investments in the 3G telecommunications infrastructure in the PRC. It was also attributable to the Group’s continued effort and strategic focus in the expansion of the industrial business end-market, the increased sales volume as a result of growing demand from some existing customers such as ZTE and T&W Electronics, and promising new lines of business such as automotive, HDTV, smart meters, smart grid and 3G handset access. The sale of medical equipment and components of the smart grid business resulting from the acquisition of MDC also contributed to the increase. The contribution to total net revenue by digital media sales in 2011 increased to RMB1,503.1 million, or 42.3% of total net revenue, from RMB1,474.3 million, or 57.0% of total net revenue in 2010. The contribution to total net revenue by telecommunications equipment sales in 2011 increased to RMB1,318.2 million, or 37.1% of total net revenue, from RMB630.1 million, or 24.3% of total net revenue in 2010. The contribution to total net revenue by industrial business sales increased, from RMB450.6 million or 17.4% in 2010, to RMB733.1 million or 20.6% in 2011.
Service Revenue. Service revenue for the years ended December 31, 2011 and 2010 were as follows:
| | | Years ended December 31, | |
| | | 2011 | | | 2011 | | | 2010 | | | 2010 | |
| | | Amount | | | % of Net
Revenue | | | Amount | | | % of Net
Revenue | |
| | | (in millions, except for percentages) | |
| Service revenue | | | | | | RMB | — | | | | — | % | | RMB | 34.5 | | | | 1.3 | % |
Service revenue was derived from the provision of technology and engineering services, software design, network system integration and related training and maintenance services. The decrease of RMB34.5 million for the year ended December 31, 2011, as compared to same period of 2010, was due tono longer providing services, revenue and focusing on the fast-growing telecommunications equipment and industrial business end-markets in the year ended December 31, 2011.
Gross Profit. Gross profit was RMB397.4 million in 2011, an increase of RMB30.8 million, or 8.4%, when compared to RMB366.6 million in 2010. Gross margin was 11.2% in 2011, compared to 14.2% in 2010. The increase in gross profit is consistent with the increase in sales due to the continued expansion in all end-markets during the year. The decrease in gross margin is primarily attributable to change in revenue mix, of which the digital media and telecommunications equipment end-markets related sales had a relatively lower margin.
Selling, General, Administrative, Research & Development (“R&D”) Expenses and provision for doubtful accounts.Selling, general and administrative, R&D expenses, provision for doubtful accounts, impairment loss of goodwill and intangible assets were RMB529.0 million for the year ended December 31, 2011, or 113.7% higher than those of the prior year. The expenses for the years ended December 31, 2011 and 2010 were as follows:
| | | Years ended December 31, | |
| | | 2011 | | | 2010 | |
| | | (in millions, except for percentages) | |
| | | Amount | | | % of Net
Revenue | | | Amount | | | % of Net
Revenue | |
| Selling expenses | | RMB | 64.9 | | | | 1.8 | % | | RMB | 45.4 | | | | 1.8 | % |
| General and administrative expenses | | | 123.3 | | | | 3.4 | | | | 146.5 | | | | 5.6 | |
| R&D expenses | | | 101.6 | | | | 2.9 | | | | 77.9 | | | | 3.0 | |
| Allowance for doubtful accounts | | | 2.3 | | | | 0.1 | | | | — | | | | — | |
| Net gain on settlement relating to the acquisition of Long Rise before goodwill impairment | | | — | | | | — | | | | (43.7 | ) | | | (1.7 | ) |
| Impairment loss of goodwill | | | 236.9 | | | | 6.7 | | | | 21.4 | | | | 0.8 | |
| | | | | | | | | | | | | | | | | |
| Total | | RMB | 529.0 | | | | 14.9 | % | | RMB | 247.5 | | | | 9.5 | % |
Selling, General and Administrative Expenses.The increase in selling expenses in 2011 of RMB19.5 million, or 43.0%, was mainly attributable to the increased staff within the sales team and the effects of salaryincreases in 2011 which led to increase in staff related cost. Increased expenditures on other indirect selling expenses such as product logistics, traveling and promotion expenses as a result of increased volume of sales transactions also contributed to the increase in selling expenses.
The decrease in general and administrative expenses of RMB23.2 million, or 15.8%, was primarily attributable to share-based compensation cost of RMB22.1 million, as compared to share-based compensation cost of RMB61.5 million for the same period of 2010. The decrease in general and administrative expenses was also offset in part by an increase in other general and administrative expenses such as staff cost and office rental due to an increase in headcount as a result of our expansion in industrial business end-market and the acquisition of MDC in January 2011.
R&D Expenses. R&D expenses increased in 2011 by RMB23.7 million, or 30.4%, as compared to 2010. The increase was primarily attributable to the increase in staff cost, including the increase in share-based compensation cost of RMB4.7 million, as a result of additional R&D personnel and engineers, and research expenditures for potential new markets, such as industrial business.
Allowance for Doubtful Accounts. Additional charge against doubtful accounts of RMB2.3 million was made in 2011, as compared to RMB0.002 million made in 2010. The additional charge of doubtful accounts was due to certain receivable balance being overdue in which the assessment of recoverability is remote.
Impairment loss of goodwill.As a result of the continued significant decline in the price of the Company’s shares of common stock in 2011, the Company’s aggregate market value was significantly lower than the aggregate carrying value of the Company’s reporting units. Accordingly, the Company determined that the carrying amounts of goodwill exceeded their respective implied fair values of nil and recorded a goodwill impairment charge of RMB236.9 million. The goodwill impairment charge did not impact debt covenants compliance under the Company’s existing credit facility.
Interest Expense.Interest expense increased in 2011 by RMB10.7 million or 114.2%, as compared to 2010. The increase in interest expense was attributable to an increase in the average bank borrowing balances.
Interest Income. Interest income in 2011 amounted to RMB14.9 million, compared to RMB14.7 million in 2010. The increase by RMB0.2 million was mainly attributable to an increase in average term deposit as compared to 2010.
Income Tax. The effective tax rate for 2011 was (8.4)% compared to 9.5% for 2010. The income tax expense for 2011 was attributedto significant non-deductible items including impairment of goodwill of RMB236.9 million, offset by the transitional tax rates under the PRC CIT law of 22% in 2010and24% in 2011 and the expiry of tax holiday for certain Shenzhen subsidiaries.
Noncontrolling Interests.Noncontrolling interests consisted of 30% and 40% of the outstanding equity interest in Comtech Broadband and Comtech Digital. For the year ended December 31, 2011, net income attributable to noncontrolling interests amounted to RMB7.4 million.
Net Income/(Loss) and Earnings/(Loss) Per Share attributable to Cogo Group, Inc. As a result of the above items, net loss attributable to Cogo Group, Inc. for 2011 was RMB156.6 million, compared to net income attributable to Cogo Group, Inc. of RMB112.4 million in 2010. We reported basic and diluted per share loss of RMB4.22 for 2011, based on 37,094,995 outstanding weighted average shares, compared to basic per share earnings of RMB3.01 for 2010, based on 37,275,427 outstanding weighted average shares, and a diluted per share earnings of RMB2.94, based on 38,188,814 outstanding weighted average shares.
Quarterly Results of Operations
The following table presents our supplemental selected unaudited quarterly results of operations for the eight quarters prior to and including the quarter ended December 31, 2012. You should read the following table in conjunction with our audited consolidated financial statements and related notes contained elsewhere in this Annual Report. In our management’s opinion, we have prepared our unaudited quarterly results of operations on substantially the same basis as our audited consolidated financial statements. Due to the evolving nature of our business and other factors affecting our business as described under “Item 3D. Risk Factors,” our results of operations for any quarter are not necessarily indicative of results that may be expected for any future periods.
| | | For the three months ended, | |
| | | Dec 31, | | | Sept 30, | | | June 30, | | | Mar 31, | | | Dec 31, | | | Sept 30, | | | June 30, | | | Mar 31, | |
| | | 2012 | | | 2012 | | | 2012 | | | 2012 | | | 2011 | | | 2011 | | | 2011 | | | 2011 | |
| | | (in millions of RMB, except per share data) | |
| Net revenue | | | 1,238.7 | | | | 1,360.3 | | | | 1,225.2 | | | | 1,066.4 | | | | 1,066.8 | | | | 933.9 | | | | 869.9 | | | | 683.8 | |
| Gross profit | | | 79.2 | | | | 84.9 | | | | 87.4 | | | | 72.3 | | | | 96.6 | | | | 96.7 | | | | 107.0 | | | | 97.1 | |
| Net income / (loss) attributable to Cogo Group Inc. | | | 1.5 | | | | 3.3 | | | | 11.4 | | | | 7.9 | | | | (225.3 | ) | | | 14.6 | | | | 27.0 | | | | 27.1 | |
| Earnings per share | | | | | | | | | | | | | | | | | | | | | | | | | | | | | | | | |
| Basic | | | 0.04 | | | | 0.09 | | | | 0.31 | | | | 0.22 | | | | (6.26 | ) | | | 0.40 | | | | 0.71 | | | | 0.71 | |
| Diluted | | | 0.04 | | | | 0.09 | | | | 0.31 | | | | 0.22 | | | | (6.26 | ) | | | 0.40 | | | | 0.70 | | | | 0.69 | |
The overall increase in our net revenue over the past two years was consistent with: (1) the Group’s continued effect and strategic focus in the expansion of the industrial business end-market; and (2) a wider variety of products (due to the various acquisitions made since 2006 which brought new businesses to the Group) generating revenue.
Analysis for 2012
The gradual increase in gross profit in the first half of 2012 was primarily attributable to an increase in industrial business related sales and increased sales volume for mobile handset and telecommunications equipment products. As a result of reduced selling price and change in revenue mix, gross profit was decreased in the latter half of 2012.
Potential Impact of the Sale of Certain Subsidiaries to Envision
For the year ended December 31, 2012, 2011 and 2010, the Disposal Group contributed approximately 28%, 33% and 35%, respectively, of our net sales. The impact from the disposal of certain subsidiaries was insignificant in 2012 results but it is expected to impact our operating results significantly from 2013 onwards.
Recently Issued Accounting Pronouncements
Accounting Standards Update (“ASU”) 2011-11, an update to ASC 210, Balance sheet
In December 2011, the Financial Accounting Standards Board (“FASB”) issued ASU 2011-11, an update to ASC 210, Balance Sheet - Disclosures about Offsetting Assets and Liabilities. The FASB issued this ASU in conjunction with the International Accounting Standards Board’s (“IASB”) issuance of amendments to Disclosures – Offsetting Financial Assets and Financial Liabilities (Amendments to International Financial Reporting Standards (“IFRS”) 7). ASU 2011-11 requires disclosures to allow investors to better compare financial statements prepared under U.S. GAAP with financial statements prepared under IFRS while retaining the existing offsetting models under U.S. GAAP and IFRS. For the Company, ASU 2010-11 is effective for annual periods beginning January 1, 2013 and interim periods within those annual periods. Retrospective application is required. Since this standard impacts disclosure requirements only, its adoption will not have a material impact on our Company’s consolidated results of operations or financial condition.
ASU 2011-05, an update to ASC 220, Comprehensive Income
In June 2011, the FASB issued ASU 2011-05, an update to ASC 220, Comprehensive Income - Presentation of Comprehensive Income. ASU 2011-05 increases the prominence of other comprehensive income in financial statements. ASU 2011-05 permits entity to present the components of net income and comprehensive income in either one or two consecutive financial statements and eliminates the option in U.S. GAAP to present other comprehensive income in the statement of changes in equity. For the Company, ASU 2011-05 is effective for fiscal years, and interim periods within those years beginning after December 15, 2011. Retrospective application is required and early adoption is permitted. On October 21, 2011 the FASB decided to propose a deferral of the requirement to present reclassifications of other comprehensive income on the face of the income statement and on February 5, 2013, the FASB finalized this requirement for public entities beginning after December 15, 2012. Since the standard impacts presentation and disclosure requirements only, the adoption of this requirement did not have any material impact on our Company’s consolidated results of operations or financial condition.
Liquidity and Capital Resources
Cash Flows and Working capital
Our accounts payable cycle typically averages approximately ten days, whereas our receivables cycle typically averages approximately three to four months. Accordingly, additional working capital, being current assets less current liabilities, is needed to fund this timing difference.
As of December 31, 2012, we had no material commitments for capital expenditures.
As of December 31, 2012, we had approximately RMB324.8 million (USD52.1 million) in cash. We regularly review our cash funding requirements and attempt to meet those requirements through a combination of cash on hand, cash provided by operations, available borrowings under bank lines of credit and factoring facilities and possible future public or private equity offerings. At times, we may evaluate possible acquisitions of, or investments in, businesses that are complementary to ours, which may require the use of cash. We believe that our cash, increased operating cash flows, credit arrangements, and access to equity and debt capital markets, taken together, provide adequate resources to fund our ongoing operating expenditures for the next 12 months. In the event that they do not, we may require additional funds in the future to support our working capital requirements or for other purposes and may seek to raise such additional funds through the sale of public or private equity, as well as from other sources.
As of December 31, 2012, we had working capital of RMB1,465.4 million (USD235.2 million), including RMB324.8 million (USD52.1 million) in cash, as compared with working capital of RMB1,352.3 million including RMB572.4 million in cash as of December 31, 2011.
Operating activities used cash in the amount of RMB240.8 million (USD38.7 million) for the year ended December 31, 2012, compared to cash used of RMB147.1 million for the year ended December 31, 2011. The increase in cash used in operating activities for 2012 was primarily due to increase in purchase of inventory as sales increased in 2012. For the year ended December 31, 2011, operating activities used cash of RMB147.1 million, compared to cash used of RMB22.3 million for the year ended December 31, 2010, was primarily due to an increase in accounts receivables as sales increased in the fourth quarter of 2011 which had not been settled as of year-end.
Investing activities used cash in the amount of RMB90.1 million (USD14.5 million) during 2012, mainly for increase in pledged bank deposit of RMB127.4 million (USD20.4 million) and purchases of property and equipment of RMB8.2 million (USD1.3 million), offset by the proceeds from sale of subsidiaries, net of cash disposed of RMB42.7 million (USD6.9 million). Investing activities used RMB264.4 million during 2011, mainly for increases in pledged bank deposits of RMB113.9 million, payments for the acquisition of subsidiaries, net of cash acquired, of RMB140.4 million and purchases of property and equipment of RMB10.0 million.
Financing activities provided cash in the amount of RMB85.7 million (USD13.8 million) during 2012, primarily attributable to net proceeds from bank borrowings of RMB134.7 million (USD21.6 million), partly offset by purchase of treasury stock of RMB49.2 million (USD7.9 million). Financing activities provided cash of RMB288.3 million during 2011, primarily attributable to net proceeds from bank borrowings of RMB381.8 million, partly offset by purchase of treasury stock of RMB93.5 million.
Distributions by our PRC operating companies to us may be subject to governmental approval and taxation. Any transfer of funds from us to our PRC operating companies, either as a shareholder loan or as an increase in registered capital, is subject to registration or approval with or by PRC governmental authorities, including the relevant administration of foreign exchange and/or other relevant examining and approval authorities. These limitations on the free flow of funds between us and our PRC operating companies may restrict our ability to act in response to changing market conditions. To date, none of our PRC operating companies, including Shenzhen Comtech and Shanghai E&T, have declared or paid dividends to us, and historically, we have not relied on such distributions for our liquidity needs. In addition, we have not declared dividends since the share exchange transaction. Our holding companies have no business operations and therefore the related expenses are relatively low, consisting mainly of legal, accounting and other fees and expenses associated with being a holding company or, in the case of Cogo Group, Inc., a public company. Our major operating companies, Comtech Broadband, Comtech Industrial and Comtech Digital, Hong Kong incorporated companies, and Shenzhen Comtech, Shanghai Comtech, Shanghai E&T and Viewtran, wholly owned foreign enterprises, are legally permitted to declare and pay dividends, enabling them to provide any funds necessary to meet the holding companies’ limited operating expenses, although in the case of a wholly owned foreign enterprise, such dividends would be subject to the conditions described in “Item 3. Key Information – Risk Factors—PRC laws and our corporate structure may restrict our ability to receive dividend payments from, and transfer funds to, our PRC operating companies, which may negatively affect our results of operations and restrict our ability to act in response to changing market conditions.” We do not expect restrictions between us and our PRC operating companies to affect our liquidity and capital resources in the near future. For risks associated with the uncertainty in our receipt of the equivalent economic interest in connection with the equity interest in Shenzhen Comtech, see “Item 3. Key Information – Risk Factors—PRC laws and our corporate structure may restrict our ability to receive dividends and payments from, and transfer funds to, our PRC operating companies, which may negatively affect our results of operations and restrict our ability to act in response to changing market conditions.”
Our PRC operating companies are required, where applicable, to allocate a portion of their net profit to certain funds before distributing dividends, including at least 10% of their net profit to certain reserve funds until the balance of such fund has reached 50% of their registered capital. These reserves can only be used for specific purposes, including making-up cumulative losses of previous years, conversion to equity capital, and application to business expansion, and are not distributable as dividends. Any amount of funds outside of the 50% reserve balance can be distributed as by the relevant PRC subsidiaries, as advances or cash dividends, subject however, to complying with applicable requirements. Such dividend or loans could take a considerable amount of time to implement and to be processed by certain governmental agencies. Any amount of funds outside of the 50% reserve balance can be distributed as by the relevant PRC subsidiaries, as advances or cash dividends, subject however, to complying with applicable requirements. Such dividend or loans could take a considerable amount of time to implement and to be processed by certain governmental agencies.
Our PRC operating subsidiaries are required, where applicable, to allocate an additional 5% to 10% of their net profits to a statutory common welfare fund. These reserves can only be used for specific purposes and are not distributable as dividends. For risks associated with the uncertainty in our receipt of the equivalent economic interest in connection with the equity interest in Shenzhen Comtech or Shanghai E&T, see “Item 3. Key Information – Risk Factors—PRC laws and our corporate structure may restrict our ability to receive dividends and payments from, and transfer funds to, our PRC operating companies, which may negatively affect our results of operations and restrict our ability to act in response to changing market conditions.”
Indebtedness
We have entered into several banking facilities with Standard Chartered Bank (Hong Kong) Limited (“SCB”), Bank of China (Hong Kong) Limited (“BOC”), Guangdong Development Bank Holdings Company Limited (“GDB”), the Hongkong and Shanghai Banking Corporation Limited (“HSBC”) and Citibank N.A. Hong Kong (“CITI”). These facilities include letters of guarantee, bank loans and irrevocable letters of credit. The banking facility with BOC also included an accounts receivable factoring agreement as discussed below.
Our banking facilities contain the general clause that the banks may at any time without prior notice modify, cancel or suspend the facilities at their sole discretions including, without limitation, canceling any unutilized facilities, and declaring any outstanding amount to be immediately due and payable.
Our banking facilities contain various covenants, including our consolidated net borrowing ratio not exceeding 0.25 times and our Company maintaining a tangible net worth of not less than USD160.0 million (equivalent to RMB996.8 million as of December 31, 2012). Other conditions include our Company’s Chief Executive Officer remaining as the single largest beneficial owner of our Company and Chairman of the Board of Directors and actively involving in the management of our Company and our Company remaining as listed in NASDAQ and retaining at least 50% equity interest in these subsidiaries which entered into the banking facilities with the banks. As of December 31, 2012, a non-financial covenant in one of the Group’s banking facilities has not been satisfied due to the disposal of subsidiaries as disclosed in “Item 4. Information on the Company – Sale of Certain Subsidiaries to Envision”. The Group is in the process of finalizing with the relevant bank on a revised banking facility and management believes that this matter will be satisfactorily resolved.
As stipulated in the Envision Agreement and the Service Agreement, after the disposal of certain subsidiaries to Envision on November 15, 2012, guarantees to banking institutions among our remaining subsidiaries and the Disposal Group will be maintained for a transitional period through December 31, 2014. As of December 31, 2012 and 2011, the aggregate credit limit of banking facilities granted solely to us amounted to RMB934.5 million (USD150.0 million) and RMB1,431.9 million, respectively. As of December 31, 2012, the aggregate credit limit of joint banking facilities granted which can be utilized by us and the Disposal Group (“Joint Banking Facilities”) amounted to RMB595.0 million (USD95.5 million). As of December 31, 2012, the aggregate credit limit of banking facilities granted solely to the Disposal Group, guaranteed by us (“Guaranteed Facilities For the Disposal Group”), amounted to RMB311.5 million (USD50.0 million).
As of December 31, 2012 and 2011, our total outstanding bank borrowings amounted to RMB614.0 million (USD98.6 million) and RMB854.2 million, respectively. Of the amounts outstanding as of December 31, 2012, loan totalling RMB312.8 million (USD50.2 millions) were borrowed under the Joint Banking Facilities and RMB43.6 million (USD7.0 million) were secured by the pledged deposits of the Disposal Group as of December 31, 2012. The weighted average interest rate on outstanding bank borrowings of the Group as of December 31, 2012 was 2.1% (2011: 2.2%).
As of December 31, 2012, the total outstanding bank borrowings of the Disposal Group amounted to RMB443.9 million (USD71.2 million). Of that amount, loans totalling RMB200.9 million (USD32.2 million) were borrowed under the Joint Banking Facilities and loans totalling RMB243.0 million (USD39.0 million) were borrowed under the Guaranteed Facilities For the Disposal Group.
The aggregate amount of funds secured by us as pledged deposits with the respective banks as of December 31, 2012 and 2011 amounted to RMB556.9 million (USD89.4 million), and RMB431.7 million, respectively. Of which, RMB286.7 million (USD46.0 million) and RMB207.9 million (USD33.4 million) were pledged for Joint Banking Facilities and Guaranteed Facilities For the Disposal Group, respectively, as of December 31, 2012. The remaining pledged deposits were pledged for the banking facilities granted solely to us.
The aggregate amount of funds secured by the Disposal Group as pledged deposits with the respective banks as of December 31, 2012 amounted to RMB206.5 million (USD33.1 million), of which RMB124.6 million (USD20.0 million) was pledged for Joint Banking Facilities and RMB81.9 million (USD13.1 million) was pledged for Guaranteed Facilities For the Disposal Group and a facility granted to us as of December 31, 2012.
As of December 31, 2012 and 2011, the aggregate amount of unutilized banking facilities (including the unutilized facility amount under the accounts receivable factoring agreement with BOC) granted solely to us amounted to RMB355.0 million (USD57.0 million) and RMB318.3 million, respectively. As of December 31, 2012, the aggregate amount of unutilized Joint Banking Facilities amounted to RMB81.3 million (USD13.1 million). As of December 31, 2012, the aggregate amount of unutilized Guaranteed Facilities For the Disposal Group amounted to RMB68.5 million (USD11.0 million).
In 2010, we entered into a factoring agreement with BOC in which certain accounts receivable were transferred with recourse to BOC. Under the factoring agreement, BOC pays an amount net of discount to us and collects the factored accounts receivable balances directly from customers. The discount costs 2.7% to 3.4% of the balance transferred and is included in “interest expense”. For the years ended December 31, 2012 and 2011, we received proceeds from the sale of accounts receivable amounting to RMB677.4 million (USD108.7 million) and RMB660.2 million, respectively.
Some of our customers enter into arrangements with their respective banks for purposes of settling their bills. Under such arrangements, we were entitled to collect the amounts owed directly from the customers’ banks when the invoice becomes due. During the year ended December 31, 2011, we transferred with recourse certain of our bills receivable to banks. Under this discounting arrangement, the bank paid a discounted amount to us and collects the amounts owed from the customers’ banks. For the year ended December 31, 2011, we received proceeds, net of discount, from the sale of bills receivable amounting to RMB51.7 million. We did not discount any bills receivable during the year ended December 31, 2012.
Contractual Obligations and Commercial Commitments
The following table sets forth our contractual payment obligations for operating leases and purchase obligations as of December 31, 2012:
| | | Payments due by Period | |
| | | Total | | | Less than
1 year | | | 1-3 years | | | 3-5 years | | | More than
5 years | |
| | | (in millions of RMB) | |
| Operating lease obligations | | | 5.9 | | | | 5.2 | | | | 0.7 | | | | — | | | | — | |
| Purchase obligations | | | 678.5 | | | | 678.5 | | | | — | | | | — | | | | — | |
| | | | | | | | | | | | | | | | | | | | | |
| Total | | | 684.4 | | | | 683.7 | | | | 0.7 | | | | — | | | | — | |
Operating lease obligations consist primarily of operating lease agreements for our office facilities, including our head office and research center in Shenzhen. Our leases have remaining terms ranging from 3 to 18 months.
Purchase obligations consist of outstanding purchase orders for components from our suppliers. We do not have any minimum purchase obligations with these suppliers.
Commitment to Complete the Acquisition on Goldshare Holdings Limited (“Goldshare”)
On April 1, 2011, we entered into a note subscription and share purchase agreement to acquire 3,142,857 shares (representing 44% of the outstanding shares) of Goldshare for a cash consideration of RMB22.0 million; and to subscribe to a convertible note to be issued by Goldshare for RMB20.0 million. The note can be convertible into 2,857,143 new shares of Goldshare at the option of the Company. If we exercises the conversion option of the convertible note, we will hold a total of 60% of the outstanding shares of Goldshare and Goldshare will become our subsidiary. We have not completed the acquisition of Goldshare because certain closing conditions, including the condition that required Goldshare to provide detailed monthly operation plan for a twelve-month period to our reasonable satisfaction, had not yet been fulfilled.
Goldshare engages in the business of distribution of chassis, capacitors, resistors and enclosures with most of its operations in the PRC. The purchase consideration will be contingently payable at various dates upon achieving certain agreed future earnings levels of Goldshare. As of December 31, 2012, we have advanced RMB26.0 million (USD4.2 million) to Goldshare in connection with this acquisition.
Off-Balance Sheet Arrangements
Apart from the factoring of accounts receivable and discounting of bills receivable discussed under “Indebtedness” and operating lease obligations and commitment to acquire Goldshare discussed under “– Contractual Obligations and Commercial Commitments” above we have no outstanding off-balance sheet arrangements, derivative financial instruments, interest rate swap transactions or foreign currency forward contracts. We do not engage in trading activities involving non-exchange traded contracts.
| ITEM 6. | DIRECTORS, SENIOR MANAGEMENT AND EMPLOYEES |
| A. | Directors and senior management |
The following table sets forth information about our directors and executive officers:
| Name | | Age | | Position |
| Jeffrey Kang | | 43 | | Chief Executive Officer and Chairman of the Board |
| Yi Yuan | | 52 | | President |
| Andy Liu | | 37 | | Chief Financial Officer, Treasurer, Secretary and Director |
| Dr. Q.Y. Ma(1)(2)(3) | | 56 | | Director |
| Dr. George Mao(1)(2)(3) | | 51 | | Director |
| Dr. Nathan Zhang(1)(2)(3) | | 48 | | Director |
| (1) | Member of Audit Committee |
| (2) | Member of Nominating and Governance Committee |
| (3) | Member of Compensation Committee |
Jeffrey Kang, Chairman of the Board and Chief Executive Officer. Mr. Kang was a co-founder of Cogo and has served as our chief executive officer and chairman of the board since September 1999. Mr. Kang founded Shenzhen Matsunichi Electronics Co., Ltd. and Matsunichi Electronic (Hong Kong) Limited, a predecessor of the Company, in 1995, when Matsunichi commenced operations as a distributor for Matsushita. In 1999, Mr. Kang transferred all operations and assets of Matsunichi into our immediate predecessor. Prior to forming Matsunichi, Mr. Kang worked for Matsushita Electronics from June 1992 to July 1995 where he was responsible for selling components to the telecommunications industry within China. From 1998 to 1999, Mr. Kang was vice president of Shenzhen SME (Small and Medium Enterprises) Association, a non-profit association in Shenzhen. Mr. Kang earned a B.S. degree in Electrical Engineering from South China Technology University in Guangzhou, China.
Yi Yuan, President. Mr. Yuan has been the President of Cogo since May 8, 2008 and was the Chief Operating Officer from April 1, 2008 through May 8, 2008. Prior to joining Cogo, Mr. Yuan was the President of TCL Communication Technology from September 2005 to February 2008. Prior to joining TCL, he had been in various positions at Broadcom from March 2000 to August 2005, including the Chief Representative, General Manager and Director of Sales for Greater China and the Director of Asia business development. Prior to joining Broadcom, he was the global business manager at Texas Instruments where he pioneered China development. Mr. Yuan received a B.S. degree from Shanghai Jiao Tong University and obtained a M.S. degree in Electronic Engineering from Northern Illinois University.
Andy Liu, Chief Financial Officer, Treasurer, Secretary and Director. Mr. Liu has been Chief Financial Officer, Treasurer, Secretary and a director since September 23, 2012. Mr. Liu joined the Company as an Associate of Group Accounting in 2004. He was promoted several times since joining the Company and was named Vice President of Group Accounting in June 2012. Prior to joining the Company, Mr. Liu was Finance Manager at Shanghai Shengde TCL Electronics from August 2003 to April 2004 and Accounting Supervisor with Shenzhen Universe (Group) Co., Ltd. from December 1999 to August 2003. Mr. Liu was an auditor with Zhong Tian Qin (Shenzhen) Certified Public Accountants from January 1999 to December 1999. Mr. Liu holds a B.S. degree in International Accounting from Tianjin University of Finance and Economics and is a candidate for membership in the ACCA (Association of Chartered Certified Accountants).
Dr. Q.Y. Ma, Director. Dr. Ma has been a director since December 2004. Dr. Ma has been the managing director of Time Innovation Ventures, a venture capital firm, since 2000, and served as a professor at the University of Hong Kong from 1998 to 2000. Dr. Ma was an associate professor at Columbia University from 1994 to 2000. He has also served as a technology consultant to IBM, General Electric, TRW, Inc. and DuPont. Dr. Ma is a co-founder and advisor of Semiconductor Manufacturing International Corp., and has served as an adviser to the Ministry of Information Industry, Beijing Government, and a senior advisor to Zhangjiang Hi-Tech Park in Shanghai. Dr. Ma received his Ph.D. from Columbia University, and attended the Executive Program of Stanford University’s School of Business.
Dr. George Mao, Director. Dr. Mao has been a director since January 2008. Dr. Mao is the co-founder and has been the general manager of RYHT Asset Management Inc. since 2005. Before co-founding RYHT, Dr. Mao was Vice General Manager of Franklin Templeton Sealand Fund Management Co. Ltd. from May 2003 to December 2004. Dr. Mao held management positions with Pin An Securities Company Inc. and China Eagle Securities Company overseeing IPOs from September 1999 through May 2003. Dr. Mao obtained an MBA degree and a PhD degree from the University of Western Ontario in Canada and an M.A. degree from the Chinese Academy of Sciences, Beijing. Dr. Mao sits on various boards, including Shenzhen Cao Technology Co., Ltd. which is listed on Shenzhen Stock Exchange and Beijing Zhong Biao Fang Yuan Technology Anti-counterfeiting Company.
Dr. Nathan Xin Zhang, Director. Dr. Zhang was elected to the board of directors on December 22, 2011. Dr. Zhang is the Managing Director of Sinocro Partners, a merchant bank specialized in investment and advisory services with a China focus, where he has worked since 2004. Dr. Zhang has advised many Chinese companies on capital raises and public offerings while at Sinocro Partners. Dr. Zhang founded Sinocro Medical in 2008, a medical device company specialized in product licensing, manufacturing and distribution in China, where he serves as CEO. Dr. Zhang is on the board of directors of Ziao Xing Mobile, a NYSE listed company, and Venturepharm Laboratories Limited, a company listed on the Hong Kong Stock Exchange. Dr. Zhang has served as a managing director at Delirium, a global consulting company in New York, Hong Kong and China and other Asian countries. Dr. Zhang also worked with KPMG and Credit Suisse First Boston in New York. Dr. Zhang received his M.D. from Tianjin Medical University, Ph.D. from University of Pennsylvania, and MBA from the University of Chicago with a concentration in Finance and Accounting.
There are no family relationships between any of the directors and executive officers.
Compensation of Directors and Executive Officers
For the 2012 fiscal year we paid an aggregate of approximately $687,054 in cash compensation and non-share-based compensation to our three executive officers who remained with us at the end of the year and our former chief financial officer for his services in 2012.
We paid our three independent directors an aggregate of $104,000 in compensation for their services to the board of directors and its committees for the 2012 fiscal year. We paid no compensation to our employee directors for their services to the board. We reimburse all of our directors for expenses accrued in connection with their services to the board.
Retirement Benefits
Social insurance under government mandated defined contribution plans or other similar benefits that have been set aside for our executive officers was $6,784 for the 2012 fiscal year.
Employment Agreements
Jeffrey Kang, Chief Executive Officer. Comtech International (Hong Kong) Limited entered into an employment agreement with Jeffrey Kang, our Chief Executive Officer, in January 2011, which will expire in December 2013. Pursuant to the agreement, Mr. Kang’s annual base compensation is $120,000 in cash and 40,000 ordinary shares. Mr. Kang is eligible to receive a bonus of 80,000 ordinary shares annually if we reach a compound annual growth rate above 20%, and he is eligible to receive an additional bonus of 80,000 ordinary shares if we reach a compound annual growth rate above 30%. Pursuant to the agreement, Mr. Kang will devote all of his working time to his respective duties with us and will not become employed in any competitive business while employed by us or for two years following the termination of his employment with us, and Mr. Kang will not solicit the services of any of our employees for two years after he terminates employment with us. We may terminate Mr. Kang for cause at any time without notice, or without cause upon 12 weeks prior written notice to Mr. Kang.
Yi Yuan, President. Comtech Broadband Corporation Limited entered into an employment agreement with Yi Yuan, our President, in April 2009, which expired in March 2011. Pursuant to the agreement, Mr. Yuan’s annual base compensation is $100,000 in cash and 22,666 ordinary shares. Mr. Yuan is eligible to receive a bonus of up to 26,667 ordinary shares annually if we reach a compound annual growth rate above 30%, and he is eligible to receive an additional bonus of up to 26,667 ordinary shares annually if we reach a compound annual growth rate above 40%. In March 2011, Mr. Yuan entered into another employment agreement with Comtech Broadband Corporation Limited, which will expire in March 2014. Pursuant to the agreement, Mr. Yuan’s annual base compensation is $120,000 in cash and 50,000 of our ordinary shares. Mr. Yuan is eligible to receive a bonus of 10,000 of our ordinary shares annually if we reach a compound annual growth rate above 20%, and he is eligible to receive an additional bonus of 10,000 of our ordinary shares annually if we reach a compound annual growth rate above 30%. Pursuant to the agreement, Mr. Yuan will devote all of his working time to his respective duties with us and will not become employed in any competitive business while employed by us or for two years following the termination of his employment with us, and Mr. Yuan will not solicit the services of any of our employees for two years after he terminates employment with us. We may terminate Mr. Yuan for cause at any time without notice, or without cause upon 12 weeks prior written notice to Mr. Yuan.
On September 23, 2012, in connection with Andy Liu’s appointment as Chief Financial Officer, the Compensation Committee of the Board of Directors voted to pay Mr. Liu a salary of $60,000 per year for his services to the Company.
The Cogo Group, Inc. 2009 Omnibus Securities and Incentive Plan
Our board of directors adopted the Cogo Group, Inc. 2009 Omnibus Securities and Incentive Plan (the “2009 Plan”) on November 9, 2009. On August 4, 2011, upon completion of the redomestication merger, the Company assumed the obligations to provide for the issuance of the Company’s ordinary shares rather than the common stock of Cogo Maryland upon the exercise of all outstanding options to purchase shares of Cogo Maryland common stock and all other outstanding equity awards granted under equity plans to directors, employees and consultants under Cogo Maryland’s 2009 Incentive Plan.
Administration. The 2009 Plan is administered by the compensation committee of our board of directors, which consists of three members of our board of directors, each of whom is a “non-employee director” within the meaning of Rule 16b-3 promulgated under the Exchange Act and an “outside director” within the meaning of Code Section 162(m). Among other things, the compensation committee has complete discretion, subject to the express limits of the 2009 Plan, to determine the directors, employees and independent contractors to be granted an award, the type of award to be granted, the number of ordinary shares subject to each award, the exercise price of each option and base price of each SAR, the term of each award, the vesting schedule for an award, whether to accelerate vesting, the value of the shares, and the required withholding. The compensation committee may amend, modify or terminate any outstanding award, provided that the participant’s consent to such action is required if the action would materially and adversely affect the participant. The compensation committee is also authorized to construe the award agreements, and may prescribe rules relating to the 2009 Plan. Notwithstanding the foregoing, the Committee does not have any authority to grant or modify an award under the 2009 Plan with terms or conditions that would cause the grant, vesting or exercise to be considered nonqualified “deferred compensation” subject to Section 409A of the Code.
Grant of Awards; Shares Available for Awards. The 2009 Plan provides for the grant of options, SARs, performance share awards, performance unit awards, distribution equivalent right awards, restricted share awards and unrestricted share awards in an amount equal to 6,000,000 ordinary shares, to directors, officers, employees and independent contractors of the Company or its affiliates. If any award expires, is cancelled, or terminates unexercised or is forfeited, the number of shares subject thereto is again available for grant under the 2009 Plan. The number of ordinary shares for which awards may be granted to a participant under the 2009 Plan in any calendar year cannot exceed 2,400,000.
Currently, there are 66 employees and directors who would be entitled to receive share options and/or restricted shares under the 2009 Plan. Future new hires and additional consultants would be eligible to participate in the 2009 Plan as well. The number of share options and/or restricted shares to be granted to executives and directors cannot be determined at this time as the grant of share options and/or restricted shares is dependent upon various factors such as hiring requirements and job performance.
Share Options. Options granted under the 2009 Plan may be either “incentive share options” (“ISOs”), which are intended to meet the requirements for special federal income tax treatment under the Code, or “nonqualified share options” (“NQSOs”). Options may be granted on such terms and conditions as the Committee may determine; provided, however, that the exercise price of an option may not be less than the fair market value of the underlying shares on the date of grant and the term of the option my not exceed 10 years (110% of such value and five years in the case of an ISO granted to an employee who owns (or is deemed to own) more than 10% of the total combined voting power of all classes of capital shares of the Company or a parent or subsidiary of the Company). ISOs may only be granted to employees. In addition, the aggregate fair market value of the ordinary shares covered by ISOs (determined at the time of grant) which are exercisable for thefirst time by an employee during any calendar year may not exceed $100,000. Any excess is treated as a NQSO.
Share Appreciation Rights. A SAR entitles the participant, upon exercise, to receive an amount, in cash or share or a combination thereof, equal to the increase in the fair market value of the underlying shares between the date of grant and the date of exercise. SARs may be granted in tandem with, or independently of, options granted under the 2009 Plan. A SAR granted in tandem with an option (i) is exercisable only at such times, and to the extent, that the related option is exercisable in accordance with the procedure for exercise of the related option; (ii) terminates upon termination or exercise of the related option (likewise, the option granted in tandem with a SAR terminates upon exercise of the SAR); (iii) is transferable only with the related option; and (iv) if the related option is an ISO, may be exercised only when the value of the shares subject to the option exceeds the exercise price of the option. A SAR that is not granted in tandem with an option is exercisable at such times as the compensation committee may specify.
Performance Shares or Performance Unit Awards. Performance share or performance unit awards entitle the participant to receive cash or ordinary shares upon attaining specified performance goals. In the case of performance units, the right to acquire the units is denominated in cash values.
Distribution Equivalent Right Awards. A distribution equivalent right award under the 2009 Plan entitles the participant to receive bookkeeping credits, cash payments and/or ordinary share distributions equal in amount to the distributions that would have been made to the participant had the participant held a specified number of our ordinary shares during the period the participant held the distribution equivalent right. A distribution equivalent right may be awarded under the 2009 Plan as a component of another award, where, if so awarded, such distribution equivalent right will expire or be forfeited by the participant under the same conditions as under such other award.
Restricted Share Awards or Restricted Share Unit Award. A restricted share award is a grant or sale of ordinary shares to the participant, subject to our right to repurchase all or part of the ordinary shares at their purchase price (or to require forfeiture of such shares if purchased at no cost) in the event that conditions specified by the compensation committee in the award are not satisfied prior to the end of the time period during which the ordinary shares subject to the award may be repurchased by or forfeited to us. A restricted share unit entitles the holder to receive a cash payment equal to the fair market value of an ordinary share, or one ordinary share for each restricted share unit subject to such restricted share unit award, if the holder satisfies the applicable vesting requirement.
Unrestricted Share Awards. An unrestricted share award under the 2009 Plan is a grant or sale of our ordinary shares to the participant that is not subject to transfer, forfeiture or other restrictions, in consideration for past services rendered to us or an affiliate or for other valid consideration.
Change-in-Control Provisions. In connection with the grant of an award, the compensation committee may provide that, in the event of a change in control, any outstanding awards that are unexercisable or otherwise unvested will become fully vested and immediately exercisable.
Amendment and Termination. The compensation committee may adopt, amend and rescind rules relating to the administration of the 2009 Plan, and amend, suspend or terminate the 2009 Plan, but no amendment will be made that adversely affects in a material manner any rights of the holder of any award without the holder’s consent, other than amendments that are necessary to permit the granting of awards in compliance with applicable laws. We have attempted to structure the 2009 Plan so that remuneration attributable to share options and other awards will not be subject to a deduction limitation contained in Section 162(m) of the Code.
As of December 31, 2012, awards representing 2,458,936 ordinary shares had been granted under the 2009 Plan.
Our board of directors has an audit committee, a nominating and corporate governance committee, and a compensation committee, each established in 2005. Our board of directors has determined that Dr. Q.Y. Ma, Dr. Nathan Zhang and Dr. George Mao, the members of these committees during the 2012 fiscal year, are “independent” under the current independence standards of Rule 5605(a)(2) of the Marketplace Rules of The NASDAQ Stock Market, LLC and meet the criteria for independence set forth in Rule 10A(m)(3) under the U.S. Securities Exchange Act of 1934, as amended (the Exchange Act). Our board of directors has also determined that these persons have no material relationships with us—either directly or as a partner, shareholder or officer of any entity—which could be inconsistent with a finding of their independence as members of our board of directors.
Audit Committee
The audit committee, consisting in 2012 of Dr. Ma, Dr. Zhang and Dr. Mao, oversees our financial reporting process on behalf of the board of directors. A copy of the audit committee’s charter is available on our website athttp://www.cogo.com.cn/pdf/cogo_AC_Charter.pdf. During 2012, the audit committee met 12 times and acted by written consent 5 times. The committee’s responsibilities include the following functions:
| · | approve and retain the independent auditors to conduct the annual audit of our books and records; |
| · | review the proposed scope and results of the audit; |
| · | review and pre-approve the independent auditors’ audit and non-audited services rendered; |
| · | approve the audit fees to be paid; |
| · | review accounting and financial controls with the independent auditors and our internal auditors and financial and accounting staff; |
| · | review and approve transactions between us and our directors, officers and affiliates; |
| · | recognize and prevent prohibited non-audit services; and |
| · | meet separately and periodically with management and our internal auditor and independent auditors. |
Nominating and Corporate Governance Committee
The nominating and governance committee, consisting of Dr. Ma, Dr. Zhang and Dr. Mao in 2012, is responsible for identifying potential candidates to serve on our board and its committees. A copy of the nominating and governance committee’s charter is available on our website at http://www.cogo.com.cn/pdf/cogo_NCGC_Charter.pdf. The nominating and corporate governance committee acted by written consent 2 times in 2012 and did not otherwise meet during 2012. The committee’s responsibilities include the following functions:
| · | making recommendations to the board regarding the size and composition of the board of directors; |
| · | identifying and recommending to the board nominees for election or re-election to the board of directors, or for appointment to fill any vacancy; |
| · | establishing procedures for the nomination process; |
| · | advising the board periodically with respect to corporate governance matters and practices, including periodically reviewing corporate governance guidelines to be adopted by the board of directors; and |
| · | establishing and administering a periodic assessment procedure relating to the performance of the board of directors as a whole and its individual members. |
The nominating and corporate governance committee will consider director candidates recommended by security holders. Potential nominees to our board of directors are required to have such experience in business or financial matters as would make such nominee an asset to the board of directors and may, under certain circumstances, be required to be “independent”, as such term is defined under independence standards applicable to us. Security holders wishing to submit the name of a person as a potential nominee to the board of directors must send the name, address, and a brief (no more than 500 words) biographical description of such potential nominee to the committee at the following address: nominating and corporate governance committee of the board of directors, c/o Cogo Group, Inc., Suite 1001, Tower C, Skyworth Building, High-Tech Industrial Park, Nanshan, Shenzhen 518057, PRC. Potential director nominees will be evaluated by personal interview, such interview to be conducted by one or more members of the committee, and/or any other method the committee deems appropriate, which may, but need not, include a questionnaire. The nominating and corporate governance committee may solicit or receive information concerning potential nominees from any source it deems appropriate. The committee need not engage in an evaluation process unless: (1) there is a vacancy on the board; (2) a director is not standing for re-election; or (3) the committee does not intend to recommend the nomination of a sitting director for re-election. A potential director nominee recommended by a security holder will not be evaluated any differently than any other potential nominee.
There are no differences in the manner in which the nominating and corporate governance committee evaluates nominees for director based on whether the nominee was recommended by a shareholder. Among other things, the nominating and corporate governance committee takes into account, when acting upon nominees, factors such as familiarity with the industry in which we operate, experience in working with China-based companies, the relevant expertise of its directors and director nominees, whether the director or nominee would be considered independent, the time that the director or nominee will be able to devote to Company matters, experience with U.S. public companies, language skills and other factors. “Diversity,” as such, is not a criterion that the committee considers. The nominating and corporate governance committee believes that it is appropriate to include representation of senior management on our board of directors.
Compensation Committee
The compensation committee, consisting of Dr. Ma, Dr. Zhang and Dr. Mao in 2012, is responsible for making recommendations to the board of directors concerning salaries and incentive compensation for our officers and employees and administers our share option plans. We do not have a charter for the compensation committee. The compensation committee acted by written consent 2 times in 2012 but did not otherwise meet. Its responsibilities include the following functions:
| · | reviewing and recommending policy relating to the compensation and benefits of our officers and employees, including reviewing and approving corporate goals and objectives relevant to the compensation of our chief executive officer and other senior officers; evaluating the performance of these officers in light of those goals and objectives; and setting compensation of these officers based on such evaluations; |
| · | administering our benefit plans and the issuance of share options and other awards under our share plans; and reviewing and establishing appropriate insurance coverage for our directors and executive officers; |
| · | recommending the type and amount of compensation to be paid or awarded to members of our board of directors, including consulting, retainer, meeting, committee and committee chair fees and share option grants or awards; and |
| · | reviewing and approving the terms of any employment agreements, severance arrangements, change-of-control protections and any other compensatory arrangements for our executive officers. |
Compensation Committee Interlocks and Insider Participation
No member of our compensation committee has at any time been an officer or employee of ours, or our subsidiaries. No interlocking relationship exists between our board of directors or compensation committee and our board of directors or compensation committee of any other company, nor has any interlocking relationship existed in the past.
The table below provides information as to the total number of employees at the end of the last three fiscal years. We have no contracts or collective bargaining agreements with labor unions and have never experienced work stoppages due to labor dispute. We consider our relations with our employees to be good.
| | | 2010 | | | 2011 | | | 2012 | |
| Research and Development | | | 280 | | | | 370 | | | | 314 | |
| Sales and Marketing | | | 177 | | | | 168 | | | | 132 | |
| Administrative | | | 103 | | | | 106 | | | | 94 | |
| Total Full-time Employees | | | 560 | | | | 644 | | | | 540 | |
We make contributions for all of our employees in the PRC to retirement benefits based on their salaries and length of service upon retirement in accordance with a PRC government-managed retirement plan. The mandatory insurance schemes in Shenzhen, PRC includes a pension scheme, medical insurance, work-related insurance and unemployment insurance. The PRC government is directly responsible for the payments of benefits to these retired employees. We are required to make contributions to the government-managed retirement plan at specified rates of the salaries, bonuses and certain allowances of our employees, up to a maximum amount specified by the local government from time to time.
We operate a Mandatory Provident Fund Scheme (“the MPF scheme’) under the Hong Kong Mandatory Provident Fund Schemes Ordinance for employees employed under the jurisdiction of the Hong Kong Employment Ordinance. The assets of the MPF scheme are held by independent trustees and are separated from those of our assets. Under the MPF scheme, the employer and its employees are each required to make contributions to the plan at 5% of the employees’ relevant income, subject to a cap of monthly relevant income of HKD25,000. Contributions to the plan by the employee vest immediately.
Our future success will depend, in part, on our ability to continue to attract, retain and motivate highly qualified technical, marketing and management personnel, for whom competition is intense. Our employees are not covered by any collective bargaining agreement and we have never experienced a work stoppage. We believe we enjoy good relations with our employees.
See Item 7, below.
| ITEM 7. | MAJOR SHAREHOLDERS AND RELATED PARTY TRANSACTIONS |
The following table sets forth, as of April 15, 2013, certain information as to the stock ownership of: (1) each person known by us to own beneficially more than five percent of our ordinary shares; (2) each of our directors; (3) each of our executive officers; and (4) our executive officers and directors as a group. The business address of each shareholder is c/o Cogo Group, Inc., Suite 1001, Tower C, Skyworth Building, High-Tech Industrial Park, Nanshan, Shenzhen 518057, PRC.
| Name of Beneficial Owner | | Number of Ordinary
Shares Beneficially
Owned (1) | | | Percentage
Ownership | |
| Jeffrey Kang, Chief Executive Officer and Chairman of the Board | | | 10,351,567 | (2)(3) | | | 33.31 | % |
| Yi Yuan, President | | | 183,333 | | | | * | |
| Andy Liu, Chief Financial Officer, Secretary and Director | | | - | | | | * | |
| Dr. Q.Y. Ma, Director | | | 11,301 | (4) | | | * | |
| Dr. George Mao, Director | | | 5,000 | | | | * | |
| Dr. Nathan Zhang, Director | | | - | | | | * | |
| All executive officers and directors as a group (6 persons) | | | 10,551,201 | | | | 33.95 | % |
| | | | | | | | | |
| Principal Shareholders | | | | | | | | |
| Nan Ji | | | 9,721,524 | (3)(5) | | | 31.28 | % |
| Comtech Global Investment Ltd. | | | 9,721,524 | (3)(5) | | | 31.28 | % |
| Chelsun Limited | | | 4,797,405 | (6) | | | 15.44 | % |
| Ren Investment International Ltd. | | | 2,290,028 | (7) | | | 7.37 | % |
| * | Represents beneficial ownership of less than one percent of our outstanding ordinary shares. |
| (1) | Beneficial ownership is determined in accordance with the rules and regulations of the SEC. In computing the number of shares beneficially owned by a person and the percentage ownership of that person, ordinary shares subject to options held by that person that are currently exercisable or exercisable within 60 days of April 15, 2013 are deemed outstanding. Such shares, however, are not deemed outstanding for the purposes of computing the percentage ownership of any other person. Except as indicated in the footnotes to the following table or pursuant to applicable community property laws, each shareholder named in the table has sole voting and investment power with respect to the shares set forth opposite such shareholder’s name. The percentage of beneficial ownership is based on 31,076,061 ordinary shares outstanding as of April 15, 2013. |
| (2) | Consists of: (a) 450,043 ordinary shares underlying options; (b) 180,000 ordinary shares; and (c) 9,721,524 ordinary shares beneficially owned by Comtech Global Investment Ltd., over which Mr. Jeffrey Kang and his wife, Ms. Nan Ji, share voting and investment power. |
| (3) | Mr. Jeffrey Kang owns a 29% interest and Ms. Nan Ji a 71% interest in Comtech Global Investment Ltd. The directors of Comtech Global Investment Ltd. are Mr. Jeffrey Kang and his brother, Mr. Yi Kang, who does not have an economic interest in any shares of Comtech Global Investment Ltd. |
| (4) | Includes 5,000 ordinary shares underlying options. |
| (5) | Mr. Jeffrey Kang and his wife, Ms. Nan Ji, share voting and investment power over the 9,721,524 ordinary shares beneficially owned by Comtech Global Investment Ltd. |
| (6) | Based on the Schedule 13G/A jointly filed by Chelsun Limited and Wei Shen on March 12, 2013, Chelsun Limited is located at Room 1318-20, 13/F, Hollywood Plaza, 610 Nathan Road, Mongkok, Kowloon, Hong Kong. Wei Shen has the sole power to vote and dispose of the shares of Chelsun Limited. |
| (7) | Shi Yang, as sole director, has sole voting and investment power over the shares owned by Ren Investment International Ltd. Shi Yang owns a 43% interest in Ren Investment International Ltd. |
As of April 15, 2013, there were 31,076,061 of our ordinary shares outstanding, and we had 248 shareholders of record.
| B. | Related Party Transactions |
On October 23, 2012, we entered into the Envision Agreement pursuant to which we would sell certain subsidiaries, representing approximately 28% of the Company’s revenues for the for the year ended December 31, 2012, to Envision for a total consideration of USD78 million. The transactions contemplated by the Envision Agreement closed on November 15, 2012 following the restructuring of certain of our subsidiaries in the PRC.
Transactions with Envision
Envision and its subsidiaries (“Envision Group”) are principally engaged in the sale of component parts for electronic devices and equipment, such as liquid crystal display, cameras, persistent storage and peripheral devices for wireless handsets and fixed-line telecommunications, industrial business components and medical and healthcare equipment to customers in the PRC. Subsequent to November 15, 2012, we made sales of goods to and procured from Envision Group in the amount of RMB3.7 million (USD0.6 million) and RMB7.0 million (USD1.1 million), respectively.
Guarantees to banking institutions among our remaining subsidiaries and the Disposal Group will be maintained for a transitional period up to December 31, 2014 in order to maintain better financing terms for both parties. We will charge a guarantee fee amounting to USD250,000, as determined with reference to the guarantee fee chargeable by banks to Envision each quarter. In addition, we will also provide support and administrative services, including logistics, warehousing, accounting service, customer service, human resource service and IT services, to the Disposal Group. Service fees will be charged at pre-determined rates over usage and revenue generated by the Disposal Group as stipulated in the Services Agreement. For the year ended December 31, 2012, we have charged guarantee and service fees to Envision amounting to RMB0.8 million (USD0.1 million) and RMB1.0 million (USD0.2 million), respectively.
Other than as described above, we have not proposed or been a party to any transactions with related persons as described in Item 7B of Form 20-F since the beginning of our last fiscal year.
In the event any transaction in which we propose to engage is a related-person transaction, our management must present information regarding the proposed related-person transaction to the disinterested non-employee members of our board of directors for consideration and approval or ratification. The presentation must include a description of, among other things, the material facts, the interests, direct and indirect, of the related persons, the benefits to us of the transaction and whether any alternative transactions were available. To identify related-person transactions in advance, we rely on information supplied by our executive officers, directors and significant shareholders. In considering related-person transactions, the disinterested non-employee members of the board take into account the relevant available facts and circumstances including, but not limited to (a) the risks, costs and benefits to us, (b) the impact on a director’s independence in the event the related person is a director, immediate family member of a director or an entity with which a director is affiliated, (c) the terms of the transaction, (d) the availability of other sources for comparable services or products and (e) the terms available to or from, as the case may be, unrelated third parties or to or from employees generally. In the event a director has an interest in the proposed transaction, the director must excuse himself or herself from the deliberations and approval. The policy requires that, in determining whether to approve, ratify or reject a related-person transaction, the disinterested non-employee members of our board of directors look at, in light of known circumstances, whether the transaction is in, or is not inconsistent with, our best interests and our shareholders, as determined in the good faith exercise of such directors’ discretion.
| C. | Interests of Experts and Counsel |
Not required.
| ITEM 8. | FINANCIAL INFORMATION |
| A. | Consolidated Statements and Other Financial Information |
See Item 19.
None.
| ITEM 9. | THE OFFER AND LISTING |
| A. | Offer and Listing Details |
The following table sets forth, for the calendar quarters indicated and through April 12,2013, the quarterly high and low sale prices for our ordinary shares, as reported on NASDAQ Global Select Market under the symbol “COGO.”
| | | Shares | |
| | | High | | | Low | |
| Annual Highs and Lows | | | | | | | | |
| 2008 | | | 15.30 | | | | 2.49 | |
| 2009 | | | 8.47 | | | | 4.86 | |
| 2010 | | | 9.22 | | | | 6.01 | |
| 2011 | | | 9.40 | | | | 1.65 | |
| 2012 | | | 3.13 | | | | 1.65 | |
| | | | | | | | | |
| 2011 | | | | | | | | |
| First Quarter | | | 9.40 | | | | 7.54 | |
| Second Quarter | | | 8.24 | | | | 4.93 | |
| Third Quarter | | | 5.21 | | | | 2.13 | |
| Fourth Quarter | | | 2.52 | | | | 1.65 | |
| | | | | | | | | |
| 2012 | | | | | | | | |
| First Quarter | | | 3.13 | | | | 1.80 | |
| Second Quarter | | | 2.77 | | | | 1.65 | |
| Third Quarter | | | 2.16 | | | | 1.67 | |
| Fourth Quarter | | | 2.6 | | | | 2.06 | |
| | | | | | | | | |
| 2013 | | | | | | | | |
| First Quarter | | | 2.44 | | | | 1.91 | |
| | | | | | | | | |
| September 2012 | | | 2.16 | | | | 1.78 | |
| October 2012 | | | 2.58 | | | | 2.06 | |
| November 2012 | | | 2.60 | | | | 2.30 | |
| December 2012 | | | 2.48 | | | | 2.18 | |
| January 2013 | | | 2.44 | | | | 2.37 | |
| February 2013 | | | 2.40 | | | | 2.10 | |
| March 2013 | | | 2.12 | | | | 1.91 | |
Not Applicable.
Our ordinary shares are listed on the NASDAQ Global Select Market under the symbol COGO. Our ordinary shares have been listed on Nasdaq since January 31, 2005.
Not Applicable.
Not Applicable.
Not Applicable.
| ITEM 10. | ADDITIONAL INFORMATION |
Not Applicable.
| B. | Memorandum and Articles of Association |
Registered Office. Our registered office is c/o Abacus Management Limited, Ground Floor Elizabethan Square, George Town, P.O. Box 2499, Grand Cayman, KY1-1104 Cayman Islands, or at such other place as our directors may determine.
Objects and Purposes. There are no limitations on the business that the Company may carry on provided that it may not be prohibited by any law as provided by Section 7(4) of The Companies Law (2010 Revision) and the Company must be duly licensed to carry on a business for which a license is required in the Cayman Islands.
Directors. Our articles provide that until otherwise determined by its members in a general meeting, the number of directors shall not be less than three or be more than nineteen. A director is not required to hold our ordinary shares as a qualification to serve as a member of the board of directors. Cayman Islands laws do not restrict transactions with directors, requiring only that directors exercise a duty of care and owe a fiduciary duty to the companies for which they serve. Our directors stand for reelection annually. Pursuant to our articles, the quorum necessary for the transaction of the business of our directors may be fixed by the directors and, unless so fixed, shall be a minimum of three directors.
Interested Transactions. Under our memorandum and articles of association, subject to any separate requirement for audit committee approval under the applicable rules of the exchange on which we are listed at the time or unless disqualified by the chairman of the relevant board meeting, so long as a director promptly and adequately discloses the nature of his interest in any contract or arrangement which he is interested in to the other directors, a director may vote, attend a board meeting or sign a document on our behalf with respect to any contract or transaction in which he or she is interested and he or she may be counted in the quorum at such meeting.
Ordinary Shares. The authorized share capital of the Company is $2 million divided into 200,000,000 shares each with a nominal or par value of $0.01 each. Each ordinary share entitles the shareholder to one vote and rankpari passu with other ordinary shares as to voting. Directors are elected by a majority vote as provided in memorandum and articles of association; certain other matters are decided by a majority of those shares present and entitled to vote subject to the Companies Law which may require a special resolution which is two-thirds of those members attending in person or by proxy.
While there is nothing under the laws of the Cayman Islands which specifically prohibits or restricts the creation of cumulative voting rights for the election of our directors, it is not a concept that is accepted as a common practice in the Cayman Islands, and we have made no provisions in our memorandum and articles of association to allow cumulative voting for such elections.
Variation of Share Rights. If at any time the share capital is divided into different classes of shares the rights attached to any class may be varied with the consent in writing of the holders of three fourths of the issued shares of that class or with the sanction of a majority of not less than two-thirds of the shareholders passed at a separate general meeting of the holders of the shares of the class.
Dividends. Under Cayman Islands law, our board of directors may pay dividends to our ordinary shareholders out of our profits; from our asset revaluation reserve; from our capital redemption reserve if used for a bonus share issue; or from our share premium account, which represents the excess of the price paid to us on issue of our ordinary shares over the par or “nominal” value of those shares, which is similar to the U.S. concept of additional paid in capital. However, no dividends may be paid if, after payment, we would not be able to pay our debts as they come due in the ordinary course of business.
Charter amendments. Under the Companies Law, our memorandum and articles of association may be amended only by a special resolution (a resolution passed by a majority of not less than two-thirds of the members, unless a greater number is specified in a company’s articles). Our board of directors may not effect amendments to our articles of association.
Meetings of Shareholders. Notice of a meeting of shareholders must be given not less than nine days (exclusive of the day on which the notice is served or deemed to be served but inclusive of the day for which the notice is given). There is no statute in the Cayman Islands permitting shareholders to participate in meetings by way of telephone. There is English case law which may be followed by the courts of the Cayman Islands allowing for meetings to be conducted by electronic means provided that each shareholder may be seen and heard by all other shareholders and may see and hear all other shareholders. Meetings of shareholders, which may be within or outside the Cayman Islands, may be called by the directors or by shareholders holding one quarter of the outstanding votes. Our articles require an annual meeting of the members for the election of directors to be called by the directors. Meetings on short notice may be called upon waiver or presence of all the members holding shares entitled to attend and vote thereat or their proxies. A minimum of two shareholders must be present at the time when a general meeting of shareholders proceeds to business, and a minimum of two members present in person or by proxy and entitled to cast a majority of votes constitutes a quorum at such meeting.
Additional information required by Item 10.B of Form 20-F is included in the section titled “Comparison of Stockholder Rights” in our Registration Statement on Form F-4 initially filed with the SEC on May 2, 2011 (File No.: 333-173844), which section is incorporated herein by reference.
The information required by Item 10.C of Form 20-F is included in the Current Reports on Form 8-K filed by us on January 3, 2011, May 16, 2011, July 20, 2011 and July 21, 2011 and the Current Reports on Form 6-K filed by us on November 11, 2011, March 15, 2012, October 20, 2012 and December 11, 2012, which filings are incorporated herein by reference.
Except for the above and as otherwise described herein, we did not enter into any other material contracts during our fiscal years ended December 31, 2011 or 2012.
Under Cayman Islands law, there are currently no restrictions on the export or import of capital, including foreign exchange controls or restrictions that affect the remittance of dividends, interest or other payments to nonresident holders of our ordinary shares.
United States Federal Income Taxation
General
The following is a summary of the material U.S. federal income tax consequences of the ownership and disposition of our ordinary shares. As described in “Item 3. Key Information – Risk Factors – There is a risk that we could be treated as a foreign corporation for U.S. federal income tax purposes, which could result in significantly greater U.S. federal income tax liability to us” and “Item 5. Operating and Financial Review and Prospects – Taxation – U.S.” this discussion assumes that we will be treated as a U.S. corporation for U.S. federal income tax purposes. All references herein to “we” “us” and our” refer to Cogo Group, Inc.
The discussion below of the U.S. federal income tax consequences to “U.S. Holders” will apply to a beneficial owner of our ordinary shares that is for U.S. federal income tax purposes:
| · | an individual citizen or resident of the United States; |
| · | a corporation (or other entity treated as a corporation) that is created or organized (or treated as created or organized) in or under the laws of the United States, any state thereof or the District of Columbia; |
| · | an estate whose income is includible in gross income for U.S. federal income tax purposes regardless of its source; or |
| · | a trust if (i) a U.S. court can exercise primary supervision over the trust’s administration and one or more U.S. persons are authorized to control all substantial decisions of the trust, or (ii) it has a valid election in effect under applicable U.S. Treasury regulations to be treated as a U.S. person. |
A beneficial owner of shares of our ordinary shares that is described above is referred to herein as a “U.S. Holder.” If a beneficial owner of our ordinary shares is not described as a U.S. Holder and is not an entity treated as a partnership or other pass-through entity for U.S. federal income tax purposes, such owner will be considered a “Non-U.S. Holder.” The material U.S. federal income tax consequences of the ownership and disposition of our ordinary shares applicable specifically to Non-U.S. Holders is described below under the heading “Non-U.S. Holders.”
This summary is based on the Internal Revenue Code of 1986, as amended (the “Code”), its legislative history, Treasury regulations promulgated thereunder, published rulings and court decisions, all as currently in effect. These authorities are subject to change possibly on a retroactive basis or differing interpretations.
This discussion does not address all aspects of U.S. federal income taxation that may be relevant to any particular holder based on such holder’s individual circumstances. In particular, this discussion considers only holders that own and hold our ordinary shares, as capital assets within the meaning of Section 1221 of the Code, and does not address the alternative minimum tax. In addition, this discussion does not address the U.S. federal income tax consequences to holders that are subject to special rules, including:
| · | financial institutions or financial services entities; |
| · | persons that are subject to the mark-to-market accounting rules under Section 475 of the Code; |
| · | governments or agencies or instrumentalities thereof; |
| · | regulated investment companies; |
| · | real estate investment trusts; |
| · | certain expatriates or former long-term residents of the United States; |
| · | persons that actually or constructively own 5% or more of our voting shares; |
| · | persons that acquired our ordinary shares pursuant to the exercise of employee options, in connection with employee incentive plans or otherwise as compensation; |
| · | persons that hold our ordinary shares as part of a straddle, constructive sale, hedging, conversion or other integrated transaction; |
| · | persons whose functional currency is not the U.S. dollar; |
| · | controlled foreign corporations; or |
| · | passive foreign investment companies. |
This discussion does not address any aspect of U.S. federal non-income tax laws, such as gift or estate tax laws or state, local or non-U.S. tax laws or, except as discussed herein, any tax reporting obligations applicable to a holder of our ordinary shares. Additionally, this discussion does not consider the tax treatment of partnerships or other pass-through entities or persons who hold our ordinary shares through such entities. If a partnership (or other entity classified as a partnership for U.S. federal income tax purposes) is the beneficial owner of our ordinary shares, the U.S. federal income tax treatment of a partner in the partnership generally will depend on the status of the partner and the activities of the partnership. This discussion also assumes that any distributions made (or deemed made) by us on our ordinary shares and any consideration received (or deemed received) by a holder in consideration for the sale or other disposition of our ordinary shares will be in U.S. dollars.
We have not sought, and will not seek, a ruling from the Internal Revenue Service (“IRS”) or an opinion of counsel as to any U.S. federal income tax consequence described herein. The IRS may disagree with the description herein, and its determination may be upheld by a court. Moreover, there can be no assurance that future legislation, regulations, administrative rulings or court decisions will not adversely affect the accuracy of the statements in this discussion.
THIS DISCUSSION IS ONLY A SUMMARY OF THE MATERIAL U.S. FEDERAL INCOME TAX CONSEQUENCES OF THE OWNERSHIP AND DISPOSITION OF OUR ORDINARY SHARES. IT IS NOT TAX ADVICE. EACH HOLDER OF OUR ORDINARY SHARES IS URGED TO CONSULT ITS OWN TAX ADVISOR WITH RESPECT TO THE PARTICULAR TAX CONSEQUENCES TO SUCH HOLDER OF THE OWNERSHIP AND DISPOSITION OF OUR ORDINARY SHARES, INCLUDING THE APPLICABILITY AND EFFECT OF ANY STATE, LOCAL, AND NON-U.S. TAX LAWS, AS WELL AS U.S. FEDERAL TAX LAWS AND ANY APPLICABLE TAX TREATIES.
U.S. Holders
Taxation of Cash Distributions Paid on Ordinary Shares
A U.S. Holder generally will be required to include in gross income as ordinary income the amount of any cash dividend paid on our ordinary shares. A cash distribution on such shares generally will be treated as a dividend for U.S. federal income tax purposes to the extent paid out of our current or accumulated earnings and profits (as determined under U.S. federal income tax principles). The portion of such cash distribution, if any, in excess of such earnings and profits generally will constitute a return of capital that will be applied against and reduce (but not below zero) the U.S. Holder’s adjusted tax basis in such ordinary shares. Any remaining excess will be treated as gain from the sale or other taxable disposition of such ordinary shares and will be treated as described under “— Taxation on the Disposition of Ordinary Shares” below.
Any cash dividends we pay to a U.S. Holder that is treated as a taxable corporation for U.S. federal income tax purposes generally will qualify for the dividends received deduction if the applicable holding period and other requirements are satisfied. With certain exceptions, if the applicable holding period and other requirements are satisfied, cash dividends we pay to a non-corporate U.S. Holder generally will constitute “qualified dividends” that will be subject to U.S. federal income tax at the maximum regular tax rate accorded to long-term capital gains.
If a PRC income tax applies to cash dividends paid to a U.S. Holder on our ordinary shares, such tax may be treated as a foreign tax eligible for a deduction from such holder’s U.S. federal taxable income or a foreign tax credit against such holder’s U.S. federal income tax liability (subject to applicable conditions and limitations). In addition, if such PRC tax applies to such dividends, such U.S. Holder may be entitled to certain benefits under the Agreement between the Government of the United States of America and the Government of the People’s Republic of China for the Avoidance of Double Taxation and the Prevention of Tax Evasion with Respect to Taxes on Income (the “U.S.-PRC Tax Treaty”), if such holder is considered a resident of the United States for purposes of, and otherwise meets the requirements of, the U.S.-PRC Tax Treaty. U.S. Holders should consult their own tax advisors regarding the deduction or credit for any such PRC tax and their eligibility for the benefits of the U.S.-PRC Tax Treaty.
Taxation on the Disposition of Ordinary Shares
Upon a sale or other taxable disposition of our ordinary shares, a U.S. Holder generally will recognize capital gain or loss in an amount equal to the difference between the amount realized and the U.S. Holder’s adjusted tax basis in such shares.
The regular U.S. federal income tax rate on capital gains recognized by U.S. Holders generally is the same as the regular U.S. federal income tax rate on ordinary income, except that long-term capital gains recognized by non-corporate U.S. Holders generally are subject to U.S. federal income tax at a maximum regular rate of 20%. Capital gain or loss will constitute long-term capital gain or loss if the U.S. Holder’s holding period for the ordinary shares disposed of exceeds one year. The deductibility of capital losses is subject to various limitations.
If a PRC income tax applies to any gain recognized on the disposition of our ordinary shares by a U.S. Holder, such tax may be treated as a foreign tax eligible for a deduction from such holder’s U.S. federal taxable income or a foreign tax credit against such holder’s U.S. federal income tax liability (subject to applicable conditions and limitations). In addition, if such PRC tax applies to any gain, such U.S. Holder may be entitled to certain benefits under the U.S.-PRC Tax Treaty, if such holder is considered a resident of the United States for purposes of, and otherwise meets the requirements of, the U.S.-PRC Tax Treaty. U.S. Holders should consult their own tax advisors regarding the deduction or credit for any such PRC tax and their eligibility for the benefits of the U.S.-PRC Tax Treaty.
Additional Taxes
U.S. Holders that are individuals, estates or trusts and whose income exceeds certain thresholds generally will be subject to a 3.8% Medicare contribution tax on unearned income, including, without limitation, dividends on, and gains from the sale or other taxable disposition of, our ordinary shares, subject to certain limitations and exceptions. U.S. Holders should consult their own tax advisors regarding the effect, if any, of such tax on their ownership and disposition of our ordinary shares.
Non-U.S. Holders
Taxation of Cash Distributions
Any cash distribution we make to a Non-U.S. Holder of our ordinary shares, to the extent paid out of our current or accumulated earnings and profits (as determined under U.S. federal income tax principles), generally will constitute a dividend for U.S. federal income tax purposes. Any such dividend paid to a Non-U.S. Holder with respect to our ordinary shares that is not effectively connected with the Non-U.S. Holder’s conduct of a trade or business within the United States, as described below, generally will be subject to U.S. federal withholding tax at a rate of 30% of the gross amount of the dividend, unless such Non-U.S. Holder is eligible for a reduced rate of withholding tax under an applicable income tax treaty and provides proper certification of its eligibility for such reduced rate (usually on an IRS Form W-8BEN). In satisfying the foregoing withholding obligation with respect to a cash distribution, we may withhold up to 30% of either (i) the gross amount of the entire distribution, even if the amount of the distribution is greater than the amount constituting a dividend, as described above, or (ii) the amount of the distribution we project will be a dividend, based upon a reasonable estimate of both our current and accumulated earnings and profits for the taxable year in which the distribution is made. If U.S. federal income tax is withheld on the amount of a distribution in excess of the amount constituting a dividend, the Non-U.S. Holder may obtain a refund of all or a portion of the excess amount withheld by timely filing a claim for refund with the IRS. Any such distribution not constituting a dividend generally will be treated, for U.S. federal income tax purposes, first as reducing the Non-U.S. Holder’s adjusted tax basis in our ordinary shares (but not below zero) and, to the extent such distribution exceeds the Non-U.S. Holder’s adjusted tax basis, as gain from the sale or other taxable disposition of such shares, which will be treated as described under “Taxation on the Disposition of Ordinary Shares” below.
Cash dividends we pay to a Non-U.S. Holder that are effectively connected with such Non-U.S. Holder’s conduct of a trade or business within the United States (and, if certain income tax treaties apply, are attributable to a permanent establishment or fixed base the Non-U.S. Holder maintains or maintained in the United States) generally will not be subject to U.S. withholding tax, provided such Non-U.S. Holder complies with certain certification and disclosure requirements (usually by providing an IRS Form W-8ECI). Instead, such dividends generally will be subject to regular U.S. federal income tax net of certain deductions, at the same regular U.S. federal income tax rates applicable to a comparable U.S. Holder. If the Non-U.S. Holder is a corporation, such dividends that are effectively connected income may also be subject to a “branch profits tax” at a rate of 30% (or such lower rate as may be specified by an applicable income tax treaty).
Taxation on the Disposition of Ordinary Shares
A Non-U.S. Holder generally will not be subject to U.S. federal income tax in respect of gain recognized on a sale or other disposition of our ordinary shares unless:
| · | the gain is effectively connected with the conduct of a trade or business by the Non-U.S. Holder within the United States (and, under certain income tax treaties, is attributable to a permanent establishment or fixed base the Non-U.S. Holder maintains or maintained in the United States); |
| · | the Non-U.S. Holder is an individual who is present in the United States for 183 days or more in the taxable year of disposition and certain other conditions are met; or |
| · | we are or have been a “United States real property holding corporation” (“USRPHC”) for U.S. federal income tax purposes at any time during the shorter of the five year period ending on the date of disposition or the Non-U.S. Holder’s holding period for such shares disposed of, and, generally, in the case where such shares are regularly traded on an established securities market, the Non-U.S. Holder has owned, directly or indirectly, more than 5% of our ordinary shares at any time during the shorter of the five year period ending on the date of disposition or the Non-U.S. Holder’s holding period for our ordinary shares disposed of. There can be no assurance that our ordinary shares will be treated as regularly traded on an established securities market for this purpose. |
Unless an applicable tax treaty provides otherwise, gain described in the first and third bullet points above generally will be subject to regular U.S. federal income tax, net of certain deductions, at the same regular U.S. federal income tax rates applicable to a comparable U.S. Holder. Any gain described in the first bullet point above of a Non-U.S. Holder that is a foreign corporation also may be subject to an additional “branch profits tax” at a 30% rate (or a lower applicable tax treaty rate). Any U.S. source capital gain of a Non-U.S. Holder described in the second bullet point above (which may be offset by U.S. source capital losses during the taxable year of the disposition) generally will be subject to a flat 30% U.S. federal income tax rate (or a lower applicable tax treaty rate).
In connection with the third bullet point above, we generally will be classified as a USRPHC if (looking through certain subsidiaries) the fair market value of our “United States real property interests” equals or exceeds 50% of the sum of the fair market value of our worldwide real property interests plus our other assets used or held for use in a trade or business, as determined for U.S. federal income tax purposes. Based on the current composition of the assets of us and our subsidiaries, we believe that we currently are not a USRPHC (although no assurance can be given that we will not become a USRPHC in the future). Non-U.S. Holders, particularly those Non-U.S. Holders that could be treated as actually or constructively holding more than 5% of our ordinary shares, should consult their own tax advisors regarding the U.S. federal income tax consequences of owning and disposing of our ordinary shares.
Payments After 2013
Certain non-U.S. Holders may be subject to a U.S. federal withholding tax at a 30% rate with respect to cash dividends on, and the gross proceeds from the sale or other disposition of, our ordinary shares if certain disclosure requirements related to the U.S. accounts maintained by, or the U.S. ownership of, the Non-U.S. Holder are not satisfied. Non-U.S. Holders should consult their own tax advisors regarding the effect, if any, of such withholding taxes on their ownership and disposition of our ordinary shares.
Information Reporting and Backup Withholding
We generally must report annually to the IRS and to each holder the amount of cash dividends and certain other distributions we pay to such holder on our ordinary shares and the amount of tax, if any, withheld with respect to those distributions. In the case of a Non-U.S. Holder, copies of the information returns reporting those distributions and withholding also may be made available to the tax authorities in the country in which the Non-U.S. Holder is a resident under the provisions of an applicable income tax treaty or agreement. Information reporting is also generally required with respect to proceeds from the sales and other dispositions of our ordinary shares to or through the U.S. office (and in certain cases, the foreign office) of a broker. Certain information concerning a U.S. Holder’s adjusted tax basis in its ordinary shares and adjustments to that tax basis and whether any gain or loss with respect to such ordinary shares is long-term or short-term also may be required to be reported to the IRS.
In addition, backup withholding of U.S. federal income tax at a rate of 28% generally will apply to distributions made on our ordinary shares to, and the proceeds from sales and other dispositions of such shares by, a U.S. Holder (other than an exempt recipient) who:
| · | fails to provide an accurate taxpayer identification number; |
| · | is notified by the IRS that backup withholding is required; or |
| · | in certain circumstances, fails to comply with applicable certification requirements. |
A Non-U.S. Holder generally may eliminate the requirement for information reporting (other than with respect to distributions, as described above) and backup withholding by providing certification of its foreign status, under penalties of perjury, on a duly executed applicable IRS Form W-8 or by otherwise establishing an exemption.
Backup withholding is not an additional tax. Rather, the amount of any backup withholding will be allowed as a credit against a U.S. Holder’s or a Non-U.S. Holder’s U.S. federal income tax liability and may entitle such holder to a refund, provided that certain required information is timely furnished to the IRS. Holders are urged to consult their own tax advisors regarding the application of backup withholding and the availability of and procedures for obtaining an exemption from backup withholding in their particular circumstances.
| F. | Dividends and paying agents |
Not required.
Not required.
Documents concerning us that are referred to in this document may be inspected at Room 10001, Tower C, Skyworth Building, High-Tech Industrial Park, Nanshan, Shenzhen 518057, PRC.
In addition, we file annual reports and other information with the Securities and Exchange Commission. We file annual reports on Form 20-F and submit other information under cover of Form 6-K. As a foreign private issuer, we are exempt from the proxy requirements of Section 14 of the Exchange Act and our officers, directors and principal shareholders are exempt from the insider short-swing disclosure and profit recovery rules of Section 16 of the Exchange Act. Annual reports and other information we file with the Commission may be inspected at the public reference facilities maintained by the Commission at Room 1024, 100 F. Street, N.E., Washington, D.C. 20549, and copies of all or any part thereof may be obtained from such offices upon payment of the prescribed fees. You may call the Commission at 1-800-SEC-0330 for further information on the operation of the public reference rooms and you can request copies of the documents upon payment of a duplicating fee, by writing to the Commission. In addition, the Commission maintains a web site that contains reports and other information regarding registrants (including us) that file electronically with the Commission which can be assessed at http://www.sec.gov.
Not required.
| ITEM 11. | QUANTITATIVE AND QUALITATIVE DISCLOSURE ABOUT MARKET RISK |
Foreign Exchange Risk
Our reporting currency is the Renminbi. Transactions in other currencies are recorded in Renminbi at the rates of exchange prevailing when the transactions occur. Monetary assets and liabilities denominated in other currencies are remeasured into Renminbi at rates of exchange in effect at the balance sheet dates. Exchange gains and losses are recorded in our statements of operations as a component of current period earnings.
SAFE under the authority of the People’s Bank of China, controls the conversion of Renminbi into foreign currencies. The principal regulation governing foreign currency exchange in the PRC is the Foreign Currency Administration Rules (1996), as amended, or the “Rules.” Under the Rules, once various procedural requirements are met, Renminbi is convertible for current account transactions, including trade and service-related foreign exchange transactions and dividend payments, but not for capital account transactions, including direct investment, loans or investments in securities outside the PRC, without prior approval of the SAFE of the PRC, or its local counterparts.
On July 21, 2005, People’s Bank of China adjusted the exchange rate of U.S. dollar to Renminbi from $1 = RMB8.27 to $1 = RMB8.11, and ceased to peg the Renminbi to the U.S. dollar. Instead, the Renminbi is pegged to a basket of currencies, which components are subject to adjustment based on changes in market supply and demand under a set of systematic principles. On September 23, 2005, the PRC government widened the daily trading band for Renminbi against non-U.S. dollar currencies from 1.5% to 3.0% to improve the flexibility of the new foreign exchange system. On June 19, 2010, the People’s Bank of China released a statement indicating that they would “proceed further with reform of RMB exchange rate regime and increase the RMB exchange rate flexibility.” Since the adoption of these measures, the value of Renminbi against the U.S. dollar has fluctuated on a daily basis within narrow ranges, but overall the Renminbi has further strengthened against the U.S. dollar. There remains significant international pressure on the PRC government to further liberalize its currency policy, which could result in a further and more significant fluctuation in the value of the Renminbi against the U.S. dollar. The Renminbi may be revalued further against the U.S. dollar or other currencies, or may be permitted to enter into a full or limited free float, which may result in an appreciation or depreciation in the value of the Renminbi against the U.S. dollar or other currencies.
We conduct substantially all of our operations through our PRC operating companies, and their financial performance and position are measured in terms of Renminbi. Our solutions are primarily procured, sold and delivered in the PRC for Renminbi. The majority of our net revenue are denominated in Renminbi.
Any devaluation of the Renminbi against the U.S. dollar would consequently have an adverse effect on our financial performance and asset values when measured in terms of U.S. dollars. On the other hand, the appreciation of the Renminbi could make our customers’ products more expensive to purchase because many of our customers are involved in the export of goods, which may have an adverse impact on their sales. A decrease in sales by our customers could have an adverse effect on our operating results. In addition, as of December 31, 2012 and 2011, we have cash denominated in U.S. dollars amounting to RMB450.4 million (USD72.3 million) and RMB469.5 million, respectively. Also, from time to time we may have U.S. dollar denominated borrowings. Accordingly, a decoupling of the Renminbi may affect our financial performance in the future.
We recognized a foreign currency translation adjustment of approximately RMB103,000 (USD17,000) for the year ended December 31, 2012. We do not currently engage in hedging activities, as such, we may in the future experience economic loss as a result of any foreign currency exchange rate fluctuations.
Interest Rate Risk
We are exposed to interest rate risk arising from short-term variable rate borrowings from time to time. Our future interest expense will fluctuate in line with any change in our borrowing rates. We do not have any derivative financial instruments and believe our exposure to interest rate risk and other relevant market risks is not material. Our bank borrowings amounted to RMB614.0 million (USD98.6 million) as of December 31, 2012. Based on the variable nature of the underlying interest rate, the bank borrowings approximated fair value at that date.
If there was a hypothetical 1% change in interest rates, the net impact to earnings and cash flows would be approximately RMB6 million (USD1.0 million). The potential change in cash flows and earning is calculated based on the change in the net interest expense over a one year period due to an immediate 1% change in price.
Inflation
In recent years, the PRC has not experienced significant inflation, and thus inflation has not had a material impact on our results of operations.
| ITEM 12. | DESCRIPTION OF SECURITIES OTHER THAN EQUITY SECURITIES |
Not required.
PART II.
| ITEM 13. | DEFAULTS, DIVIDEND ARREARAGES AND DELINQUENCIES |
There has been no default of any indebtedness nor is there any arrearage in the payment of dividends.
| ITEM 14. | MATERIAL MODIFICATIONS TO THE RIGHTS OF SECURITY HOLDERS AND USE OF PROCEEDS |
On August 4, 2011, Cogo Group, Inc., then a Maryland corporation, merged with and into its indirect wholly owned subsidiary, Cogo Group, Inc., a Cayman Islands company (then known as Cogo Group Cayman, Inc.), resulting in the redomestication of Cogo Group, Inc. to the Cayman Islands. At the time of the merger, each outstanding share of common stock of Cogo Maryland converted automatically into one ordinary share of the Cayman Islands entity. Accordingly, our ordinary shares became governed by our memorandum and articles of association and the laws of the Cayman Islands. The rights and duties attaching to each share remained substantially equivalent. For a detailed comparison of the laws of Maryland and the laws of the Cayman Islands, as well as a comparison of stockholder rights in each such jurisdiction, you may refer to the section titled “Comparison of Stockholder Rights” in our Registration Statement on Form F-4 initially filed with the SEC on May 2, 2011 (File No.: 333-173844), which section is incorporated herein by reference.
OnMay16, 2012, in connection with the implementation of our share repurchase program of up to 10 million of ours outstanding ordinary shares, we amended our articles of association to revise Article 13(b) to remove the requirement to obtain shareholder approval to make repurchases of our outstanding shares. The removal of this requirement brings our articles of association in line with many other U.S. public companies, which, generally, are not required to seek shareholder approval to effect a repurchase of outstanding shares, and gives the board of directors the discretion to determine the manner and terms of any repurchase of shares when the board determines that it is in our best interests and the best interests of our shareholders to do so.
There are no restrictions on working capital and no removal or substitution of assets securing any class of our registered securities.
| ITEM 15. | CONTROLS AND PROCEDURES |
Evaluation of Disclosure Controls and Procedures
Based on an evaluation under the supervision of and with the participation of our management, including our Chief Executive Officer and Chief Financial Officer have concluded that our disclosure controls and procedures as defined in Rules 13a-15(e) and 15d-15(e) under the Exchange Act were effective as of December 31, 2012.
Disclosure controls and procedures are designed to provide reasonable assurance that information required to be disclosed by us in reports that we file or submit under the Exchange Act is (i) recorded, processed, summarized and reported within the time periods specified in the Securities and Exchange Commission rules and forms and (ii) accumulated and communicated to our management, including our Chief Executive Officer and Chief Financial Officer, as appropriate to allow timely decisions regarding required disclosure.
Inherent Limitations Over Internal Controls
Our internal control over financial reporting is designed to provide reasonable assurance regarding the reliability of financial reporting and the preparation of financial statements for external purposes in accordance with U.S. GAAP. Our internal control over financial reporting includes those policies and procedures that:
(i) pertain to the maintenance of records that, in reasonable detail, accurately and fairly reflect the transactions and dispositions of the Company’s assets;
(ii) provide reasonable assurance that transactions are recorded as necessary to permit preparation of financial statements in accordance with U.S. GAAP, and that our receipts and expenditures are being made only in accordance with authorizations of our management and directors; and
(iii) provide reasonable assurance regarding prevention or timely detection of unauthorized acquisition, use, or disposition of our assets that could have a material effect on the financial statements.
Management, including our Chief Executive Officer and Chief Financial Officer, does not expect that our internal controls will prevent or detect all errors and all fraud. A control system, no matter how well designed and operated, can provide only reasonable, not absolute, assurance that the objectives of the control system are met. Further, the design of a control system must reflect the fact that there are resource constraints, and the benefits of controls must be considered relative to their costs. Because of the inherent limitations in all control systems, no evaluation of internal controls can provide absolute assurance that all control issues and instances of fraud, if any, have been detected. Also, any evaluation of the effectiveness of controls in future periods are subject to the risk that those internal controls may become inadequate because of changes in business conditions, or that the degree of compliance with the policies or procedures may deteriorate.
Management’s Report on Internal Control Over Financial Reporting
Our management is responsible for establishing and maintaining adequate “internal control over financial reporting” (as defined in Rule 13a-15(f) under the Securities Exchange Act of 1934) for Cogo Group, Inc. and its subsidiaries. Our internal control over financial reporting is a process designed under the supervision of the Chief Executive Officer and Chief Financial Officer to provide reasonable assurance regarding the reliability of financial reporting and the preparation of our financial statements for external reporting purposes in accordance with U.S. generally accepted accounting principles. A company’s internal control over financial reporting includes policies and procedures that: (1) pertain to the maintenance of records that accurately and fairly reflect, in reasonable detail, transactions and dispositions of our assets; (2) provide reasonable assurance that transactions are recorded as necessary to permit preparation of financial statements in accordance with U.S. generally accepted accounting principles and that receipts and expenditures are being made only in accordance with authorizations of management and the directors of the Company; and (3) provide reasonable assurance regarding the prevention or timely detection of unauthorized acquisition, use, or disposition of our assets that could have a material effect on our financial statements.
Because of its inherent limitations, internal control over financial reporting cannot provide absolute assurance of achieving financial reporting objectives. Also, projections of any evaluation of effectiveness to future periods are subject to the risk that controls may become inadequate because of changes in conditions, or that the degree of compliance with policies or procedures may deteriorate.
Under the supervision of and with the participation of our management, including the Chief Executive Officer and Chief Financial Officer, management evaluated the effectiveness of Cogo’s internal control over financial reporting as of December 31, 2012. In its evaluation, management used the criteria set forth by the Committee of Sponsoring Organizations of the Treadway Commission (COSO) in Internal Control-Integrated Framework.
Based on our assessment and the criteria described above, management has concluded that, our internal control over financial reporting was effective as of December 31, 2012.
This annual report does not include an attestation report of our independent registered public accounting firm regarding internal control over financial reporting. Management's report was not subject to attestation by our independent registered public accounting firm pursuant to rules of the Securities and Exchange Commission that permit us to provide only management's report in this Annual Report.
Changes in Internal Control Over Financial Reporting
There were no changes in our internal control over financial reporting during the period covered by this report, which were identified in connection with management’s evaluation required by paragraph (d) of rules 13a-15 and 15d-15 under the Exchange Act, that have materially affected, or are reasonably likely to materially affect, our internal control over financial reporting.
| ITEM 16A. | AUDIT COMMITTEE FINANCIAL EXPERT |
Our board of directors has determined that JP Gan, the chairperson of the audit committee through December 22, 2011, is an “audit committee financial expert” as defined by the SEC’s rules and “independent” as that term is defined in Item 16A(b) of Form 20-F and the NASDAQ listing standards. Our board of directors has determined that Dr. Nathan Zhang, who replaced JP Gan on the board of directors in December 2011, is an “audit committee financial expert” as defined by the SEC’s rules and “independent” as that term is defined in Item 16A(b) of Form 20-F and the NASDAQ listing standards..
On November 4, 2004, we adopted a Code of Business Conduct and Ethics that applies to our directors, officers and employees, including our chief executive officer and chief financial officer—our principal executive officer and principal financial and accounting officer, respectively. A copy of our Code of Business Conduct and Ethics is available on the Investor Information page of our website, http://www.cogo.com.cn/investorinfo_coe.html.
| ITEM 16C. | PRINCIPAL ACCOUNTANT FEES AND SERVICES |
Audit Fees
The following table presents the aggregate fees for professional services and other services rendered by our principal accountant to us in 2012 and 2011.
| | | Years ended December 31, | |
| | | 2012 | | | 2011 | |
| | | Amount (in millions) | |
| Audit fees (1) | | RMB | 4.1 | | | RMB | 3.8 | |
| Audit related fees (2) | | | — | | | | 0.7 | |
| Tax fees | | | — | | | | — | |
| All other fees (3) | | | 0.1 | | | | — | |
| Total | | RMB | 4.2 | | | RMB | 4.5 | |
| (1) | Audit fees consist of fees billed for the professional services rendered for the audit of our consolidated financial statements for each of these fiscal years and the review of the interim financial statements for the fiscal years ended December 31, 2012 and December 31, 2011, respectively. |
| (2) | Audit-related fees consist of services by KPMG that are reasonably related to the performance of the audit or review of our financial statements and are not reported above under Audit Fees. |
| (3) | All other fees means the aggregate fees billed in each of the fiscal years listed for products and services provided by our principal auditors that are not reported under “Audit fees”. Services comprising the fees disclosed under the category of “All other fees” involve principally the provision of professional services for the assistance to our reply to SEC comment letter. |
We are required to obtain pre-approval by our audit committee for all audit and permitted non-audit services performed by our independent auditors. In accordance with this requirement, during fiscal 2012 and 2011, 100% of all audit, audit-related, tax and other services performed by KPMG were approved in advance by the audit committee. Any pre-approved decisions are presented to the full audit committee at the next scheduled meeting. .
Audit of Financial Statements
During fiscal 2011 and 2012, KPMG was our principal auditor and no work was performed by persons outside of this firm.
| ITEM 16D. | EXEMPTIONS FROM THE LISTING STANDARDS FOR AUDIT COMMITTEES |
None.
| ITEM 16E. | PURCHASES OF EQUITY SECURITIES BY THE ISSUER AND AFFILIATED PURCHASERS |
Pursuant to our approved stock purchase program, we made the following purchases of our equity securities in 2012:
| | | Issuer Purchase of Equity Securities | |
| | | (a) Total Number
of Shares
Purchased | | | (b) Average Price
Paid per Share | | | (c) Total Number
of Shares
Purchased as Part
of Publicly
Announced Plans
or Programs(1) | | | (d) Maximum
Number (or
Approximate
Dollar Value) of
Shares that may
yet be Purchased
under the Plans or
Program | |
| Period | | | | | | | | | | | | | | | | |
| September 1 through September 30, 2012 | | | 38,935 | | | $ | 2.0898 | | | | 38,935 | | | | 9,961,065 | |
| October 1 through October 31, 2012 | | | 239,617 | | | $ | 2.2581 | | | | 239,617 | | | | 9,721,448 | |
| November 1 through November 30, 2012 | | | 134,113 | | | $ | 2.4777 | | | | 134,113 | | | | 9,587,335 | |
| December 1 through December 31, 2012 | | | 3,151,151 | | | $ | 2.1794 | | | | 3,151,151 | | | | 6,436,184 | |
| Total | | | 3,563,816 | | | $ | 2.1949 | | | | 3,563,816 | | | | 6,436,184 | |
(1) On September 23, 2012, we announced that we would begin executing a 10 million-share repurchase program on the open market. Such repurchase program was approved our board of directors on March 14, 2012 and by our shareholders in May 2012.
| ITEM 16F. | CHANGES IN REGISTRANT’S CERTIFYING ACCOUNTANT |
Not applicable.
| ITEM 16G. | CORPORATE GOVERNANCE |
There are no material differences in our corporate governance practices from those of U.S. domestic companies under the listing standards of the Nasdaq Stock Market, LLC. We did not make use of any exemptions from the corporate governance standards set forth in the Nasdaq Listing Rules.
PART III.
| ITEM 19. | FINANCIAL STATEMENTS |
We have elected to provide financial statements pursuant to Item 18.
| ITEM 20. | FINANCIAL STATEMENTS |
The financial statements are filed as part of this Annual Report beginning on page F-1.
| Exhibit No. | | Description | |
| 1.1 | | Memorandum of Association of Cogo Group, Inc. (Incorporated by reference to Annex A of the proxy statement/prospectus filed with the Commission on June 9, 2011) | |
| 1.2 | | Amended and Restated Articles of Association of Cogo Group, Inc. (Incorporated by reference to Annex I of Exhibit 99.1 to the Report of Foreign Private Issuer on Form 6-K filed with the Commission on April 23, 2012) | |
| 1.3 | | Certificate of Incorporation on Change of Name, dated July 25, 2011* | |
| 1.4 | | Certificate of Merger, dated August 3, 2011* | |
| 2.1 | | Specimen Ordinary Share Certificate (Incorporated by reference to Exhibit 4.1 of the registration statement on Form F-4 filed with the Commission on May 27, 2011) | |
| 4.1 | | Plan of Merger (Incorporated by reference to Annex C of the proxy statement/prospectus filed with the Securities and Exchange Commission on June 9, 2011) |
| 4.2 | | Shareholders Agreement, dated July 23, 2004 (Incorporated by reference to Exhibit 4.1 of the Form 8-K filed with the Commission on July 22, 2004) |
| 4.3 | | Facility Letter by and between Bank of China and Comtech Broadband Corporation Limited, Comtech International (Hong Kong) Limited, Keen Awards Limited and Hong Kong JJT Limited, dated March 19, 2010. (Incorporated by reference to the Current Report on Form 8-K filed with the Commission on April 29, 2010) |
| 4.4 | | Factoring Agreement by and between Bank of China (Hong Kong) Limited and Comtech Broadband Corporation Limited, dated April 28, 2010 (Incorporated by reference to the Current Report on Form 8-K filed with the Commission on April 29, 2010) |
| 4.5 | | Amendment to the Factoring Agreement by and between Bank of China (Hong Kong) Limited and Comtech Broadband Corporation Limited, dated October 13, 2010 (Incorporated by reference to the Current Report on Form 8-K filed with the Commission on January 3, 2011) |
| 4.6 | | Confirmation Letter of Bank of China (Hong Kong) Limited, dated April 23, 2010 (Incorporated by reference to the Current Report on Form 8-K filed with the Commission on April 29, 2010) |
| 4.7 | | Confirmation Letter of Bank of China (Hong Kong) Limited, dated April 28, 2010 (Incorporated by reference to the Current Report on Form 8-K filed with the Commission on April 29, 2010) |
| Exhibit No. | | Description |
| 4.8 | | General Terms and Conditions for Banking Facilities (Incorporated by reference to the Current Report on Form 8-K filed with the Commission on April 29, 2010) |
| 4.9 | | General Banking Facility Letter dated July 4, 2011 (Incorporated by reference to the Current Report on Form 8-K filed with the Commission on July 20, 2011) |
| 4.10 | | General Terms and Conditions for General Banking Facilities and Loan Facilities dated July 4, 2011 (Incorporated by reference to the Current Report on Form 8-K filed with the Commission on July 20, 2011) |
| 4.11 | | Cross Guarantee (Incorporated by reference to the Current Report on Form 8-K filed with the Commission on July 20, 2011) |
| 4.12 | | Confirmation Letter dated July 15, 2011 (Incorporated by reference to the Current Report on Form 8-K filed with the Commission on July 20, 2011) |
| 4.13 | | Confirmation Letter of Standard Chartered Bank (Hong Kong) Limited, dated July 6, 2010. (Incorporated by reference to the Current Report on Form 8-K filed with the Commission on July 9, 2010) |
| 4.14 | | Facility Letter by and among Standard Chartered Bank (Hong Kong) Limited, Comtech International (Hong Kong) Limited, Keen Awards Limited and Comtech Broadband Corporation Limited, dated February 22, 2010 (Incorporated by reference to the Current Report on Form 8-K filed with the Commission on July 9, 2010) |
| 4.15 | | Facility Letter by and among Standard Chartered Bank (Hong Kong) Limited, Comtech International (Hong Kong) Limited, Keen Awards Limited and Comtech Broadband Corporation Limited, dated February 22, 2010 (Incorporated by reference to the Current Report on Form 8-K filed with the Commission on July 9, 2010) |
| 4.16 | | Facility Letter by and between Comtech International (Hong Kong) Limited and Hong Kong Branch of China Merchants Bank, dated October 8, 2010 (Incorporated by reference to the Current Report on Form 8-K filed with the Commission on October 20, 2010) |
| 4.17 | | Form of General Commercial Agreement (Incorporated by reference to the Current Report on Form 8-K filed with the Commission on October 20, 2010) |
| 4.18 | | Form of Credit Amount Contract by and between Comtech International (Hong Kong) Limited and Macau Branch of Guangdong Development Bank, dated December 10, 2010 (Incorporated by reference to the Current Report on Form 8-K filed with the Commission on December 15, 2010) |
| 4.19 | | Form of Credit Amount Contract by and between Comtech Broadband Limited and Macau Branch of Guangdong Development Bank, dated December 10, 2010 (Incorporated by reference to the Current Report on Form 8-K filed with the Commission on December 15, 2010) |
| 4.20 | | Form of Credit Facility Agreement by and between Comtech Communication Technology (Shenzhen) Company Limited and Shenzhen Branch of Guangdong Development Bank, dated December 7, 2010 (Incorporated by reference to the Current Report on Form 8-K filed with the Commission on December 15, 2010) |
| 4.21 | | Form of Maximum Amount Rights Pledge Contract by and between Comtech Communication Technology (Shenzhen) Company Limited and Shenzhen Branch of Guangdong Development Bank, dated December 7, 2010 (Incorporated by reference to the Current Report on Form 8-K filed with the Commission on December 15, 2010) |
| 4.22 | | Form of Maximum Amount Rights Pledge Contract by and between Comtech Software Technology (Shenzhen) Company Limited and Shenzhen Branch of Guangdong Development Bank, dated December 7, 2010 (Incorporated by reference to the Current Report on Form 8-K filed with the Commission on December 15, 2010) |
| 4.23 | | Amendment to the Factoring Agreement by and between Bank of China (Hong Kong) Limited and Comtech Broadband Corporation Limited, dated October 13, 2010 (Incorporated by reference to the Current Report on Form 8-K filed with the Commission on January 3, 2011) |
| 4.24 | | Credit Facility Agreement with Standard Chartered Bank (Hong Kong) Limited dated February 11, 2011 (Incorporated by reference to the Current Report on Form 8-K filed with the Commission on May 16, 2011) |
| 4.25 | | Letter from Standard Chartered Bank (Hong Kong) Limited confirming the availability of the Credit Facility as of May 11, 2011. (Incorporated by reference to the Current Report on Form 8-K filed with the Commission on May 16, 2011) |
| Exhibit No. | | Description |
| 4.26 | | Credit Facility Agreement by and between Guangdong Development Bank and Shenzhen Comtech International Electronics Co., Ltd., dated July 14, 2011 (Incorporated by reference to the Current Report on Form 8-K filed with the Commission on July 21, 2011) |
| 4.27 | | Credit Facility Agreement by and between Guangdong Development Bank and Comtech Communications Technology (Shenzhen) Co., Ltd., dated July 14, 2011 (Incorporated by reference to the Current Report on Form 8-K filed with the Commission on July 21, 2011) |
| 4.28 | | Domestic Letter of Credit-Trade Finance Credit Facility Contract by and between Guangdong Development Bank and Shenzhen Comtech International Electronics Co., Ltd., dated July 14, 2011 (Incorporated by reference to the Current Report on Form 8-K filed with the Commission on July 21, 2011) |
| 4.29 | | Domestic Letter of Credit-Trade Finance Credit Facility Contract by and between Guangdong Development Bank and Comtech Communications Technology (Shenzhen) Co., Ltd., dated July 14, 2011 (Incorporated by reference to the Current Report on Form 8-K filed with the Commission on July 21, 2011) |
| 4.30 | | Maximum Guarantee Contract by and between Guangdong Development Bank and Comtech Software Technology (Shenzhen) Co. Ltd., dated July 14, 2011 (Incorporated by reference to the Current Report on Form 8-K filed with the Commission on July 21, 2011) |
| 4.31 | | Credit Facility Agreement with HSBC dated May 18, 2011 (Incorporated by reference to the Report of Foreign Private Issuer on Form 6-K filed with the Commission on November 1, 2011) |
| 4.32 | | Letter from HSBC confirming the availability of the Credit Facility as of October 25, 2011 (Incorporated by reference to the Report of Foreign Private Issuer on Form 6-K filed with the Commission on November 11, 2011) |
| 4.33 | | Land Use Rights Agreement dated August 18, 2011 (Incorporated by reference to Exhibit 4.33 of our Annual Report on Form 20-F filed with the Commission on April 2, 2012) |
| 4.34 | | Employment Agreement of Jeffrey Kang dated as of January 2011 (Incorporated by reference to Exhibit 4.34 of our Annual Report on Form 20-F filed with the Commission on April 2, 2012) |
| 4.35 | | Employment Agreement of Yi Yuan dated as of March 2011 (Incorporated by reference to Exhibit 4.35 of our Annual Report on Form 20-F filed with the Commission on April 2, 2012) |
| 4.36 | | Employment Agreement of Frank Zheng dated as of January 2011 (Incorporated by reference to Exhibit 4.36 of our Annual Report on Form 20-F filed with the Commission on April 2, 2012) |
| 4.37 | | Amendment, dated December 19, 2011, to Factoring Agreement by and between Bank of China (Hong Kong) Limited and Comtech Broadband Corporation Limited, effective March 2, 2012, as further amended March 6, 2012 (Incorporated by reference to the Report of Foreign Private Issuer on Form 6-K filed with the Commission on March 15, 2012) |
| 4.38 | | Cross Guaranty of Comtech Broadband Corporation Limited and Comtech International (Hong Kong) Limited (Incorporated by reference to the Report of Foreign Private Issuer on Form 6-K filed with the Commission on March 15, 2012) |
| 4.39 | | Confirmation Letter of Bank of China (Hong Kong) Limited, dated March 2, 2012 (Incorporated by reference to the Report of Foreign Private Issuer on Form 6-K filed with the Commission on March 15, 2012) |
| 4.40 | | Sale and Purchase Agreement dated October 23, 2012 (Incorporated by reference to the Report of Foreign Private Issuer on Form 6-K filed with the Commission on October 31, 2012) |
| 4.41 | | Services Agreement dated November 14, 2012, by and between Cogo Group, Inc. and Envision Global Group.* |
| 4.42 | | Letter from the Hongkong and Shanghai Banking Corporation Limited confirming the availability of the Credit Facility as of December 4, 2012 (Incorporated by reference to the Report of Foreign Private Issuer on Form 6-K filed with the Commission on December 11, 2012) |
| 4.43 | | Deed Concerning Shares of Shenzhen Comtech International Ltd, dated July 14, 2005, among Huimo Chen, Nan Ji and Comtech (China) Holding Ltd.* |
| 4.44 | | Deed Concerning Shares of Shanghai E & T System Company Limited, dated December 12, 2006, among Honghui Li and Comtech (China) Holding Ltd. (Incorporated by reference to our Annual Report on Form 10-K filed with the Commission on March 16, 2007) |
| 4.45 | | Deed Concerning Shares of Shenzhen Comtech International Ltd, dated December 12, 2006, among Jeffrey (Jingwei) Kang, Honghui Li and Comtech (China) Holding Ltd. (Incorporated by reference to our Annual Report on Form 10-K filed with the Commission on March 16, 2007) |
| Exhibit No. | | Description |
| 4.46 | | Deed Concerning Shares of Shenzhen Comtech International Ltd, dated November 14, 2012, among Honghui Li, Reliable Group Limited and Comtech (China) Holding Ltd.* |
| 4.47 | | Deed Concerning Shares of Shenzhen Comtech International Ltd, dated November 14, 2012, among Huimo Chen, Reliable Group Limited and Nan Ji* |
| 4.48 | | Deed Concerning Shares of Shanghai Comtech Electronic Technology Company Ltd, dated November 14, 2012, among Comtech (China) Holding Ltd. and MDC Tech Inc. Limited* |
| 4.49 | | Cogo Group, Inc. 2009 Omnibus Securities and Incentive Plan (Incorporated by reference to Exhibit A of our proxy statement filed with the Commission on November 24, 2009) |
| 8.1 | | List of Subsidiaries* |
| 11.1 | | Code of Business Conduct and Ethics (Incorporated by reference to Exhibit 14.1 to our Form 10-K for the year ended December 31, 2004 filed on March 31, 2005) |
| 12.1 | | Certification of the Chief Executive Officer (Principal Executive Officer) pursuant to Rule 13a-14(a) of the Securities Exchange Act, as amended* |
| 12.2 | | Certification of the Chief Financial Officer (Principal Financial Officer) pursuant to Rule 13a-14(a) of the Securities Exchange Act, as amended* |
| 13.1 | | Certification of the Chief Executive Officer and Chief Financial Officer pursuant to 80 U.S.C. 1350, as adopted pursuant to Section 906 of the Sarbanes-Oxley Act of 2002* |
| 15.1 | | Consent of KPMG, an independent registered public accounting firm* |
| 101.1 | | The following financial information from Cogo Group’s Annual Report on Form 20-F for the year ended December 31, 2012, formatted in Extensible Business Reporting Language (XBRL): (i) Consolidated Balance Sheets as of December 31, 2012 and 2011, (ii) Consolidated Statements of Comprehensive Income/(Loss) for the years ended December 31, 2012, 2011 and 2010, (iii) Consolidated Statements of Changes in Equity for the years ended December 31, 2012, 2011 and 2010, (iv) the Consolidated Statements of Cash Flows for the years ended December 31, 2012, 2011 and 2010, and (iv) Notes to Consolidated Financial Statements* |
*Filed Herewith.
SIGNATURES
The Registrant hereby certifies that it meets all of the requirements for filing on Form 20-F and that it has duly caused and authorized the undersigned to sign this annual report on its behalf.
| | COGO GROUP, INC. |
| | |
| April 30, 2013 | By: | /s/ Jeffrey Kang |
| | | Name: Jeffrey Kang |
| | | Title: Chief Executive Officer (Principal Executive Officer) |
| | | |
| April 30, 2013 | By: | /s/ Andy Liu |
| | | Name: Andy Liu |
| | | Title: Chief Financial Officer (Principal Financial Officer) |
INDEX TO CONSOLIDATED FINANCIAL STATEMENTS
| REPORT OF INDEPENDENT REGISTERED PUBLIC ACCOUNTING FIRM | F-2 |
| | |
| CONSOLIDATED BALANCE SHEETS AS OF DECEMBER 31, 2012 AND 2011 | F-3 |
| | |
| CONSOLIDATED STATEMENTS OF COMPREHENSIVE INCOME / (LOSS) FOR THE YEARS ENDED DECEMBER 31, 2012, 2011 AND 2010 | F-4 |
| | |
| CONSOLIDATED STATEMENTS OF CHANGES IN EQUITY FOR THE YEARS ENDED DECEMBER 31, 2012, 2011 AND 2010 | F-5 |
| | |
| CONSOLIDATED STATEMENTS OF CASH FLOWS FOR THE YEARS ENDED DECEMBER 31, 2012, 2011 AND 2010 | F-6 |
| | |
| NOTES TO CONSOLIDATED FINANCIAL STATEMENTS | F-7 |
Report of Independent Registered Public Accounting Firm
The Board of Directors and Stockholders of
Cogo Group, Inc.:
We have audited the accompanying consolidated balance sheets of Cogo Group, Inc. (the “Company”) and subsidiaries (collectively, the “Group”) as of December 31, 2012 and 2011, and the related consolidated statements of comprehensive income / (loss), changes in equity, and cash flows for each of the years in the three-year period ended December 31, 2012. These consolidated financial statements are the responsibility of the Company’s management. Our responsibility is to express an opinion on these consolidated financial statements based on our audits.
We conducted our audits in accordance with the standards of the Public Company Accounting Oversight Board (United States). Those standards require that we plan and perform the audit to obtain reasonable assurance about whether the financial statements are free of material misstatement. An audit includes examining, on a test basis, evidence supporting the amounts and disclosures in the financial statements. An audit also includes assessing the accounting principles used and significant estimates made by management, as well as evaluating the overall financial statement presentation. We believe that our audits provide a reasonable basis for our opinion.
In our opinion, the consolidated financial statements referred to above present fairly, in all material respects, the financial position of Cogo Group, Inc. and subsidiaries as of December 31, 2012 and 2011, and the results of their operations and their cash flows for each of the years in the three-year period ended December 31, 2012, in conformity with U.S. generally accepted accounting principles.
As discussed in Note 1(b) to the consolidated financial statements, the Group completed the redomestication merger of the Company, a Cayman Islands corporation, and Cogo Group, Inc., a Maryland corporation (“Cogo Maryland”) and the Company’s predecessor, on August 4, 2011. The consolidated financial position, results of operations and cash flows for all periods presented prior to August 4, 2011 relate to those of Cogo Maryland.
The accompanying consolidated financial statements as of and for the year ended December 31, 2012 have been translated into United States dollars solely for the convenience of the reader. We have audited the translation and, in our opinion, such consolidated financial statements expressed in Renminbi have been translated into United States dollars on the basis set forth in Note 2(c) to the consolidated financial statements.
/s/KPMG
Hong Kong, China
April 30, 2013
COGO GROUP, INC.
CONSOLIDATED BALANCE SHEETS
(in thousands, except share data)
| | | | | December 31, | |
| | | Note | | 2012 | | | 2012 | | | 2011 | |
| | | | | USD | | | RMB | | | RMB | |
| ASSETS | | | | | | | | | | | | | | |
| Current assets: | | | | | | | | | | | | | | |
| Cash | | | | | 52,140 | | | | 324,839 | | | | 572,364 | |
| Pledged bank deposits | | 9 | | | 89,395 | | | | 556,941 | | | | 431,695 | |
| Accounts receivable, net | | 3 | | | 113,155 | | | | 704,968 | | | | 941,798 | |
| Bills receivable | | 4 | | | 4,486 | | | | 27,945 | | | | 39,889 | |
| Amount due from related party | | 18 | | | 5,737 | | | | 35,743 | | | | — | |
| Inventories | | 5 | | | 82,883 | | | | 516,372 | | | | 327,482 | |
| Income taxes receivable | | | | | 337 | | | | 2,098 | | | | 1,932 | |
| Prepaid expenses and other receivables | | | | | 9,032 | | | | 56,266 | | | | 51,507 | |
| | | | | | | | | | | | | | | |
| Total current assets | | | | | 357,165 | | | | 2,225,172 | | | | 2,366,667 | |
| | | | | | | | | | | | | | | |
| Property and equipment, net | | 6 | | | 2,811 | | | | 17,515 | | | | 17,891 | |
| Intangible assets, net | | 8 | | | 20,675 | | | | 128,810 | | | | 154,105 | |
| Other assets | | | | | 42 | | | | 261 | | | | 21,325 | |
| | | | | | | | | | | | | | | |
| TOTAL ASSETS | | | | | 380,693 | | | | 2,371,758 | | | | 2,559,988 | |
| | | | | | | | | | | | | | | |
| LIABILITIES AND EQUITY | | | | | | | | | | | | | | |
| | | | | | | | | | | | | | | |
| Current liabilities: | | | | | | | | | | | | | | |
| Accounts payable | | | | | 16,513 | | | | 102,878 | | | | 121,538 | |
| Bank borrowings | | 9 | | | 98,561 | | | | 614,045 | | | | 854,234 | |
| Income taxes payable | | | | | 1,148 | | | | 7,155 | | | | 16,046 | |
| Accrued expenses and other liabilities | | 11 | | | 5,735 | | | | 35,734 | | | | 22,593 | |
| | | | | | | | | | | | | | | |
| Total current liabilities | | | | | 121,957 | | | | 759,812 | | | | 1,014,411 | |
| Deferred tax liabilities | | 10 | | | 3,412 | | | | 21,254 | | | | 25,427 | |
| | | | | | | | | | | | | | | |
| Total liabilities | | | | | 125,369 | | | | 781,066 | | | | 1,039,838 | |
| Equity: | | | | | | | | | | | | | | |
| Common stock | | | | | | | | | | | | | | |
| Par value: USD0.01 | | | | | | | | | | | | | | |
| Authorized: 200,000,000 shares | | | | | | | | | | | | | | |
| Issued: 43,423,556 shares in 2012 and 42,309,285 shares in 2011 | | | | | | | | | | | | | | |
| Outstanding: 31,110,922 shares in 2012 and 33,560,467 shares in 2011 | | | | | 547 | | | | 3,409 | | | | 3,340 | |
| Additional paid in capital | | | | | 232,484 | | | | 1,448,396 | | | | 1,382,521 | |
| Retained earnings | | | | | 93,797 | | | | 584,364 | | | | 560,234 | |
| Accumulated other comprehensive loss | | | | | (19,665 | ) | | | (122,513 | ) | | | (128,254 | ) |
| | | | | | 307,163 | | | | 1,913,656 | | | | 1,817,841 | |
| Less cost of common stock in treasury, 12,312,634 shares in 2012 and 8,748,818 shares in 2011 | | | | | (59,263 | ) | | | (369,217 | ) | | | (320,025 | ) |
| | | | | | | | | | | | | | | |
| Total Cogo Group, Inc. equity | | | | | 247,900 | | | | 1,544,439 | | | | 1,497,816 | |
| Noncontrolling interests | | | | | 7,424 | | | | 46,253 | | | | 22,334 | |
| | | | | | | | | | | | | | | |
| Total equity | | | | | 255,324 | | | | 1,590,692 | | | | 1,520,150 | |
| | | | | | | | | | | | | | | |
| Commitments and contingencies | | 16 | | | — | | | | — | | | | — | |
| | | | | | | | | | | | | | | |
| TOTAL LIABILITIES AND EQUITY | | | | | 380,693 | | | | 2,371,758 | | | | 2,559,988 | |
See accompanying notes to consolidated financial statements.
COGO GROUP, INC.
CONSOLIDATED STATEMENTS OF COMPREHENSIVE INCOME / (LOSS)
(in thousands, except share data)
| | | | | Year ended December 31, | |
| | | Note | | 2012 | | | 2012 | | | 2011 | | | 2010 | |
| | | | | USD | | | RMB | | | RMB | | | RMB | |
| Net revenue | | | | | | | | | | | | | | | | | | |
| Product sales | | 14 | | | 785,003 | | | | 4,890,649 | | | | 3,554,401 | | | | 2,554,991 | |
| Service revenue | | 14 | | | — | | | | — | | | | — | | | | 34,527 | |
| | | | | | | | | | | | | | | | | | | |
| | | | | | 785,003 | | | | 4,890,649 | | | | 3,554,401 | | | | 2,589,518 | |
| Cost of sales | | | | | | | | | | | | | | | | | | |
| Cost of goods sold | | | | | (733,036 | ) | | | (4,566,886 | ) | | | (3,157,009 | ) | | | (2,194,901 | ) |
| Cost of services | | | | | — | | | | — | | | | — | | | | (27,971 | ) |
| | | | | | (733,036 | ) | | | (4,566,886 | ) | | | (3,157,009 | ) | | | (2,222,872 | ) |
| Gross profit | | | | | 51,967 | | | | 323,763 | | | | 397,392 | | | | 366,646 | |
| Selling, general and administrative expenses | | | | | (25,421 | ) | | | (158,377 | ) | | | (188,083 | ) | | | (191,855 | ) |
| Research and development expenses | | | | | (16,457 | ) | | | (102,531 | ) | | | (101,639 | ) | | | (77,888 | ) |
| Provision for doubtful accounts | | 3 | | | — | | | | — | | | | (2,325 | ) | | | (2 | ) |
| Net gain on settlement relating to the acquisition of Long Rise before goodwill impairment | | 7 (c) | | | — | | | | — | | | | — | | | | 43,676 | |
| Impairment loss of goodwill | | 8 | | | — | | | | — | | | | (236,945 | ) | | | (21,422 | ) |
| Other operating income / (loss), net | | | | | 569 | | | | 3,546 | | | | (842 | ) | | | 463 | |
| Income / (loss) from operations | | | | | 10,658 | | | | 66,401 | | | | (132,442 | ) | | | 119,618 | |
| Gain on disposal of subsidiaries | | 7 (a) | | | 90 | | | | 558 | | | | — | | | | — | |
| Interest expense | | | | | (4,186 | ) | | | (26,081 | ) | | | (20,152 | ) | | | (9,407 | ) |
| Interest income | | | | | 2,194 | | | | 13,668 | | | | 14,928 | | | | 14,693 | |
| Earnings / (loss) before income taxes | | | | | 8,756 | | | | 54,546 | | | | (137,666 | ) | | | 124,904 | |
| Income tax expense | | 10 | | | (937 | ) | | | (5,839 | ) | | | (11,553 | ) | | | (11,849 | ) |
| Net income / (loss) | | | | | 7,819 | | | | 48,707 | | | | (149,219 | ) | | | 113,055 | |
| Less net income attributable to noncontrolling interests | | | | | (3,945 | ) | | | (24,577 | ) | | | (7,386 | ) | | | (680 | ) |
| Net income / (loss) attributable to Cogo Group, Inc. | | | | | 3,874 | | | | 24,130 | | | | (156,605 | ) | | | 112,375 | |
| Earnings / (loss) per share attributable to Cogo Group, Inc. | | | | | | | | | | | | | | | | | | |
| Basic: | | 13 | | | 0.11 | | | | 0.66 | | | | (4.22 | ) | | | 3.01 | |
| Diluted: | | 13 | | | 0.11 | | | | 0.66 | | | | (4.22 | ) | | | 2.94 | |
| | | | | | | | | | | | | | | | | | | |
| Weighted average number of common shares outstanding | | | | | | | | | | | | | | | | | | |
| - Basic | | 13 | | | | | | | 36,355,124 | | | | 37,094,995 | | | | 37,275,427 | |
| - Diluted | | 13 | | | | | | | 36,488,041 | | | | 37,094,995 | | | | 38,188,814 | |
| Comprehensive income / (loss): | | | | | | | | | | | | | | | | | | |
| Net income / (loss) | | | | | 7,819 | | | | 48,707 | | | | (149,219 | ) | | | 113,055 | |
| Other comprehensive income / (loss), net of nil tax | | | | | | | | | | | | | | | | | | |
| Foreign currency translation adjustments | | | | | (128 | ) | | | (798 | ) | | | (11,159 | ) | | | (10,486 | ) |
| Less reclassification adjustment upon disposal of subsidiaries | | | | | 905 | | | | 5,638 | | | | — | | | | — | |
| Other comprehensive income / (loss) | | | | | 777 | | | | 4,840 | | | | (11,159 | ) | | | (10,486 | ) |
| Comprehensive income / (loss) | | | | | 8,596 | | | | 53,547 | | | | (160,378 | ) | | | 102,569 | |
| Less comprehensive income, net of nil tax, attributable to noncontrolling interests | | | | | (3,800 | ) | | | (23,676 | ) | | | (7,002 | ) | | | (289 | ) |
| Comprehensive income / (loss) attributable to Cogo Group, Inc. | | | | | 4,796 | | | | 29,871 | | | | (167,380 | ) | | | 102,280 | |
See accompanying notes to consolidated financial statements.
COGO GROUP, INC.
CONSOLIDATED STATEMENTS OF CHANGES IN EQUITY
(in thousands, except share data)
| | | Cogo Group, Inc. Stockholders | | | | | | | |
| | | Common Stock | | | Additional
paid in | | | Retained | | | Accumulated
other
comprehensive | | | Treasury | | | Non
controlling | | | Total | |
| | | No. of Shares
Outstanding | | | RMB | | | capital
RMB | | | earnings
RMB | | | loss
RMB | | | stock
RMB | | | interests
RMB | | | equity
RMB | |
| Balance as of January 1, 2010 | | | 35,770,025 | | | | 3,258 | | | | 1,221,538 | | | | 604,464 | | | | (107,384 | ) | | | (178,309 | ) | | | 8,455 | | | | 1,552,022 | |
| Net income | | | — | | | | — | | | | — | | | | 112,375 | | | | — | | | | — | | | | 680 | | | | 113,055 | |
| Other comprehensive loss | | | — | | | | — | | | | — | | | | — | | | | (10,095 | ) | | | — | | | | (391 | ) | | | (10,486 | ) |
| Issuance of common stock pursuant to share-based compensation | | | 1,102,193 | | | | 74 | | | | (74 | ) | | | — | | | | — | | | | — | | | | — | | | | — | |
| Share-based compensation | | | — | | | | — | | | | 69,250 | | | | — | | | | — | | | | — | | | | | | | | 69,250 | |
| Decrease in ownership interest of Comtech Broadband (note12(e)) | | | — | | | | — | | | | 16,472 | | | | — | | | | — | | | | — | | | | 15,208 | | | | 31,680 | |
| Purchase of the remaining noncontrolling interests of Long Rise (note7(c)) | | | — | | | | — | | | | 8,620 | | | | — | | | | — | | | | — | | | | (8,620 | ) | | | — | |
| Purchase of treasury stock | | | (1,023,454 | ) | | | — | | | | — | | | | — | | | | — | | | | (48,186 | ) | | | — | | | | (48,186 | ) |
| | | | | | | | | | | | | | | | | | | | | | | | | | | | | | | | | |
| Balance as of December 31, 2010 | | | 35,848,764 | | | | 3,332 | | | | 1,315,806 | | | | 716,839 | | | | (117,479 | ) | | | (226,495 | ) | | | 15,332 | | | | 1,707,335 | |
| Net income / (loss) | | | — | | | | — | | | | — | | | | (156,605 | ) | | | — | | | | — | | | | 7,386 | | | | (149,219 | ) |
| Other comprehensive loss | | | — | | | | — | | | | — | | | | — | | | | (10,775 | ) | | | — | | | | (384 | ) | | | (11,159 | ) |
| Issuance of common stock pursuant to share-based compensation | | | 1,127,756 | | | | 8 | | | | (8 | ) | | | — | | | | — | | | | — | | | | — | | | | — | |
| Share-based compensation | | | — | | | | — | | | | 66,723 | | | | — | | | | — | | | | — | | | | — | | | | 66,723 | |
| Purchase of treasury stock | | | (3,416,053 | ) | | | — | | | | — | | | | — | | | | — | | | | (93,530 | ) | | | — | | | | (93,530 | ) |
| | | | | | | | | | | | | | | | | | | | | | | | | | | | | | | | | |
| Balance as of December 31, 2011 | | | 33,560,467 | | | | 3,340 | | | | 1,382,521 | | | | 560,234 | | | | (128,254 | ) | | | (320,025 | ) | | | 22,334 | | | | 1,520,150 | |
| Net income | | | — | | | | — | | | | — | | | | 24,130 | | | | — | | | | — | | | | 24,577 | | | | 48,707 | |
| Other comprehensive income | | | — | | | | — | | | | — | | | | — | | | | 5,741 | | | | — | | | | (901 | ) | | | 4,840 | |
| Issuance of common stock pursuant to share-based compensation | | | 1,114,271 | | | | 69 | | | | (69 | ) | | | — | | | | — | | | | — | | | | — | | | | — | |
| Share-based compensation | | | — | | | | — | | | | 65,944 | | | | — | | | | — | | | | — | | | | — | | | | 65,944 | |
| Purchase of treasury stock | | | (3,563,816 | ) | | | — | | | | — | | | | — | | | | — | | | | (49,192 | ) | | | — | | | | (49,192 | ) |
| Capital contribution to a subsidiary by noncontrolling interests | | | — | | | | — | | | | — | | | | — | | | | — | | | | — | | | | 243 | | | | 243 | |
| | | | | | | | | | | | | | | | | | | | | | | | | | | | | | | | | |
| Balance as of December 31, 2012 | | | 31,110,922 | | | | 3,409 | | | | 1,448,396 | | | | 584,364 | | | | (122,513 | ) | | | (369,217 | ) | | | 46,253 | | | | 1,590,692 | |
| Balance as of December 31, 2012 (in USD) | | | | | | | 547 | | | | 232,484 | | | | 93,797 | | | | (19,665 | ) | | | (59,263 | ) | | | 7,424 | | | | 255,324 | |
See accompanying notes to consolidated financial statements.
COGO GROUP, INC.
CONSOLIDATED STATEMENTS OF CASH FLOWS
(in thousands)
| | | Years ended December 31, | |
| | | 2012 | | | 2012 | | | 2011 | | | 2010 | |
| | | USD | | | RMB | | | RMB | | | RMB | |
| Cash flows from operating activities: | | | | | | | | | | | | | | | | |
| Net income / (loss) | | | 7,819 | | | | 48,707 | | | | (149,219 | ) | | | 113,055 | |
| Adjustments to reconcile net income / (loss) to net cash used in operating activities: | | | | | | | | | | | | | | | | |
| Depreciation expense | | | 929 | | | | 5,789 | | | | 6,179 | | | | 6,144 | |
| Amortization of intangible assets | | | 4,060 | | | | 25,295 | | | | 28,631 | | | | 21,803 | |
| Amortization of land use rights | | | 47 | | | | 293 | | | | — | | | | — | |
| Impairment loss of goodwill | | | — | | | | — | | | | 236,945 | | | | 21,422 | |
| Deferred income taxes | | | (670 | ) | | | (4,173 | ) | | | (4,723 | ) | | | (5,331 | ) |
| (Gain) / loss on disposal of property and equipment | | | (285 | ) | | | (1,773 | ) | | | 205 | | | | 442 | |
| Gain on disposal of subsidiaries | | | (90 | ) | | | (558 | ) | | | — | | | | — | |
| Net gain on settlement relating to the acquisition of Long Rise before goodwill impairment (note 7(c)) | | | — | | | | — | | | | — | | | | (43,676 | ) |
| Provision for doubtful accounts | | | — | | | | — | | | | 2,325 | | | | 2 | |
| Share-based compensation | | | 10,585 | | | | 65,944 | | | | 66,723 | | | | 100,930 | |
| Changes in operating assets and liabilities, net of effects of acquisitions and disposal of subsidiaries: | | | | | | | | | | | | | | | | |
| Accounts receivable, net | | | 11,329 | | | | 70,582 | | | | (282,935 | ) | | | (77,065 | ) |
| Bills receivable | | | (4,260 | ) | | | (26,539 | ) | | | (8,888 | ) | | | (13,409 | ) |
| Inventories | | | (56,387 | ) | | | (351,297 | ) | | | (84,331 | ) | | | (109,267 | ) |
| Prepaid expenses and other receivables | | | (2,184 | ) | | | (13,608 | ) | | | (22,629 | ) | | | (22,706 | ) |
| Income taxes receivable | | | (30 | ) | | | (184 | ) | | | 450 | | | | (1,296 | ) |
| Accounts payable | | | 5,617 | | | | 34,994 | | | | 57,972 | | | | (15,919 | ) |
| Amount due from related party | | | (15,604 | ) | | | (97,215 | ) | | | — | | | | — | |
| Income taxes payable | | | (1,239 | ) | | | (7,721 | ) | | | 102 | | | | 4,385 | |
| Accrued expenses and other liabilities | | | 1,710 | | | | 10,653 | | | | 6,067 | | | | (1,772 | ) |
| Net cash used in operating activities | | | (38,653 | ) | | | (240,811 | ) | | | (147,126 | ) | | | (22,258 | ) |
| Cash flows from investing activities: | | | | | | | | | | | | | | | | |
| Increase in pledged bank deposits | | | (20,446 | ) | | | (127,383 | ) | | | (113,898 | ) | | | (220,359 | ) |
| Payments for acquisitions of subsidiaries, net of cash acquired | | | — | | | | — | | | | (140,419 | ) | | | (65,281 | ) |
| Proceeds from disposal of subsidiaries, net of cash disposed of | | | 6,860 | | | | 42,737 | | | | — | | | | — | |
| Purchases of property and equipment | | | (1,311 | ) | | | (8,164 | ) | | | (10,035 | ) | | | (6,895 | ) |
| Proceeds from disposal of property and equipment | | | 434 | | | | 2,706 | | | | — | | | | — | |
| Net cash used in investing activities | | | (14,463 | ) | | | (90,104 | ) | | | (264,352 | ) | | | (292,535 | ) |
| Cash flows from financing activities: | | | | | | | | | | | | | | | | |
| Purchase of treasury stock | | | (7,896 | ) | | | (49,192 | ) | | | (93,530 | ) | | | (48,186 | ) |
| Net proceeds from bank borrowings | | | 21,614 | | | | 134,658 | | | | 381,816 | | | | 400,469 | |
| Capital contribution to a subsidiary by non-controlling interests | | | 39 | | | | 243 | | | | — | | | | — | |
| Net cash provided by financing activities | | | 13,757 | | | | 85,709 | | | | 288,286 | | | | 352,283 | |
| Effect of exchange rate changes on cash | | | (372 | ) | | | (2,319 | ) | | | (4,094 | ) | | | (5,160 | ) |
| | | | | | | | | | | | | | | | | |
| Net increase / (decrease) in cash | | | (39,731 | ) | | | (247,525 | ) | | | (127,286 | ) | | | 32,330 | |
| Cash at beginning of the year | | | 91,871 | | | | 572,364 | | | | 699,650 | | | | 667,320 | |
| | | | | | | | | | | | | | | | | |
| Cash at end of the year | | | 52,140 | | | | 324,839 | | | | 572,364 | | | | 699,650 | |
| Supplementary cash flow information: | | | | | | | | | | | | | | | | |
| Interest paid | | | 4,293 | | | | 26,743 | | | | 20,152 | | | | 9,407 | |
| Income taxes paid | | | 2,876 | | | | 17,917 | | | | 15,724 | | | | 14,079 | |
| Non-cash investing activities: | | | | | | | | | | | | | | | | |
| Gain on settlement relating to the acquisition of Long Rise before goodwill impairment (note 7(c)) | | | — | | | | — | | | | — | | | | (54,178 | ) |
See accompanying notes to consolidated financial statements.
COGO GROUP, INC.
NOTES TO CONSOLIDATED FINANCIAL STATEMENTS
(in thousands, except share data)
| 1. | ORGANIZATION AND NATURE OF OPERATIONS AND REDOMESTICATION MERGER |
| (a) | Organization and nature of operations |
Cogo Group, Inc. (the “Company”) and its subsidiaries (collectively, the “Group”) are principally engaged in the sale of component parts for electronic devices and equipment, such as liquid crystal display, cameras, persistent storage and peripheral devices for wireless handsets and fixed-line telecommunications, industrial business components and medical and healthcare equipment to customers in the People’s Republic of China (“PRC”) and other overseas countries. The Group also provides technology and engineering services, business process outsourcing and other related services in the PRC.
As of December 31, 2012 and 2011, the subsidiaries which principally affect the results of operations and financial condition of the Company are as follows:
| Name of Company | | Place of
incorporation or
establishment | | Attributable equity
interest held | | | Principal activity |
| | | | | 2012 | | | 2011 | | | |
| Comtech Broadband Technology (Shenzhen) Co., Ltd. (Formerly known as “Comloca Technology (Shenzhen) Company Limited”) (“Comtech Broadband SZ”) | | PRC | | | 100 | % | | | 100 | % | | Sales of electronics components and related products |
| | | | | | | | | | | | | |
| Comtech Broadband Corporation Limited (“Comtech Broadband”) | | Hong Kong | | | 70 | % | | | 70 | % | | Sales of electronics components and related products |
| | | | | | | | | | | | | |
| Comtech Communication Technology (Shenzhen) Company Limited (“Comtech Communication”) | | PRC | | | 0 | % | | | 100 | % | | Sales of electronics components and related products (note a) |
| | | | | | | | | | | | | |
| Comtech International (Hong Kong) Limited (“Comtech Hong Kong”) | | Hong Kong | | | 0 | % | | | 100 | % | | Sales of electronics components and related products (note a) |
| | | | | | | | | | | | | |
| Comtech Software Technology (Shenzhen) Company Limited (“Comtech Software”) | | PRC | | | 0 | % | | | 100 | % | | Sales of electronics components and related products and research and development of software products (note a) |
| | | | | | | | | | | | | |
| Epcot Multimedia Technology (SZ) Co. Ltd. (“Epcot”) | | PRC | | | 0 | % | | | 100 | % | | Provision of media communication and collaboration platforms and solutions (note a) |
| | | | | | | | | | | | | |
| Shenzhen Comtech International Limited (“Shenzhen Comtech”) | | PRC | | | 100 | % | | | 100 | % | | Sales of electronics components and related products (note b) |
| Name of Company | | Place of
incorporation or
establishment | | Attributable equity
interest held | | | Principal activity |
| | | | | | | | | | | |
| Shanghai Comtech Electronic Technology Company Limited (“Shanghai Comtech”) | | PRC | | | 100 | % | | | 100 | % | | Sales of electronics components and related products (note a) |
| | | | | | | | | | | | | |
| Shanghai E&T System Company Limited (“Shanghai E & T”) | | PRC | | | 100 | % | | | 100 | % | | Sales of electronics components and related products (note c) |
| | | | | | | | | | | | | |
| Shenzhen Huameng Software Company Limited (“Huameng PRC”) | | PRC | | | 100 | % | | | 100 | % | | Provision of technology and engineering services, outsourcing, network system integration and related training and maintenance services |
| | | | | | | | | | | | | |
| Viewtran Technology (Shenzhen) Co., Limited (“Viewtran PRC”) | | PRC | | | 100 | % | | | 100 | % | | Provision of media communication and collaboration platforms and solutions |
| | | | | | | | | | | | | |
| Comtech Digital Technology (Hong Kong) Limited (“Comtech Digital”) | | Hong Kong | | | 60 | % | | | 60 | % | | Sales and development of digital and industrial applications, microcontrollers and complementary products |
| | | | | | | | | | | | | |
| Comtech Industrial (Hong Kong) Limited (“Comtech Industrial”) | | Hong Kong | | | 100 | % | | | 100 | % | | Sales and development of industrial applications, microcontrollers and complementary products |
| | | | | | | | | | | | | |
| Mega Sky (Shenzhen) Limited (“Mega Sky SZ”) | | PRC | | | 100 | % | | | 100 | % | | Provision of industrial and microcontroller based system solutions and research and development of software products |
| | | | | | | | | | | | | |
| Mega Smart (Shenzhen) Limited (“Mega Smart SZ”) | | PRC | | | 100 | % | | | 100 | % | | Provision of industrial and microcontroller based system solutions on customer, industrial, automotive, smart meter and smart grid markets |
| Note a | On October 23, 2012, the Company entered into a Sale and Purchase Agreement (the “Envision Agreement”) with Envision Global Group (“Envision”), an entity owned by Jeffrey Kang, the Company’s Chairman and Chief Executive Officer, pursuant to which the Company sold certain subsidiaries (the “Disposal Group”), including Comtech Communication, Comtech Hong Kong, Comtech Software and Epcot, to Envision for a total consideration of USD78,000. The transactions contemplated by the Envision Agreement closed on November 15, 2012 (“Date of Sale”) and the entire purchase price was fully received in 2012. See note 7(a). |
In connection with the disposal, as Shanghai Comtech does not form part of the Disposal Group but its 100% equity interest is held by one of entities in the Disposal Group, the Company, through its wholly-owned subsidiary, entered into legal arrangements with the Disposal Group pursuant to which the Disposal Group agrees to hold the equity interest in Shanghai Comtech on behalf of the Company’s wholly-owned subsidiary, and waive its full rights and risks of ownership of the equity interests in favour of the Company’s wholly-owned subsidiary. Accordingly, the Company retains its control over Shanghai Comtech through such legal arrangements.
| Note b | The Company exercises its control over Shenzhen Comtech through legal arrangements between Shenzhen Comtech’s legal shareholders (“Legal Shareholders”) and a wholly-owned subsidiary of the Company. The Legal Shareholders of Shenzhen Comtech are Huimo Chen, the mother of Jeffrey Kang, and Honghui Li, the Vice President of the Group, who hold 1% and 99% equity interest in Shenzhen Comtech respectively. The Legal Shareholders agree to hold the equity interest in Shenzhen Comtech on behalf of the Company’s wholly-owned subsidiary, and waive their full rights and risks of ownership of the equity interests in favor of the Company’s wholly-owned subsidiary. |
| Note c | Prior to January 1, 2012, the legal shareholders of Shanghai E&T were Shenzhen Comtech and Honghui Li with equity interests of 95% and 5% respectively. Honghui Li entered into and was bound by legal arrangements, similar to those as described in note (b), with the Company’s wholly-owned subsidiary relating to his holding of 5% equity interest in Shanghai E&T and agreed to hold on behalf of the Company’s wholly-owned subsidiary waiving his full rights and risks of ownership of the equity interests in favor of the Company’s wholly-owned subsidiary. |
| | On January 1, 2012, the Company instructed Shenzhen Comtech and Honghui Li to transfer 76% and 5% of their respective equity interest in Shanghai E&T to Shanghai Comtech. After the transfer, the legal shareholders of Shanghai E&T are Shenzhen Comtech (19%) and Shanghai Comtech (81%), subsidiaries which the Company exercises its controls through legal arrangements (see notes (a) and (b)). |
In accordance with the legal arrangements as described above, the Company has exclusive authority over all decision making related to the ongoing, major, or central operations of Shenzhen Comtech and Shanghai Comtech (collectively, the “Subsidiaries held under Deeds”). The relevant rights on decision making are forfeited by the legal shareholders under the legal arrangements. The Company also has exclusive authority over all decision making related to the total sharing of profit or loss of the Subsidiaries held under Deeds as well as the ability to establish and implement policy for dissolving them. In addition, the Company has the rights to sell or transfer the shareholding of the Subsidiaries held under Deeds. These rights are forfeited by the legal shareholders under the legal arrangements. The Company has significant financial interests in the Subsidiaries held under Deeds that provide the Company with the right to receive income, both as ongoing revenue and as proceeds from the sale of its interests in the Subsidiaries held under Deeds, in an amount that fluctuates based on the performance of the operations of the Subsidiaries held under Deeds and the change in the fair value thereof. Based on the above, in conformity with U.S. generally accepted accounting principles (“U.S. GAAP”), the Company has effective ownership and control over the Subsidiaries held under Deeds and that the financial position and results of operations of the Subsidiaries held under Deeds are consolidated into the Company’s consolidated financial statements.
| (b) | Redomestication merger |
The Company was incorporated in the Cayman Islands on April 12, 2011under the name of “Cogo Group Cayman, Inc.” for the sole purpose of effectuating the redomestication of the Company’s predecessor, Cogo Group, Inc., a Maryland corporation (“Cogo Maryland”).
The redomestication merger was approved by the shareholders of Cogo Maryland on July 25, 2011, pursuant to which each new ordinary share in the common stock of the Company was issued in exchange for one share of common stock of Cogo Maryland held by the shareholders. The redomestication became effective August 4, 2011. After the closing of the redomestication merger, the Company changed its name to Cogo Group, Inc. and Cogo Maryland ceased to exist.
The Company’s consolidated financial position, results of operations and cash flows included in the accompanying consolidated financial statements for periods before August 4, 2011 relate to those of the Company’s predecessor, Cogo Maryland.
| 2. | SUMMARY OF SIGNIFICANT ACCOUNTING POLICIES |
The accompanying consolidated financial statements have been prepared in accordance with U.S. GAAP.
| (a) | Principle of Consolidation |
The consolidated financial statements include the accounts of Cogo Group, Inc. and its subsidiaries. All significant inter-company balances and transactions have been eliminated upon consolidation.
The preparation of the consolidated financial statements in conformity with U.S. GAAP requires management of the Group to make a number of estimates and assumptions relating to the reported amounts of assets and liabilities and the disclosure of contingent assets and liabilities at the date of the consolidated financial statements and the reported amounts of revenues and expenses during the period. Significant items subject to such estimates and assumptions include the recoverability of the carrying amount of property and equipment, goodwill and intangible assets; the allocation of the purchase price for the Company’s acquisitions; the collectibility of accounts receivable; the realizability of deferred tax assets and inventories; fair value of share-based compensation; the useful lives and salvage values of property and equipment; and amounts recorded for contingencies. These estimates are often based on complex judgments and assumptions that management believes to be reasonable but are inherently uncertain and unpredictable. Actual results may differ from those estimates.
| (c) | Foreign Currency Transactions and Translation |
The Group’s reporting currency is the Renminbi (“RMB”). The functional currency of the Company is the U.S. dollar (“USD”), whereas the functional currency of the Company’s subsidiaries in the PRC and Hong Kong is the RMB and Hong Kong dollar (“HKD”), respectively. Prior to cessation of Cogo Maryland, the functional currency of Cogo Maryland was USD. Transactions denominated in currencies other than the functional currency are translated into the functional currency at the exchange rates prevailing at the date of the transaction. Monetary assets and liabilities denominated in currencies other than the functional currency are translated into the functional currency using the applicable exchange rates at each balance sheet date. The net foreign currency exchange loss amounted to RMB2,960 (USD475), RMB3,352 and RMB2,954 for the years ended December 31, 2012, 2011 and 2010, respectively, are included in ‘Selling, general and administrative expenses’ in the consolidated statements of comprehensive income / (loss).
Gains and losses resulting from translation of the financial statements of the Company and the Company’s subsidiaries in Hong Kong into the RMB reporting currency are recorded as a separate component of accumulated other comprehensive loss within equity.
For the convenience of the readers, the December 31, 2012 RMB amounts, included in the accompanying consolidated financial statements have been translated into USD at the rate of USD1.0000 = RMB6.2301, representing the rate quoted by the Federal Reserve Bank of New York at the close of business on December 31, 2012. No representation is made that the RMB amounts could have been, or could be, converted into USD at that rate or at any particular rate or at all.
| (d) | Cash and Pledged Bank Deposits |
Cash consists of cash on hand, cash in bank accounts and interest-bearing savings accounts. Cash deposits that are restricted as to withdrawal or pledged as security, are disclosed separately on the face of the consolidated balance sheet, and not included in the total cash for the purpose of the consolidated statements of cash flows.
Accounts receivable are recorded at the invoiced amount and do not bear interest. The allowance for doubtful accounts is the Group’s best estimate of the amount of probable credit losses in the Group’s existing accounts receivable. The Group determines the allowance based on a review of specifically identified accounts and aging data. The Group reviews its allowance for doubtful accounts monthly. Past due balances over 90 days and over a specified amount are reviewed individually for collectibility. All other balances are reviewed on a pooled basis.
Account balances are charged off against the allowance after all means of collection have been exhausted and the potential for recovery is considered remote. The Company’s subsidiaries in the PRC are required to comply with local tax requirements on the write-offs of doubtful accounts, which allow for the deductibility of such write-offs only when sufficient evidence is available to prove the debtors’ inability to make payments. For financial reporting purposes, the Group generally records write-offs of doubtful accounts at the same time the local tax requirements for the write-offs are met. As a result, there are generally time lags between the time when a provision for doubtful accounts is provided and the time the doubtful accounts and the related allowance are written off.
Apart from those disclosed in note 3, the Group does not have any off balance-sheet credit exposure related to its customers.
Inventories are stated at the lower of cost or market. Cost is determined by the first-in, first-out method. Cost of inventories comprises direct materials.
Property and Equipment and Intangible Assets
Property and equipment is stated at cost less depreciation and if applicable, impairment. Depreciation is calculated on a straight-line method over the estimated useful lives of the assets. The estimated useful lives are as follows:
| Property | 20 years |
| Furniture and office equipment | 1 to 5 years |
| Machinery | 5 years |
| Motor vehicles | 5 years |
| Intangible assets that are subject to amortization are amortized over their respective estimated useful lives as follows: |
| Customer relationships | 5 to 12 years |
| Supplier relationships | 11.5 years |
| Proprietary technology | 3 to 6.5 years |
| Proprietary designs | 3 years |
| Website and software assets | 3 to 5 years |
| Non-compete agreements | 1 to 6 years |
| License agreements | 2 years |
| Order backlog | 1 month |
Property and equipment and intangible assets subject to depreciation/amortization are reviewed for impairment whenever events or changes in circumstances indicate that the carrying amount of an asset may not be recoverable. Recoverability of assets to be held and used is measured by a comparison of the carrying amount of an asset to estimated undiscounted future cash flows expected to be generated by the asset. If the carrying amount of an asset exceeds its estimated future cash flows, an impairment charge is recognized by the amount by which the carrying amount of the asset exceeds the estimated fair value of the asset. Assets to be disposed of are separately presented in the balance sheet and reported at the lower of the carrying amount or fair value less costs to sell, and are no longer depreciated.
Goodwill
Goodwill represents the excess of the aggregate purchase price over the fair value of the net assets acquired in a purchase business combination. Goodwill is not amortized, but instead tested for impairment at the reporting unit level at least annually and whenever events or changes in circumstances indicate that the carrying value may not be recoverable. Under the first step, the fair value of a reporting unit was compared with its carrying amount, including goodwill. If the fair value of the reporting unit exceeded its carrying value, step two did not need to be performed. However, if the fair value of the reporting unit was less than its carrying value, an indication of goodwill impairment exists for the reporting unit and the Group must perform step two of the impairment test (measurement). Under step two, an impairment loss is recognized for any excess of the carrying amount of the reporting unit’s goodwill over the implied fair value of that goodwill. The implied fair value of goodwill was determined by allocating the fair value of the reporting unit in a manner similar to a purchase price allocation. The residual fair value after this allocation was the implied fair value of the reporting unit goodwill. Fair value of each of the Group’s reporting units was determined using a combination of the market and income approaches. For the years ended December 31, 2011 and 2010, impairment loss amounted to RMB236,945 and RMB21,422, respectively. For the year ended December 31, 2012, no impairment loss was recognized as goodwill was fully impaired as of December 31, 2011. See note 8.
Income taxes are accounted for under the asset and liability method. Deferred tax assets and liabilities are recognized for the future tax consequences attributable to differences between the financial statement carrying amounts of existing assets and liabilities and their respective tax bases and tax loss and tax credit carryforwards. Deferred tax assets and liabilities are measured using enacted tax rates expected to apply to taxable income in the years in which those temporary differences are expected to be recovered or settled. The effect on deferred tax assets and liabilities of a change in tax rates is recognized in consolidated statements of comprehensive income / (loss) in the period that includes the enactment date or date of change in tax rate. A valuation allowance is provided to reduce the amount of deferred tax assets if it is considered more likely than not that some portion or all of the deferred tax assets will not be realized.
The Group recognizes in the consolidated financial statements the impact of a tax position, if that position is more likely than not of being sustained upon examination, based on the technical merits of the position. Recognized income tax positions are measured at the largest amount that is greater than 50% likely of being realized. Changes in recognition or measurement are reflected in the period in which the change in judgment occurs. The Group has elected to classify interest and penalties related to unrecognized tax benefits, if and when required, as a component of income tax expense in the consolidated statements of comprehensive income / (loss).
Product Sales
The Company recognizes revenue at the point in time when the components are delivered and the customer takes ownership and assumes risk of loss, collection of the relevant receivable is probable, persuasive evidence of an arrangement exists and the sales price is fixed or determinable.
Sales of components represent the invoiced value of goods, net of value added taxes (“VAT”), sales returns, trade discounts and allowances.
In the PRC, VAT at a general rate of 17% on invoice amount is collected on behalf of tax authorities in respect of the sales of products and is not recorded as revenue. VAT collected from customers, net of VAT paid for purchases, is recorded as a liability in the consolidated balance sheets until it is paid to the authorities.
Service Revenue
Revenue for services is generally recognized when services are performed.
| (j) | Research and Development and Advertising |
Research and development and advertising costs are expensed as incurred. Research and development costs amounted to RMB102,531 (USD16,457), RMB101,639 and RMB77,888 for the years ended December 31, 2012, 2011 and 2010, respectively. Advertising costs amounted to RMB276 (USD44), RMB334 and RMB157 for the years ended December 31, 2012, 2011 and 2010, respectively.
| (k) | Shipping and Handling Fees and Costs |
Costs incurred by the Group for shipping and handling, including costs paid to third-party transportation companies, to transport and deliver products to customers, are included in “selling, general and administrative expenses”. Shipping and handling fees and costs amounted to RMB9,696 (USD1,556), RMB12,432 and RMB9,798 for the years ended December 31, 2012, 2011 and 2010, respectively.
| (l) | Share-based Compensation |
The Group applies ASC 718,Compensation- Stock Compensation to measure the cost of employee services received in exchange for an award of equity instruments based on the grant-date fair value of the award and recognizes the costs over the period the employee is required to provide service in exchange for the award, which generally is the vesting period. For awards with performance and service conditions, the compensation expense is based on the grant-date fair value of the award, the number of shares ultimately expected to vest and the vesting period. The Group assesses the probability of achieving certain performance conditions at balance sheet date. Based on the assessment of this probability, which requires subjective judgment, the Group records compensation expense before the performance conditions are actually fully achieved, which may then be reversed in future periods if the Group determines that it is no longer probable that the performance conditions will be achieved.
Share-based compensation expense amounted to RMB65,944 (USD10,585), RMB66,723 and RMB100,930 for the years ended December 31, 2012, 2011 and 2010, respectively.
| (m) | Earnings / (loss) per Share |
Basic earnings / (loss) per share is computed by dividing net income / (loss) by the weighted average number of common stock outstanding during the year, including contingently issuable shares when all necessary conditions for the issuance have been satisfied. Diluted earnings / (loss) per share is computed by dividing net income / (loss) by the weighted average number of common and, if applicable, dilutive potential common shares outstanding during the year. Dilutive potential common shares consist of common shares issuable upon the exercise of stock options, non-vested equity share units, including performance shares, warrants using the treasury stock method. Dilutive potential common shares also includes common shares issuable in connection with a business combination upon resolution of contingencies based on the number of such shares that would be issuable at the end of the year assuming it was the end of the contingency period.
| (n) | Financial guarantees issued, Commitments and Contingencies |
| (i) | Financial guarantees issued |
Financial guarantees are contracts that require the issuer (i.e. the guarantor) to make specified payments to reimburse the beneficiary of the guarantee (the “holder”) for a loss the holder incurs because a specified debtor fails to make payment when due in accordance with the terms of a debt instrument.
Where the Group issues a financial guarantee, the Group recognizes in its consolidated balance sheet a liability for that guarantee. When consideration is received or receivable for the issuance of the guarantee, the consideration is recognized in accordance with the Group’s policies applicable to that category of asset. The liability that the Group initially recognized is released over the term of the guarantee by a systematic and rational amortization method.
| (ii) | Other commitments and contingencies |
Liabilities for loss contingencies arising from claims, assessments, litigation, fines and other sources are recorded when it is probable that a liability has been incurred and the amount of the assessment can be reasonably estimated.
| (o) | Recently Issued Accounting Pronouncements |
Accounting Standards Update (“ASU”) 2011-11, an update to ASC 210, Balance sheet
In December 2011, the Financial Accounting Standards Board (“FASB”) issued ASU 2011-11, an update to ASC 210,Balance Sheet - Disclosures about Offsetting Assets and Liabilities. The FASB issued this ASU in conjunction with the International Accounting Standards Board’s (“IASB”) issuance of amendments toDisclosures – Offsetting Financial Assets and Financial Liabilities (Amendments to International Financial Reporting Standards (“IFRS”) 7). ASU 2011-11 requires disclosures to allow investors to better compare financial statements prepared under U.S. GAAP with financial statements prepared under IFRS while retaining the existing offsetting models under U.S. GAAP and IFRS. For the Company, ASU 2010-11 is effective for annual periods beginning January 1, 2013 and interim periods within those annual periods. Retrospective application is required. Since this standard impacts disclosure requirements only, its adoption will not have a material impact on the Company’s consolidated results of operations or financial condition.
ASU 2011-05, an update to ASC 220, Comprehensive Income
In June 2011, the FASB issued ASU 2011-05, an update to ASC 220,Comprehensive Income - Presentation of Comprehensive Income. ASU 2011-05 increases the prominence of other comprehensive income in financial statements. ASU 2011-05 permits entity to present the components of net income and comprehensive income in either one or two consecutive financial statements and eliminates the option in U.S. GAAP to present other comprehensive income in the statement of changes in equity. For the Company, ASU 2011-05 is effective for fiscal years, and interim periods within those years beginning after December 15, 2011. Retrospective application is required and early adoption is permitted. On October 21, 2011 the FASB decided to propose a deferral of the requirement to present reclassifications of other comprehensive income on the face of the income statement and on February 5, 2013, the FASB finalized this requirement for public entities beginning after December 15, 2012. Since the standard impacts presentation and disclosure requirements only, the adoption of this guidance did not have any material impact on the Company’s consolidated results of operations or financial condition.
| 3. | ACCOUNTS RECEIVABLE, NET |
Accounts receivable consist of the following:
| | | 2012 | | | 2012 | | | 2011 | |
| | | USD | | | RMB | | | RMB | |
| Accounts receivable | | | 117,469 | | | | 731,839 | | | | 1,017,415 | |
| Less: allowance for doubtful accounts | | | (4,314 | ) | | | (26,871 | ) | | | (75,617 | ) |
| Current assets: | | | 113,155 | | | | 704,968 | | | | 941,798 | |
An analysis of the allowance for doubtful accounts is as follows:
| | | 2012 | | | 2012 | | | 2011 | | | 2010 | |
| | | USD | | | RMB | | | RMB | | | RMB | |
| Balance at the beginning of year | | | 12,138 | | | | 75,617 | | | | 73,292 | | | | 73,306 | |
| Additional allowance for doubtful accounts | | | — | | | | — | | | | 3,000 | | | | 2 | |
| Write-off of accounts receivable against the allowance for doubtful accounts | | | — | | | | — | | | | — | | | | (16 | ) |
| Write back on allowance for doubtful accounts | | | — | | | | — | | | | (675 | ) | | | — | |
| Disposal of subsidiaries | | | (7,824 | ) | | | (48,746 | ) | | | — | | | | — | |
| Balance at the end of year | | | 4,314 | | | | 26,871 | | | | 75,617 | | | | 73,292 | |
The Group has a credit policy in place and the exposure to credit risk is monitored on an ongoing basis. Credit evaluations are performed on all customers requiring credit over a certain amount.
In 2010, the Group entered into a factoring agreement with Bank of China (Hong Kong) Limited (“BOC”) (see note 9) in which certain accounts receivable were transferred with recourse to BOC. Under the factoring agreement, BOC pays an amount net of discount to the Group and collects the factored accounts receivable balances directly from customers. The discount costs 2.7% to 3.4% of the balance transferred and are included in “interest expense”. The Group records the transfers of accounts receivable pursuant to the factoring agreement as sales when it is considered to have surrendered control of such receivables under the provisions of ASC 860,Transfers and Servicing. As of December 31, 2012 and 2011, the Group has not accrued a recourse liability since the estimated fair value of the recourse obligation was immaterial.
For the years ended December 31, 2012, 2011 and 2010, the Group received proceeds from the sale of accounts receivable amounting to RMB677,397 (USD108,730), RMB660,230 and RMB455,437, respectively. In addition, the Group recorded interest expense amounting to RMB6,323 (USD1,015), RMB4,720 and RMB1,852 in respect of the accounts receivable factored for the years ended December 31, 2012, 2011 and 2010. As of December 31, 2012, 2011 and 2010, outstanding accounts receivable factored with banks for which the Group has retained a recourse obligation amounted to RMB278,252 (USD44,663), RMB259,309 and RMB188,042, respectively.
To reduce the Group’s credit risk, the Group requires certain customers to pay for the sale of the Group’s products by bills receivable. Bills receivable are short-term notes receivable issued by a financial institution that entitles the Group to receive the full face amount from the financial institution at maturity, which generally ranges from 3 to 6 months from the date of issuance. Historically, the Group has experienced no losses on bills receivable.
During the years ended December 31, 2011 and 2010, the Group transferred with recourse certain of its bills receivable to banks. Under this discounting arrangement, the bank paid a discounted amount to the Group and collected the amounts owed from the customers’ banks.
For the years ended December 31, 2011 and 2010, the Group received proceeds, net of discount, from the sale of bills receivable amounting to RMB51,737 and RMB22,911, respectively. In addition, the Group recorded discounts amounting to RMB1,187 and RMB210, respectively, in respect of the bills receivable sold for the years ended December 31, 2011 and 2010. The Group did not discount any bills receivable during the year ended December 31, 2012.
For bills receivable sold to banks that the Group has surrendered control, the Group derecognized the discounted bills receivable pursuant to the provisions of ASC 860. As of December 31, 2012, the Group has no derecognized discounted bills receivable in accordance with ASC 860. As of December 31, 2011 and 2010, the Group has derecognized discounted bills receivable amounting to RMB12,162 and RMB2,158, respectively, in accordance with ASC 860.
Inventories are stated at the lower of cost or market. Cost is determined by the first-in, first-out method. Cost of inventories comprises direct materials.
Inventories by major categories are as follows:
| | | 2012 | | | 2012 | | | 2011 | |
| | | USD | | | RMB | | | RMB | |
| Raw materials | | | — | | | | — | | | | 733 | |
| Finished goods | | | 82,883 | | | | 516,372 | | | | 326,749 | |
| Total | | | 82,883 | | | | 516,372 | | | | 327,482 | |
Inventories amounting to RMB1,570 (USD252), RMB63 and RMB9,600 were written off during the years ended December 31, 2012, 2011 and 2010, respectively.
| 6. | PROPERTY AND EQUIPMENT, NET |
Property and equipment is stated at cost less depreciation and if applicable, impairment.
Property and equipment consists of the following:
| | | 2012 | | | 2012 | | | 2011 | |
| | | USD | | | RMB | | | RMB | |
| Property | | | 4 | | | | 23 | | | | 1,671 | |
| Machinery | | | 227 | | | | 1,416 | | | | 3,780 | |
| Furniture and office equipment | | | 4,309 | | | | 26,845 | | | | 33,874 | |
| Motor vehicles | | | 722 | | | | 4,499 | | | | 12,649 | |
| Total | | | 5,262 | | | | 32,783 | | | | 51,974 | |
| Less: accumulated depreciation | | | (2,451 | ) | | | (15,268 | ) | | | (34,083 | ) |
| Property and equipment, net | | | 2,811 | | | | 17,515 | | | | 17,891 | |
Depreciation expense for the years ended December 31, 2012, 2011 and 2010 is as follows:
| | | 2012 | | | 2012 | | | 2011 | | | 2010 | |
| | | USD | | | RMB | | | RMB | | | RMB | |
| Cost of sales | | | 11 | | | | 72 | | | | 41 | | | | 36 | |
| Selling, general and administrative expenses | | | 691 | | | | 4,303 | | | | 4,697 | | | | 4,418 | |
| Research and development expenses | | | 227 | | | | 1,414 | | | | 1,441 | | | | 1,690 | |
| Total | | | 929 | | | | 5,789 | | | | 6,179 | | | | 6,144 | |
| 7. | ACQUISITIONS AND DISPOSALS |
| (a) | Disposal of subsidiaries to Envision |
On October 23, 2012, the Company entered into the Envision Agreement with Envision pursuant to which the Company sold the Disposal Group to Envision for a total consideration of USD78,000 (equivalent to RMB486,502 as of the Date of Sale). The purchase price was fully received by the Company in 2012. The transactions contemplated by the Envision Agreement closed on November 15, 2012.
Pursuant to the terms of the Envision Agreement and the Services Agreement dated November 14, 2012, guarantees to banking institutions among the Company’s remaining subsidiaries and the Disposal Group will be maintained for a transitional period up to December 31, 2014 in order to maintain better financing terms for both parties and guarantees for certain suppliers and customers of the Disposal Group subject to a maximum cap of USD60,000 will be given by the Group. Guarantee fee amounting to USD250, as determined with reference to the guarantee fee chargeable by banks, will be charged to Envision for each quarter. The Group will also provide supportive and administrative services, including logistics, warehousing, accounting service, customer service, human resource service and IT services, to the Disposal Group. Service fee will be charged at pre-determined rates over usage and revenue generated by the Disposal Group as stipulated in the Services Agreement. For the year ended December 31, 2012, the Group has charged guarantee fee and service fee to Envision amounting to RMB779 (USD125) and RMB976 (USD157), respectively. As of December 31, 2012, the Group considered it is not probable that a claim will be made against the Group under the guarantee. Thus, no liabilities have been accrued for a loss related to the Group’s obligation under these guarantee arrangements.
The Envision Agreement also contains a non-competition clause, pursuant to which the Company and Envision agreed not to compete with each other’s business for a period of two years from closing. Additionally, the Company and Envision agreed to make reasonable efforts to maintain the operations of Envision and its acquired subsidiaries in the ordinary course consistent with past practices and to preserve its relationships with its major customers, suppliers and others having business dealings with the acquired subsidiaries. As the Group will generate significant continuing cash flows from the continuation of activities with the Disposal Group, the Disposal Group has not been reported separately as a discontinued operation in the accompanying consolidated statements of comprehensive income / (loss). For the years ended December 31, 2012, 2011 and 2010, the Disposal Group contributed approximately 28%, 33% and 35%, respectively, to the net sales of the Group.
Effects of disposal on the financial position of the Company
The following table summarizes the amounts of assets and liabilities of the Disposal Group at the Date of Sale:
| Net assets disposed of: | | RMB | |
| Cash | | | 443,765 | |
| Accounts receivable, net | | | 159,848 | |
| Bills receivable | | | 38,483 | |
| Amount due from the Group | | | 61,472 | |
| Inventories | | | 157,033 | |
| Prepaid expenses and other receivables | | | 36,198 | |
| Property and equipment, net | | | 7,751 | |
| Land use rights, net | | | 19,015 | |
| Other assets | | | 321 | |
| Accounts payable | | | (71,426 | ) |
| Bank borrowings | | | (369,112 | ) |
| Income taxes payable | | | (1,189 | ) |
| Accrued expenses and other liabilities | | | (3,790 | ) |
| Total | | | 478,369 | |
| | | | | |
| Satisfied by: | | | | |
| Cash consideration | | | (486,502 | ) |
| Exchange reserve realized upon disposal | | | 5,638 | |
| Transaction cost | | | 1,937 | |
| Gain on disposal of subsidiaries | | | 558 | |
Net cash inflow from disposal of subsidiaries:
| | | RMB | |
| | | | |
| Cash held by Disposal Group disposed of | | | (443,765 | ) |
| Cash consideration received | | | 486,502 | |
| Net cash inflow from disposal of subsidiaries | | | 42,737 | |
Amounts due to the Group relate to transactions between the Disposal Group and the remaining subsidiaries of the Group under normal business terms, including sales and purchases of goods and services, prior to the disposal. On November 16, 2012, the Group paid the Disposal Group RMB86,000 (USD13,804). Of which, RMB61,472 (USD9,867) was to settle the amount due to Envision as of November 15, 2012 and the remaining portion is intended to be settled through amounts for future operating activities between the Group and Envision. The total amount of RMB86,000 was primarily used by Envision as pledged deposits for facilities granted to the Group and the Disposal Group (see note 9). Management determined that the RMB86,000 payment was made in the normal course of business and not a reduction of the cash consideration received by the Group for the disposal. Accordingly, the amount has been included in the Group’s cash flows from operating activities in the consolidation statement of cash flows for the year ended December 31, 2012.
| (b) | MDC Tech International Holdings Limited (“MDC”) |
On January 31, 2011, the acquisition date, the Group acquired 100% of the outstanding shares of MDC and thereby obtained control of MDC and its subsidiary for a consideration of USD22,000 (equivalent to RMB145,237 as of the acquisition date). The purchase consideration would be paid over twelve months in four equal installments on or before the last business day of each of the four fiscal quarters of the Company for the year ended December 31, 2011, and was fully settled during the year. In light of the installment schedule, the Group has recorded the purchase consideration on a discounted basis, which amounted to USD21,869 (equivalent to RMB144,372 as of the acquisition date).
The principal activities of MDC and its subsidiary are the distribution of medical and healthcare equipment in the PRC, and the development of industrial applications on energy saving modules in the PRC.
The acquisition of MDC was accounted for by the Group as a purchase business combination in accordance with ASC 805,Business Combinations. The acquisition of MDC resulted in the recognition of goodwill of RMB61,509 and the recording of net identifiable assets of RMB82,863 at the date of acquisition. Recognized intangible assets relate to order backlog, customer relationships, non-compete agreements and proprietary technology which have a total weighted-average useful life of 8.9 years from the date of acquisition. Goodwill and the amortization of these intangible assets are not deductible for tax purposes.
The acquisition was expected to support the expansion of the Company’s industrial business in the PRC and the medical equipment and system sales in the PRC. Goodwill recorded in connection with the acquisition was attributed by (1) synergy to expand MDC’s operation and business on the established platform, industry knowledge and experience of the Group and the experience of the Group in providing module reference design and solutions of industrial applications on energy saving modules to customers; (2) expected future additional sales orders from new customers approachable by MDC after the acquisition, but for which MDC alone do not have sufficient resources to carry out such businesses; and (3) the expected outlook in the PRC medical and healthcare equipment and industrial application market with the PRC government stimulus package.
The purchase price allocation is as follows:
| | | RMB | |
| Intangible assets | | | | |
| – order backlog | | | 4,305 | |
| – customer relationships | | | 50,833 | |
| – non-compete agreements | | | 42,911 | |
| – proprietary technology | | | 1,188 | |
| Goodwill | | | 61,509 | |
| Deferred tax liabilities | | | (16,374 | ) |
| | | | | |
| Net asset acquired | | | 144,372 | |
Unaudited proforma financial information
The following unaudited proforma financial information represents the combined results of operations of the Group as if the acquisition of MDC had occurred as of January 1, 2010. The unaudited proforma information is not necessarily indicative of what the Company’s consolidated results of operations actually would have been had it completed the acquisition as of January 1, 2010. In addition, the unaudited proforma financial information does not attempt to project the future results of operations of the Group.
| | | Year ended December 31 | |
| | | 2011 | | | 2010 | |
| | | RMB
(unaudited) | | | RMB
(unaudited) | |
| Net revenue | | | 3,554,401 | | | | 2,632,103 | |
| Income / (loss) from operations | | | (133,836 | ) | | | 117,266 | |
| Net income / (loss) attributable to Cogo Group, Inc. | | | (157,759 | ) | | | 110,528 | |
| Earnings / (loss) per share attributable to Cogo Group, Inc. | | | | | | | | |
| Basic | | | (4.25 | ) | | | 2.97 | |
| Diluted | | | (4.25 | ) | | | 2.89 | |
| (c) | Long Rise Holdings Limited (“Long Rise”) |
On July 31, 2008, the Group entered into a share purchase agreement (the “Original Agreement”) to purchase 70% of the outstanding shares of Long Rise and its subsidiary, Rise Year, for a consideration of RMB60,921 payable in cash, none of which is contingent. The purchase agreement did not include a fixed payment schedule, and as a result the acquisition price was deemed to be payable on demand. The Company and the selling shareholders of Long Rise agreed that the consideration could be held back by the Company to settle any claims that might arise for contractual warranties and for any misrepresentations made to the Company. The Company paid approximately RMB3,485, RMB476 and RMB550 in 2008, 2009 and 2010, respectively. In 2010, the Company entered into a supplementary agreement as stated below and the remaining consideration payable was discharged as of December 31, 2010. Therefore, the Company did not make any payment from 2011 onwards.
The acquisition of Long Rise was accounted for by the Group as a purchase business combination in accordance with Statements of Financial Accounting Standards (“SFAS”) No. 141,Business Combinations(“SFAS No.141”). The acquisition of Long Rise resulted in the recognition of goodwill of RMB21,422 and recording net identifiable assets of RMB39,499 at the date of acquisition. Recognized intangible assets relate to customer relationships, non-compete agreements and proprietary technology which have a weighted-average useful life of 3.9 years from the date of acquisition. Goodwill and the amortization of these intangible assets are not deductible for tax purposes. Purchased in-process research and development of RMB4,390 was also recognized as an intangible asset and was expensed upon acquisition because technological feasibility had not been established and no future alternative uses exist.
The following table summarizes the amounts assigned to each major asset acquired and liability assumed at the date of acquisition.
| | | RMB | |
| | | | |
| Cash | | | 8,753 | |
| Accounts receivable | | | 16,807 | |
| Inventories | | | 8,010 | |
| Property and equipment | | | 17 | |
| Intangible assets | | | | |
| – customer relationships | | | 10,671 | |
| – non-compete agreements | | | 13,527 | |
| – in-process research and development | | | 4,390 | |
| – proprietary technology | | | 5,959 | |
| Goodwill | | | 21,422 | |
| Bank borrowings | | | (9,314 | ) |
| Income taxes payable | | | (1,584 | ) |
| Accrued expenses and other liabilities | | | (8,506 | ) |
| Deferred tax liabilities | | | (4,976 | ) |
| Noncontrolling interests | | | (4,255 | ) |
| Purchase price allocated | | | 60,921 | |
In 2010, the Company and the selling shareholders of Long Rise renegotiated certain clauses in the Original Agreement. On December 31, 2010, the Company and the selling shareholders of Long Rise signed a supplementary agreement (the “Supplementary Agreement”) in which the selling shareholders of Long Rise discharged the Group’s obligation to pay the outstanding payable for the acquisition of Long Rise of RMB54,178 and transferred the remaining 30% equity interest in Long Rise to the Group for no consideration and the Group agreed to release the selling shareholders of Long Rise from the non-compete agreements. As a result of the Supplementary Agreement, the Company recognized a net gain on settlement relating to the acquisition of Long Rise before goodwill impairment of RMB43,676 in the consolidated statement of income and comprehensive income for the year ended December 31, 2010 summarized as follows:
| | | RMB | |
| Adjustment to the purchase consideration | | | 54,178 | |
| Disposal of the non-compete agreements | | | (2,630 | ) |
| Impairment losses of customer relationships and proprietary technology | | | (7,872 | ) |
| Net gain on settlement relating to the acquisition of Long Rise before goodwill impairment | | | 43,676 | |
As a result of the above arrangements, the Company compared the carrying value of the customer relationships and proprietary technology to the undiscounted cash flows expected to be generated from those assets. For those customer relationships and proprietary technology for which the carrying amount was larger than its estimated undiscounted cash flow, the Company recorded an impairment charge to the extent the carrying amounts of customer relationships and proprietary technology exceeded their respective fair values. As a result, the carrying amount of RMB7,872 of customer relationships and proprietary technology were fully impaired during the year ended December 31, 2010.
In addition, as a result of the above arrangements, management revised its future cash flow expectations for its business in the reporting unit relating to Long Rise. Since the carrying value exceeded the fair value of this reporting unit, which was determined by a discounted cash flow model, a second step of the goodwill impairment test was performed to measure the impairment loss based on any excess of the carrying value of the reporting unit’s goodwill over the implied fair value of that goodwill. The implied fair value of goodwill was determined by allocating the fair value of the reporting unit in a manner similar to a purchase price allocation. Accordingly, the Company recognized an impairment loss of RMB21,422 in relation to the reporting unit relating to Long Rise during the year ended December 31, 2010. As a result, the carrying amount of the goodwill relating to Long Rise was fully impaired.
| 8. | GOODWILL AND INTANGIBLE ASSETS |
The changes in the carrying amount of our goodwill for the years ended December 31, 2012, 2011 and 2010 are as follows:
| | | RMB | |
| Balance as of January 1, 2010 | | | | |
| Goodwill | | | 201,122 | |
| Accumulated impairment losses | | | (4,264 | ) |
| | | | 196,858 | |
| Impairment loss of Long Rise (note 7(c)) | | | (21,422 | ) |
| Balance as of December 31, 2010 | | | | |
| Goodwill | | | 201,122 | |
| Accumulated impairment losses | | | (25,686 | ) |
| | | | 175,436 | |
| Acquisition of MDC (note 7(b)) | | | 61,509 | |
| Impairment loss (note 8(c)) | | | (236,945 | ) |
| Balance as of December 31, 2011 and 2012 | | | | |
| Goodwill | | | 262,631 | |
| Accumulated impairment losses | | | (262,631 | ) |
| Balance as of December 31, 2012 | | | — | |
The Company reviews long-lived assets, including its intangible assets subject to amortization, which for the Company are its customer relationships, supplier relationships, proprietary technology, proprietary designs, website and software asset, non-compete agreements, license agreement and order backlog, for impairment whenever events or changes in circumstances indicate that the carrying amount of such assets may not be recoverable. Recoverability of long-lived assets is measured by a comparison of the carrying amount of the asset group to the future undiscounted net cash flows expected to be generated by those assets. If such assets are considered to be impaired, the impairment charge recognized is the amount by which the carrying amounts of the assets exceed the fair value of the assets.
As of December 31, 2012 and 2011, the Company’s intangible assets related to the Company’s acquisitions consisted of the following:
| | | As of December 31, 2012 | |
| | | Gross
carrying
amount | | | Amortization
period | | | Accumulated
amortization | | | Net
carrying
amount | |
| | | RMB | | | Years | | | RMB | | | RMB | |
| Customer relationships | | | 189,259 | | | | 5 to 12 | | | | 103,653 | | | | 85,606 | |
| Supplier relationships | | | 8,876 | | | | 11.5 | | | | 2,766 | | | | 6,110 | |
| Proprietary technology | | | 17,542 | | | | 3 to 6.5 | | | | 14,051 | | | | 3,491 | |
| Proprietary designs | | | 1,627 | | | | 3 | | | | 1,627 | | | | — | |
| Website and software asset | | | 575 | | | | 3 to 5 | | | | 575 | | | | — | |
| Non-compete agreements | | | 81,940 | | | | 1 to 6 | | | | 48,337 | | | | 33,603 | |
| License agreement | | | 1,249 | | | | 2 | | | | 1,249 | | | | — | |
| Order backlog | | | 4,305 | | | | 0.1 | | | | 4,305 | | | | — | |
| | | | | | | | | | | | | | | | | |
| Total | | | 305,373 | | | | | | | | 176,563 | | | | 128,810 | |
| Total (in USD) | | | 49,016 | | | | | | | | 28,341 | | | | 20,675 | |
| | | As of December 31, 2011 | |
| | | Gross
carrying
amount | | | Amortization
period | | | Accumulated
amortization | | | Net
carrying
amount | |
| | | RMB | | | Years | | | RMB | | | RMB | |
| Customer relationships | | | 189,259 | | | | 5 to 12 | | | | 89,286 | | | | 99,973 | |
| Supplier relationships | | | 8,876 | | | | 11.5 | | | | 1,994 | | | | 6,882 | |
| Proprietary technology | | | 17,542 | | | | 3 to 6.5 | | | | 12,868 | | | | 4,674 | |
| Proprietary designs | | | 1,627 | | | | 3 | | | | 1,627 | | | | — | |
| Website and software asset | | | 575 | | | | 3 to 5 | | | | 575 | | | | — | |
| Non-compete agreements | | | 81,940 | | | | 1 to 6 | | | | 39,364 | | | | 42,576 | |
| License agreement | | | 1,249 | | | | 2 | | | | 1,249 | | | | — | |
| Order backlog | | | 4,305 | | | | 0.1 | | | | 4,305 | | | | — | |
| | | | | | | | | | | | | | | | | |
| Total | | | 305,373 | | | | | | | | 151,268 | | | | 154,105 | |
Amortization expense for intangible assets for the years ended December 31, 2012, 2011 and 2010 of RMB25,295 (USD4,060), RMB28,631 and RMB21,803 was included in selling, general and administrative expenses, respectively. Estimation for amortization expense for the next five years is: RMB25,295 in 2013, RMB25,295 in 2014, RMB24,154 in 2015, RMB20,263 in 2016 and RMB10,017 in 2017.
| (c) | Impairment of goodwill |
As a result of the continued significant decline in the price of the Company’s shares of common stock in 2011, the Company’s aggregate market value was significantly lower than the aggregate carrying value of the Company’s reporting units. Accordingly, the Company determined that the carrying amounts of goodwill exceeded their respective implied fair values of nil and recorded a goodwill impairment charge of RMB236,945 during the year ended December 31, 2011. The goodwill impairment charge did not impact debt covenants compliance under the Company’s existing credit facility.
| 9. | PLEDGED BANK DEPOSITS, BANK BORROWINGS AND BANKING FACILITIES |
The Group entered into several banking facilities with Standard Chartered Bank (Hong Kong) Limited (“SCB”), BOC, Guangdong Development Bank Holdings Company Limited (“GDB”), the Hong Kong and Shanghai Banking Corporation Limited (“HSBC”) and Citibank N.A. Hong Kong (“CITI”). These facilities include letters of guarantee, bank loans and irrevocable letters of credit. The banking facility with BOC also included an accounts receivable factoring agreement as disclosed in note 3.
The Group’s banking facilities contain the general clause that the banks may at any time without prior notice modify, cancel or suspend the facilities at their sole discretions including, without limitation, canceling any unutilized facilities, and declaring any outstanding amount to be immediately due and payable.
The Group’s banking facilities contain various covenants, including the Group’s consolidated net borrowing ratio not exceeding 0.25 times and the Company maintaining a tangible net worth of not less than USD160,000 (equivalent to RMB996,816 as of December 31, 2012). Other conditions include the Company’s Chief Executive Officer remaining as the single largest beneficial owner of the Company and Chairman of the Board of Directors and actively involving in the management of the Group, the Company remaining as listed in NASDAQ and retaining at least 50% equity interest in those subsidiaries which entered into the banking facilities with the banks. As of December 31, 2012, a non-financial covenant in one of the Group’s banking facilities has not been satisfied due to the disposal of subsidiaries as disclosed in note 7(a). The Group is in the process of finalizing with the relevant bank on a revised banking facility and management believes that this matter will be satisfactorily resolved.
As stipulated in the Envision Agreement and the Service Agreement (see note 7(a)), after the disposal of subsidiaries to Envision, guarantees to banking institutions among the Company’s remaining subsidiaries and the Disposal Group will be maintained for a transitional period up to December 31, 2014. As of December 31, 2012 and 2011, the aggregate credit limit of banking facilities granted solely to the Group amounted to RMB934,515 (USD150,000) and RMB1,431,862, respectively. As of December 31, 2012, the aggregate credit limit of joint banking facilities granted which can be utilized by the Group and the Disposal Group (“Joint Banking Facilities”) amounted to RMB594,975 (USD95,500). As of December 31, 2012, the aggregate credit limit of banking facilities granted solely to the Disposal Group, guaranteed by the Group (“Guaranteed Facilities For the Disposal Group”), amounted to RMB311,505 (USD50,000).
As of December 31, 2012 and 2011, the total outstanding bank borrowings of the Group amounted to RMB614,045 (USD98,561) and RMB854,234, respectively. Of which, loan of RMB312,757 (USD50,201) was borrowed under the Joint Banking Facilities and RMB43,611 (USD7,000) was secured by the pledged deposit of the Disposal Group as of December 31, 2012. The weighted average interest rate on outstanding bank borrowings of the Group as of December 31, 2012 was 2.1% (2011: 2.2%).
As of December 31, 2012, the total outstanding bank borrowings of the Disposal Group amounted to RMB443,857 (USD71,244). Of which, loan of RMB200,883 (USD32,244) was borrowed under the Joint Banking Facilities and loan of RMB242,974 (USD39,000) was borrowed under the Guaranteed Facilities For the Disposal Group.
The aggregate amount of funds secured by the Group as pledged deposits with the respective banks as of December 31, 2012 and 2011 amounted to RMB556,941 (USD89,395), and RMB431,695, respectively. Of which, RMB286,740 (USD46,025) and RMB207,900 (USD33,370) were pledged for Joint Banking Facilities and Guaranteed Facilities For the Disposal Group, respectively, as of December 31, 2012. The remaining pledged deposits were pledged for the banking facilities granted solely to the Group.
The aggregate amount of funds secured by the Disposal Group as pledged deposits with the respective banks as of December 31, 2012 amounted to RMB206,502 (USD33,146). Of which, RMB124,602 (USD20,000) was pledged for Joint Banking Facilities and RMB81,900 (USD13,146) was pledged for Guaranteed Facilities For the Disposal Group and a banking facility granted to the Group as of December 31, 2012.
As of December 31, 2012 and 2011, the aggregate amount of unutilized banking facilities (including the unutilized facility amount under the accounts receivable factoring agreement with BOC) granted solely to the Group amounted to RMB354,972 (USD56,977) and RMB318,319, respectively. As of December 31, 2012, the aggregate amount of unutilized Joint Banking Facilities amounted to RMB81,334 (USD13,055). As of December 31, 2012, the aggregate amount of unutilized Guaranteed Facilities For the Disposal Group amounted to RMB68,531 (USD11,000).
The Company and its subsidiaries file separate income tax returns.
The United States of America (“U.S.”)
The Company is incorporated in the Cayman Islands. After the completion of the redomestication merger on August 4, 2011, the Company is deemed to have taken up the tax status of Cogo Maryland for United States federal income tax purposes, and is, accordingly, subject to United States federal income tax at a tax rate of 34%.
Cayman Islands and British Virgin Islands
Under the current laws of the Cayman Islands and the British Virgin Islands, the Company and its subsidiaries that are incorporated in the Cayman Islands and the British Virgin Islands are not subject to tax on income or capital gains. In addition, upon payments of dividends by the Company’s subsidiaries, no Cayman Islands or British Virgin Islands withholding tax will be imposed.
Hong Kong
The Company’s subsidiaries that are incorporated in Hong Kong are subject to Hong Kong Profits Tax. The applicable profits tax rate is 16.5% for 2010, 2011 and 2012. The payments of dividends by Hong Kong companies are not subject to any Hong Kong withholding tax.
PRC
On March 16, 2007, the National People’s Congress passed the Corporate Income Tax law (the “CIT law”) which revised the PRC statutory income tax rate to 25%. The CIT law was effective on January 1, 2008. Accordingly, the Company’s PRC subsidiaries are subject to income tax at 25% effective from January 1, 2008 unless otherwise specified.
Prior to January 1, 2008, the Company’s subsidiaries located in the Shenzhen Special Economic Zone (“Shenzhen Subsidiaries”) were entitled to the preferential tax rate of 15%. In addition, the Shenzhen Subsidiaries, being production oriented foreign investment enterprises, were each entitled to a tax holiday of two-year tax exemption followed by three-year 50% tax reduction starting from the first profit making year from the PRC tax perspective (“2+3 tax holiday”) under the then effective tax regulations.
The CIT law and its relevant regulations provide a five-year transition period from January 1, 2008 for the Shenzhen Subsidiaries which were established before March 16, 2007 and were entitled to preferential tax rates under the then effective tax regulations, as well as grandfathering certain tax holidays. The transitional tax rates are 22%, 24%, 25% for 2010, 2011 and 2012 onwards, respectively.
Certain subsidiaries located in the Shenzhen Special Economic Zone, including Comtech Broadband SZ, Huameng PRC, Mega Sky SZ and Mega Smart SZ, were each granted a 2+3 tax holiday and were subject to income tax at rates ranging from 0% to 12.5% for the year ended December 31, 2012.
| (a) | Income / (loss) before Income Taxes and Provision for Income Taxes |
The Group’s earnings / (loss) before income taxes and extraordinary item consists of the following:
| | | 2012 | | | 2012 | | | 2011 | | | 2010 | |
| | | USD | | | RMB | | | RMB | | | RMB | |
| U.S. | | | (1,726 | ) | | | (10,757 | ) | | | (14,708 | ) | | | (13,254 | ) |
| PRC, excluding Hong Kong | | | 11,048 | | | | 68,832 | | | | 50,418 | | | | 145,418 | |
| Hong Kong | | | (457 | ) | | | (2,846 | ) | | | (172,931 | ) | | | (6,990 | ) |
| Other foreign jurisdictions | | | (109 | ) | | | (683 | ) | | | (445 | ) | | | (270 | ) |
| | | | | | | | | | | | | | | | | |
| | | | 8,756 | | | | 54,546 | | | | (137,666 | ) | | | 124,904 | |
The provision for income taxes consists of the following:
| | | 2012 | | | 2012 | | | 2011 | | | 2010 | |
| | | USD | | | RMB | | | RMB | | | RMB | |
| Current tax | | | | | | | | | | | | | | | | |
| PRC, excluding Hong Kong | | | 920 | | | | 5,732 | | | | 8,228 | | | | 13,361 | |
| Hong Kong | | | 687 | | | | 4,280 | | | | 8,048 | | | | 3,819 | |
| Deferred tax | | | | | | | | | | | | | | | | |
| Hong Kong | | | (670 | ) | | | (4,173 | ) | | | (4,723 | ) | | | (5,331 | ) |
| | | | | | | | | | | | | | | | | |
| Income tax expense | | | 937 | | | | 5,839 | | | | 11,553 | | | | 11,849 | |
Reconciliation between income tax expense and the amount that result by applying the PRC statutory tax rate to earnings / (loss) before income taxes and extraordinary item is as follows:
| | | 2012 | | | 2012 | | | 2011 | | | 2010 | |
| | | USD | | | RMB | | | RMB | | | RMB | |
| Earnings / (loss) before income taxes | | | 8,756 | | | | 54,546 | | | | (137,666 | ) | | | 124,904 | |
| | | | | | | | | | | | | | | | | |
| PRC statutory tax rate | | | | | | | 25 | % | | | 25 | % | | | 25 | % |
| Computed “expected” income tax expense / (benefit) | | | 2,189 | | | | 13,637 | | | | (34,417 | ) | | | 31,226 | |
| Effect of PRC preferential income tax rate | | | — | | | | — | | | | (471 | ) | | | (2,123 | ) |
| Effect of PRC tax holiday | | | (4,673 | ) | | | (29,113 | ) | | | (33,947 | ) | | | (26,511 | ) |
| PRC R&D bonus deduction | | | — | | | | — | | | | (1,617 | ) | | | — | |
| Tax rate differential for U.S and Hong Kong entities | | | (116 | ) | | | (726 | ) | | | 13,375 | | | | (599 | ) |
| Entities of other foreign jurisdictions not subject to income tax | | | 27 | | | | 171 | | | | 112 | | | | 68 | |
| Change in valuation allowance | | | 629 | | | | 3,921 | | | | (1,544 | ) | | | 5,982 | |
| Non-taxable items: | | | | | | | | | | | | | | | | |
| Interest income | | | (10 | ) | | | (61 | ) | | | (63 | ) | | | (12 | ) |
| Foreign exchange gain | | | (73 | ) | | | (455 | ) | | | (56 | ) | | | (112 | ) |
| Adjustment of consideration payable, net of disposal / impairment of respective intangible assets for Long Rise (note 7(c)) | | | — | | | | — | | | | — | | | | (8,939 | ) |
| Other non-taxable income | | | (80 | ) | | | (502 | ) | | | — | | | | — | |
| Non-deductible items: | | | | | | | | | | | | | | | | |
| Impairment loss of goodwill | | | — | | | | — | | | | 43,146 | | | | 3,535 | |
| Provision for inventory write-down | | | — | | | | — | | | | — | | | | 2,112 | |
| Allowance for doubtful accounts | | | — | | | | — | | | | 384 | | | | — | |
| Share-based compensation | | | 2,646 | | | | 16,486 | | | | 16,679 | | | | 7,144 | |
| Professional fees | | | — | | | | — | | | | 2,462 | | | | — | |
| Foreign exchange loss | | | 133 | | | | 827 | | | | — | | | | — | |
| Other non-deductible items | | | 80 | | | | 499 | | | | 595 | | | | 63 | |
| Deemed income for income tax purposes | | | 185 | | | | 1,155 | | | | 6,915 | | | | 15 | |
| Income tax expense | | | 937 | | | | 5,839 | | | | 11,553 | | | | 11,849 | |
| | | | | | | | | | | | | | | | | |
The PRC tax rate has been used because the Company’s principle operations are in the PRC. The effects of the tax holiday are RMB29,113 (USD4,673), RMB33,947 and RMB26,511 for the years ended December 31, 2012, 2011 and 2010, respectively (equivalent to basic earnings per share amount of RMB0.80 (USD0.13), RMB0.92 and RMB0.71 and a diluted earnings per share amount of RMB0.80 (USD0.13), RMB0.92 and RMB0.69 for the years ended December 31, 2012, 2011 and 2010, respectively).
| (b) | Deferred Tax Assets and Liabilities |
The tax effects of the Group’s temporary differences that give rise to significant portions of the deferred tax assets and liabilities are as follows:
| | | 2012 | | | 2012 | | | 2011 | |
| | | USD | | | RMB | | | RMB | |
| Deferred tax assets: | | | | | | | | | | | | |
| Tax loss carryforwards | | | 2,126 | | | | 13,244 | | | | 9,880 | |
| Valuation allowance | | | (2,126 | ) | | | (13,244 | ) | | | (9,880 | ) |
| | | | | | | | | | | | | |
| Net deferred tax asset | | | — | | | | — | | | | — | |
| | | | | | | | | | | | | |
| Deferred tax liabilities: | | | | | | | | | | | | |
| Intangible assets | | | (3,412 | ) | | | (21,254 | ) | | | (25,427 | ) |
| | | | | | | | | | | | | |
| Net deferred tax liability | | | (3,412 | ) | | | (21,254 | ) | | | (25,427 | ) |
The increase (decrease) in valuation allowance during the years ended December 31, 2012, 2011 and 2010 were RMB3,364 (USD540), RMB(1,544) and RMB5,646, respectively. For the year ended December 31, 2012, there was a derecognition of deferred tax assets and the related valuation allowance of RMB557 (USD89) arising from unutilized tax loss carryforwards in respect of 2012 disposal.
In assessing the realizability of deferred tax assets, management considers whether it is more likely than not that some portion or all of the deferred tax assets will not be realized. The ultimate realization of deferred tax assets is dependent upon the generation of future taxable income during the periods in which those temporary differences become deductible or tax loss carryforwards are utilized.
As of December 31, 2012, for United States federal income tax purposes, the Company had net tax loss carryforwards of approximately USD1,746 which will expire at various dates through 2032.
As of December 31, 2012, the Company’s PRC and Hong Kong subsidiaries had tax loss carryforwards of approximately RMB32,953 (USD5,289) and RMB8,096 (USD1,299), respectively. The tax losses for the PRC subsidiaries amounting to RMB3,728, RMB2,555, RMB1,140, RMB15,357 and RMB10,173 will expire in 2013, 2014, 2015, 2016 and 2017 respectively. The tax loss for the Hong Kong subsidiary does not expire under the current Hong Kong tax legislation.
According to the prevailing PRC income tax law and its relevant regulations, non-PRC-resident enterprises are levied withholding tax at 10%, unless reduced by tax treaties or similar arrangements, on dividends from their PRC-resident investees for earnings accumulated beginning on January 1, 2008, and undistributed earnings generated prior to January 1, 2008 are exempt from such withholding tax. Further, the Company’s distributions from its non-U.S. subsidiaries are subject to the U.S. federal income tax at 34%, less any applicable qualified foreign tax credits. Due to the Company’s plan of reinvesting permanently its earnings in its non-U.S. business, the Company has not provided for deferred income tax liabilities of RMB354,507 (USD56,902) and RMB390,129 (which does not include any potential qualified foreign tax credits or potential PRC dividend withholding taxes), for U.S. federal income tax purposes on its overseas subsidiaries’ undistributed earnings of RMB1,042,669 (USD167,360) and RMB1,147,438 as of December 31, 2012 and 2011, respectively.
| (c) | Accounting for unrecognized tax benefits |
As of January 1, 2010 and for each of the years ended December 31, 2010, 2011 and 2012, the Group did not have unrecognized tax benefits, and it does not expect that the amount of unrecognized tax benefits will change significantly within the next 12 months. Accordingly, no interest or penalties related to unrecognized tax benefits were accrued.
The Company and its subsidiaries file income tax returns in the United States, PRC and Hong Kong. The Company could be subject to U.S. federal income tax examination by tax authorities for years beginning in 2009. According to the PRC Tax Administration and Collection Law, the statute of limitations is three years if the underpayment of taxes is due to computational errors made by the taxpayer or the withholding agent. The statute of limitations is extended to five years under special circumstances where the underpayment of taxes is more than RMB100 (USD16). In the case of transfer pricing issues, the statute of limitations is ten years. There is no statute of limitations in the case of tax evasion. Accordingly, the PRC tax returns for the Company’s PRC subsidiaries are open to examination by the PRC state and local tax authorities for the tax years beginning in 2007. The tax returns for the Company’s Hong Kong subsidiaries are currently open to examination by the Hong Kong tax authorities for the tax years beginning in 2006.
| 11. | ACCRUED EXPENSES AND OTHER LIABILITIES |
Accrued expenses and other liabilities consist of the following:
| | | 2012 | | | 2012 | | | 2011 | |
| | | USD | | | RMB | | | RMB | |
| Legal and professional fees | | | 859 | | | | 5,351 | | | | 2,438 | |
| Accrued staff related costs | | | 1,214 | | | | 7,568 | | | | 12,109 | |
| Financial guarantees (note 18(iii)) | | | 2,000 | | | | 12,460 | | | | — | |
| Other accruals | | | 1,662 | | | | 10,355 | | | | 8,046 | |
| | | | 5,735 | | | | 35,734 | | | | 22,593 | |
| 12. | SHARE-BASED COMPENSATION |
| (a) | Options and stock warrants assumed under the redomestication merger |
On August 4, 2011, upon completion of the redomestication merger, the Company assumed the obligations to provide for the issuance of the Company’s ordinary shares rather than the common stock of Cogo Maryland upon the exercise of all outstanding options to purchase shares of Cogo Maryland common stock and all other outstanding equity awards granted under equity plans to directors, employees and consultants under Cogo Maryland’s 2004 Incentive Plan, 2006 Incentive Plan and the 2009 Incentive Plan.
On August 3, 2004, the Board of Directors adopted the 2004 Stock Incentive Plan (the “2004 Incentive Plan”) pursuant to which 2,500,000 shares of the Company’s common stock are reserved for issuance upon exercise of stock options, and for the issuance of stock appreciation rights, non-vested shares and performance shares. The purpose of the 2004 Incentive Plan is to provide additional incentive to employees, directors, advisors and consultants. The 2004 Incentive Plan provides for a term of 10 years from the date of its adoption by the Board of Directors, after which no awards may be made, unless the 2004 Incentive Plan is early terminated by the Board.
Stock options
A summary of stock options activity is as follows:
| | | Number of
options
outstanding | | | Weighted
average
exercise
price | | | Weighted
average
remaining
contractual
term | | | Aggregate
intrinsic
value | |
| | | | | | USD | | | Years | | | USD | |
| Balance as of January 1, 2010 | | | 1,192,269 | | | | 4.09 | | | | | | | | | |
| Exercised | | | (7,500 | ) | | | 5.53 | | | | | | | | | |
| | | | | | | | | | | | | | | | | |
| Balance as of December 31, 2010 | | | 1,184,769 | | | | 4.08 | | | | | | | | | |
| Exercised | | | — | | | | — | | | | | | | | | |
| | | | | | | | | | | | | | | | | |
| Balance as of December 31, 2011 | | | 1,184,769 | | | | 4.08 | | | | | | | | | |
| Exercised | | | — | | | | — | | | | | | | | | |
| | | | | | | | | | | | | | | | | |
| Balance as of December 31, 2012 | | | 1,184,769 | | | | 4.08 | | | | 2.01 | | | | — | |
As of December 31, 2012, 1,184,769 stock options were exercisable. The intrinsic value of options exercised during the year ended December 31, 2010 was USD12.
On December 20, 2006, the Board of Directors adopted the 2006 Equity Incentive Plan (the “2006 Incentive Plan”) pursuant to which 4,800,000 shares of the Company’s common stock are reserved for issuance upon exercise of stock options, and for the issuance of stock appreciation rights, restricted stock awards and performance shares. The purpose of the 2006 Incentive Plan is to provide additional incentive to employees, directors, advisors and consultants. The 2006 Incentive Plan provides for a term of 10 years from the date of its adoption by the Board of Directors, after which no awards may be made, unless the 2006 Incentive Plan is early terminated by the Board.
Non-vested equity share unit
A summary of non-vested equity share units issued under the 2006 Incentive Plan is as follows:
| | | Shares | | | Weighted average
Grant-date fair value | |
| | | | | | USD | |
| Balance as of January 1, 2010 | | | 1,309,164 | | | | 5.70 | |
| Granted on January 29, 2010 (note i) | | | 932,763 | | | | 6.36 | |
| Vested | | | (1,455,462 | ) | | | (5.56 | ) |
| | | | | | | | | |
| Balance as of December 31, 2010 | | | 786,465 | | | | 6.74 | |
| Vested | | | (397,812 | ) | | | 7.10 | |
| | | | | | | | | |
| Balance as of December 31, 2011 | | | 388,653 | | | | 6.36 | |
| Vested | | | (310,920 | ) | | | 6.36 | |
| | | | | | | | | |
| Balance as of December 31, 2012 | | | 77,733 | | | | 6.36 | |
| Note i | The stock awards vest in equal quarterly installments over a period of three years from the date of grant. |
The total grant-date fair value of the above equity share units vested during the years ended December 31, 2012 and 2011 and 2010 were USD1,977, USD2,826 and USD8,094, respectively. As of December 31, 2012 and 2011, the aggregate fair value of all non-vested equity share units were USD494 and USD2,472, respectively, which is expected to be amortized on a straight-line basis over a weighted average period of approximately 1 month (2011: 13 months).
Performance shares
A summary of performance shares activity is as follows:
| | | Shares | | | Weighted average
Grant-
date fair value | |
| | | | | | USD | |
| Balance as of January 1, 2010 | | | 420,000 | | | | 14.06 | |
| Vested | | | (5,000 | ) | | | 16.03 | |
| Expired | | | (415,000 | ) | | | 14.03 | |
| Balance as of December 31, 2011 and 2012 | | | — | | | | — | |
The grant-date fair value of performance shares vested was USD80 for the year ended December 31, 2010.
On November 9, 2009, the Board of Directors adopted the 2009 Omnibus Securities and Incentive Plan (the “2009 Incentive Plan”) pursuant to which 6,000,000 shares of the Company’s common stock are reserved for issuance upon exercise of stock options, and for the issuance of stock appreciation rights, restricted stock awards and performance shares. The purpose of the 2009 Incentive Plan is to provide additional incentive to employees, directors, advisors and consultants. The 2009 Incentive Plan provides for a term of 10 years from the date of its adoption by the Board of Directors, after which no awards may be made, unless the 2009 Incentive Plan is early terminated by the Board.
Non-vested equity share unit
A summary of non-vested equity share units issued under the 2009 Incentive Plan is as follows:
| | | Shares | | | Weighted average
Grant-date fair
value | |
| | | | | | USD | |
| Balance as of January 1, 2011 | | | 1,615,952 | | | | 6.26 | |
| Granted on January 1, 2011 (note i) | | | 210,000 | | | | 8.85 | |
| Granted on March 21, 2011 (note i) | | | 1,000,000 | | | | 7.80 | |
| Granted on April 1, 2011 (note i) | | | 150,000 | | | | 8.85 | |
| Granted on June 24, 2011 (note ii) | | | 50,000 | | | | 5.27 | |
| Vested | | | (1,073,091 | ) | | | 6.85 | |
| Balance as of December 31, 2011 | | | 1,952,861 | | | | 7.18 | |
| Granted on September 13, 2012 (note iii) | | | 1,950,000 | | | | 1.78 | |
| Vested | | | (1,443,925 | ) | | | 5.84 | |
| Balance as of December 31, 2012 | | | 2,458,936 | | | | 3.69 | |
| Note i | The stock awards vest in equal quarterly installments over a period of three years from the date of grant. |
| Note ii | The stock awards were fully vested on the date of grant. |
| Note iii | The stock awards vested in equal quarterly installments over a period of one and a half years from the date of grant. |
The total grant-date fair value of the above equity share units vested during the years ended December 31, 2012 and 2011 were USD8,427 and USD7,351, respectively. As of December 31, 2012 and 2011, the aggregate fair value of all non-vested equity share units were USD9,066 and USD14,022, respectively, which is expected to be amortized on a straight-line basis over a weighted average period of approximately 13 months and 21 months, respectively.
Shares with performance and market conditions
A summary of shares activity is as follows:
| | | Shares | | | Weighted average
Grant-
date fair value | |
| | | | | | USD | |
| Balance as of January 1, 2011 | | | — | | | | — | |
| Granted on January 1, 2011 (note i) | | | 360,000 | | | | 8.85 | |
| Granted on January 1, 2011 (note ii) | | | 300,000 | | | | 3.50 | |
| Vested | | | (20,000 | ) | | | 8.85 | |
| Balance as of December 31, 2011 | | | 640,000 | | | | 6.34 | |
| Vested | | | — | | | | — | |
| Forfeited (note iii) | | | (100,000 | ) | | | 7.18 | |
| Balance as of December 31, 2012 | | | 540,000 | | | | 6.34 | |
| Note i | The performance awards which were granted on January 1, 2011 vest in equal annual installments over a period of three years from January 1, 2011 to December 31, 2013 and are subject to meeting certain earnings or other performance measures in 2011, 2012 and 2013. |
| Note ii | During the year ended December 31, 2011, the Company has granted share awards that contain service and market conditions. For share awards with market conditions, the market conditions are considered in the grant date fair value using a binomial model and will be recognized over the requisite service period regardless of whether the market condition is satisfied, provided that the requisite service period has been completed. The share awards which were granted on January 1, 2011 vest in equal annual installments over a period of three years from January 1, 2011 to December 31, 2013 and are subject to meeting the specified market condition in 2011, 2012 and 2013. |
| Note iii | During the year ended December 31, 2012, certain share awards were forfeited due to the resignation of employee before the end of the vesting period. |
The grant-date fair value of performance shares vested was USD177 for the year ended December 31, 2011.
| (e) | Share-based compensation of Comtech Broadband |
On December 31, 2010, the Group entered into an agreement to award 6,000,000 shares of Comtech Broadband’s common stock (“Equity Shares”) to an employee of Comtech Broadband (the “Comtech Broadband Stock Grant”). The purpose of the Comtech Broadband Stock Grant is to provide additional incentive to the employee. The Comtech Broadband Stock Grant was immediately vested upon grant.
The fair value of the above equity shares vested during the year ended December 31, 2010 was USD4,800. The Group performed a contemporaneous valuation of the equity by an unrelated valuation specialist using the income approach. The fair value is based on a discounted future cash flow that uses the Group’s estimates of revenue, driven by assumed market growth rates, and estimated costs as well as appropriate discount rates. Since Comtech Broadband is a private company, the Group applied a 20% marketability discount in carrying out the valuation. These estimates are consistent with the plans and estimates that the Group use to manage the business. Determining the fair value of the above Equity Shares requires making complex and subjective judgments and there is inherent uncertainty in making these estimates.
| 13. | EARNINGS / (LOSS) PER SHARE |
The following table sets forth the computation of basic and diluted earnings / (loss) per share for the year ended December 31:
| | | 2012 | | | 2012 | | | 2011 | | | 2010 | |
| | | USD | | | RMB | | | RMB | | | RMB | |
| Numerator for basic and diluted earnings per share: | | | | | | | | | | | | | | | | |
| Net income / (loss) attributable to Cogo Group, Inc. | | | 3,874 | | | | 24,130 | | | | (156,605 | ) | | | 112,375 | |
| | | | | | | | | | | | | | | | | |
| Denominator: | | | | | | | | | | | | | | | | |
| Basic weighted average shares | | | | | | | 36,355,124 | | | | 37,094,995 | | | | 37,275,427 | |
| Effect of dilutive non-vested equity share units, performance shares, options and warrants | | | | | | | 132,917 | | | | — | | | | 913,387 | |
| | | | | | | | | | | | | | | | | |
| Diluted weighted average shares | | | | | | | 36,488,041 | | | | 37,094,995 | | | | 38,188,814 | |
| | | | | | | | | | | | | | | | | |
| Basic earnings / (loss) per share | | | 0.11 | | | | 0.66 | | | | (4.22 | ) | | | 3.01 | |
| | | | | | | | | | | | | | | | | |
| Diluted earnings / (loss) per share | | | 0.11 | | | | 0.66 | | | | (4.22 | ) | | | 2.94 | |
Non-vested equity share units, performance shares, and options and warrants amounting to 3,387 thousand and 234 thousand as of December 31, 2012 and 2010, respectively, are excluded from the Company’s dilutive computation as their effect would be anti-dilutive. As of December 31, 2011, no potential common shares were dilutive because of the net loss.
| 14. | OPERATING SEGMENT INFORMATION |
ASC 280,Segment Reporting, establishes standards for reporting information about operating segments in financial statements. Operating segments are defined as components of an enterprise about which separate financial information is available that is evaluated regularly by the chief operating decision maker, or decision making group, in deciding how to allocate resources and in assessing performance.
Prior to 2012, the Company determined it had two operating segments: Product Sales and Service Revenue. The Product Sales segment primarily consisted of the sale of components for digital media (such as network protection devices and data storage), telecommunication system equipment and industrial applications end-markets. The Service Revenue segment primarily included the provision of technology and engineering services, business process outsourcing, network system integration and related training and maintenance services.
No external service revenue was generated by the Group for the years ended December 31, 2012 and 2011. Due to the decreasing significance of Service Revenue segment, there was a change in the reporting information about operating segments of the Company in 2012. Financial information available that is evaluated regularly by the chief operating decision maker in allocating resources and in assessing performance does not differentiate the Product Sales segment and Service Revenue segment. Thus, Service Revenue segment is not considered as a reportable segment for the year ended December 31, 2012. It is considered that the Company operates in a single business segment as the revenue and profit are derived entirely from sales of components for digital media (such as network protection devices and data storage), telecommunication system equipment and industrial applications end-markets to the customers. Accordingly, no operating segment information is presented for the year ended December 31, 2012.
Substantially all of the Group’s operations are in the PRC. Consequentially, no geographic information is presented.
The following is the segment information for the year ended December 31, 2011:
| | | Product
Sales | | | Service
Revenue | | | Unallocated | | | Total | |
| | | RMB | | | RMB | | | RMB | | | RMB | |
| Net revenue | | | | | | | | | | | | | | | | |
| Segment revenue from external customers | | | 3,554,401 | | | | — | | | | — | | | | 3,554,401 | |
| Inter-segment revenue | | | — | | | | 11,861 | | | | — | | | | 11,861 | |
| | | | | | | | | | | | | | | | | |
| | | | 3,554,401 | | | | 11,861 | | | | — | | | | 3,566,262 | |
| | | | | | | | | | | | | | | | | |
| Income / (loss) from operations | | | (10,731 | ) | | | (38,939 | ) | | | (82,772 | ) | | | (132,442 | ) |
| Interest expense | | | (20,152 | ) | | | — | | | | — | | | | (20,152 | ) |
| Interest income | | | 14,802 | | | | 126 | | | | — | | | | 14,928 | |
| | | | | | | | | | | | | | | | | |
| Earnings / (loss) before income taxes and extraordinary item | | | (16,081 | ) | | | (38,813 | ) | | | (82,772 | ) | | | (137,666 | ) |
| | | | | | | | | | | | | | | | | |
| Income tax expense | | | 10,492 | | | | 1,061 | | | | — | | | | 11,553 | |
| Significant non-cash items: | | | | | | | | | | | | | | | | |
| – Depreciation and amortization | | | 34,248 | | | | 562 | | | | — | | | | 34,810 | |
| – Provision for inventory write-down | | | 63 | | | | — | | | | — | | | | 63 | |
| – Provision for doubtful accounts | | | 2,325 | | | | — | | | | — | | | | 2,325 | |
| – Share-based compensation cost | | | — | | | | — | | | | 66,723 | | | | 66,723 | |
| – Impairment loss of goodwill (note 8) | | | 189,296 | | | | 47,649 | | | | — | | | | 236,945 | |
| | | | | | | | | | | | | | | | | |
| Segment assets | | | 2,544,840 | | | | 12,739 | | | | 2,409 | | | | 2,559,988 | |
| | | | | | | | | | | | | | | | | |
| Total expenditures for additions to long-lived assets | | | | | | | | | | | | | | | | |
| – Property and equipment | | | 9,932 | | | | 103 | | | | — | | | | 10,035 | |
| – Intangible assets (note 7) | | | 98,527 | | | | — | | | | — | | | | 98,527 | |
| – Goodwill (note 7) | | | 61,509 | | | | — | | | | — | | | | 61,509 | |
The following is the segment information for the year ended December 31, 2010:
| | | Product
Sales | | | Service
Revenue | | | Unallocated | | | Total | |
| | | RMB | | | RMB | | | RMB | | | RMB | |
| Net revenue | | | | | | | | | | | | | | | | |
| Segment revenue from external customers | | | 2,554,991 | | | | 34,527 | | | | — | | | | 2,589,518 | |
| Inter-segment revenue | | | — | | | | 18,780 | | | | — | | | | 18,780 | |
| | | | | | | | | | | | | | | | | |
| | | | 2,554,991 | | | | 53,307 | | | | — | | | | 2,608,298 | |
| | | | | | | | | | | | | | | | | |
| Income from operations | | | 196,986 | | | | 6,437 | | | | (83,805 | ) | | | 119,618 | |
| Interest expense | | | (9,407 | ) | | | — | | | | — | | | | (9,407 | ) |
| Interest income | | | 14,597 | | | | 66 | | | | 30 | | | | 14,693 | |
| | | | | | | | | | | | | | | | | |
| Earnings before income taxes and extraordinary item | | | 202,176 | | | | 6,503 | | | | (83,775 | ) | | | 124,904 | |
| | | | | | | | | | | | | | | | | |
| Income tax expense | | | 9,770 | | | | 2,079 | | | | — | | | | 11,849 | |
| Significant non-cash items: | | | | | | | | | | | | | | | | |
| – Depreciation and amortization | | | 27,275 | | | | 672 | | | | — | | | | 27,947 | |
| – Provision for inventory write-down | | | 9,600 | | | | — | | | | — | | | | 9,600 | |
| – Provision for doubtful accounts | | | 2 | | | | — | | | | — | | | | 2 | |
| – Share-based compensation cost | | | 31,680 | | | | — | | | | 69,250 | | | | 100,930 | |
| – Impairment loss of goodwill and intangible assets (notes 7 and 8) | | | 21,422 | | | | — | | | | — | | | | 21,422 | |
| – Net gain on settlement relating to the acquisition of Long | | | | | | | | | | | | | | | | |
| Rise before goodwill impairment (note 7) | | | (43,676 | ) | | | — | | | | — | | | | (43,676 | ) |
| | | | | | | | | | | | | | | | | |
| Segment assets | | | 2,298,459 | | | | 21,995 | | | | 1,563 | | | | 2,322,017 | |
| | | | | | | | | | | | | | | | | |
| Total expenditures for additions to long-lived assets | | | | | | | | | | | | | | | | |
| – Property and equipment | | | 6,356 | | | | 539 | | | | — | | | | 6,895 | |
Revenues from external customers by product category are summarized as follows:
| | | 2012 | | | 2012 | | | 2011 | | | 2010 | |
| | | USD | | | RMB | | | RMB | | | RMB | |
| Net revenue | | | | | | | | | | | | | | | | |
| Product Sales | | | | | | | | | | | | | | | | |
| Digital media | | | 297,202 | | | | 1,851,600 | | | | 1,503,082 | | | | 1,474,238 | |
| Telecommunications equipment | | | 346,935 | | | | 2,161,438 | | | | 1,318,176 | | | | 630,149 | |
| Industrial Business | | | 140,866 | | | | 877,611 | | | | 733,143 | | | | 450,604 | |
| | | | | | | | | | | | | | | | | |
| | | | 785,003 | | | | 4,890,649 | | | | 3,554,401 | | | | 2,554,991 | |
| Service Revenue | | | — | | | | — | | | | — | | | | 34,527 | |
| | | | | | | | | | | | | | | | | |
| Total net revenue | | | 785,003 | | | | 4,890,649 | | | | 3,554,401 | | | | 2,589,518 | |
According to laws applicable to the foreign investment enterprises in the PRC and the Articles of Association of certain subsidiaries of the Company in the PRC (the “PRC subsidiaries”), the PRC subsidiaries are required to appropriate part of their net profits as determined in accordance with the accounting principles and the relevant financial regulations applicable to enterprises limited by shares as established by the Ministry of Finance of the PRC (“PRC GAAP”) to various reserves. These include general reserves, statutory surplus reserve and statutory public welfare fund.
For general reserve, appropriation to general reserve is at the discretion of the board of directors of the relevant PRC subsidiaries. The reserve can only be used for specific purposes and is not distributable as cash dividends.
For statutory surplus reserve, 10% of the net profit, as determined in accordance with PRC GAAP, of the relevant PRC subsidiaries is transferred to the statutory surplus reserve until the reserve balance reaches 50% of the registered capital of the relevant PRC companies. The transfer to this reserve must be made before distribution of dividends to shareholders can be made. The statutory surplus reserve can be used to make good previous years’ losses, if any, and may be converted into share capital by the issue of new shares to shareholders in proportion to their existing shareholders or by increasing the par value of the shares currently held by the shareholders, provided that the balance after such issue is not less than 25% of the registered capital. Any amount of funds outside of the 50% reserve balance can be distributed as by the relevant PRC subsidiaries, as advances or cash dividends, subject however, to complying with applicable requirements. Such dividend or loans could take a considerable amount of time to implement and to be processed by certain governmental agencies.
For statutory public welfare fund, 5% to 10% of the net profit, as determined in accordance with PRC GAAP, of the relevant PRC subsidiaries is transferred to the statutory public welfare fund. This fund can only be utilized on capital items for the collective benefit of the employees such as the construction of dormitories, canteen and other staff welfare facilities. The fund is non-distributable other than on liquidation. The transfer to this fund must be made before distribution of dividends to shareholders can be made.
The accumulated balance of these statutory reserves maintained at the Company’s PRC subsidiaries as of December 31, 2012 and 2011 were RMB41,625 (USD6,681) and RMB55,298, respectively.
| 16. | COMMITMENTS AND CONTINGENCIES |
| (a) | Acquisition on Goldshare Holdings Limited (“Goldshare”) |
On April 1, 2011, the Group entered into a note subscription and share purchase agreement to acquire 3,142,857 shares (representing 44% of the outstanding shares) of Goldshare for a cash consideration of RMB22,000; and to subscribe to a convertible note to be issued by Goldshare for RMB20,000. The note can be convertible into 2,857,143 new shares of Goldshare at the option of the Group. If the Group exercises the conversion option of the convertible note, the Group will hold a total of 60% of the outstanding shares of Goldshare and Goldshare will become a subsidiary of the Group. The Group has not completed the acquisition of Goldshare because certain closing conditions, including the condition that required Goldshare to provide detailed monthly operation plan for a twelve-month period to the Company’s reasonable satisfaction, had not yet been fulfilled.
Goldshare engages in the business of distribution of chassis, capacitors, resistors and enclosures with most of its operations in the PRC. The purchase consideration will be contingently payable at various dates upon achieving certain agreed future earnings levels of Goldshare.
As of December 31, 2012, the Group has advanced RMB26,026 (USD4,177) to Goldshare in connection with this acquisition.
| (b) | The Group leases its office facilities under non-cancellable operating leases. The leases have remaining terms up to eighteen months. Rental expense was RMB11,211 (USD1,799), RMB11,197 and RMB10,491 for the years ended December 31, 2012, 2011, and 2010, respectively. |
Future minimum lease payments under non-cancellable operating leases as of December 31, 2012 were as follows:
| | | USD | | | RMB | |
| Year ending December 31, | | | | | | |
| 2013 | | | 832 | | | | 5,184 | |
| 2014 | | | 109 | | | | 677 | |
| | | | | | | | | |
| Total | | | 941 | | | | 5,861 | |
| (c) | As of December 31, 2012, the Group has outstanding purchase orders for components from suppliers in the amount of approximately RMB678,479 (USD108,903). The Group does not have any minimum purchase obligations with these suppliers. Other than as disclosed above, the Group had no other contractual obligations, off-balance sheet guarantees or arrangements as of December 31, 2012. |
Revenue concentration
A substantial percentage of the Group’s sales are made to the following customer. Details of the customer accounting for 10% or more of total net revenue are as follows:
| | | 2012 | | | 2011 | | | 2010 | |
| Customer A | | | 16 | % | | | 29 | % | | | 26 | % |
The total amount of revenues from the customer accounting for 10% or more of total net revenue is as follow:
| | | 2012 | | | 2012 | | | 2011 | | | 2010 | |
| | | USD | | | RMB | | | RMB | | | RMB | |
| Customer A | | | 126,151 | | | | 785,933 | | | | 1,039,896 | | | | 672,641 | |
The customer with sales over 10% is within the Product Sales segment for the years ended December 31, 2011 and 2010.
Details of the accounts receivable from the customer with the largest receivable balances as of December 31, 2012 and 2011 are as follows:
| | | % of accounts receivable | |
| | | 2012 | | | 2011 | |
| Customer A | | | 15 | % | | | 13 | % |
Dependence on suppliers
The Group typically rely on a limited number of key suppliers, and many customized module design solutions that are developed by the Group are designed around technology components provided by these suppliers. The Group typically does not have long-term supply agreements or other forms of exclusive arrangements with these suppliers. If the Group loses a key supplier or a supplier reduces the quantity of products it sells to the Group, it does not maintain a sufficient inventory level of products required or is otherwise unable to meet the demand for its components, the Group may have to expend significant time, effort and other resources to locate a suitable alternative supplier and secure replacement components. If suitable replacement components are unavailable, the Group may be forced to redevelop certain of its solutions, which ultimately may not be accepted by the customers.
A substantial percentage of the Group’s purchases are made from the following supplier. Details of the major supplier are as follows:
| | | 2012 | | | 2011 | | | 2010 | |
| Supplier A | | | 45.7 | % | | | 41.1 | % | | | 37.7 | % |
| 18. | RELATED PARTY TRANSACTIONS |
For the years presented, the principal related party transactions and amounts due from related party are summarized as follows:
| | | | | Year ended December 31, | |
| | | Note | | 2012 | | | 2012 | | | 2011 | | | 2010 | |
| | | | | USD | | | RMB | | | RMB | | | RMB | |
| Sales of products | | (i) | | | 590 | | | | 3,675 | | | | — | | | | — | |
| Purchase of products | | (ii) | | | 1,131 | | | | 7,047 | | | | — | | | | — | |
| Guarantee fee | | (iii) | | | 125 | | | | 779 | | | | | | | | | |
| Service fee | | (iv) | | | 157 | | | | 976 | | | | — | | | | — | |
| | | | | December 31, | |
| | | | | 2012 | | | 2012 | | | 2011 | |
| | | | | USD | | | RMB | | | RMB | |
| Current assets | | | | | | | | | | | | | | |
| Amount due from Envision | | (v) | | | 5,737 | | | | 35,743 | | | | — | |
Notes:
| (i) | For the year ended December 31, 2012, the Group sold components for digital media, telecommunication system equipment and industrial applications end-markets to Envision. |
| (ii) | For the year ended December 31, 2012, the Group purchased components for digital media, telecommunication system equipment and industrial applications end-markets from Envision. |
| (iii) | For the year ended December 31, 2012, the Group charged a guarantee fee of USD250 per quarter to act as the guarantors of the Disposal Group in respect of all existing bank facilities. |
| (iv) | For the year ended December 31, 2012, the Group charged a service fee for the provision of supportive and administrative services to the Disposal Group. |
| (v) | As of December 31, 2012, the amount due from Envision was unsecured, interest-free and repayable within one year. |
| 19. | EMPLOYEE BENEFIT PLANS |
Certain employees of the Group in the PRC are entitled to retirement benefits based on their salaries and length of service upon retirement in accordance with a PRC government-managed retirement plan. The PRC government is directly responsible for the payments of the benefits to these retired employees. The Group is required to make contributions to the government-managed retirement plan at 6.5% to 9% of the monthly basic salaries of certain employees. The contribution expense for the years ended December 31, 2012, 2011 and 2010 was RMB13,142 (USD2,109), RMB11,792 and RMB7,770, respectively.
The Group operates a Mandatory Provident Fund Scheme (“the MPF scheme”) under the Hong Kong Mandatory Provident Fund Schemes Ordinance for employees employed under the jurisdiction of the Hong Kong Employment Ordinance. The assets of the MPF scheme are held by independent trustees and are separated from those of the Group’s assets. Under the MPF scheme, the employer and its employees are each required to make contributions to the plan at 5% of the employees’ relevant income, subject to a cap of monthly relevant income of HKD22.5. Contributions to the plan by the employee vest immediately. The contributions paid by the Group for the years ended December 31, 2012, 2011 and 2010 were RMB430 (USD69), RMB340 and RMB321, respectively.
| 20. | FAIR VALUE MEASUREMENTS |
The fair values of pledged bank deposits, accounts receivable, accounts payable, bank borrowings, and accrued expenses and other liabilities approximated the respective carrying amounts because of the short maturity of these instruments. The Group adopted ASC 820-10,Fair Value Measurements and Disclosures for the nonfinancial assets and liabilities that are remeasured at fair value on a nonrecurring basis.
Level 1
Observable inputs, such as quoted market prices in active markets for the identical asset or liability that are accessible at the measurement date.
Level 2
Inputs, other than quoted market prices included in Level 1, that are observable either directly or indirectly for the asset or liability.
Level 3
Unobservable inputs that reflect the entity’s own assumptions about the exit price of the asset or liability. Unobservable inputs may be used if there is little or no market data for the asset or liability at the measurement date.
In calculating the goodwill impairment (note 8(c)), the Company adopted the combination of market and income approach with level 3 inputs and determined that the carrying amounts of goodwill are impaired to their respective implied fair values of nil as of December 31, 2011. In calculating goodwill impairment for Long Rise (note 7(c)), the Company adopted the income approach. The Company’s goodwill of Long Rise as measured and disclosed as a level 3 input at fair value on a nonrecurring basis was nil as of December 31, 2010.
The Company also applied the income approach with level 3 inputs in measuring and disclosing the fair value of the share-based compensation of Comtech Broadband (note 12(e)).
There were no transfers of instruments into or out of level 1, level 2 or level 3 for the year ended December 31, 2012.
The RMB is not a freely convertible currency. The State Administration for Foreign Exchange, under the authority of the People’s Bank of China, controls the conversion of RMB into foreign currencies. The value of the RMB is subject to changes in central government policies and to international economic and political developments affecting supply and demand in the China Foreign Exchange Trading System market.
The PRC subsidiaries conduct their business substantially in the PRC, and their financial performance and position are measured in terms of RMB. Any devaluation of the RMB against the USD would consequently have an adverse effect on the financial performance and asset values of the Group when measured in terms of USD. The PRC subsidiaries’ products are primarily procured, sold and delivered in the PRC for RMB. Thus, their revenues and profits are predominantly denominated in RMB.
The Group is exposed to interest rate risk arising from short-term variable rate borrowings from time to time. The Group’s future interest expense will fluctuate in line with any change in borrowing rates. The Group does not have any derivative financial instruments as of December 31, 2012 and 2011 and believes its exposure to interest rate risk is not material.