Exhibit 99.2 1Q 2019 Earnings Call Supplemental Presentation May 8, 2019Exhibit 99.2 1Q 2019 Earnings Call Supplemental Presentation May 8, 2019
Safe Harbor Statement This document contains summarized information concerning Regional Management Corp. (the “Company”) and the Company’s business, operations, financial performance, and trends. No representation is made that the information in this document is complete. For additional financial, statistical, and business information, please see the Company’s most recent Annual Report on Form 10-K and Quarterly Reports on Form 10-Q filed with the U.S. Securities and Exchange Commission (the “SEC”), as well as the Company’s other reports filed with the SEC from time to time. Such reports are or will be available on the Company’s website (www.regionalmanagement.com) and on the SEC’s website (www.sec.gov). This presentation, the related remarks, and the responses to various questions may contain various “forward-looking statements” within the meaning of the Private Securities Litigation Reform Act of 1995, which represent the Company’s expectations or beliefs concerning future events. Words such as “may,” “will,” “should,” “likely,” “anticipates,” “expects,” “intends,” “plans,” “projects,” “believes,” “estimates,” “outlook,” and similar expressions may be used to identify these forward-looking statements. Such forward-looking statements are about matters that are inherently subject to risks and uncertainties, many of which are outside of the control of the Company. Factors that could cause actual results or performance to differ from the expectations expressed or implied in such forward-looking statements include, but are not limited to, the following: changes in general economic conditions, including levels of unemployment and bankruptcies; risks associated with the Company’s transition to a new loan origination and servicing software system; risks related to opening new branches, including the ability or inability to open new branches as planned; risks inherent in making loans, including credit risk, repayment risk, and value of collateral, which risks may increase in light of adverse or recessionary economic conditions; risks associated with the implementation of new underwriting models and processes, including as to the effectiveness of new custom scorecards; risks relating to the Company’s asset-backed securitization transactions; changes in interest rates; the risk that the Company’s existing sources of liquidity become insufficient to satisfy its needs or that its access to these sources becomes unexpectedly restricted; changes in federal, state, or local laws, regulations, or regulatory policies and practices, and risks associated with the manner in which laws and regulations are interpreted, implemented, and enforced; the impact of changes in tax laws, guidance, and interpretations, including related to certain provisions of the Tax Cuts and Jobs Act; the timing and amount of revenues that may be recognized by the Company; changes in current revenue and expense trends (including trends affecting delinquencies and credit losses); changes in the Company’s markets and general changes in the economy (particularly in the markets served by the Company); changes in the competitive environment in which the Company operates or a decrease in the demand for its products; the impact of a prolonged shutdown of the federal government; risks related to acquisitions; changes in operating and administrative expenses; and the departure, transition, or replacement of key personnel. Such factors and others are discussed in greater detail in the Company’s filings with the SEC. The Company cannot guarantee future events, results, actions, levels of activity, performance, or achievements. Except to the extent required by law, neither the Company nor any of its respective agents, employees, or advisors intend or have any duty or obligation to supplement, amend, update, or revise any forward-looking statement, whether as a result of new information, future developments, or otherwise. The information and opinions contained in this document are provided as of the date of this presentation and are subject to change without notice. This document has not been approved by any regulatory or supervisory authority. 2Safe Harbor Statement This document contains summarized information concerning Regional Management Corp. (the “Company”) and the Company’s business, operations, financial performance, and trends. No representation is made that the information in this document is complete. For additional financial, statistical, and business information, please see the Company’s most recent Annual Report on Form 10-K and Quarterly Reports on Form 10-Q filed with the U.S. Securities and Exchange Commission (the “SEC”), as well as the Company’s other reports filed with the SEC from time to time. Such reports are or will be available on the Company’s website (www.regionalmanagement.com) and on the SEC’s website (www.sec.gov). This presentation, the related remarks, and the responses to various questions may contain various “forward-looking statements” within the meaning of the Private Securities Litigation Reform Act of 1995, which represent the Company’s expectations or beliefs concerning future events. Words such as “may,” “will,” “should,” “likely,” “anticipates,” “expects,” “intends,” “plans,” “projects,” “believes,” “estimates,” “outlook,” and similar expressions may be used to identify these forward-looking statements. Such forward-looking statements are about matters that are inherently subject to risks and uncertainties, many of which are outside of the control of the Company. Factors that could cause actual results or performance to differ from the expectations expressed or implied in such forward-looking statements include, but are not limited to, the following: changes in general economic conditions, including levels of unemployment and bankruptcies; risks associated with the Company’s transition to a new loan origination and servicing software system; risks related to opening new branches, including the ability or inability to open new branches as planned; risks inherent in making loans, including credit risk, repayment risk, and value of collateral, which risks may increase in light of adverse or recessionary economic conditions; risks associated with the implementation of new underwriting models and processes, including as to the effectiveness of new custom scorecards; risks relating to the Company’s asset-backed securitization transactions; changes in interest rates; the risk that the Company’s existing sources of liquidity become insufficient to satisfy its needs or that its access to these sources becomes unexpectedly restricted; changes in federal, state, or local laws, regulations, or regulatory policies and practices, and risks associated with the manner in which laws and regulations are interpreted, implemented, and enforced; the impact of changes in tax laws, guidance, and interpretations, including related to certain provisions of the Tax Cuts and Jobs Act; the timing and amount of revenues that may be recognized by the Company; changes in current revenue and expense trends (including trends affecting delinquencies and credit losses); changes in the Company’s markets and general changes in the economy (particularly in the markets served by the Company); changes in the competitive environment in which the Company operates or a decrease in the demand for its products; the impact of a prolonged shutdown of the federal government; risks related to acquisitions; changes in operating and administrative expenses; and the departure, transition, or replacement of key personnel. Such factors and others are discussed in greater detail in the Company’s filings with the SEC. The Company cannot guarantee future events, results, actions, levels of activity, performance, or achievements. Except to the extent required by law, neither the Company nor any of its respective agents, employees, or advisors intend or have any duty or obligation to supplement, amend, update, or revise any forward-looking statement, whether as a result of new information, future developments, or otherwise. The information and opinions contained in this document are provided as of the date of this presentation and are subject to change without notice. This document has not been approved by any regulatory or supervisory authority. 2
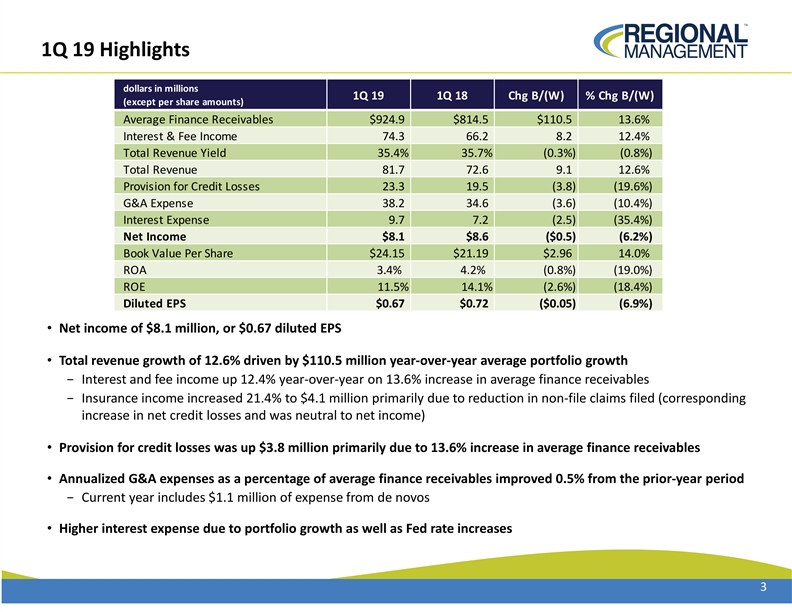
1Q 19 Highlights dollars in millions 1Q 19 1Q 18 Chg B/(W) % Chg B/(W) (except per share amounts) Average Finance Receivables $924.9 $814.5 $110.5 13.6% Interest & Fee Income 74.3 66.2 8.2 12.4% Total Revenue Yield 35.4% 35.7% (0.3%) (0.8%) Total Revenue 81.7 72.6 9.1 12.6% Provision for Credit Losses 23.3 19.5 (3.8) (19.6%) G&A Expense 38.2 34.6 (3.6) (10.4%) Interest Expense 9.7 7.2 (2.5) (35.4%) Net Income $8.1 $8.6 ($0.5) (6.2%) Book Value Per Share $24.15 $21.19 $2.96 14.0% ROA 3.4% 4.2% (0.8%) (19.0%) ROE 11.5% 14.1% (2.6%) (18.4%) Diluted EPS $0.67 $0.72 ($0.05) (6.9%) • Net income of $8.1 million, or $0.67 diluted EPS • Total revenue growth of 12.6% driven by $110.5 million year-over-year average portfolio growth − Interest and fee income up 12.4% year-over-year on 13.6% increase in average finance receivables − Insurance income increased 21.4% to $4.1 million primarily due to reduction in non-file claims filed (corresponding increase in net credit losses and was neutral to net income) • Provision for credit losses was up $3.8 million primarily due to 13.6% increase in average finance receivables • Annualized G&A expenses as a percentage of average finance receivables improved 0.5% from the prior-year period − Current year includes $1.1 million of expense from de novos • Higher interest expense due to portfolio growth as well as Fed rate increases 31Q 19 Highlights dollars in millions 1Q 19 1Q 18 Chg B/(W) % Chg B/(W) (except per share amounts) Average Finance Receivables $924.9 $814.5 $110.5 13.6% Interest & Fee Income 74.3 66.2 8.2 12.4% Total Revenue Yield 35.4% 35.7% (0.3%) (0.8%) Total Revenue 81.7 72.6 9.1 12.6% Provision for Credit Losses 23.3 19.5 (3.8) (19.6%) G&A Expense 38.2 34.6 (3.6) (10.4%) Interest Expense 9.7 7.2 (2.5) (35.4%) Net Income $8.1 $8.6 ($0.5) (6.2%) Book Value Per Share $24.15 $21.19 $2.96 14.0% ROA 3.4% 4.2% (0.8%) (19.0%) ROE 11.5% 14.1% (2.6%) (18.4%) Diluted EPS $0.67 $0.72 ($0.05) (6.9%) • Net income of $8.1 million, or $0.67 diluted EPS • Total revenue growth of 12.6% driven by $110.5 million year-over-year average portfolio growth − Interest and fee income up 12.4% year-over-year on 13.6% increase in average finance receivables − Insurance income increased 21.4% to $4.1 million primarily due to reduction in non-file claims filed (corresponding increase in net credit losses and was neutral to net income) • Provision for credit losses was up $3.8 million primarily due to 13.6% increase in average finance receivables • Annualized G&A expenses as a percentage of average finance receivables improved 0.5% from the prior-year period − Current year includes $1.1 million of expense from de novos • Higher interest expense due to portfolio growth as well as Fed rate increases 3
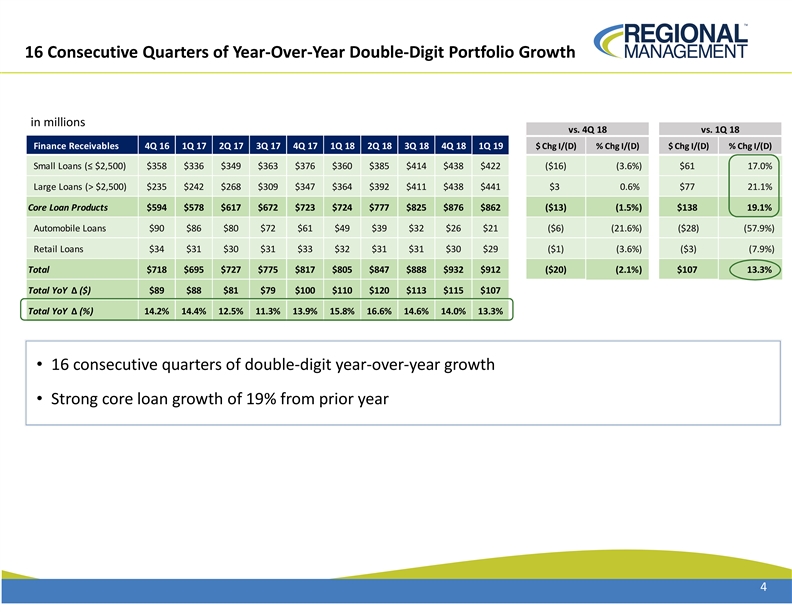
16 Consecutive Quarters of Year-Over-Year Double-Digit Portfolio Growth in millions vs. 4Q 18 vs. 1Q 18 Finance Receivables 4Q 16 1Q 17 2Q 17 3Q 17 4Q 17 1Q 18 2Q 18 3Q 18 4Q 18 1Q 19 $ Chg I/(D) % Chg I/(D) $ Chg I/(D) % Chg I/(D) Small Loans (≤ $2,500) $358 $336 $349 $363 $376 $360 $385 $414 $438 $422 ($16) (3.6%) $61 17.0% Large Loans (> $2,500) $235 $242 $268 $309 $347 $364 $392 $411 $438 $441 $3 0.6% $77 21.1% Core Loan Products $594 $578 $617 $672 $723 $724 $777 $825 $876 $862 ($13) (1.5%) $138 19.1% Automobile Loans $90 $86 $80 $72 $61 $49 $39 $32 $26 $21 ($6) (21.6%) ($28) (57.9%) Retail Loans $34 $31 $30 $31 $33 $32 $31 $31 $30 $29 ($1) (3.6%) ($3) (7.9%) Total $718 $695 $727 $775 $817 $805 $847 $888 $932 $912 ($20) (2.1%) $107 13.3% Total YoY Δ ($) $89 $88 $81 $79 $100 $110 $120 $113 $115 $107 Total YoY Δ (%) 14.2% 14.4% 12.5% 11.3% 13.9% 15.8% 16.6% 14.6% 14.0% 13.3% • 16 consecutive quarters of double-digit year-over-year growth • Strong core loan growth of 19% from prior year 416 Consecutive Quarters of Year-Over-Year Double-Digit Portfolio Growth in millions vs. 4Q 18 vs. 1Q 18 Finance Receivables 4Q 16 1Q 17 2Q 17 3Q 17 4Q 17 1Q 18 2Q 18 3Q 18 4Q 18 1Q 19 $ Chg I/(D) % Chg I/(D) $ Chg I/(D) % Chg I/(D) Small Loans (≤ $2,500) $358 $336 $349 $363 $376 $360 $385 $414 $438 $422 ($16) (3.6%) $61 17.0% Large Loans (> $2,500) $235 $242 $268 $309 $347 $364 $392 $411 $438 $441 $3 0.6% $77 21.1% Core Loan Products $594 $578 $617 $672 $723 $724 $777 $825 $876 $862 ($13) (1.5%) $138 19.1% Automobile Loans $90 $86 $80 $72 $61 $49 $39 $32 $26 $21 ($6) (21.6%) ($28) (57.9%) Retail Loans $34 $31 $30 $31 $33 $32 $31 $31 $30 $29 ($1) (3.6%) ($3) (7.9%) Total $718 $695 $727 $775 $817 $805 $847 $888 $932 $912 ($20) (2.1%) $107 13.3% Total YoY Δ ($) $89 $88 $81 $79 $100 $110 $120 $113 $115 $107 Total YoY Δ (%) 14.2% 14.4% 12.5% 11.3% 13.9% 15.8% 16.6% 14.6% 14.0% 13.3% • 16 consecutive quarters of double-digit year-over-year growth • Strong core loan growth of 19% from prior year 4
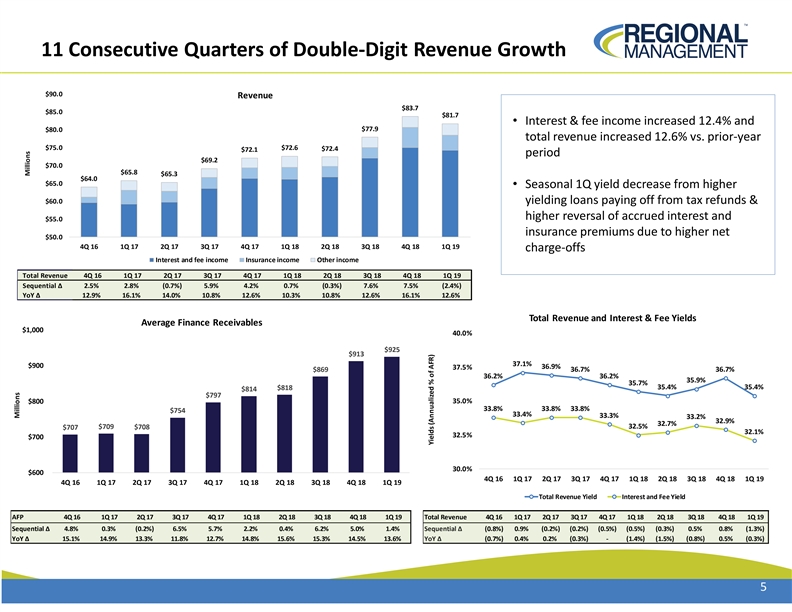
11 Consecutive Quarters of Double-Digit Revenue Growth $90.0 Revenue $83.7 $85.0 $81.7 • Interest & fee income increased 12.4% and $77.9 $80.0 total revenue increased 12.6% vs. prior-year $75.0 $72.6 $72.4 $72.1 period $69.2 $70.0 $65.8 $65.3 $64.0 $65.0 • Seasonal 1Q yield decrease from higher $60.0 yielding loans paying off from tax refunds & higher reversal of accrued interest and $55.0 insurance premiums due to higher net $50.0 4Q 16 1Q 17 2Q 17 3Q 17 4Q 17 1Q 18 2Q 18 3Q 18 4Q 18 1Q 19 charge-offs Interest and fee income Insurance income Other income Total Revenue 4Q 16 1Q 17 2Q 17 3Q 17 4Q 17 1Q 18 2Q 18 3Q 18 4Q 18 1Q 19 Sequential Δ 2.5% 2.8% (0.7%) 5.9% 4.2% 0.7% (0.3%) 7.6% 7.5% (2.4%) YoY Δ 12.9% 16.1% 14.0% 10.8% 12.6% 10.3% 10.8% 12.6% 16.1% 12.6% Total Revenue and Interest & Fee Yields Average Finance Receivables $1,000 40.0% $925 $913 37.1% $900 36.9% 37.5% $869 36.7% 36.7% 36.2% 36.2% 35.9% 35.7% 35.4% 35.4% $818 $814 $797 35.0% $800 33.8% 33.8% 33.8% $754 33.4% 33.3% 33.2% 32.9% 32.7% $709 $708 32.5% $707 32.1% 32.5% $700 30.0% $600 4Q 16 1Q 17 2Q 17 3Q 17 4Q 17 1Q 18 2Q 18 3Q 18 4Q 18 1Q 19 4Q 16 1Q 17 2Q 17 3Q 17 4Q 17 1Q 18 2Q 18 3Q 18 4Q 18 1Q 19 Total Revenue Yield Interest and Fee Yield AFP 4Q 16 1Q 17 2Q 17 3Q 17 4Q 17 1Q 18 2Q 18 3Q 18 4Q 18 1Q 19 Total Revenue 4Q 16 1Q 17 2Q 17 3Q 17 4Q 17 1Q 18 2Q 18 3Q 18 4Q 18 1Q 19 Sequential Δ 4.8% 0.3% (0.2%) 6.5% 5.7% 2.2% 0.4% 6.2% 5.0% 1.4% Sequential Δ (0.8%) 0.9% (0.2%) (0.2%) (0.5%) (0.5%) (0.3%) 0.5% 0.8% (1.3%) YoY Δ 15.1% 14.9% 13.3% 11.8% 12.7% 14.8% 15.6% 15.3% 14.5% 13.6% YoY Δ (0.7%) 0.4% 0.2% (0.3%) - (1.4%) (1.5%) (0.8%) 0.5% (0.3%) 5 Millions Millions Yields (Annualized % of AFR)11 Consecutive Quarters of Double-Digit Revenue Growth $90.0 Revenue $83.7 $85.0 $81.7 • Interest & fee income increased 12.4% and $77.9 $80.0 total revenue increased 12.6% vs. prior-year $75.0 $72.6 $72.4 $72.1 period $69.2 $70.0 $65.8 $65.3 $64.0 $65.0 • Seasonal 1Q yield decrease from higher $60.0 yielding loans paying off from tax refunds & higher reversal of accrued interest and $55.0 insurance premiums due to higher net $50.0 4Q 16 1Q 17 2Q 17 3Q 17 4Q 17 1Q 18 2Q 18 3Q 18 4Q 18 1Q 19 charge-offs Interest and fee income Insurance income Other income Total Revenue 4Q 16 1Q 17 2Q 17 3Q 17 4Q 17 1Q 18 2Q 18 3Q 18 4Q 18 1Q 19 Sequential Δ 2.5% 2.8% (0.7%) 5.9% 4.2% 0.7% (0.3%) 7.6% 7.5% (2.4%) YoY Δ 12.9% 16.1% 14.0% 10.8% 12.6% 10.3% 10.8% 12.6% 16.1% 12.6% Total Revenue and Interest & Fee Yields Average Finance Receivables $1,000 40.0% $925 $913 37.1% $900 36.9% 37.5% $869 36.7% 36.7% 36.2% 36.2% 35.9% 35.7% 35.4% 35.4% $818 $814 $797 35.0% $800 33.8% 33.8% 33.8% $754 33.4% 33.3% 33.2% 32.9% 32.7% $709 $708 32.5% $707 32.1% 32.5% $700 30.0% $600 4Q 16 1Q 17 2Q 17 3Q 17 4Q 17 1Q 18 2Q 18 3Q 18 4Q 18 1Q 19 4Q 16 1Q 17 2Q 17 3Q 17 4Q 17 1Q 18 2Q 18 3Q 18 4Q 18 1Q 19 Total Revenue Yield Interest and Fee Yield AFP 4Q 16 1Q 17 2Q 17 3Q 17 4Q 17 1Q 18 2Q 18 3Q 18 4Q 18 1Q 19 Total Revenue 4Q 16 1Q 17 2Q 17 3Q 17 4Q 17 1Q 18 2Q 18 3Q 18 4Q 18 1Q 19 Sequential Δ 4.8% 0.3% (0.2%) 6.5% 5.7% 2.2% 0.4% 6.2% 5.0% 1.4% Sequential Δ (0.8%) 0.9% (0.2%) (0.2%) (0.5%) (0.5%) (0.3%) 0.5% 0.8% (1.3%) YoY Δ 15.1% 14.9% 13.3% 11.8% 12.7% 14.8% 15.6% 15.3% 14.5% 13.6% YoY Δ (0.7%) 0.4% 0.2% (0.3%) - (1.4%) (1.5%) (0.8%) 0.5% (0.3%) 5 Millions Millions Yields (Annualized % of AFR)
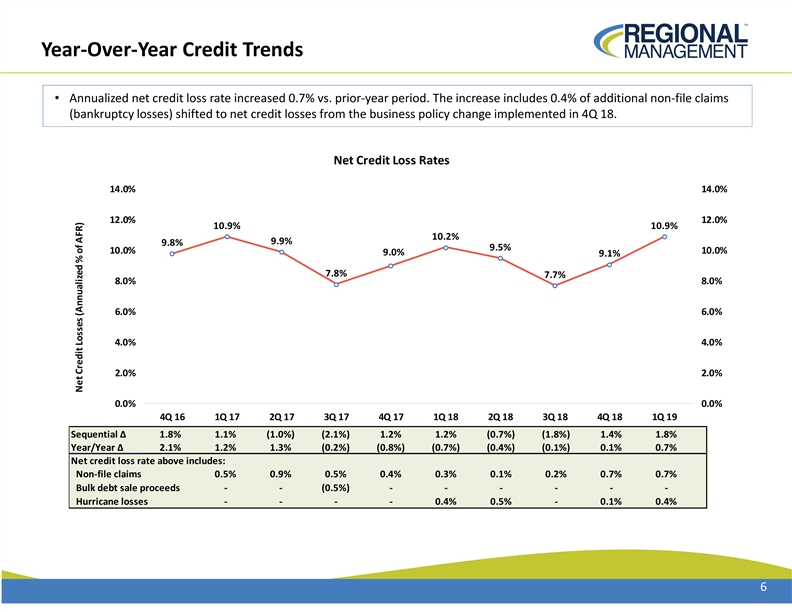
Year-Over-Year Credit Trends • Annualized net credit loss rate increased 0.7% vs. prior-year period. The increase includes 0.4% of additional non-file claims (bankruptcy losses) shifted to net credit losses from the business policy change implemented in 4Q 18. Net Credit Loss Rates 14.0% 14.0% 12.0% 12.0% 10.9% 10.9% 10.2% 9.9% 9.8% 9.5% 10.0% 10.0% 9.0% 9.1% 7.8% 7.7% 8.0% 8.0% 6.0% 6.0% 4.0% 4.0% 2.0% 2.0% 0.0% 0.0% 4Q 16 1Q 17 2Q 17 3Q 17 4Q 17 1Q 18 2Q 18 3Q 18 4Q 18 1Q 19 Sequential Δ 1.8% 1.1% (1.0%) (2.1%) 1.2% 1.2% (0.7%) (1.8%) 1.4% 1.8% Year/Year Δ 2.1% 1.2% 1.3% (0.2%) (0.8%) (0.7%) (0.4%) (0.1%) 0.1% 0.7% Net credit loss rate above includes: Non-file claims 0.5% 0.9% 0.5% 0.4% 0.3% 0.1% 0.2% 0.7% 0.7% Bulk debt sale proceeds - - (0.5%) - - - - - - Hurricane losses - - - - 0.4% 0.5% - 0.1% 0.4% 6 Net Credit Losses (Annualized % of AFR)Year-Over-Year Credit Trends • Annualized net credit loss rate increased 0.7% vs. prior-year period. The increase includes 0.4% of additional non-file claims (bankruptcy losses) shifted to net credit losses from the business policy change implemented in 4Q 18. Net Credit Loss Rates 14.0% 14.0% 12.0% 12.0% 10.9% 10.9% 10.2% 9.9% 9.8% 9.5% 10.0% 10.0% 9.0% 9.1% 7.8% 7.7% 8.0% 8.0% 6.0% 6.0% 4.0% 4.0% 2.0% 2.0% 0.0% 0.0% 4Q 16 1Q 17 2Q 17 3Q 17 4Q 17 1Q 18 2Q 18 3Q 18 4Q 18 1Q 19 Sequential Δ 1.8% 1.1% (1.0%) (2.1%) 1.2% 1.2% (0.7%) (1.8%) 1.4% 1.8% Year/Year Δ 2.1% 1.2% 1.3% (0.2%) (0.8%) (0.7%) (0.4%) (0.1%) 0.1% 0.7% Net credit loss rate above includes: Non-file claims 0.5% 0.9% 0.5% 0.4% 0.3% 0.1% 0.2% 0.7% 0.7% Bulk debt sale proceeds - - (0.5%) - - - - - - Hurricane losses - - - - 0.4% 0.5% - 0.1% 0.4% 6 Net Credit Losses (Annualized % of AFR)
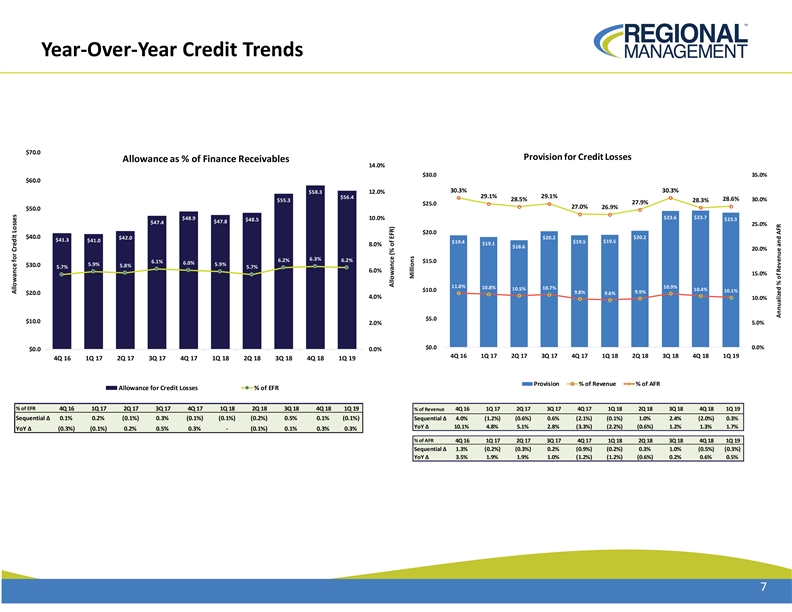
Year-Over-Year Credit Trends $70.0 Provision for Credit Losses Allowance as % of Finance Receivables 14.0% $30.0 35.0% $60.0 30.3% 30.3% $58.3 12.0% 29.1% 29.1% $56.4 28.5% 28.6% 30.0% $55.3 28.3% 27.9% $25.0 27.0% 26.9% $50.0 $23.6 $23.7 $48.9 10.0% $23.3 $48.5 $47.8 $47.4 25.0% $20.0 $40.0 $20.2 $42.0 $20.2 $41.3 $41.0 $19.5 $19.5 $19.4 $19.1 8.0% $18.6 20.0% 6.3% 6.2% 6.2% 6.1% $15.0 6.0% 5.9% 5.9% $30.0 5.8% 5.7% 5.7% 6.0% 15.0% 11.0% 10.8% 10.9% 10.7% 10.5% 10.4% $10.0 10.1% 9.8% 9.9% $20.0 9.6% 4.0% 10.0% $5.0 $10.0 2.0% 5.0% $0.0 0.0% $0.0 0.0% 4Q 16 1Q 17 2Q 17 3Q 17 4Q 17 1Q 18 2Q 18 3Q 18 4Q 18 1Q 19 4Q 16 1Q 17 2Q 17 3Q 17 4Q 17 1Q 18 2Q 18 3Q 18 4Q 18 1Q 19 Provision % of Revenue % of AFR Allowance for Credit Losses % of EFR % of EFR 4Q 16 1Q 17 2Q 17 3Q 17 4Q 17 1Q 18 2Q 18 3Q 18 4Q 18 1Q 19 % of Revenue 4Q 16 1Q 17 2Q 17 3Q 17 4Q 17 1Q 18 2Q 18 3Q 18 4Q 18 1Q 19 Sequential Δ 0.1% 0.2% (0.1%) 0.3% (0.1%) (0.1%) (0.2%) 0.5% 0.1% (0.1%) Sequential Δ 4.0% (1.2%) (0.6%) 0.6% (2.1%) (0.1%) 1.0% 2.4% (2.0%) 0.3% YoY Δ 10.1% 4.8% 5.1% 2.8% (3.3%) (2.2%) (0.6%) 1.2% 1.3% 1.7% YoY Δ (0.3%) (0.1%) 0.2% 0.5% 0.3% - (0.1%) 0.1% 0.3% 0.3% % of AFR 4Q 16 1Q 17 2Q 17 3Q 17 4Q 17 1Q 18 2Q 18 3Q 18 4Q 18 1Q 19 Sequential Δ 1.3% (0.2%) (0.3%) 0.2% (0.9%) (0.2%) 0.3% 1.0% (0.5%) (0.3%) YoY Δ 3.5% 1.9% 1.9% 1.0% (1.2%) (1.2%) (0.6%) 0.2% 0.6% 0.5% 7 Allowance for Credit Losses Allowance (% of EFR) Millions Annualized % of Revenue and AFRYear-Over-Year Credit Trends $70.0 Provision for Credit Losses Allowance as % of Finance Receivables 14.0% $30.0 35.0% $60.0 30.3% 30.3% $58.3 12.0% 29.1% 29.1% $56.4 28.5% 28.6% 30.0% $55.3 28.3% 27.9% $25.0 27.0% 26.9% $50.0 $23.6 $23.7 $48.9 10.0% $23.3 $48.5 $47.8 $47.4 25.0% $20.0 $40.0 $20.2 $42.0 $20.2 $41.3 $41.0 $19.5 $19.5 $19.4 $19.1 8.0% $18.6 20.0% 6.3% 6.2% 6.2% 6.1% $15.0 6.0% 5.9% 5.9% $30.0 5.8% 5.7% 5.7% 6.0% 15.0% 11.0% 10.8% 10.9% 10.7% 10.5% 10.4% $10.0 10.1% 9.8% 9.9% $20.0 9.6% 4.0% 10.0% $5.0 $10.0 2.0% 5.0% $0.0 0.0% $0.0 0.0% 4Q 16 1Q 17 2Q 17 3Q 17 4Q 17 1Q 18 2Q 18 3Q 18 4Q 18 1Q 19 4Q 16 1Q 17 2Q 17 3Q 17 4Q 17 1Q 18 2Q 18 3Q 18 4Q 18 1Q 19 Provision % of Revenue % of AFR Allowance for Credit Losses % of EFR % of EFR 4Q 16 1Q 17 2Q 17 3Q 17 4Q 17 1Q 18 2Q 18 3Q 18 4Q 18 1Q 19 % of Revenue 4Q 16 1Q 17 2Q 17 3Q 17 4Q 17 1Q 18 2Q 18 3Q 18 4Q 18 1Q 19 Sequential Δ 0.1% 0.2% (0.1%) 0.3% (0.1%) (0.1%) (0.2%) 0.5% 0.1% (0.1%) Sequential Δ 4.0% (1.2%) (0.6%) 0.6% (2.1%) (0.1%) 1.0% 2.4% (2.0%) 0.3% YoY Δ 10.1% 4.8% 5.1% 2.8% (3.3%) (2.2%) (0.6%) 1.2% 1.3% 1.7% YoY Δ (0.3%) (0.1%) 0.2% 0.5% 0.3% - (0.1%) 0.1% 0.3% 0.3% % of AFR 4Q 16 1Q 17 2Q 17 3Q 17 4Q 17 1Q 18 2Q 18 3Q 18 4Q 18 1Q 19 Sequential Δ 1.3% (0.2%) (0.3%) 0.2% (0.9%) (0.2%) 0.3% 1.0% (0.5%) (0.3%) YoY Δ 3.5% 1.9% 1.9% 1.0% (1.2%) (1.2%) (0.6%) 0.2% 0.6% 0.5% 7 Allowance for Credit Losses Allowance (% of EFR) Millions Annualized % of Revenue and AFR
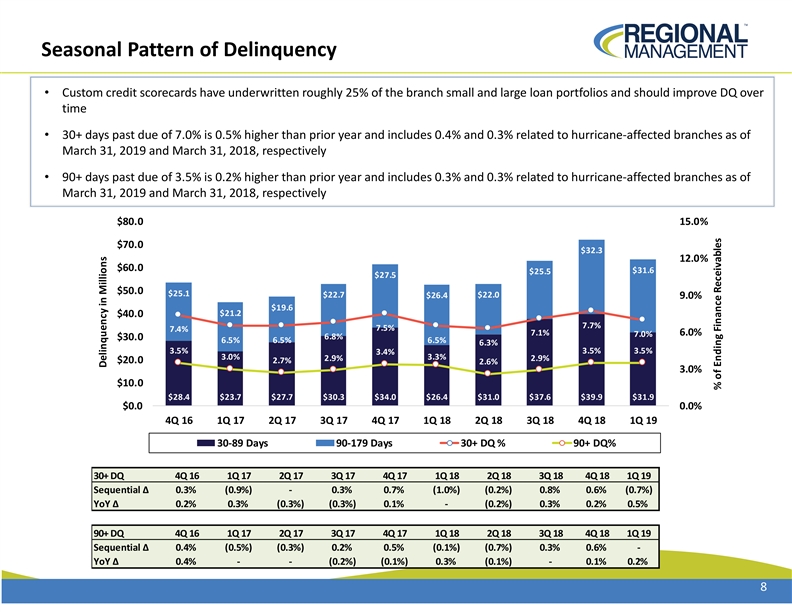
Seasonal Pattern of Delinquency • Custom credit scorecards have underwritten roughly 25% of the branch small and large loan portfolios and should improve DQ over time • 30+ days past due of 7.0% is 0.5% higher than prior year and includes 0.4% and 0.3% related to hurricane-affected branches as of March 31, 2019 and March 31, 2018, respectively • 90+ days past due of 3.5% is 0.2% higher than prior year and includes 0.3% and 0.3% related to hurricane-affected branches as of March 31, 2019 and March 31, 2018, respectively $80.0 15.0% $70.0 $32.3 12.0% $60.0 $31.6 $25.5 $27.5 $50.0 $25.1 $22.7 $26.4 $22.0 9.0% $19.6 $21.2 $40.0 7.7% 7.5% 7.4% 7.1% 6.0% 7.0% 6.8% $30.0 6.5% 6.5% 6.5% 6.3% 3.5% 3.5% 3.5% 3.4% 3.0% 3.3% 2.9% 2.9% $20.0 2.7% 2.6% 3.0% $10.0 $28.4 $23.7 $27.7 $30.3 $34.0 $26.4 $31.0 $37.6 $39.9 $31.9 $0.0 0.0% 4Q 16 1Q 17 2Q 17 3Q 17 4Q 17 1Q 18 2Q 18 3Q 18 4Q 18 1Q 19 30-89 Days 90-179 Days 30+ DQ % 90+ DQ% 30+ DQ 4Q 16 1Q 17 2Q 17 3Q 17 4Q 17 1Q 18 2Q 18 3Q 18 4Q 18 1Q 19 Sequential Δ 0.3% (0.9%) - 0.3% 0.7% (1.0%) (0.2%) 0.8% 0.6% (0.7%) YoY Δ 0.2% 0.3% (0.3%) (0.3%) 0.1% - (0.2%) 0.3% 0.2% 0.5% 90+ DQ 4Q 16 1Q 17 2Q 17 3Q 17 4Q 17 1Q 18 2Q 18 3Q 18 4Q 18 1Q 19 Sequential Δ 0.4% (0.5%) (0.3%) 0.2% 0.5% (0.1%) (0.7%) 0.3% 0.6% - YoY Δ 0.4% - - (0.2%) (0.1%) 0.3% (0.1%) - 0.1% 0.2% 8 Delinquency in Millions % of Ending Finance ReceivablesSeasonal Pattern of Delinquency • Custom credit scorecards have underwritten roughly 25% of the branch small and large loan portfolios and should improve DQ over time • 30+ days past due of 7.0% is 0.5% higher than prior year and includes 0.4% and 0.3% related to hurricane-affected branches as of March 31, 2019 and March 31, 2018, respectively • 90+ days past due of 3.5% is 0.2% higher than prior year and includes 0.3% and 0.3% related to hurricane-affected branches as of March 31, 2019 and March 31, 2018, respectively $80.0 15.0% $70.0 $32.3 12.0% $60.0 $31.6 $25.5 $27.5 $50.0 $25.1 $22.7 $26.4 $22.0 9.0% $19.6 $21.2 $40.0 7.7% 7.5% 7.4% 7.1% 6.0% 7.0% 6.8% $30.0 6.5% 6.5% 6.5% 6.3% 3.5% 3.5% 3.5% 3.4% 3.0% 3.3% 2.9% 2.9% $20.0 2.7% 2.6% 3.0% $10.0 $28.4 $23.7 $27.7 $30.3 $34.0 $26.4 $31.0 $37.6 $39.9 $31.9 $0.0 0.0% 4Q 16 1Q 17 2Q 17 3Q 17 4Q 17 1Q 18 2Q 18 3Q 18 4Q 18 1Q 19 30-89 Days 90-179 Days 30+ DQ % 90+ DQ% 30+ DQ 4Q 16 1Q 17 2Q 17 3Q 17 4Q 17 1Q 18 2Q 18 3Q 18 4Q 18 1Q 19 Sequential Δ 0.3% (0.9%) - 0.3% 0.7% (1.0%) (0.2%) 0.8% 0.6% (0.7%) YoY Δ 0.2% 0.3% (0.3%) (0.3%) 0.1% - (0.2%) 0.3% 0.2% 0.5% 90+ DQ 4Q 16 1Q 17 2Q 17 3Q 17 4Q 17 1Q 18 2Q 18 3Q 18 4Q 18 1Q 19 Sequential Δ 0.4% (0.5%) (0.3%) 0.2% 0.5% (0.1%) (0.7%) 0.3% 0.6% - YoY Δ 0.4% - - (0.2%) (0.1%) 0.3% (0.1%) - 0.1% 0.2% 8 Delinquency in Millions % of Ending Finance Receivables
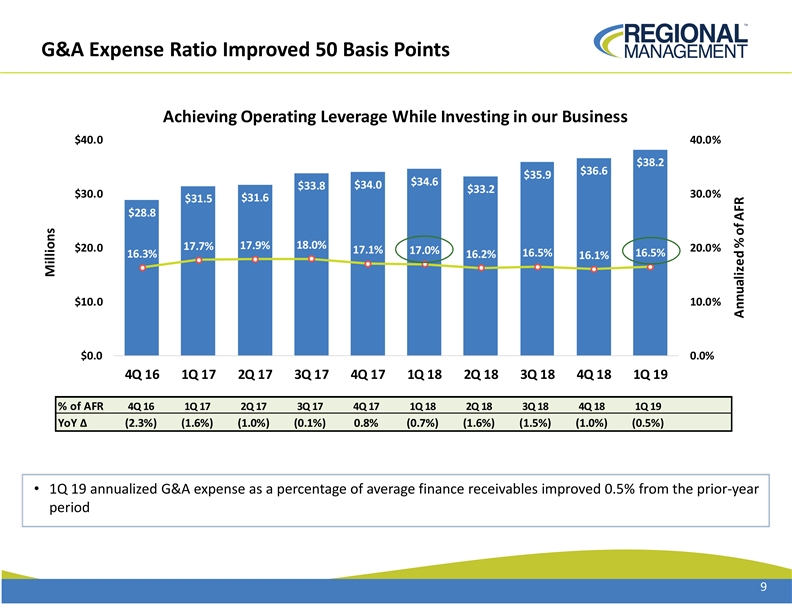
G&A Expense Ratio Improved 50 Basis Points Achieving Operating Leverage While Investing in our Business $40.0 40.0% $38.2 $36.6 $35.9 $34.6 $34.0 $33.8 $33.2 $30.0 30.0% $31.5 $31.6 $28.8 17.9% 18.0% 17.7% $20.0 20.0% 17.1% 17.0% 16.5% 16.5% 16.3% 16.2% 16.1% $10.0 10.0% $0.0 0.0% 4Q 16 1Q 17 2Q 17 3Q 17 4Q 17 1Q 18 2Q 18 3Q 18 4Q 18 1Q 19 % of AFR 4Q 16 1Q 17 2Q 17 3Q 17 4Q 17 1Q 18 2Q 18 3Q 18 4Q 18 1Q 19 YoY Δ (2.3%) (1.6%) (1.0%) (0.1%) 0.8% (0.7%) (1.6%) (1.5%) (1.0%) (0.5%) • 1Q 19 annualized G&A expense as a percentage of average finance receivables improved 0.5% from the prior-year period 9 Millions Annualized % of AFRG&A Expense Ratio Improved 50 Basis Points Achieving Operating Leverage While Investing in our Business $40.0 40.0% $38.2 $36.6 $35.9 $34.6 $34.0 $33.8 $33.2 $30.0 30.0% $31.5 $31.6 $28.8 17.9% 18.0% 17.7% $20.0 20.0% 17.1% 17.0% 16.5% 16.5% 16.3% 16.2% 16.1% $10.0 10.0% $0.0 0.0% 4Q 16 1Q 17 2Q 17 3Q 17 4Q 17 1Q 18 2Q 18 3Q 18 4Q 18 1Q 19 % of AFR 4Q 16 1Q 17 2Q 17 3Q 17 4Q 17 1Q 18 2Q 18 3Q 18 4Q 18 1Q 19 YoY Δ (2.3%) (1.6%) (1.0%) (0.1%) 0.8% (0.7%) (1.6%) (1.5%) (1.0%) (0.5%) • 1Q 19 annualized G&A expense as a percentage of average finance receivables improved 0.5% from the prior-year period 9 Millions Annualized % of AFR
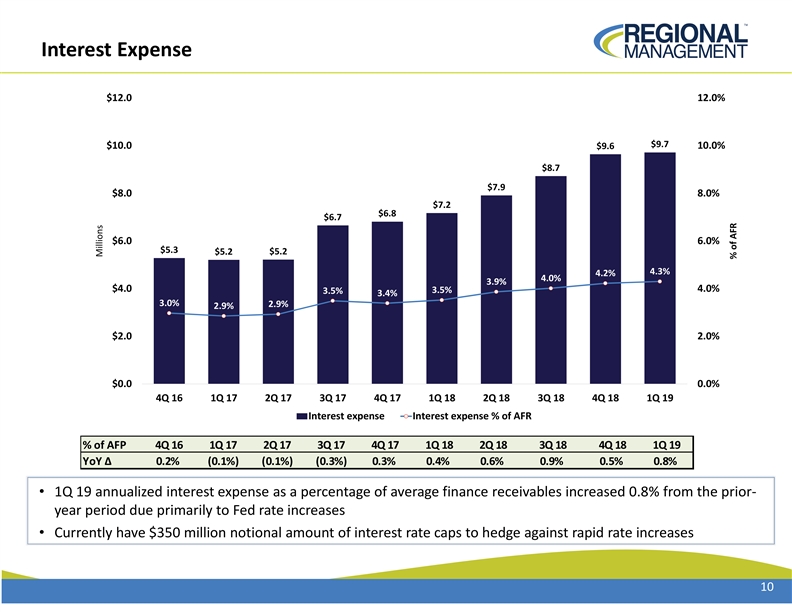
Interest Expense $12.0 12.0% $9.7 $10.0 $9.6 10.0% $8.7 $7.9 $8.0 8.0% $7.2 $6.8 $6.7 $6.0 6.0% $5.3 $5.2 $5.2 4.3% 4.2% 4.0% 3.9% $4.0 4.0% 3.5% 3.5% 3.4% 3.0% 2.9% 2.9% $2.0 2.0% $0.0 0.0% 4Q 16 1Q 17 2Q 17 3Q 17 4Q 17 1Q 18 2Q 18 3Q 18 4Q 18 1Q 19 Interest expense Interest expense % of AFR % of AFP 4Q 16 1Q 17 2Q 17 3Q 17 4Q 17 1Q 18 2Q 18 3Q 18 4Q 18 1Q 19 YoY Δ 0.2% (0.1%) (0.1%) (0.3%) 0.3% 0.4% 0.6% 0.9% 0.5% 0.8% • 1Q 19 annualized interest expense as a percentage of average finance receivables increased 0.8% from the prior- year period due primarily to Fed rate increases • Currently have $350 million notional amount of interest rate caps to hedge against rapid rate increases 10 Millions % of AFRInterest Expense $12.0 12.0% $9.7 $10.0 $9.6 10.0% $8.7 $7.9 $8.0 8.0% $7.2 $6.8 $6.7 $6.0 6.0% $5.3 $5.2 $5.2 4.3% 4.2% 4.0% 3.9% $4.0 4.0% 3.5% 3.5% 3.4% 3.0% 2.9% 2.9% $2.0 2.0% $0.0 0.0% 4Q 16 1Q 17 2Q 17 3Q 17 4Q 17 1Q 18 2Q 18 3Q 18 4Q 18 1Q 19 Interest expense Interest expense % of AFR % of AFP 4Q 16 1Q 17 2Q 17 3Q 17 4Q 17 1Q 18 2Q 18 3Q 18 4Q 18 1Q 19 YoY Δ 0.2% (0.1%) (0.1%) (0.3%) 0.3% 0.4% 0.6% 0.9% 0.5% 0.8% • 1Q 19 annualized interest expense as a percentage of average finance receivables increased 0.8% from the prior- year period due primarily to Fed rate increases • Currently have $350 million notional amount of interest rate caps to hedge against rapid rate increases 10 Millions % of AFR
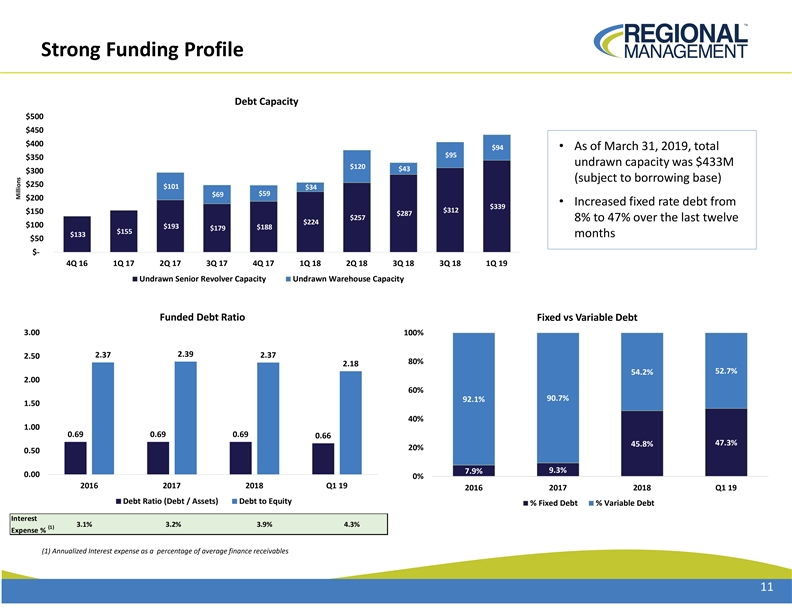
Strong Funding Profile Debt Capacity $500 $450 $400 $94 • As of March 31, 2019, total $95 $350 undrawn capacity was $433M $120 $43 $300 (subject to borrowing base) $250 $101 $34 $59 $69 $200 • Increased fixed rate debt from $339 $312 $150 $287 $257 8% to 47% over the last twelve $224 $100 $193 $188 $179 $155 $133 months $50 $- 4Q 16 1Q 17 2Q 17 3Q 17 4Q 17 1Q 18 2Q 18 3Q 18 3Q 18 1Q 19 Undrawn Senior Revolver Capacity Undrawn Warehouse Capacity Funded Debt Ratio Fixed vs Variable Debt 3.00 100% 2.39 2.37 2.37 2.50 80% 2.18 52.7% 54.2% 2.00 60% 90.7% 92.1% 1.50 40% 1.00 0.69 0.69 0.69 0.66 47.3% 45.8% 20% 0.50 9.3% 7.9% 0.00 0% 2016 2017 2018 Q1 19 2016 2017 2018 Q1 19 Debt Ratio (Debt / Assets) Debt to Equity % Fixed Debt % Variable Debt Interest 3.1% 3.2% 3.9% 4.3% (1) Expense % (1) Annualized Interest expense as a percentage of average finance receivables 11 MillionsStrong Funding Profile Debt Capacity $500 $450 $400 $94 • As of March 31, 2019, total $95 $350 undrawn capacity was $433M $120 $43 $300 (subject to borrowing base) $250 $101 $34 $59 $69 $200 • Increased fixed rate debt from $339 $312 $150 $287 $257 8% to 47% over the last twelve $224 $100 $193 $188 $179 $155 $133 months $50 $- 4Q 16 1Q 17 2Q 17 3Q 17 4Q 17 1Q 18 2Q 18 3Q 18 3Q 18 1Q 19 Undrawn Senior Revolver Capacity Undrawn Warehouse Capacity Funded Debt Ratio Fixed vs Variable Debt 3.00 100% 2.39 2.37 2.37 2.50 80% 2.18 52.7% 54.2% 2.00 60% 90.7% 92.1% 1.50 40% 1.00 0.69 0.69 0.69 0.66 47.3% 45.8% 20% 0.50 9.3% 7.9% 0.00 0% 2016 2017 2018 Q1 19 2016 2017 2018 Q1 19 Debt Ratio (Debt / Assets) Debt to Equity % Fixed Debt % Variable Debt Interest 3.1% 3.2% 3.9% 4.3% (1) Expense % (1) Annualized Interest expense as a percentage of average finance receivables 11 Millions