Exhibit 99.2 2Q 2019 Earnings Call Supplemental Presentation July 31, 2019Exhibit 99.2 2Q 2019 Earnings Call Supplemental Presentation July 31, 2019

Safe Harbor Statement This document contains summarized information concerning Regional Management Corp. (the “Company”) and the Company’s business, operations, financial performance, and trends. No representation is made that the information in this document is complete. For additional financial, statistical, and business information, please see the Company’s most recent Annual Report on Form 10‐K and Quarterly Reports on Form 10‐Q filed with the U.S. Securities and Exchange Commission (the “SEC”), as well as the Company’s other reports filed with the SEC from time to time. Such reports are or will be available on the Company’s website (www.regionalmanagement.com) and on the SEC’s website (www.sec.gov). This presentation, the related remarks, and the responses to various questions may contain various “forward‐looking statements” within the meaning of the Private Securities Litigation Reform Act of 1995, which represent the Company’s expectations or beliefs concerning future events. Words such as “may,” “will,” “should,” “likely,” “anticipates,” “expects,” “intends,” “plans,” “projects,” “believes,” “estimates,” “outlook,” and similar expressions may be used to identify these forward‐looking statements. Such forward‐looking statements are about matters that are inherently subject to risks and uncertainties, many of which are outside of the control of the Company. Factors that could cause actual results or performance to differ from the expectations expressed or implied in such forward‐looking statements include, but are not limited to, the following: changes in general economic conditions, including levels of unemployment and bankruptcies; risks associated with the Company’s transition to a new loan origination and servicing software system; risks related to opening new branches, including the ability or inability to open new branches as planned; risks inherent in making loans, including credit risk, repayment risk, and value of collateral, which risks may increase in light of adverse or recessionary economic conditions; risks associated with the implementation of new underwriting models and processes, including as to the effectiveness of new custom scorecards; risks relating to the Company’s asset‐backed securitization transactions; changes in interest rates; the risk that the Company’s existing sources of liquidity become insufficient to satisfy its needs or that its access to these sources becomes unexpectedly restricted; changes in federal, state, or local laws, regulations, or regulatory policies and practices, and risks associated with the manner in which laws and regulations are interpreted, implemented, and enforced; the impact of changes in tax laws, guidance, and interpretations, including related to certain provisions of the Tax Cuts and Jobs Act; the timing and amount of revenues that may be recognized by the Company; changes in current revenue and expense trends (including trends affecting delinquencies and credit losses); changes in the Company’s markets and general changes in the economy (particularly in the markets served by the Company); changes in the competitive environment in which the Company operates or a decrease in the demand for its products; the impact of a prolonged shutdown of the federal government; risks related to acquisitions; changes in operating and administrative expenses; and the departure, transition, or replacement of key personnel. Such factors and others are discussed in greater detail in the Company’s filings with the SEC. The Company cannot guarantee future events, results, actions, levels of activity, performance, or achievements. Except to the extent required by law, neither the Company nor any of its respective agents, employees, or advisors intend or have any duty or obligation to supplement, amend, update, or revise any forward‐looking statement, whether as a result of new information, future developments, or otherwise. The information and opinions contained in this document are provided as of the date of this presentation and are subject to change without notice. This document has not been approved by any regulatory or supervisory authority. 2Safe Harbor Statement This document contains summarized information concerning Regional Management Corp. (the “Company”) and the Company’s business, operations, financial performance, and trends. No representation is made that the information in this document is complete. For additional financial, statistical, and business information, please see the Company’s most recent Annual Report on Form 10‐K and Quarterly Reports on Form 10‐Q filed with the U.S. Securities and Exchange Commission (the “SEC”), as well as the Company’s other reports filed with the SEC from time to time. Such reports are or will be available on the Company’s website (www.regionalmanagement.com) and on the SEC’s website (www.sec.gov). This presentation, the related remarks, and the responses to various questions may contain various “forward‐looking statements” within the meaning of the Private Securities Litigation Reform Act of 1995, which represent the Company’s expectations or beliefs concerning future events. Words such as “may,” “will,” “should,” “likely,” “anticipates,” “expects,” “intends,” “plans,” “projects,” “believes,” “estimates,” “outlook,” and similar expressions may be used to identify these forward‐looking statements. Such forward‐looking statements are about matters that are inherently subject to risks and uncertainties, many of which are outside of the control of the Company. Factors that could cause actual results or performance to differ from the expectations expressed or implied in such forward‐looking statements include, but are not limited to, the following: changes in general economic conditions, including levels of unemployment and bankruptcies; risks associated with the Company’s transition to a new loan origination and servicing software system; risks related to opening new branches, including the ability or inability to open new branches as planned; risks inherent in making loans, including credit risk, repayment risk, and value of collateral, which risks may increase in light of adverse or recessionary economic conditions; risks associated with the implementation of new underwriting models and processes, including as to the effectiveness of new custom scorecards; risks relating to the Company’s asset‐backed securitization transactions; changes in interest rates; the risk that the Company’s existing sources of liquidity become insufficient to satisfy its needs or that its access to these sources becomes unexpectedly restricted; changes in federal, state, or local laws, regulations, or regulatory policies and practices, and risks associated with the manner in which laws and regulations are interpreted, implemented, and enforced; the impact of changes in tax laws, guidance, and interpretations, including related to certain provisions of the Tax Cuts and Jobs Act; the timing and amount of revenues that may be recognized by the Company; changes in current revenue and expense trends (including trends affecting delinquencies and credit losses); changes in the Company’s markets and general changes in the economy (particularly in the markets served by the Company); changes in the competitive environment in which the Company operates or a decrease in the demand for its products; the impact of a prolonged shutdown of the federal government; risks related to acquisitions; changes in operating and administrative expenses; and the departure, transition, or replacement of key personnel. Such factors and others are discussed in greater detail in the Company’s filings with the SEC. The Company cannot guarantee future events, results, actions, levels of activity, performance, or achievements. Except to the extent required by law, neither the Company nor any of its respective agents, employees, or advisors intend or have any duty or obligation to supplement, amend, update, or revise any forward‐looking statement, whether as a result of new information, future developments, or otherwise. The information and opinions contained in this document are provided as of the date of this presentation and are subject to change without notice. This document has not been approved by any regulatory or supervisory authority. 2

2Q 19 Highlights dollars in millions 2Q 19 2Q 18 $ Chg B/(W) % Chg B/(W) (except per share amounts) Average Finance Receivables $934.4 $818.0 $116.4 14.2% Interest & Fee Income 76.0 66.8 9.1 13.7% Total Revenue 84.3 72.4 11.9 16.4% Provision for Credit Losses 25.7 20.2 (5.5) (27.3%) G&A Expense 37.7 33.2 (4.5) (13.6%) Interest Expense 9.8 7.9 (1.9) (23.4%) Net Income 8.4 8.5 (0.1) (1.3%) ROA 3.4% 4.0% (0.6%) (15.0%) ROE 11.5% 13.4% (1.9%) (14.2%) Diluted EPS $0.70 $0.70 ‐ 0.0% • Net income of $8.4 million, or $0.70 diluted EPS • Total revenue growth of 16.4% driven by $126.2 million year‐over‐year portfolio growth o Interest and fee income up 13.7% year‐over‐year on 14.2% increase in average finance receivables o Insurance income, net increased 75.8% to $5.1 million primarily due to a $1.4 million reduction in non‐file insurance claims (corresponding increase in net credit losses and was neutral to net income) • Provision for credit loss is up 27.3%, or $5.5 million, primarily due to: o 14.9% increase in finance receivables plus $1.4 million of reduced non‐file insurance usage, as noted above • Annualized G&A expenses as a percentage of average finance receivables was flat to prior‐year period at 16.2% o Q2 2019 includes $1.3 million of expense from 16 net new branches that opened since the prior‐year period • Interest expense increase of 23.4% due to portfolio growth and Fed rate increases 32Q 19 Highlights dollars in millions 2Q 19 2Q 18 $ Chg B/(W) % Chg B/(W) (except per share amounts) Average Finance Receivables $934.4 $818.0 $116.4 14.2% Interest & Fee Income 76.0 66.8 9.1 13.7% Total Revenue 84.3 72.4 11.9 16.4% Provision for Credit Losses 25.7 20.2 (5.5) (27.3%) G&A Expense 37.7 33.2 (4.5) (13.6%) Interest Expense 9.8 7.9 (1.9) (23.4%) Net Income 8.4 8.5 (0.1) (1.3%) ROA 3.4% 4.0% (0.6%) (15.0%) ROE 11.5% 13.4% (1.9%) (14.2%) Diluted EPS $0.70 $0.70 ‐ 0.0% • Net income of $8.4 million, or $0.70 diluted EPS • Total revenue growth of 16.4% driven by $126.2 million year‐over‐year portfolio growth o Interest and fee income up 13.7% year‐over‐year on 14.2% increase in average finance receivables o Insurance income, net increased 75.8% to $5.1 million primarily due to a $1.4 million reduction in non‐file insurance claims (corresponding increase in net credit losses and was neutral to net income) • Provision for credit loss is up 27.3%, or $5.5 million, primarily due to: o 14.9% increase in finance receivables plus $1.4 million of reduced non‐file insurance usage, as noted above • Annualized G&A expenses as a percentage of average finance receivables was flat to prior‐year period at 16.2% o Q2 2019 includes $1.3 million of expense from 16 net new branches that opened since the prior‐year period • Interest expense increase of 23.4% due to portfolio growth and Fed rate increases 3

17 Consecutive Quarters of Year‐Over‐Year Double‐Digit Portfolio Growth Ending Finance Receivables vs. 1Q 19 vs. 2Q 18 $ Chg I/(D) % Chg I/(D) $ Chg I/(D) % Chg I/(D) in millions 1Q 17 2Q 17 3Q 17 4Q 17 1Q 18 2Q 18 3Q 18 4Q 18 1Q 19 2Q 19 Small Loans (≤ $2,500) $336 $349 $363 $376 $360 $385 $414 $438 $422 $431 $10 2.3% $47 12.1% Large Loans (≥ $2,500) $242 $268 $309 $347 $364 $392 $411 $438 $441 $499 $58 13.2% $107 27.2% Core Loan Products $578 $617 $672 $723 $724 $777 $825 $876 $862 $930 $68 7.8% $153 19.7% Automobile Loans $86 $80 $72 $61 $49 $39 $32 $26 $21 $16 ($5) (23.5%) ($24) (60.2%) Retail Loans $31 $30 $31 $33 $32 $31 $31 $30 $29 $28 ($2) (5.3%) ($3) (10.5%) Total $695 $727 $775 $817 $805 $847 $888 $932 $912 $973 $61 6.7% $126 14.9% Total YoY Δ ($) $88 $81 $79 $100 $110 $120 $113 $115 $107 $126 Total YoY Δ (%) 14.4% 12.5% 11.3% 13.9% 15.8% 16.6% 14.6% 14.0% 13.3% 14.9% • 17 consecutive quarters of year‐over‐year double‐digit growth • Strong core loan growth of nearly 20% from prior year 417 Consecutive Quarters of Year‐Over‐Year Double‐Digit Portfolio Growth Ending Finance Receivables vs. 1Q 19 vs. 2Q 18 $ Chg I/(D) % Chg I/(D) $ Chg I/(D) % Chg I/(D) in millions 1Q 17 2Q 17 3Q 17 4Q 17 1Q 18 2Q 18 3Q 18 4Q 18 1Q 19 2Q 19 Small Loans (≤ $2,500) $336 $349 $363 $376 $360 $385 $414 $438 $422 $431 $10 2.3% $47 12.1% Large Loans (≥ $2,500) $242 $268 $309 $347 $364 $392 $411 $438 $441 $499 $58 13.2% $107 27.2% Core Loan Products $578 $617 $672 $723 $724 $777 $825 $876 $862 $930 $68 7.8% $153 19.7% Automobile Loans $86 $80 $72 $61 $49 $39 $32 $26 $21 $16 ($5) (23.5%) ($24) (60.2%) Retail Loans $31 $30 $31 $33 $32 $31 $31 $30 $29 $28 ($2) (5.3%) ($3) (10.5%) Total $695 $727 $775 $817 $805 $847 $888 $932 $912 $973 $61 6.7% $126 14.9% Total YoY Δ ($) $88 $81 $79 $100 $110 $120 $113 $115 $107 $126 Total YoY Δ (%) 14.4% 12.5% 11.3% 13.9% 15.8% 16.6% 14.6% 14.0% 13.3% 14.9% • 17 consecutive quarters of year‐over‐year double‐digit growth • Strong core loan growth of nearly 20% from prior year 4
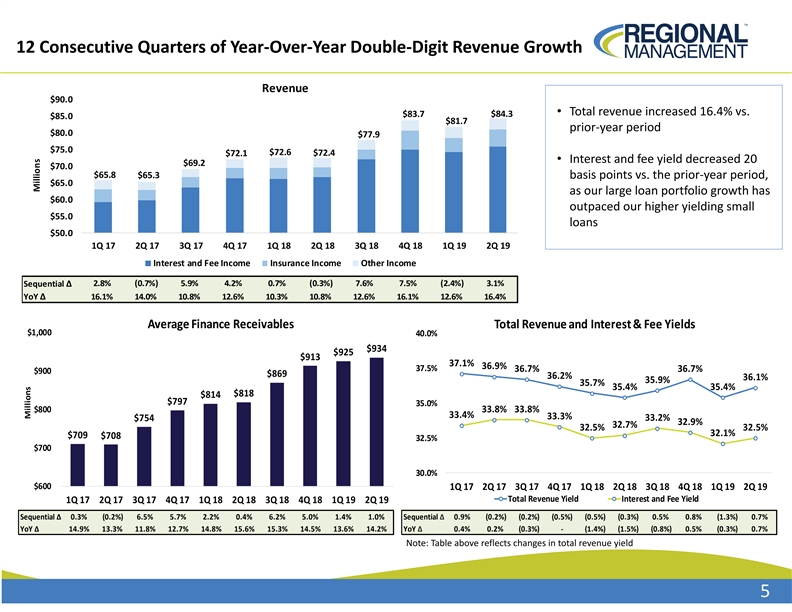
12 Consecutive Quarters of Year‐Over‐Year Double‐Digit Revenue Growth Revenue $90.0 • Total revenue increased 16.4% vs. $83.7 $84.3 $85.0 $81.7 prior‐year period $80.0 $77.9 $75.0 $72.6 $72.1 $72.4 • Interest and fee yield decreased 20 $69.2 $70.0 $65.8 $65.3 basis points vs. the prior‐year period, $65.0 as our large loan portfolio growth has $60.0 outpaced our higher yielding small $55.0 loans $50.0 1Q 17 2Q 17 3Q 17 4Q 17 1Q 18 2Q 18 3Q 18 4Q 18 1Q 19 2Q 19 Interest and Fee Income Insurance Income Other Income 2.8% (0.7%) 5.9% 4.2% 0.7% (0.3%) 7.6% 7.5% (2.4%) 3.1% Sequential Δ YoY Δ 16.1% 14.0% 10.8% 12.6% 10.3% 10.8% 12.6% 16.1% 12.6% 16.4% Average Finance Receivables Total Revenue and Interest & Fee Yields $1,000 40.0% $934 $925 $913 37.1% 36.9% 37.5% 36.7% 36.7% $900 $869 36.2% 36.1% 35.9% 35.7% 35.4% 35.4% $818 $814 $797 35.0% $800 33.8% 33.8% 33.4% 33.3% $754 33.2% 32.9% 32.7% 32.5% 32.5% 32.1% $709 $708 32.5% $700 30.0% $600 1Q 17 2Q 17 3Q 17 4Q 17 1Q 18 2Q 18 3Q 18 4Q 18 1Q 19 2Q 19 Total Revenue Yield Interest and Fee Yield 1Q 17 2Q 17 3Q 17 4Q 17 1Q 18 2Q 18 3Q 18 4Q 18 1Q 19 2Q 19 Sequential Δ 0.3% (0.2%) 6.5% 5.7% 2.2% 0.4% 6.2% 5.0% 1.4% 1.0% Sequential Δ 0.9% (0.2%) (0.2%) (0.5%) (0.5%) (0.3%) 0.5% 0.8% (1.3%) 0.7% YoY Δ 14.9% 13.3% 11.8% 12.7% 14.8% 15.6% 15.3% 14.5% 13.6% 14.2% YoY Δ 0.4% 0.2% (0.3%) ‐ (1.4%) (1.5%) (0.8%) 0.5% (0.3%) 0.7% Note: Table above reflects changes in total revenue yield 5 Millions Millions12 Consecutive Quarters of Year‐Over‐Year Double‐Digit Revenue Growth Revenue $90.0 • Total revenue increased 16.4% vs. $83.7 $84.3 $85.0 $81.7 prior‐year period $80.0 $77.9 $75.0 $72.6 $72.1 $72.4 • Interest and fee yield decreased 20 $69.2 $70.0 $65.8 $65.3 basis points vs. the prior‐year period, $65.0 as our large loan portfolio growth has $60.0 outpaced our higher yielding small $55.0 loans $50.0 1Q 17 2Q 17 3Q 17 4Q 17 1Q 18 2Q 18 3Q 18 4Q 18 1Q 19 2Q 19 Interest and Fee Income Insurance Income Other Income 2.8% (0.7%) 5.9% 4.2% 0.7% (0.3%) 7.6% 7.5% (2.4%) 3.1% Sequential Δ YoY Δ 16.1% 14.0% 10.8% 12.6% 10.3% 10.8% 12.6% 16.1% 12.6% 16.4% Average Finance Receivables Total Revenue and Interest & Fee Yields $1,000 40.0% $934 $925 $913 37.1% 36.9% 37.5% 36.7% 36.7% $900 $869 36.2% 36.1% 35.9% 35.7% 35.4% 35.4% $818 $814 $797 35.0% $800 33.8% 33.8% 33.4% 33.3% $754 33.2% 32.9% 32.7% 32.5% 32.5% 32.1% $709 $708 32.5% $700 30.0% $600 1Q 17 2Q 17 3Q 17 4Q 17 1Q 18 2Q 18 3Q 18 4Q 18 1Q 19 2Q 19 Total Revenue Yield Interest and Fee Yield 1Q 17 2Q 17 3Q 17 4Q 17 1Q 18 2Q 18 3Q 18 4Q 18 1Q 19 2Q 19 Sequential Δ 0.3% (0.2%) 6.5% 5.7% 2.2% 0.4% 6.2% 5.0% 1.4% 1.0% Sequential Δ 0.9% (0.2%) (0.2%) (0.5%) (0.5%) (0.3%) 0.5% 0.8% (1.3%) 0.7% YoY Δ 14.9% 13.3% 11.8% 12.7% 14.8% 15.6% 15.3% 14.5% 13.6% 14.2% YoY Δ 0.4% 0.2% (0.3%) ‐ (1.4%) (1.5%) (0.8%) 0.5% (0.3%) 0.7% Note: Table above reflects changes in total revenue yield 5 Millions Millions

Year‐Over‐Year Credit Trends • Annualized net credit loss rate increased 1.2% vs. prior‐year period. The increase includes 0.6% of additional non‐file insurance claims (bankruptcy losses) that shifted to net credit losses following the business policy change implemented in 4Q 18. 14.0% Net Credit Loss Rates 12.0% 10.9% 10.9% 10.7% 10.2% 9.9% 9.5% 9.1% 10.0% 9.0% 7.8% 7.7% 8.0% 6.0% 4.0% 2.0% Net Credit Losses 0.0% 1Q 17 2Q 17 3Q 17 4Q 17 1Q 18 2Q 18 3Q 18 4Q 18 1Q 19 2Q 19 Sequential Δ 1.1% (1.0%) (2.1%) 1.2% 1.2% (0.7%) (1.8%) 1.4% 1.8% (0.2%) Year/Year Δ 1.2% 1.3% (0.2%) (0.8%) (0.7%) (0.4%) (0.1%) 0.1% 0.7% 1.2% Net credit loss rate above includes: Non‐file claims 0.5% 0.9%0.5%0.4%0.3%0.2%0.3%0.8%0.7%0.8% Bulk debt sale proceeds ‐ ‐ (0.5%) ‐‐‐‐‐‐‐ Hurricane losses ‐‐‐‐ 0.4% 0.5% ‐ 0.1% 0.4% 0.6% 6 Annualized % of AFRYear‐Over‐Year Credit Trends • Annualized net credit loss rate increased 1.2% vs. prior‐year period. The increase includes 0.6% of additional non‐file insurance claims (bankruptcy losses) that shifted to net credit losses following the business policy change implemented in 4Q 18. 14.0% Net Credit Loss Rates 12.0% 10.9% 10.9% 10.7% 10.2% 9.9% 9.5% 9.1% 10.0% 9.0% 7.8% 7.7% 8.0% 6.0% 4.0% 2.0% Net Credit Losses 0.0% 1Q 17 2Q 17 3Q 17 4Q 17 1Q 18 2Q 18 3Q 18 4Q 18 1Q 19 2Q 19 Sequential Δ 1.1% (1.0%) (2.1%) 1.2% 1.2% (0.7%) (1.8%) 1.4% 1.8% (0.2%) Year/Year Δ 1.2% 1.3% (0.2%) (0.8%) (0.7%) (0.4%) (0.1%) 0.1% 0.7% 1.2% Net credit loss rate above includes: Non‐file claims 0.5% 0.9%0.5%0.4%0.3%0.2%0.3%0.8%0.7%0.8% Bulk debt sale proceeds ‐ ‐ (0.5%) ‐‐‐‐‐‐‐ Hurricane losses ‐‐‐‐ 0.4% 0.5% ‐ 0.1% 0.4% 0.6% 6 Annualized % of AFR

Year‐Over‐Year Credit Trends $70.0 $30.0 35.0% Allowance as % of Ending Finance Receivables Provision for Credit Losses 14.0% 30.5% 30.3% 29.1% 29.1% $60.0 28.6% 28.5% 30.0% 28.3% 27.9% $25.0 $25.7 $58.3 12.0% 27.0% 26.9% $57.2 $56.4 $55.3 $23.7 $23.6 $23.3 $50.0 25.0% 10.0% $48.9 $48.5 $20.0 $47.8 $47.4 $20.2 $20.2 $19.5 $19.5 $19.1 $18.6 $40.0 20.0% $42.0 $41.0 8.0% $15.0 6.3% 6.2% 6.2% 6.1% 6.0% 5.9% 5.9% 5.9% 15.0% $30.0 5.8% 5.7% 6.0% 11.0% 10.8% 10.9% 10.7% 10.5% 10.4% $10.0 10.1% 9.8% 9.9% 9.6% 10.0% $20.0 4.0% $5.0 5.0% $10.0 2.0% $0.0 0.0% $0.0 0.0% 1Q 17 2Q 17 3Q 17 4Q 17 1Q 18 2Q 18 3Q 18 4Q 18 1Q 19 2Q 19 1Q 17 2Q 17 3Q 17 4Q 17 1Q 18 2Q 18 3Q 18 4Q 18 1Q 19 2Q 19 Provision % of Revenue % of AFR (1) Allowance for Credit Losses % of EFR % of EFR 1Q 17 2Q 17 3Q 17 4Q 17 1Q 18 2Q 18 3Q 18 4Q 18 1Q 19 2Q 19 % of Revenue 1Q 17 2Q 17 3Q 17 4Q 17 1Q 18 2Q 18 3Q 18 4Q 18 1Q 19 2Q 19 Sequential Δ 0.2% (0.1%) 0.3% (0.1%) (0.1%) (0.2%) 0.5% 0.1% (0.1%) (0.3%) Sequential Δ (1.2%) (0.6%) 0.6% (2.1%) (0.1%) 1.0% 2.4% (2.0%) 0.3% 1.9% YoY Δ (0.1%) 0.2% 0.5% 0.3% ‐ (0.1%) 0.1% 0.3% 0.3% 0.2% YoY Δ 4.8% 5.1% 2.8% (3.3%) (2.2%) (0.6%) 1.2% 1.3% 1.7% 2.6% (1) % of AFR 1Q 17 2Q 17 3Q 17 4Q 17 1Q 18 2Q 18 3Q 18 4Q 18 1Q 19 2Q 19 Sequential Δ (0.2%) (0.3%) 0.2% (0.9%) (0.2%) 0.3% 1.0% (0.5%) (0.3%) 0.9% YoY Δ 1.9% 1.9% 1.0% (1.2%) (1.2%) (0.6%) 0.2% 0.6% 0.5% 1.1% (1) The percentage of average finance receivables has been annualized 7 Allowance for Credit Losses (in millions) Allowance as % of EFR Provision for Credit Losses (in millions) % of Revenue and AFRYear‐Over‐Year Credit Trends $70.0 $30.0 35.0% Allowance as % of Ending Finance Receivables Provision for Credit Losses 14.0% 30.5% 30.3% 29.1% 29.1% $60.0 28.6% 28.5% 30.0% 28.3% 27.9% $25.0 $25.7 $58.3 12.0% 27.0% 26.9% $57.2 $56.4 $55.3 $23.7 $23.6 $23.3 $50.0 25.0% 10.0% $48.9 $48.5 $20.0 $47.8 $47.4 $20.2 $20.2 $19.5 $19.5 $19.1 $18.6 $40.0 20.0% $42.0 $41.0 8.0% $15.0 6.3% 6.2% 6.2% 6.1% 6.0% 5.9% 5.9% 5.9% 15.0% $30.0 5.8% 5.7% 6.0% 11.0% 10.8% 10.9% 10.7% 10.5% 10.4% $10.0 10.1% 9.8% 9.9% 9.6% 10.0% $20.0 4.0% $5.0 5.0% $10.0 2.0% $0.0 0.0% $0.0 0.0% 1Q 17 2Q 17 3Q 17 4Q 17 1Q 18 2Q 18 3Q 18 4Q 18 1Q 19 2Q 19 1Q 17 2Q 17 3Q 17 4Q 17 1Q 18 2Q 18 3Q 18 4Q 18 1Q 19 2Q 19 Provision % of Revenue % of AFR (1) Allowance for Credit Losses % of EFR % of EFR 1Q 17 2Q 17 3Q 17 4Q 17 1Q 18 2Q 18 3Q 18 4Q 18 1Q 19 2Q 19 % of Revenue 1Q 17 2Q 17 3Q 17 4Q 17 1Q 18 2Q 18 3Q 18 4Q 18 1Q 19 2Q 19 Sequential Δ 0.2% (0.1%) 0.3% (0.1%) (0.1%) (0.2%) 0.5% 0.1% (0.1%) (0.3%) Sequential Δ (1.2%) (0.6%) 0.6% (2.1%) (0.1%) 1.0% 2.4% (2.0%) 0.3% 1.9% YoY Δ (0.1%) 0.2% 0.5% 0.3% ‐ (0.1%) 0.1% 0.3% 0.3% 0.2% YoY Δ 4.8% 5.1% 2.8% (3.3%) (2.2%) (0.6%) 1.2% 1.3% 1.7% 2.6% (1) % of AFR 1Q 17 2Q 17 3Q 17 4Q 17 1Q 18 2Q 18 3Q 18 4Q 18 1Q 19 2Q 19 Sequential Δ (0.2%) (0.3%) 0.2% (0.9%) (0.2%) 0.3% 1.0% (0.5%) (0.3%) 0.9% YoY Δ 1.9% 1.9% 1.0% (1.2%) (1.2%) (0.6%) 0.2% 0.6% 0.5% 1.1% (1) The percentage of average finance receivables has been annualized 7 Allowance for Credit Losses (in millions) Allowance as % of EFR Provision for Credit Losses (in millions) % of Revenue and AFR
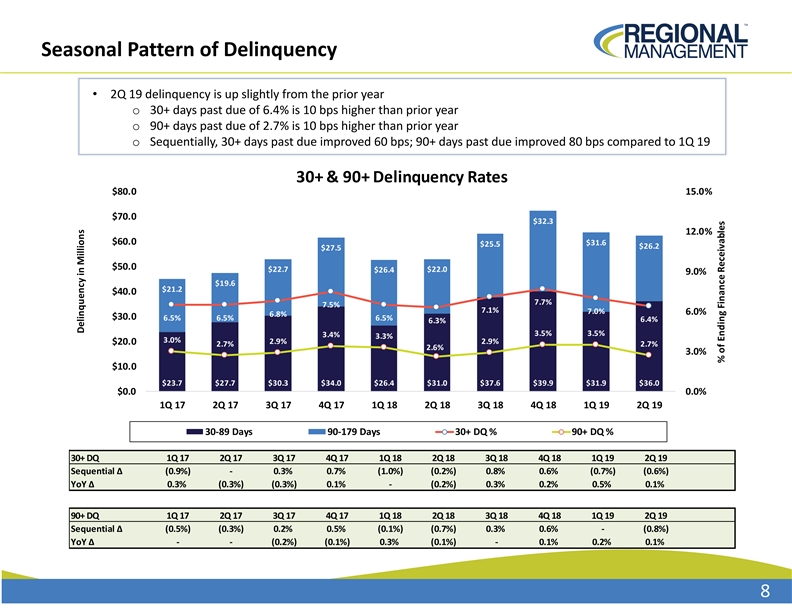
Seasonal Pattern of Delinquency • 2Q 19 delinquency is up slightly from the prior year o 30+ days past due of 6.4% is 10 bps higher than prior year o 90+ days past due of 2.7% is 10 bps higher than prior year o Sequentially, 30+ days past due improved 60 bps; 90+ days past due improved 80 bps compared to 1Q 19 30+ & 90+ Delinquency Rates $80.0 15.0% $70.0 $32.3 12.0% $60.0 $31.6 $25.5 $26.2 $27.5 $50.0 $22.7 $22.0 $26.4 9.0% $19.6 $21.2 $40.0 7.7% 7.5% 7.1% 7.0% 6.0% 6.8% $30.0 6.5% 6.5% 6.5% 6.4% 6.3% 3.5% 3.5% 3.4% 3.3% 3.0% 2.9% 2.9% $20.0 2.7% 2.7% 2.6% 3.0% $10.0 $23.7 $27.7 $30.3 $34.0 $26.4 $31.0 $37.6 $39.9 $31.9 $36.0 $0.0 0.0% 1Q 17 2Q 17 3Q 17 4Q 17 1Q 18 2Q 18 3Q 18 4Q 18 1Q 19 2Q 19 30‐89 Days 90‐179 Days 30+ DQ % 90+ DQ % 30+ DQ 1Q 17 2Q 17 3Q 17 4Q 17 1Q 18 2Q 18 3Q 18 4Q 18 1Q 19 2Q 19 Sequential Δ (0.9%) ‐ 0.3% 0.7% (1.0%) (0.2%) 0.8% 0.6% (0.7%) (0.6%) YoY Δ 0.3% (0.3%) (0.3%) 0.1% ‐ (0.2%) 0.3% 0.2% 0.5% 0.1% 90+ DQ 1Q 17 2Q 17 3Q 17 4Q 17 1Q 18 2Q 18 3Q 18 4Q 18 1Q 19 2Q 19 Sequential Δ (0.5%) (0.3%) 0.2% 0.5% (0.1%) (0.7%) 0.3% 0.6% ‐ (0.8%) YoY Δ ‐ ‐ (0.2%) (0.1%) 0.3% (0.1%) ‐ 0.1% 0.2% 0.1% 8 Delinquency in Millions % of Ending Finance ReceivablesSeasonal Pattern of Delinquency • 2Q 19 delinquency is up slightly from the prior year o 30+ days past due of 6.4% is 10 bps higher than prior year o 90+ days past due of 2.7% is 10 bps higher than prior year o Sequentially, 30+ days past due improved 60 bps; 90+ days past due improved 80 bps compared to 1Q 19 30+ & 90+ Delinquency Rates $80.0 15.0% $70.0 $32.3 12.0% $60.0 $31.6 $25.5 $26.2 $27.5 $50.0 $22.7 $22.0 $26.4 9.0% $19.6 $21.2 $40.0 7.7% 7.5% 7.1% 7.0% 6.0% 6.8% $30.0 6.5% 6.5% 6.5% 6.4% 6.3% 3.5% 3.5% 3.4% 3.3% 3.0% 2.9% 2.9% $20.0 2.7% 2.7% 2.6% 3.0% $10.0 $23.7 $27.7 $30.3 $34.0 $26.4 $31.0 $37.6 $39.9 $31.9 $36.0 $0.0 0.0% 1Q 17 2Q 17 3Q 17 4Q 17 1Q 18 2Q 18 3Q 18 4Q 18 1Q 19 2Q 19 30‐89 Days 90‐179 Days 30+ DQ % 90+ DQ % 30+ DQ 1Q 17 2Q 17 3Q 17 4Q 17 1Q 18 2Q 18 3Q 18 4Q 18 1Q 19 2Q 19 Sequential Δ (0.9%) ‐ 0.3% 0.7% (1.0%) (0.2%) 0.8% 0.6% (0.7%) (0.6%) YoY Δ 0.3% (0.3%) (0.3%) 0.1% ‐ (0.2%) 0.3% 0.2% 0.5% 0.1% 90+ DQ 1Q 17 2Q 17 3Q 17 4Q 17 1Q 18 2Q 18 3Q 18 4Q 18 1Q 19 2Q 19 Sequential Δ (0.5%) (0.3%) 0.2% 0.5% (0.1%) (0.7%) 0.3% 0.6% ‐ (0.8%) YoY Δ ‐ ‐ (0.2%) (0.1%) 0.3% (0.1%) ‐ 0.1% 0.2% 0.1% 8 Delinquency in Millions % of Ending Finance Receivables
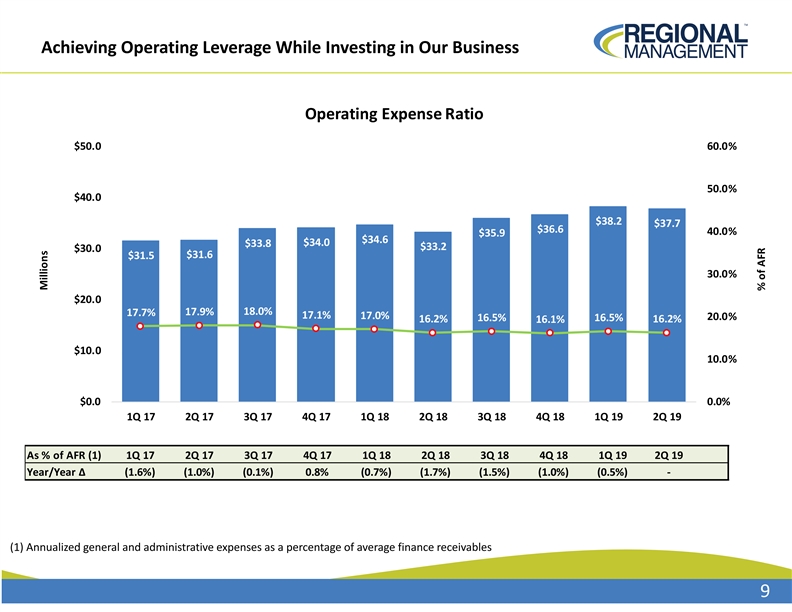
Achieving Operating Leverage While Investing in Our Business Operating Expense Ratio $50.0 60.0% 50.0% $40.0 $38.2 $37.7 $36.6 40.0% $35.9 $34.6 $34.0 $33.8 $33.2 $30.0 $31.6 $31.5 30.0% $20.0 17.9% 18.0% 17.7% 17.1% 17.0% 20.0% 16.5% 16.5% 16.2% 16.1% 16.2% $10.0 10.0% $0.0 0.0% 1Q 17 2Q 17 3Q 17 4Q 17 1Q 18 2Q 18 3Q 18 4Q 18 1Q 19 2Q 19 As % of AFR (1) 1Q 17 2Q 17 3Q 17 4Q 17 1Q 18 2Q 18 3Q 18 4Q 18 1Q 19 2Q 19 Year/Year Δ (1.6%) (1.0%) (0.1%) 0.8% (0.7%) (1.7%) (1.5%) (1.0%) (0.5%)‐ (1) Annualized general and administrative expenses as a percentage of average finance receivables 9 Millions % of AFRAchieving Operating Leverage While Investing in Our Business Operating Expense Ratio $50.0 60.0% 50.0% $40.0 $38.2 $37.7 $36.6 40.0% $35.9 $34.6 $34.0 $33.8 $33.2 $30.0 $31.6 $31.5 30.0% $20.0 17.9% 18.0% 17.7% 17.1% 17.0% 20.0% 16.5% 16.5% 16.2% 16.1% 16.2% $10.0 10.0% $0.0 0.0% 1Q 17 2Q 17 3Q 17 4Q 17 1Q 18 2Q 18 3Q 18 4Q 18 1Q 19 2Q 19 As % of AFR (1) 1Q 17 2Q 17 3Q 17 4Q 17 1Q 18 2Q 18 3Q 18 4Q 18 1Q 19 2Q 19 Year/Year Δ (1.6%) (1.0%) (0.1%) 0.8% (0.7%) (1.7%) (1.5%) (1.0%) (0.5%)‐ (1) Annualized general and administrative expenses as a percentage of average finance receivables 9 Millions % of AFR

Interest Expense $12.0 12.0% $9.8 $9.7 $9.6 $10.0 10.0% $8.7 $7.9 $8.0 8.0% $7.2 $6.8 $6.7 $6.0 6.0% $5.2 $5.2 4.2% 4.2% 4.2% 4.0% 3.9% 3.5% 3.5% $4.0 3.4% 4.0% 2.9% 3.0% $2.0 2.0% $0.0 0.0% 1Q 17 2Q 17 3Q 17 4Q 17 1Q 18 2Q 18 3Q 18 4Q 18 1Q 19 2Q 19 Interest Expense Interest Expense % of AFR (1) % of AFR (1) 1Q 17 2Q 17 3Q 17 4Q 17 1Q 18 2Q 18 3Q 18 4Q 18 1Q 19 2Q 19 YoY Δ (0.2%) (0.1%) 0.5% 0.4% 0.6% 0.9% 0.5% 0.8% 0.7% 0.3% • 2Q 19 increased 0.3% from the prior‐year period primarily due to Fed rate increases • Currently have $350 million notional amount of interest rate caps to hedge against rapid rate increases (1) Annualized interest expense as a percentage of average finance receivables 10 Millions % of AFRInterest Expense $12.0 12.0% $9.8 $9.7 $9.6 $10.0 10.0% $8.7 $7.9 $8.0 8.0% $7.2 $6.8 $6.7 $6.0 6.0% $5.2 $5.2 4.2% 4.2% 4.2% 4.0% 3.9% 3.5% 3.5% $4.0 3.4% 4.0% 2.9% 3.0% $2.0 2.0% $0.0 0.0% 1Q 17 2Q 17 3Q 17 4Q 17 1Q 18 2Q 18 3Q 18 4Q 18 1Q 19 2Q 19 Interest Expense Interest Expense % of AFR (1) % of AFR (1) 1Q 17 2Q 17 3Q 17 4Q 17 1Q 18 2Q 18 3Q 18 4Q 18 1Q 19 2Q 19 YoY Δ (0.2%) (0.1%) 0.5% 0.4% 0.6% 0.9% 0.5% 0.8% 0.7% 0.3% • 2Q 19 increased 0.3% from the prior‐year period primarily due to Fed rate increases • Currently have $350 million notional amount of interest rate caps to hedge against rapid rate increases (1) Annualized interest expense as a percentage of average finance receivables 10 Millions % of AFR
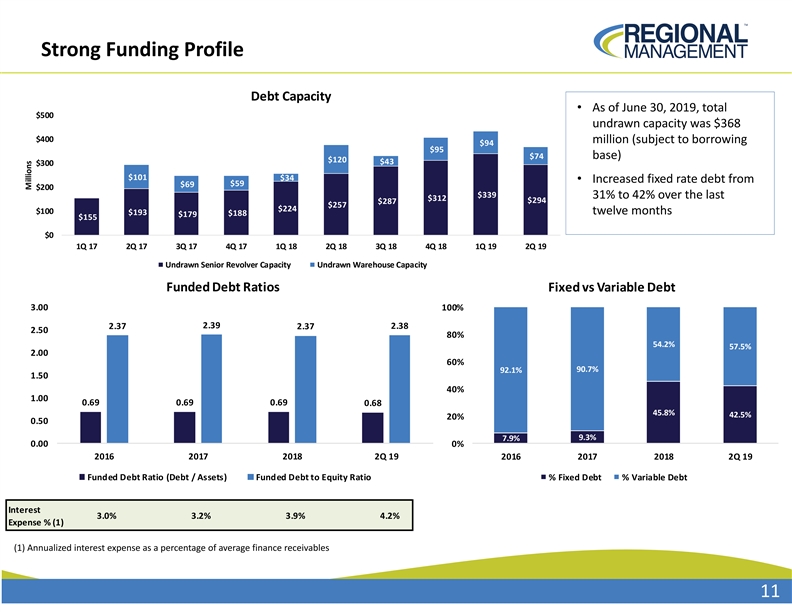
Strong Funding Profile Debt Capacity • As of June 30, 2019, total $500 undrawn capacity was $368 $400 million (subject to borrowing $94 $95 $74 base) $120 $43 $300 $101 $34 • Increased fixed rate debt from $59 $69 $200 $339 31% to 42% over the last $312 $294 $287 $257 $224 $100 $193 twelve months $188 $179 $155 $0 1Q 17 2Q 17 3Q 17 4Q 17 1Q 18 2Q 18 3Q 18 4Q 18 1Q 19 2Q 19 Undrawn Senior Revolver Capacity Undrawn Warehouse Capacity Funded Debt Ratios Fixed vs Variable Debt 3.00 100% 2.39 2.37 2.37 2.38 2.50 80% 54.2% 57.5% 2.00 60% 90.7% 92.1% 1.50 40% 1.00 0.69 0.69 0.69 0.68 45.8% 42.5% 20% 0.50 9.3% 7.9% 0.00 0% 2016 2017 2018 2Q 19 2016 2017 2018 2Q 19 Funded Debt Ratio (Debt / Assets) Funded Debt to Equity Ratio % Fixed Debt % Variable Debt Interest 3.0% 3.2% 3.9% 4.2% Expense % (1) (1) Annualized interest expense as a percentage of average finance receivables 11 MillionsStrong Funding Profile Debt Capacity • As of June 30, 2019, total $500 undrawn capacity was $368 $400 million (subject to borrowing $94 $95 $74 base) $120 $43 $300 $101 $34 • Increased fixed rate debt from $59 $69 $200 $339 31% to 42% over the last $312 $294 $287 $257 $224 $100 $193 twelve months $188 $179 $155 $0 1Q 17 2Q 17 3Q 17 4Q 17 1Q 18 2Q 18 3Q 18 4Q 18 1Q 19 2Q 19 Undrawn Senior Revolver Capacity Undrawn Warehouse Capacity Funded Debt Ratios Fixed vs Variable Debt 3.00 100% 2.39 2.37 2.37 2.38 2.50 80% 54.2% 57.5% 2.00 60% 90.7% 92.1% 1.50 40% 1.00 0.69 0.69 0.69 0.68 45.8% 42.5% 20% 0.50 9.3% 7.9% 0.00 0% 2016 2017 2018 2Q 19 2016 2017 2018 2Q 19 Funded Debt Ratio (Debt / Assets) Funded Debt to Equity Ratio % Fixed Debt % Variable Debt Interest 3.0% 3.2% 3.9% 4.2% Expense % (1) (1) Annualized interest expense as a percentage of average finance receivables 11 Millions
AppendixAppendix
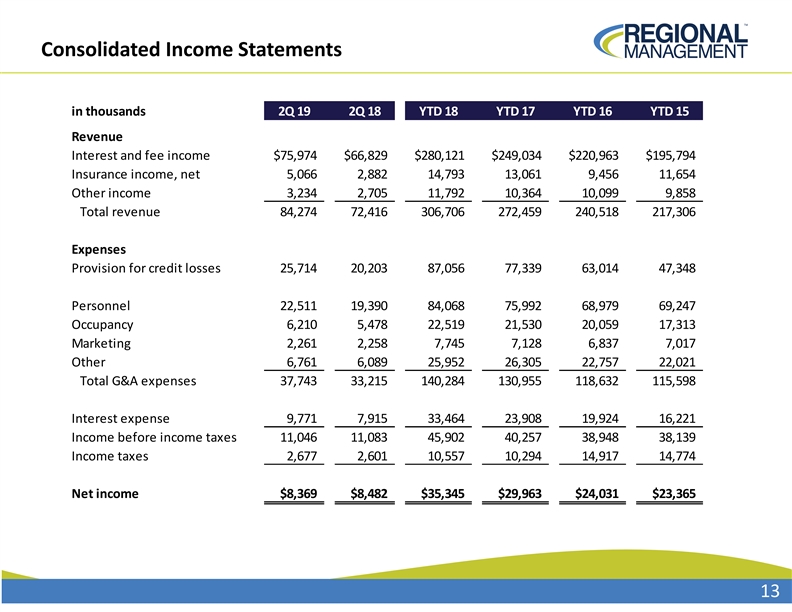
Consolidated Income Statements in thousands 2Q 19 2Q 18 YTD 18 YTD 17 YTD 16 YTD 15 Revenue Interest and fee income $75,974 $66,829 $280,121 $249,034 $220,963 $195,794 Insurance income, net 5,066 2,882 14,793 13,061 9,456 11,654 Other income 3,234 2,705 11,792 10,364 10,099 9,858 Total revenue 84,274 72,416 306,706 272,459 240,518 217,306 Expenses Provision for credit losses 25,714 20,203 87,056 77,339 63,014 47,348 Personnel 22,511 19,390 84,068 75,992 68,979 69,247 Occupancy 6,210 5,478 22,519 21,530 20,059 17,313 Marketing 2,261 2,258 7,745 7,128 6,837 7,017 Other 6,761 6,089 25,952 26,305 22,757 22,021 Total G&A expenses 37,743 33,215 140,284 130,955 118,632 115,598 Interest expense 9,771 7,915 33,464 23,908 19,924 16,221 Income before income taxes 11,046 11,083 45,902 40,257 38,948 38,139 Income taxes 2,677 2,601 10,557 10,294 14,917 14,774 Net income $8,369 $8,482 $35,345 $29,963 $24,031 $23,365 13Consolidated Income Statements in thousands 2Q 19 2Q 18 YTD 18 YTD 17 YTD 16 YTD 15 Revenue Interest and fee income $75,974 $66,829 $280,121 $249,034 $220,963 $195,794 Insurance income, net 5,066 2,882 14,793 13,061 9,456 11,654 Other income 3,234 2,705 11,792 10,364 10,099 9,858 Total revenue 84,274 72,416 306,706 272,459 240,518 217,306 Expenses Provision for credit losses 25,714 20,203 87,056 77,339 63,014 47,348 Personnel 22,511 19,390 84,068 75,992 68,979 69,247 Occupancy 6,210 5,478 22,519 21,530 20,059 17,313 Marketing 2,261 2,258 7,745 7,128 6,837 7,017 Other 6,761 6,089 25,952 26,305 22,757 22,021 Total G&A expenses 37,743 33,215 140,284 130,955 118,632 115,598 Interest expense 9,771 7,915 33,464 23,908 19,924 16,221 Income before income taxes 11,046 11,083 45,902 40,257 38,948 38,139 Income taxes 2,677 2,601 10,557 10,294 14,917 14,774 Net income $8,369 $8,482 $35,345 $29,963 $24,031 $23,365 13

Consolidated Balance Sheets in thousands 2Q 19 2Q 18 2018 2017 2016 2015 Cash $694 $2,799 $3,657 $5,230 $4,446 $7,654 Gross finance receivables 1,300,043 1,121,711 1,237,526 1,066,650 916,954 785,042 Unearned finance charges and insurance premiums (326,609) (274,473) (305,283) (249,187) ( 199,179) ( 156,598) Finance receivables 973, 434 847,238 932,243 817,463 717,775 628,444 Allowance for credit losses (57,200) ( 48,450) (58,300) (48,910) (41,250) (37,452) Net finance receivables 916,234 798,788 873,943 768,553 676,525 590,992 Restricted cash 41,803 26,356 46,484 16,787 8,297 1 0,506 Lease assets 25,575 ‐ ‐ ‐ ‐ ‐ Property and equipment 14,132 12,072 13,926 12,294 1 1,693 9,049 Intangible assets 9,953 10,785 10,010 10,607 6,448 3,023 Deferred tax asset 437 ‐ ‐ ‐ 33 1,982 Other assets 10,488 17,420 8,375 16,012 4,782 3,167 Total assets $1,019,316 $868,220 $956,395 $829,483 $712,224 $626,373 Long‐term debt $689,310 $595,765 $660,507 $571,496 $491,678 $411,177 Unamortized debt issuance costs ( 7,357) (7,437) (9,158) (4,950) (2,152) (2,692) Net long‐term debt 681,953 588,328 651,349 566,546 489,526 408,485 Lease liabilities 27,454 ‐ ‐ ‐ ‐ ‐ Accounts payable and accrued expenses 19,690 17,526 25,138 18,565 1 5,223 1 2,661 Deferred tax liability ‐ 3 ,832 747 4,961 ‐ ‐ Total liabilities 729,097 609,686 677,234 590,072 504,749 421,146 Common stock 1,349 1 ,333 1,332 1,321 1,300 1,291 Additional paid‐in capital 100,486 96,369 98,778 94,384 9 2,432 8 9,178 Retained earnings 220, 574 185,878 204,097 168,752 138,789 114,758 Treasury stock (32,190) ( 25,046) (25,046) (25,046) (25,046) ‐ Total stockholders' equity 290,219 258,534 279,161 239,411 207,475 205,227 Total liabilities and stockholders' equity $1,019,316 $868,220 $956,395 $829,483 $712,224 $626,373 14Consolidated Balance Sheets in thousands 2Q 19 2Q 18 2018 2017 2016 2015 Cash $694 $2,799 $3,657 $5,230 $4,446 $7,654 Gross finance receivables 1,300,043 1,121,711 1,237,526 1,066,650 916,954 785,042 Unearned finance charges and insurance premiums (326,609) (274,473) (305,283) (249,187) ( 199,179) ( 156,598) Finance receivables 973, 434 847,238 932,243 817,463 717,775 628,444 Allowance for credit losses (57,200) ( 48,450) (58,300) (48,910) (41,250) (37,452) Net finance receivables 916,234 798,788 873,943 768,553 676,525 590,992 Restricted cash 41,803 26,356 46,484 16,787 8,297 1 0,506 Lease assets 25,575 ‐ ‐ ‐ ‐ ‐ Property and equipment 14,132 12,072 13,926 12,294 1 1,693 9,049 Intangible assets 9,953 10,785 10,010 10,607 6,448 3,023 Deferred tax asset 437 ‐ ‐ ‐ 33 1,982 Other assets 10,488 17,420 8,375 16,012 4,782 3,167 Total assets $1,019,316 $868,220 $956,395 $829,483 $712,224 $626,373 Long‐term debt $689,310 $595,765 $660,507 $571,496 $491,678 $411,177 Unamortized debt issuance costs ( 7,357) (7,437) (9,158) (4,950) (2,152) (2,692) Net long‐term debt 681,953 588,328 651,349 566,546 489,526 408,485 Lease liabilities 27,454 ‐ ‐ ‐ ‐ ‐ Accounts payable and accrued expenses 19,690 17,526 25,138 18,565 1 5,223 1 2,661 Deferred tax liability ‐ 3 ,832 747 4,961 ‐ ‐ Total liabilities 729,097 609,686 677,234 590,072 504,749 421,146 Common stock 1,349 1 ,333 1,332 1,321 1,300 1,291 Additional paid‐in capital 100,486 96,369 98,778 94,384 9 2,432 8 9,178 Retained earnings 220, 574 185,878 204,097 168,752 138,789 114,758 Treasury stock (32,190) ( 25,046) (25,046) (25,046) (25,046) ‐ Total stockholders' equity 290,219 258,534 279,161 239,411 207,475 205,227 Total liabilities and stockholders' equity $1,019,316 $868,220 $956,395 $829,483 $712,224 $626,373 14
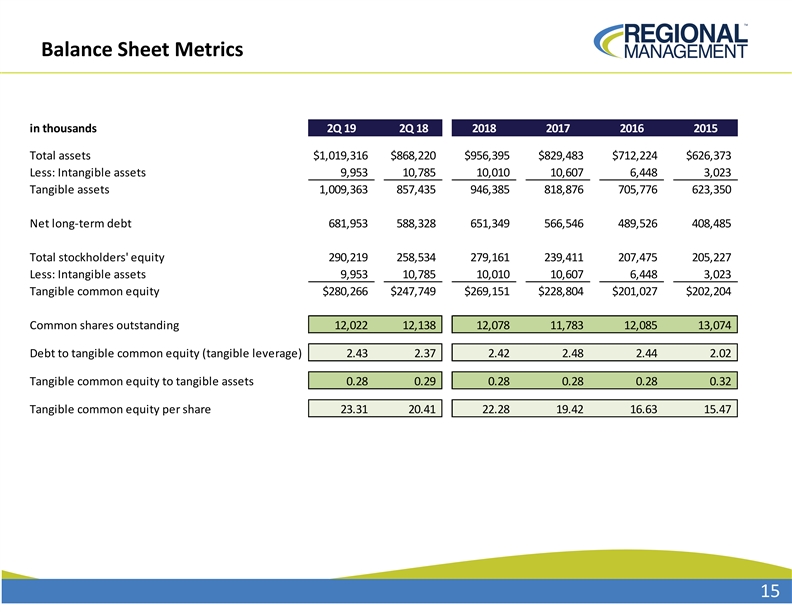
Balance Sheet Metrics in thousands 2Q 19 2Q 18 2018 2017 2016 2015 Total assets $1,019,316 $868,220 $956,395 $829,483 $712,224 $626,373 Less: Intangible assets 9,953 10,785 10,010 10,607 6,448 3,023 Tangible assets 1,009,363 857,435 946,385 818,876 705,776 623,350 Net long‐term debt 681,953 588,328 651,349 566,546 489,526 408,485 Total stockholders' equity 290,219 258,534 279,161 239,411 207,475 205,227 Less: Intangible assets 9,953 10,785 10,010 10,607 6,448 3,023 Tangible common equity $280,266 $247,749 $269,151 $228,804 $201,027 $202,204 Common shares outstanding 12,022 12,138 12,078 11,783 12,085 13,074 Debt to tangible common equity (tangible leverage) 2.43 2.37 2.42 2.48 2.44 2.02 Tangible common equity to tangible assets 0.28 0.29 0.28 0.28 0.28 0.32 Tangible common equity per share 23.31 20.41 22.28 19.42 16.63 15.47 15Balance Sheet Metrics in thousands 2Q 19 2Q 18 2018 2017 2016 2015 Total assets $1,019,316 $868,220 $956,395 $829,483 $712,224 $626,373 Less: Intangible assets 9,953 10,785 10,010 10,607 6,448 3,023 Tangible assets 1,009,363 857,435 946,385 818,876 705,776 623,350 Net long‐term debt 681,953 588,328 651,349 566,546 489,526 408,485 Total stockholders' equity 290,219 258,534 279,161 239,411 207,475 205,227 Less: Intangible assets 9,953 10,785 10,010 10,607 6,448 3,023 Tangible common equity $280,266 $247,749 $269,151 $228,804 $201,027 $202,204 Common shares outstanding 12,022 12,138 12,078 11,783 12,085 13,074 Debt to tangible common equity (tangible leverage) 2.43 2.37 2.42 2.48 2.44 2.02 Tangible common equity to tangible assets 0.28 0.29 0.28 0.28 0.28 0.32 Tangible common equity per share 23.31 20.41 22.28 19.42 16.63 15.47 15
