Exhibit 99.1

REGIONAL MANAGEMENT RM LISTED NYSE ABS Investor Presentation October 2022
Legal Disclosures The information contained in this electronic presentation (the “Information”) is being provided to you on a confidential basis solely for your review and may not be downloaded, copied, reproduced, or redistributed, in whole or in part, directly or indirectly, by you. The Information is provided to you solely for informational purposes, is intended for your use only, and does not constitute an offer or a commitment, a solicitation of an offer or commitment, or any advice or recommendation, to enter into or conclude any transaction (whether on the indicative terms shown or otherwise). The Information will not constitute an offer to sell or the solicitation of an offer to buy the Series 2022-2B Class A and Class B Notes (the “Offered Notes”) contemplated to be issued by Regional Management Trust 2022-2B (the “Issuer”) discussed in the Information, nor will there be any offer to sell or solicitation of an offer to buy the Offered Notes in any jurisdiction or to any person in which or to whom such offer, solicitation, or sale would be unlawful. This electronic presentation is not an offering circular and the Information does not include all of the information required to be included in the offering circular relating to the Offered Notes. Any indicative terms described in the Information are subject to and qualified in their entirety by the offering circular relating to the Offered Notes, which will supersede the indicative terms described in the Information in their entirety, and other preliminary information made (or to be made) available to you. As such, the Information may not reflect the impact of all structural characteristics of the Offered Notes. The assumptions underlying the Information, including structure and collateral, are for preliminary discussion purposes only and may be modified to reflect changed circumstances. The Information does not purport to contain all of the information that an interested party may desire. In all cases, interested parties should conduct their own investigative analysis of the transaction described in the Information and the data set forth herein. Each person receiving these materials should make an independent assessment of the merits of pursuing a transaction described in these materials and should consult their own professional advisors. THIS ELECTRONIC PRESENTATION AND THE INFORMATION ARE NOT INTENDED TO FURNISH LEGAL, REGULATORY, TAX, ACCOUNTING, INVESTMENT, OR OTHER ADVICE TO ANY PROSPECTIVE INVESTOR IN THE OFFERED NOTES. This presentation contains summarized information concerning Regional Management Corp. (the “Company”) and the Company’s business, operations, financial performance, and trends. No representation is made that the Information in this document is complete. For additional financial, statistical, and business information concerning the Company, please see the Company’s most recent Annual Report on Form 10-K and Quarterly Reports on Form 10-Q filed with the U.S. Securities and Exchange Commission (the “SEC”), as well as the Company’s other reports filed with the SEC from time to time. Such reports are or will be available on the Company’s website (www.regionalmanagement.com) and on the SEC’s website (www.sec.gov). The information and opinions contained in this document are provided as of the date of this presentation and are subject to change without notice. This document has not been approved by any regulatory or supervisory authority. The Information and this presentation, the related remarks, and the responses to various questions may contain various “forward-looking statements” within the meaning of the Private Securities Litigation Reform Act of 1995. Forward-looking statements are not statements of historical fact but instead represent the Company’s expectations or beliefs concerning future events. Forward-looking statements include, without limitation, statements concerning future plans, objectives, goals, projections, strategies, events, or performance, and underlying assumptions and other statements related thereto. Words such as “may,” “will,” “should,” “likely,” “anticipates,” “expects,” “intends,” “plans,” “projects,” “believes,” “estimates,” “outlook,” and similar expressions may be used to identify these forward-looking statements. Such forward-looking statements speak only as of the date on which they were made and are about matters that are inherently subject to risks and uncertainties, many of which are outside of the control of the Company. As a result, actual performance and results may differ materially from those contemplated by these forward-looking statements. Therefore, investors should not place undue reliance on such statements. REGIONAL MANAGEMENT 2
Legal Disclosures Factors that could cause actual results or performance to differ from the expectations expressed or implied in forward-looking statements include, but are not limited to, the following: managing growth effectively, implementing the Company’s growth strategy, and opening new branches as planned; the Company’s direct mail strategy, including’s its convenience check strategy; the Company’s policies and procedures for underwriting, processing, and servicing loans; the Company’s ability to collect on its loan portfolio; the Company’s insurance operations; exposure to credit risk and repayment risk, which risks may increase in light of adverse or recessionary economic conditions; the implementation of new underwriting models and processes, including as to the effectiveness of new custom scorecards, as well as its legacy internal metrics and data; changes in the competitive environment in which the Company operates or a decrease in the demand for its products; the geographic concentration of the Company’s loan portfolio; the failure of third-party service providers, including those providing information technology products; changes in economic conditions in the markets the Company serves, including levels of unemployment and bankruptcies; the ability to achieve successful acquisitions and strategic alliances; the ability to make technological improvements as quickly as competitors; security breaches, cyber-attacks, failures in information systems, or fraudulent activity; the ability to originate loans; reliance on information technology resources and providers, including the risk of prolonged system outages; changes in current revenue and expense trends, including trends affecting delinquencies and credit losses; changes in operating and administrative expenses; the departure, transition, or replacement of key personnel; the ability to timely and effectively implement, transition to, and maintain the necessary information technology systems, infrastructure, processes, and controls to support the Company’s operations and initiatives; changes in interest rates; existing sources of liquidity may become insufficient or access to these sources may become unexpectedly restricted; and exposure to financial risk due to asset-backed securitization transactions; risks related to regulation and legal proceedings, including changes in laws or regulations or in the interpretation or enforcement of laws or regulations; changes in accounting standards, rules, and interpretations and the failure of related assumptions and estimates, including those associated with the implementation of CECL accounting; and the impact of changes in tax laws, guidance, and interpretations, including the timing and amount of revenues that may be recognized; and risks related to the ownership of the Company’s common stock, including volatility in the market price of shares of the Company’s common stock; the timing and amount of future cash dividend payments; and anti-takeover provisions in the Company’s charter documents and applicable state law. The COVID-19 pandemic may impact the Company’s operations and financial condition and may impact the Company’s operations and financial condition and may also magnify many of the existing risks and uncertainties. The foregoing factors and others are discussed in greater detail in the Company’s filings with the SEC. The Company will not update or revise forward-looking statements to reflect events or circumstances after the date of this presentation or to reflect the occurrence of unanticipated events or the non-occurrence of anticipated events, whether as a result of new information, future developments, or otherwise, except as required by law. Except to the extent required by law, the Company, its respective agents, employees, and advisors, and Credit Suisse Securities (USA) LLC, Wells Fargo Securities, LLC, J.P. Morgan Securities LLC, and BMO Capital Markets (collectively, the “Initial Purchasers”) do not intend or have any duty or obligation to supplement, amend, update, or revise any forward-looking statement or other Information, whether as a result of new information, future developments, or otherwise. The Information and opinions contained in this document are provided as of the date of this presentation and are subject to change without notice. This document has not been approved by any regulatory or supervisory authority. The Initial Purchasers may, from time to time, participate or invest in other financing transactions with the Company and its affiliates, perform services for or solicit business from the Company and its affiliates, and/or have a position or effect transactions in the Notes or derivatives thereof. REGIONAL MANAGEMENT 3

Company Overview
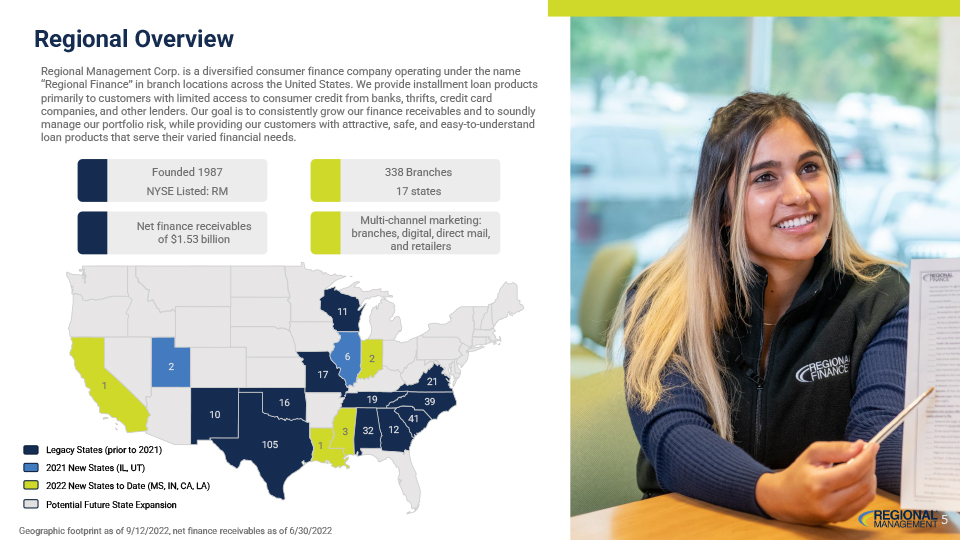
Regional Overview Regional Management Corp. is a diversified consumer finance company operating under the name “Regional Finance” in branch locations across the United States. We provide installment loan products primarily to customers with limited access to consumer credit from banks, thrifts, credit card companies, and other lenders. Our goal is to consistently grow our finance receivables and to soundly manage our portfolio risk, while providing our customers with attractive, safe, and easy-to-understand loan products that serve their varied financial needs. Founded 1987 338 Branches NYSE Listed: RM 17 states Multi-channel marketing: Net finance receivables branches, digital, direct mail, of $1.53 billion and retailers 11 6 2 2 17 1 21 16 19 39 10 41 3 32 12 105 1 Legacy States (prior to 2021) 2021 New States (IL, UT) 2022 New States to Date (MS, IN, CA, LA) Potential Future State Expansion Geographic footprint as of 9/12/2022, net finance receivables as of 6/30/2022 REGIONAL MANAGEMENT 5
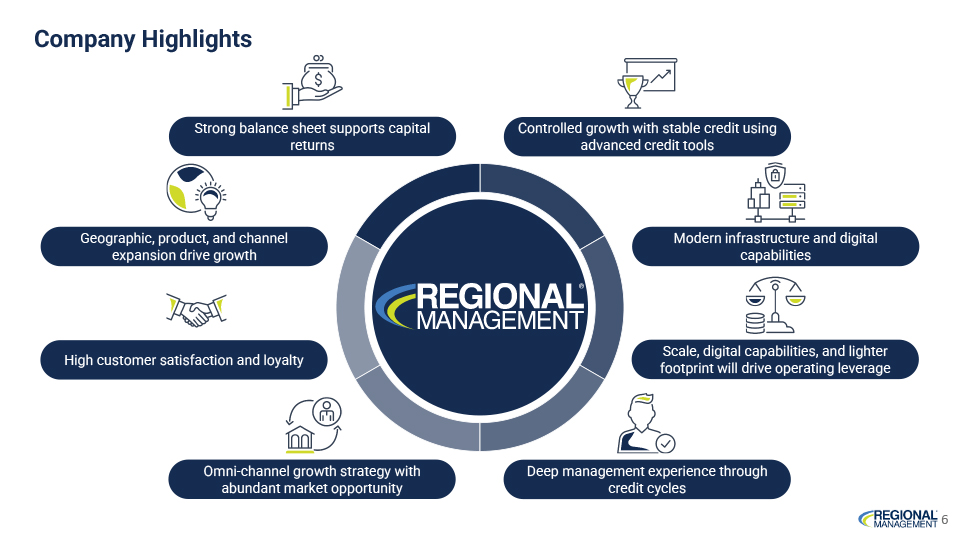
Company Highlights Strong balance sheet supports capital returns Controlled growth with stable credit using returns advanced credit tools Geographic, product, and channel Modern infrastructure and digital expansion drive growth capabilitie scale, digital capabilities, and lighter High customer satisfaction and loyalty foot print will drive operating leverage Omni-channel growth strategy with Deep management experience through abundant market opportunity credit cycles REGIONAL MANAGEMENT 6
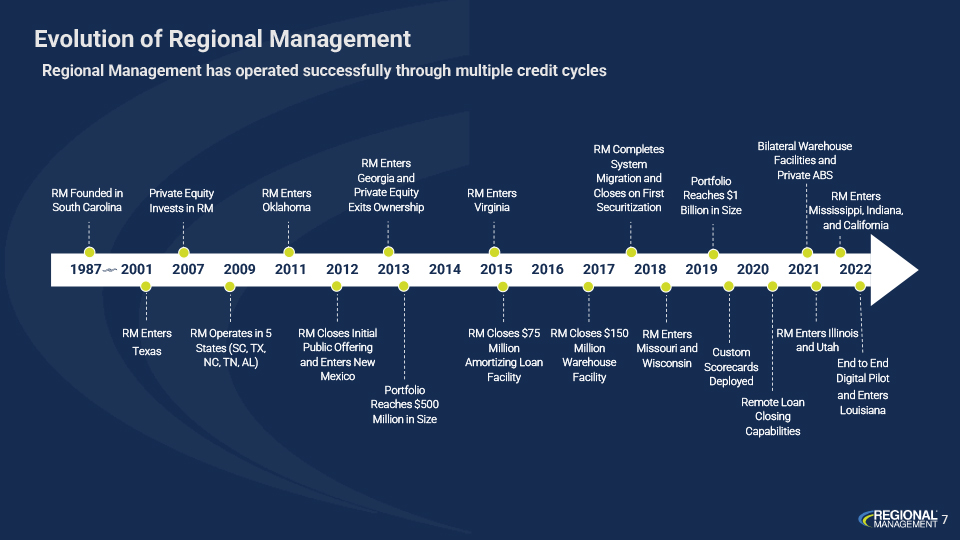
Evolution of Regional Management Regional Management has operated successfully through multiple credit cycles RM Founded in South Carolina Private Equity Invests in RM RM Enters Oklahoma RM Enters Georgia and Private Equity Exits Ownership RM Enters Virginia RM Completes System Migration and Closes on First Securitization Portfolio Reaches $1 Billion in Size Bilateral Warehouse Facilities and Private ABS RM Enters Mississippi, Indiana, and California ¦ 1987 2001 2007 2009 2011 2012 2013 2014 2015 2016 2017 2018 2019 2020 2021 2022 RM Enters Texas RM Operates in 5 States (SC, TX, NC, TN, AL) RM Closes Initial Public Offering and Enters New Mexico Portfolio Reaches $500 Million in Size RM Closes $75 RM Closes $150 Million Million Amortizing Loan Warehouse Facility Facility RM Enters Missouri and Custom Wisconsin Scorecards Deployed RM Enters Illinois and Utah Remote Loan Closing Capabilities End to End Digital Pilot and Enters Louisiana REGIONAL MANAGEMENT 7
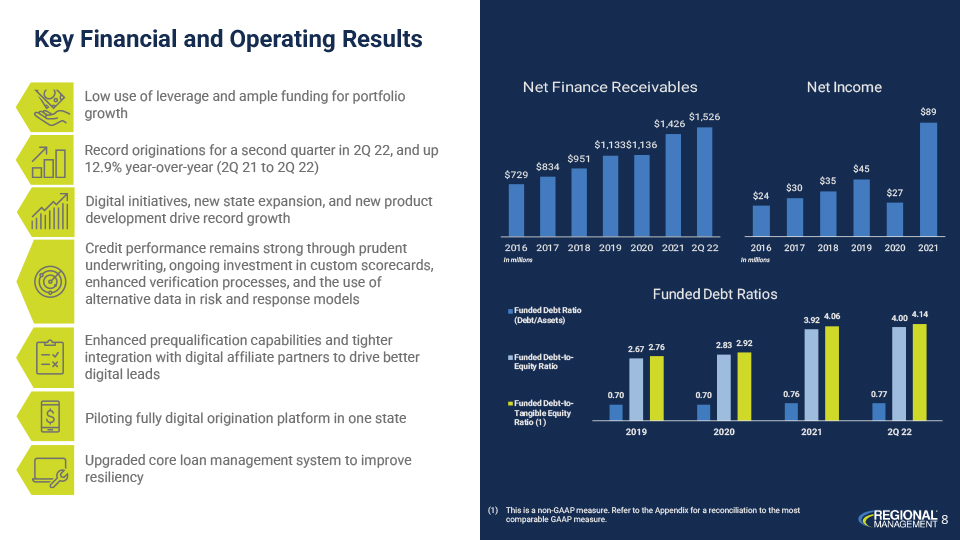
Key Financial and Operating Results Low use of leverage and ample funding for portfolio growth al $ Record originations for a second quarter in 2Q 22, and up 12.9% year-over-year (2Q 21 to 2Q 22) Digital initiatives, new state expansion, and new product development drive record growth Credit performance remains strong through prudent underwriting, ongoing investment in custom scorecards, enhanced verification processes, and the use of alternative data in risk and response models Enhanced prequalification capabilities and tighter integration with digital affiliate partners to drive better digital leads Piloting fully digital origination platform in one state Upgraded core loan management system to improve resiliency 6a— Net Finance Receivables $1,426 $1,526 $1,133$1,136 $951 $834 mill 2016 2017 2018 2019 2020 2021 2022 In millions $729 8 Funded Debt Ratio (Debt/Assets) –Funded Debt-to- Equity Ratio – Funded Debt-to- Tangible Equity Ratio (1) 0.70 2.67 2.76 2019 Funded Debt Ratios 0.70 $24 2.83 2.92 2020 $30 0.76 Net Income (1) This is a non-GAAP measure, Refer to the Appendix for a reconciliation to the most comparable GAAP measure, 2016 2017 2018 2019 2020 2021 In millions $35 3.92 2021 $45 4.06 $27 0.77 $89 4.00 4.14 2022 REGIONAL MANAGEMENT 8
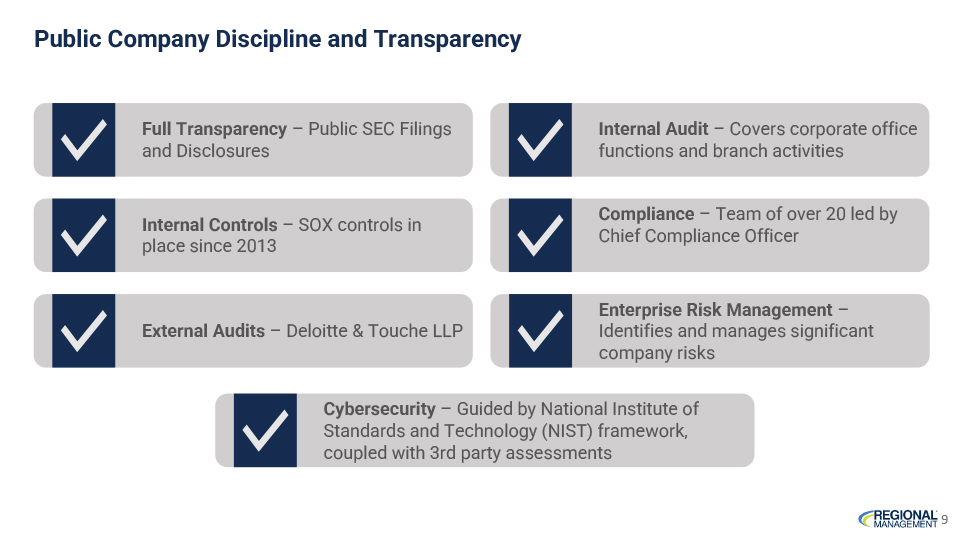
Public Company Discipline and Transparency Full Transparency—Public SEC Filings and Disclosures Internal Controls—SOX controls in place since 2013 External Audits—Deloitte & Touche LLP Internal Audit—Covers corporate office functions and branch activities Compliance—Team of over 20 led by Chief Compliance Officer Enterprise Risk Management - Identifies and manages significant company risks Cybersecurity—Guided by National Institute of Standards and Technology (NIST) framework, coupled with 3rd party assessments REGIONAL MANAGEMENT 9
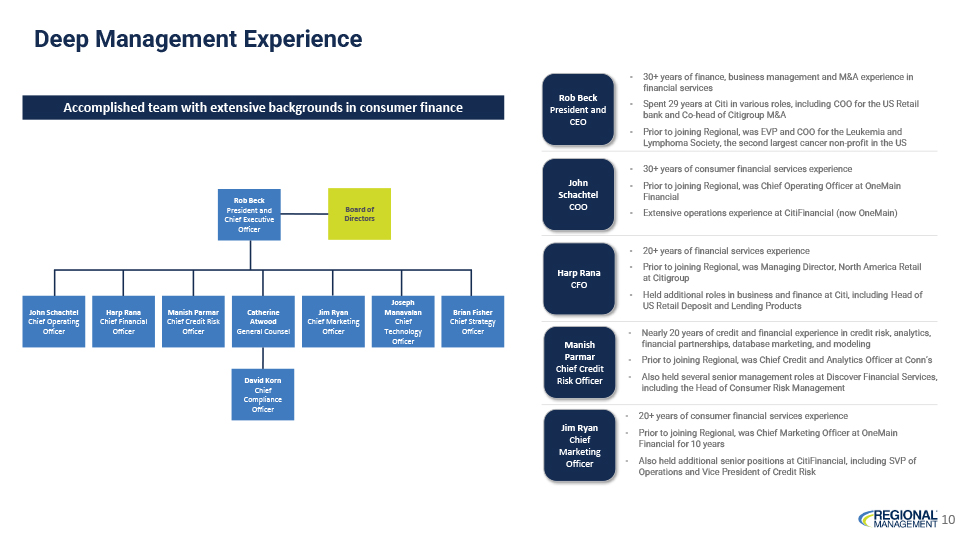
Deep Management Experience Accomplished team with extensive backgrounds in consumer finance John Schachtel Chief Operating Officer Harp Rana Chief Financial Officer Manish Parmar Chief Credit Risk Officer Rob Beck President and Chief Executive Officer Catherine Atwood General Counsel David Korn Chief Compliance Officer Board of Directors Jim Ryan Chief Marketing Officer Joseph Manavalan Chief Technology Officer Brian Fisher Chief Strategy Officer Rob Beck President and CEO John Schachtel Coo Harp Rana CFO Manish Parmar Chief Credit Risk Officer Jim Ryan Chief Marketing Officer 30+ years of finance, business management and M&A experience in financial services -Spent 29 years at Citi in various roles, including COO for the US Retail bank and Co-head of Citigroup M&A -Prior to joining Regional, was EVP and COO for the Leukemia and Lymphoma Society, the second largest cancer non-profit in the US 30+ years of consumer financial services experience Prior to joining Regional, was Chief Operating Officer at OneMain Financial Extensive operations experience at CitiFinancial (now OneMain) 20+ years of financial services experience Prior to joining Regional, was Managing Director, North America Retail at Citigroup Held additional roles in business and finance at Citi, including Head of US Retail Deposit and Lending Products Nearly 20 years of credit and financial experience in credit risk, analytics, financial partnerships, database marketing, and modeling Prior to joining Regional, was Chief Credit and Analytics Officer at Conn’s Also held several senior management roles at Discover Financial Services, including the Head of Consumer Risk Management 20+ years of consumer financial services experience Prior to joining Regional, was Chief Marketing Officer at OneMain Financial for 10 years Also held additional senior positions at CitiFinancial, including SVP of Operations and Vice President of Credit Risk REGIONAL MANAGEMENT 10
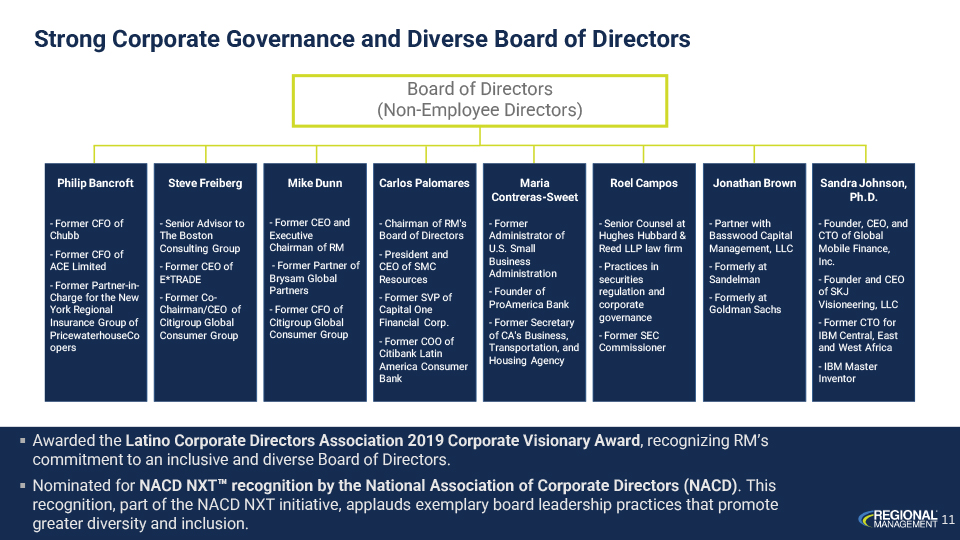
Strong Corporate Governance and Diverse Board of Directors Board of Directors (Non-Employee Directors) Philip Bancroft -Former CFO of Chubb -Former CFO of ACE Limited -Former Partner-in- Charge for the New York Regional Insurance Group of PricewaterhouseCo opers Steve Freiberg -Senior Advisor to The Boston Consulting Group -Former CEO of E*TRADE - Former Co- Chairman/CEO of Citigroup Global Consumer Group Mike Dunn -Former CEO and Executive Chairman of RM -Former Partner of Brysam Global Partners -Former CFO of Citigroup Global Consumer Group Carlos Palomares -Chairman of RM’s Board of Directors -President and CEO of SMC Resources -Former SVP of Capital One Financial Corp. - Former COO of Citibank Latin America Consumer Bank Maria Contreras-Sweet -Former Administrator of U.S. Small Business Administration -Founder of ProAmerica Bank -Former Secretary of CA’s Business, Transportation, and Housing Agency Roel Campos -Senior Counsel at Hughes Hubbard & Reed LLP law firm -Practices in securities regulation and corporate governance -Former SEC Commissioner Jonathan Brown -Partner with Basswood Capital Management, LLC -Formerly at Sandelman -Formerly at Goldman Sachs Sandra Johnson, Ph.D. -Founder, CEO, and CTO of Global Mobile Finance, Inc. -Founder and CEO of SKJ Visioneering, LLC -Former CTO for IBM Central, East and West Africa - IBM Master Inventor Awarded the Latino Corporate Directors Association 2019 Corporate Visionary Award, recognizing RM’s commitment to an inclusive and diverse Board of Directors. Nominated for NACD NXT™ recognition by the National Association of Corporate Directors (NACD). This recognition, part of the NACD NXT initiative, applauds exemplary board leadership practices that promote greater diversity and inclusion. REGIONAL MANAGEMENT 11
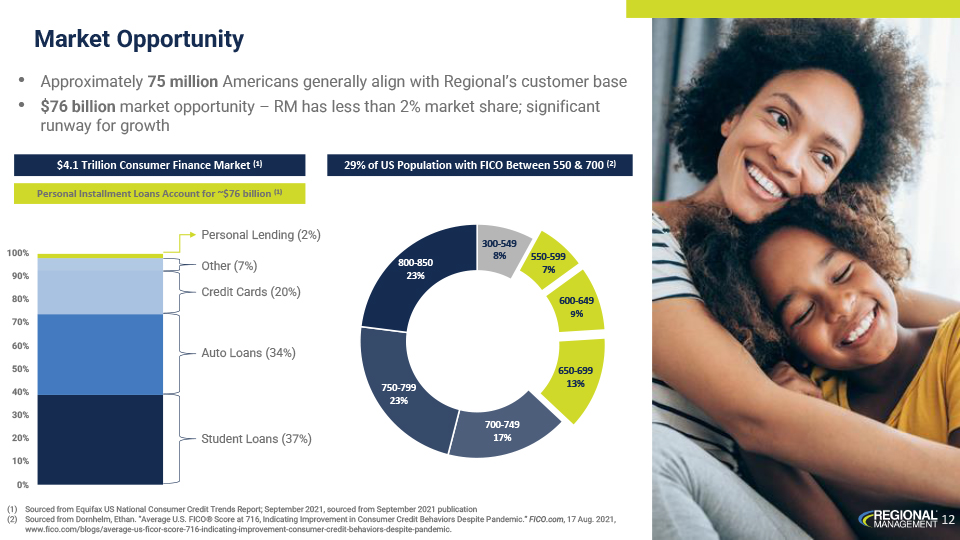
Market Opportunity • Approximately 75 million Americans generally align with Regional’s customer base • $76 billion market opportunity – RM has less than 2% market share; significant runway for growth Personal Installment Loans Account for ~$76 billion (1) 100% 90% 80% 70% 60% 50% 40% 30% 20% 10% 0% Personal Lending (2%) Other (7%) Credit Cards (20%) Auto Loans (34%) Student Loans (37%) 300-549 8% 550-599 7% 600-649 9% 650-699 13% (1) Sourced from Equifax US National Consumer Credit Trends Report; September 2021, sourced from September 2021 publication (2) Sourced from Dornhelm, Ethan. “Average U.S. FICO® Score at 716, Indicating Improvement in Consumer Credit Behaviors Despite Pandemic.” FICO.com, 17 Aug. 2021, www.fico.com/blogs/average-us-ficor-score-716-indicating-improvement-consumer-credit-behaviors-despite-pandemic. REGIONAL MANAGEMENT 12
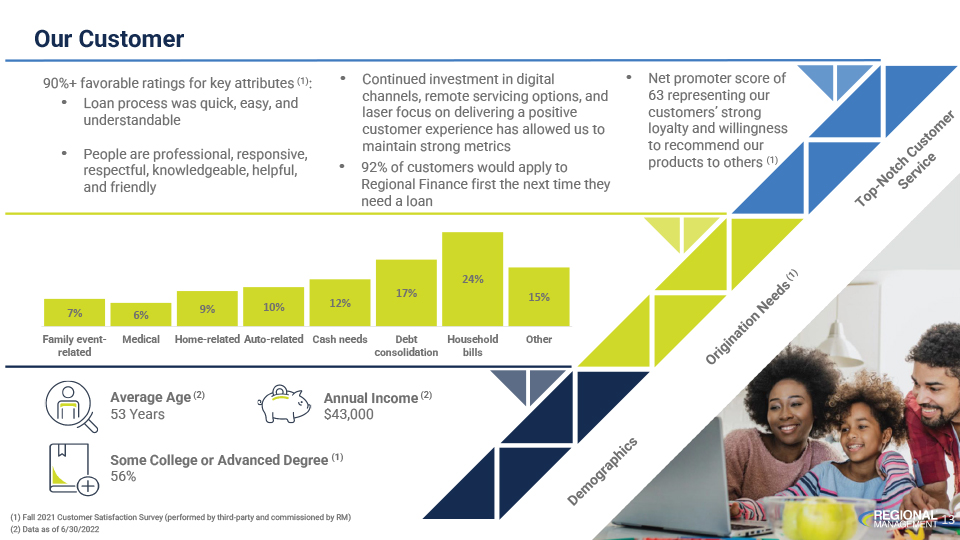
Our Customer 90%+ favorable ratings for key attributes (1): • Continued investment in digital • Net promoter score of channels, remote servicing options, and 63 representing our • Loan process was quick, easy, and laser focus on delivering a positive customers’ strong understandable customer experience has allowed us to loyalty and willingness • maintain strong metrics to recommend our People are professional, responsive, (1) • 92% of customers would apply to products to others respectful, knowledgeable, helpful, Regional Finance first the next time they and friendly need a loan 24% 17% 15% 10% 12% 7% 9% 6% Family event- Medical Home-related Auto-related Cash needs Debt Household Other related consolidation bills Average Age (2) Annual Income (2) 53 Years $43,000 Some College or Advanced Degree (1) 56% (1) Fall 2021 Customer Satisfaction Survey (performed by third-party and commissioned by RM) (2) Data as of 6/30/2022 Top-Notch Customer ServiceOrigination Needs(1)Demographics REGIONAL MANAGEMENT 13
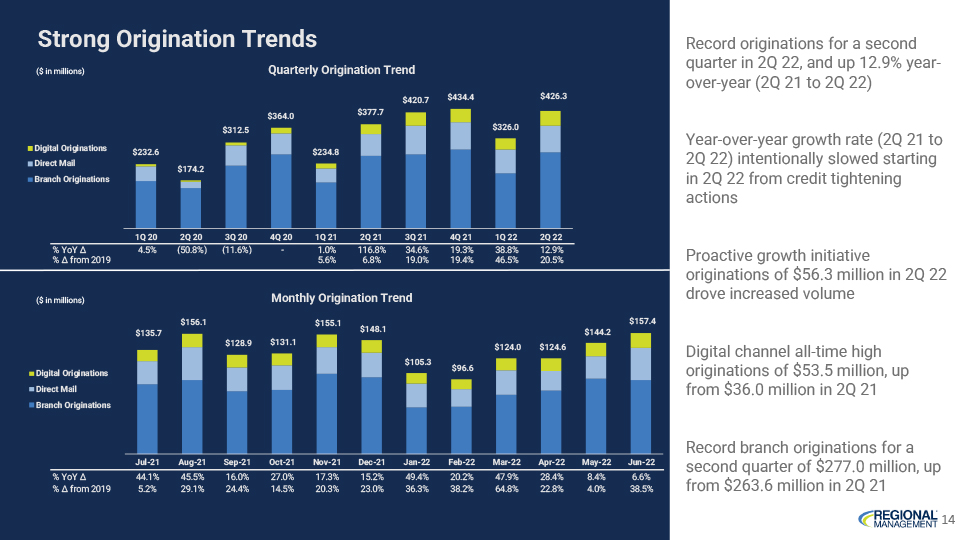
Strong Origination Trends Record originations for a second quarter in 2Q 22, and up 12.9% year-over-year (2Q 21 to 2Q 22) Year-over-year growth rate (2Q 21 to 2Q 22) intentionally slowed starting in 2Q 22 from credit tightening actions Proactive growth initiative originations of $56.3 million in 2Q 22 drove increased volume Digital channel all-time high originations of $53.5 million, up from $36.0 million in 2Q 21 Record branch originations for a second quarter of $277.0 million, up from $263.6 million in 2Q 21 Quarterly Origination Trend $434.4 $426.3 $420.7 $364.0 $377.7 $312.5 $326.0 Digital Originations $232.6 $234.8 Direct Mail $174.2 Branch Originations 1Q 20 2Q 20 3Q 20 4Q 20 1Q 21 2Q 21 3Q 21 4Q 21 1Q 22 2Q 22 % YoY ” 4.5% (50.8%) (11.6%)—1.0% 116.8% 34.6% 19.3% 38.8% 12.9% % ” from 2019 5.6% 6.8% 19.0% 19.4% 46.5% 20.5% Monthly Origination Trend $156.1 $155.1 $157.4 $148.1 $144.2 $135.7 $128.9 $131.1 $124.0 $124.6 $105.3 $96.6 Digital Originations Direct Mail Branch Originations Jul-21 Aug-21 Sep-21 Oct-21 Nov-21 Dec-21 Jan-22 Feb-22 Mar-22 Apr-22 May-22 Jun-22 % YoY ” 44.1% 45.5% 16.0% 27.0% 17.3% 15.2% 49.4% 20.2% 47.9% 28.4% 8.4% 6.6% % ” from 2019 5.2% 29.1% 24.4% 14.5% 20.3% 23.0% 36.3% 38.2% 64.8% 22.8% 4.0% 38.5% REGIONAL MANAGEMENT 14
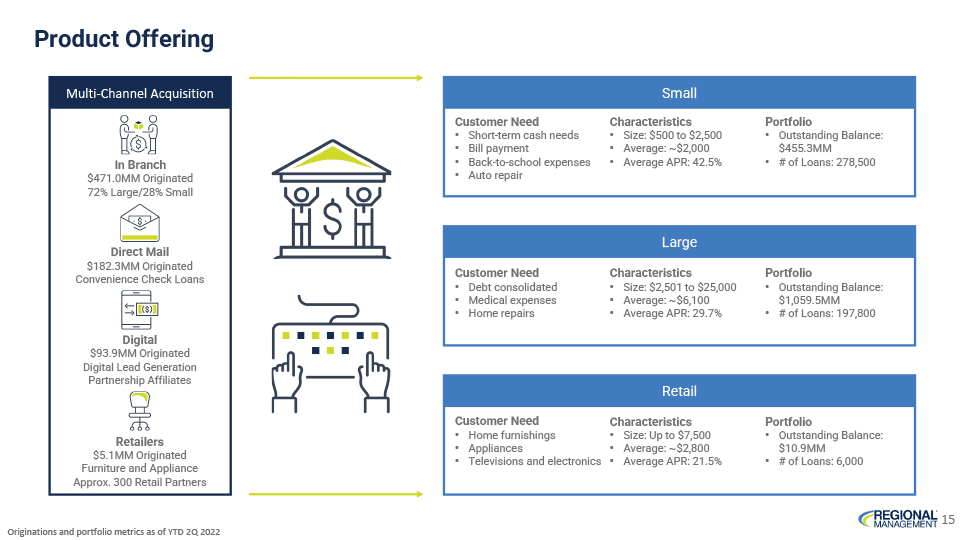
Product Offering In Branch $471.0MM Originated 72% Large/28% Small Direct Mail $182.3MM Originated Convenience Check Loans Digital $93.9MM Originated Digital Lead Generation Partnership Affiliates Retailers $5.1MM Originated Furniture and Appliance Approx. 300 Retail Partners Customer Need Characteristics Portfolio • Short-term cash needs • Size: $500 to $2,500 • Outstanding Balance: • Bill payment • Average: ~$2,000 $455.3MM • Back-to-school expenses • Average APR: 42.5% • # of Loans: 278,500 • Auto repair Customer Need Characteristics Portfolio • Debt consolidated • Size: $2,501 to $25,000 • Outstanding Balance: • Medical expenses • Average: ~$6,100 $1,059.5MM • Home repairs • Average APR: 29.7% • # of Loans: 197,800 Customer Need Characteristics Portfolio • Home furnishings • Size: Up to $7,500 • Outstanding Balance: • Appliances • Average: ~$2,800 $10.9MM • Televisions and electronics • Average APR: 21.5% • # of Loans: 6,000 REGIONAL MANAGEMENT 15
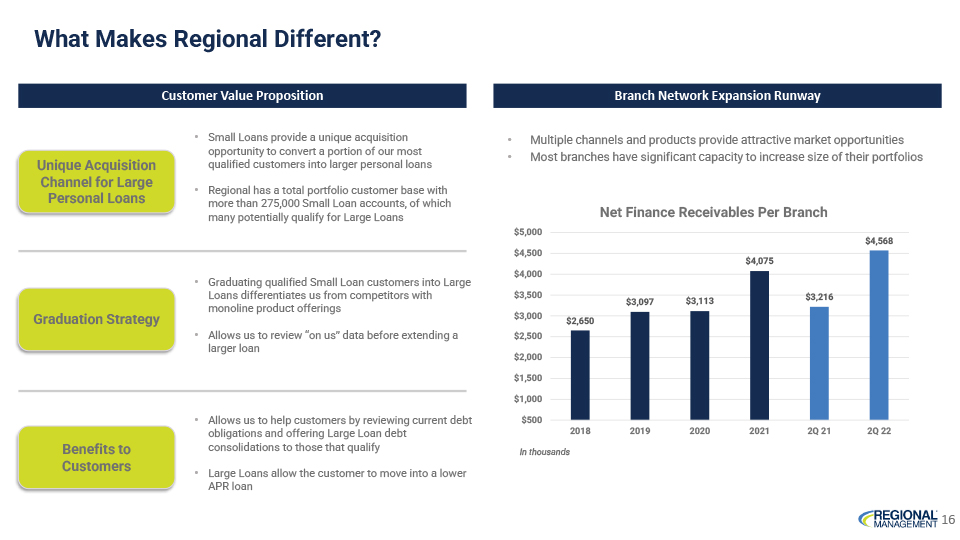
What Makes Regional Different? Customer Value Proposition Branch Network Expansion Runway • Small Loans provide a unique acquisition opportunity to convert a portion of our most Unique Acquisition qualified customers into larger personal loans Channel for Large • Regional has a total portfolio customer base with Personal Loans more than 275,000 Small Loan accounts, of which many potentially qualify for Large Loans • Graduating qualified Small Loan customers into Large Loans differentiates us from competitors with monoline product offerings Graduation Strategy • Allows us to review “on us” data before extending a larger loan • Allows us to help customers by reviewing current debt obligations and offering Large Loan debt Benefits to consolidations to those that qualify Customers • Large Loans allow the customer to move into a lower APR loan • Multiple channels and products provide attractive market opportunities • Most branches have significant capacity to increase size of their portfolios Net Finance Receivables Per Branch $5,000 $4,568 $4,500 $4,075 $4,000 $3,500 $3,216 $3,097 $3,113 $3,000 $2,650 $2,500 $2,000 $1,500 $1,000 $500 2018 2019 2020 2021 2Q 21 2Q 22 In thousands REGIONAL MANAGEMENT 16
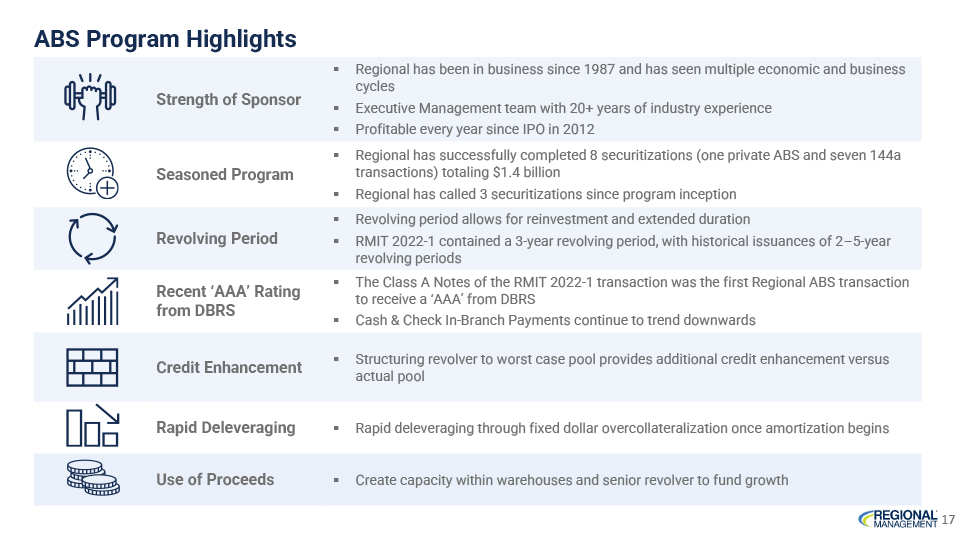
ABS Program Highlights OF B a- Exhibit 99.1.pdf Strength of Sponsor Seasoned Program Revolving Period Recent ‘AAA’ Rating from DBRS Credit Enhancement Rapid Deleveraging Use of Proceeds Regional has been in business since 1987 and has seen multiple economic and business cycles Executive Management team with 20+ years of industry experience Profitable every year since IPO in 2012 Regional has successfully completed 8 securitizations (one private ABS and seven 144a transactions) totaling $1.4 billion Regional has called 3 securitizations since program inception Revolving period allows for reinvestment and extended duration RMIT 2022-1 contained a 3-year revolving period, with historical issuances of 2-5-year revolving periods The Class A Notes of the RMIT 2022-1 transaction was the first Regional ABS transaction to receive a ‘AAA’ from DBRS Cash & Check In-Branch Payments continue to trend downwards · Structuring revolver to worst case pool provides additional credit enhancement versus actual pool Rapid deleveraging through fixed dollar overcollateralization once amortization begins Create capacity within warehouses and senior revolver to fund growth REGIONAL MANAGEMENT 17
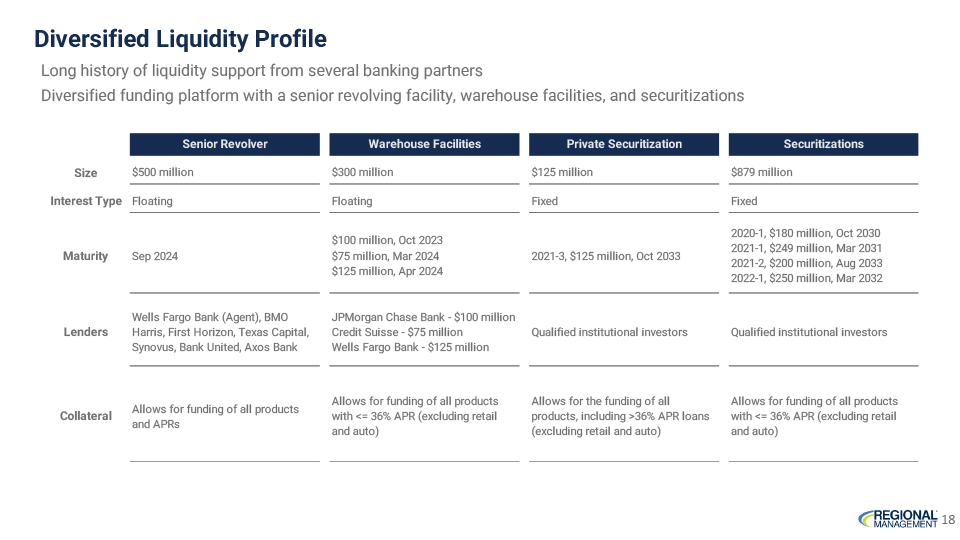
Diversified Liquidity Profile Long history of liquidity support from several banking partners Diversified funding platform with a senior revolving facility, warehouse facilities, and securitizations Senior Revolver Warehouse Facilities Private Securitization Securitizations Size $500 million $300 million $125 million $879 million Interest Type Floating Floating Fixed Fixed 2020-1, $180 million, Oct 2030 $100 million, Oct 2023 2021-1, $249 million, Mar 2031 Maturity Sep 2024 $75 million, Mar 2024 2021-3, $125 million, Oct 2033 2021-2, $200 million, Aug 2033 $125 million, Apr 2024 2022-1, $250 million, Mar 2032 Wells Fargo Bank (Agent), BMO JPMorgan Chase Bank - $100 million Lenders Harris, First Horizon, Texas Capital, Credit Suisse - $75 million Qualified institutional investors Qualified institutional investors Synovus, Bank United, Axos Bank Wells Fargo Bank - $125 million Allows for funding of all products Allows for the funding of all Allows for funding of all products Allows for funding of all products Collateral with <= 36% APR (excluding retail products, including >36% APR loans with <= 36% APR (excluding retail and APRs and auto) (excluding retail and auto) and auto)
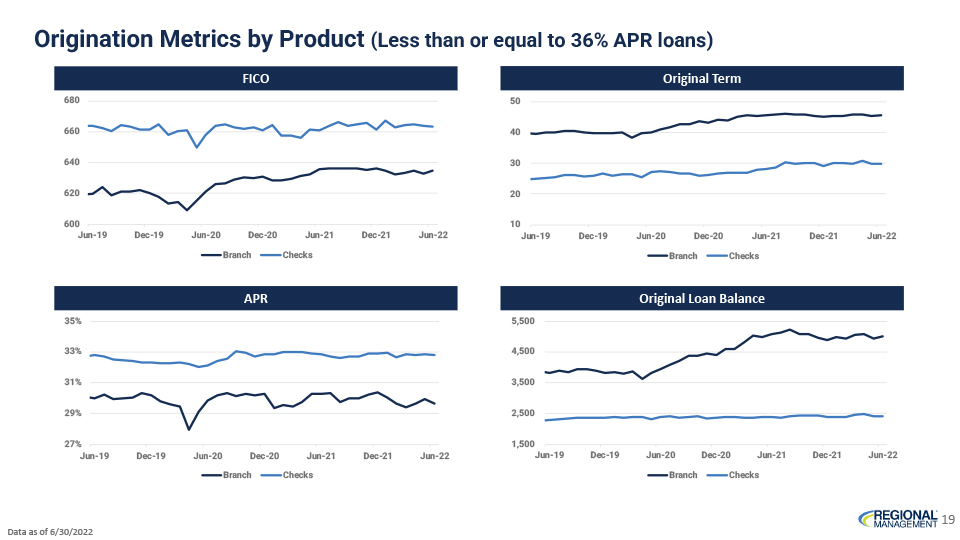
Origination Metrics by Product (Less than or equal to 36% APR loans) FICO Original Term 680 50 660 40 640 30 620 20 600 10 Jun-19 Dec-19 Jun-20 Dec-20 Jun-21 Dec-21 Jun-22 Jun-19 Dec-19 Jun-20 Dec-20 Jun-21 Dec-21 Jun-22 Branch Checks Branch Checks APR Original Loan Balance 35% 5,500 33% 4,500 31% 3,500 29% 2,500 27% 1,500 Jun-19 Dec-19 Jun-20 Dec-20 Jun-21 Dec-21 Jun-22 Jun-19 Dec-19 Jun-20 Dec-20 Jun-21 Dec-21 Jun-22 Branch Checks Branch Checks Data as of 6/30/2022 REGIONAL MANAGEMENT 19
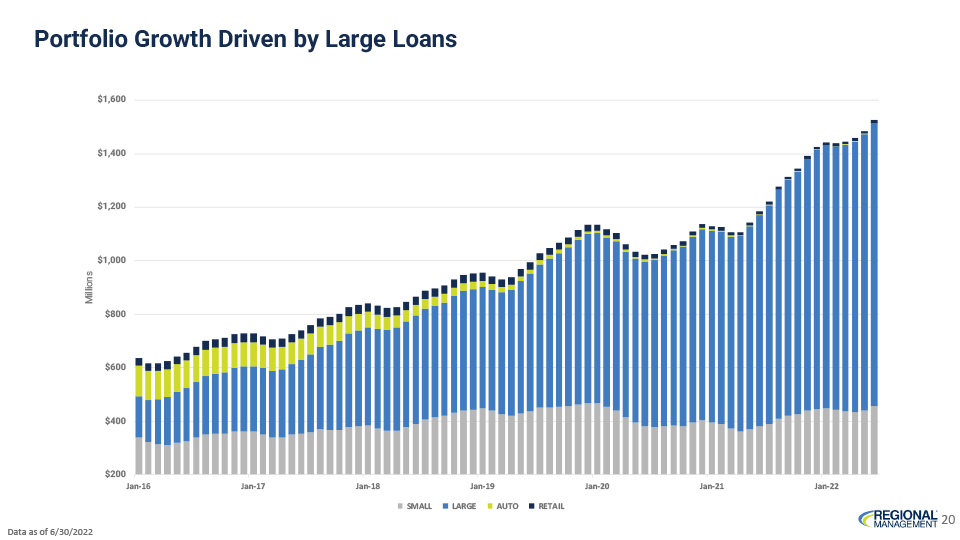
Portfolio Growth Driven by Large Loans $1,600 $1,400 $1,200 $1,000 ion s Mill $800 $600 $400 $200 Jan-16 Jan-17 Jan-18 Jan-19 Jan-20 Jan-21 Jan-22 SMALL LARGE AUTO RETAIL Data as of 6/30/2022 REGIONAL MANAGEMENT 20

Underwriting and Servicing
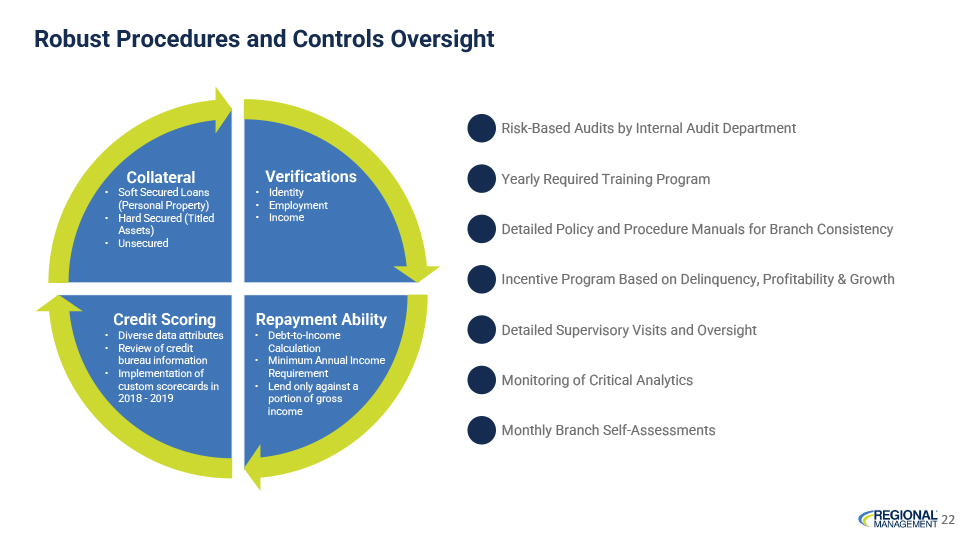
Robust Procedures and Controls Oversight Risk-Based Audits by Internal Audit Department Yearly Required Training Program Detailed Policy and Procedure Manuals for Branch Consistency Incentive Program Based on Delinquency, Profitability & Growth Detailed Supervisory Visits and Oversight Monitoring of Critical Analytics Monthly Branch Self-Assessments Collateral Soft Secured Loans (Personal Property) Hard Secured (Titled Assets) Unsecured Verifications • Identity Employment Income Credit Scoring • Diverse data attributes • Review of credit bureau information • Implementation of custom scorecards in 2018-2019 Repayment Ability • Debt-to-Income Calculation Minimum Annual Income Requirement • Lend only against a portion of gross income REGIONAL MANAGEMENT 22
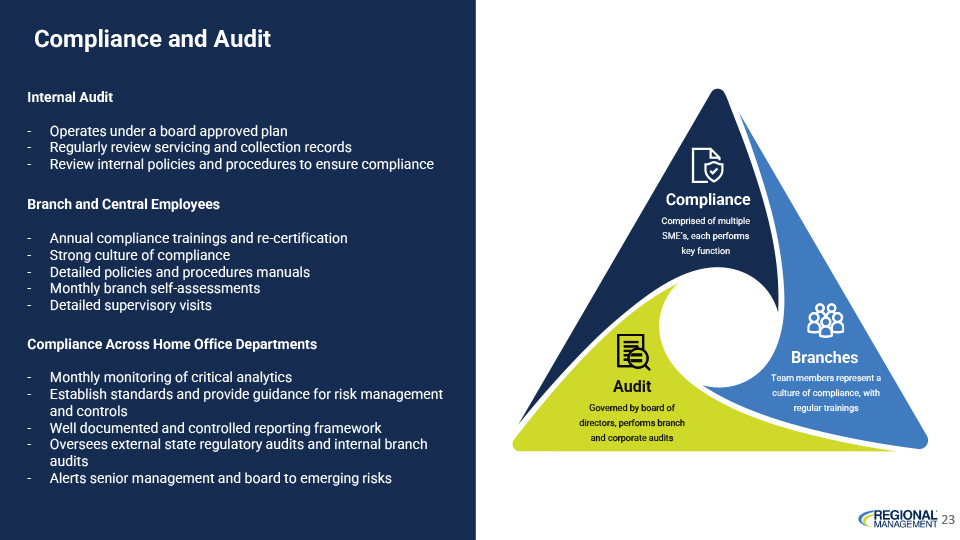
Compliance and Audit Internal Audit - Operates under a board approved plan - Regularly review servicing and collection records - Review internal policies and procedures to ensure compliance Branch and Central Employees - Annual compliance trainings and re- certification - Strong culture of compliance - Detailed policies and procedures manuals - Monthly branch self-assessments - Detailed supervisory visits Compliance Across Home Office Departments - Monthly monitoring of critical analytics - Establish standards and provide guidance for risk management and controls - Well documented and controlled reporting framework - Oversees external state regulatory audits and internal branch audits - Alerts senior management and board to emerging risks Compliance Comprised of multiple SME’s, each performs key function Branches Team members represent a Audit culture of compliance, with Governed by board of regular trainings directors, performs branch and corporate audits
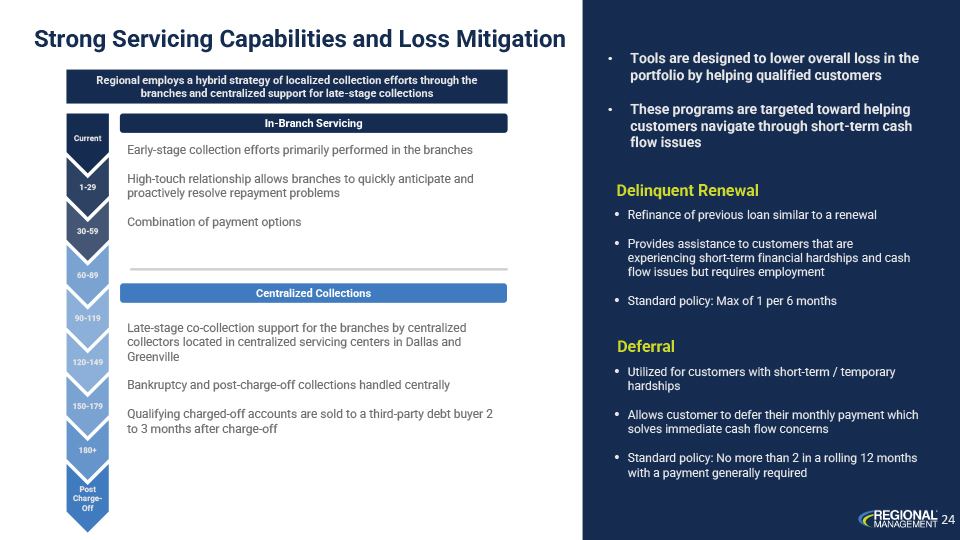
Strong Servicing Capabilities and Loss Mitigation • Tools are designed to lower overall loss in the Regional employs a hybrid strategy of localized collection efforts through the portfolio by helping qualified customers branches and centralized support for late-stage collections • These programs are targeted toward helping In-Branch Servicing customers navigate through short-term cash Current flow issues Early-stage collection efforts primarily performed in the branches 1-29 High-touch relationship allows branches to quickly anticipate and proactively resolve repayment problems Delinquent Renewal • Refinance of previous loan similar to a renewal Combination of payment options 30-59 • Provides assistance to customers that are experiencing short-term financial hardships and cash 60-89 flow issues but requires employment Centralized Collections • Standard policy: Max of 1 per 6 months 90-119 Late-stage co-collection support for the branches by centralized collectors located in cent Strong Servicing Capabilities and Loss Mitigation Regional employs a hybrid strategy of localized collection efforts through the branches and centralized support for late-stage collections In-Branch Servicing Early-stage collection efforts primarily performed in the branches High-touch relationship allows branches to quickly anticipate and proactively resolve repayment problems Combination of payment options Centralized Collections Current 1-29 30-59 60-89 90-119 • Tools are designed to lower overall loss in the portfolio by helping qualified customers • These programs are targeted toward helping customers navigate through short-term cash flow issues Delinquent Renewal • Refinance of previous loan similar to a renewal • Provides assistance to customers that are experiencing short-term financial hardships and cash flow issues but requires employment • Standard policy: Max of 1 per 6 months Late-stage co-collection support for the branches by centralized collectors located in centralized servicing centers in Dallas and Greenville Bankruptcy and post-charge-off collections handled centrally Qualifying charged-off accounts are sold to a third-party debt buyer 2 to 3 months after charge-off 120-149 150-179 180+ Post Charge-Off Deferral • Utilized for customers with short-term / temporary hardships • Allows customer to defer their monthly payment which solves immediate cash flow concerns • Standard policy: No more than 2 in a rolling 12 months with a payment generally required REGIONAL MANAGEMENT 24
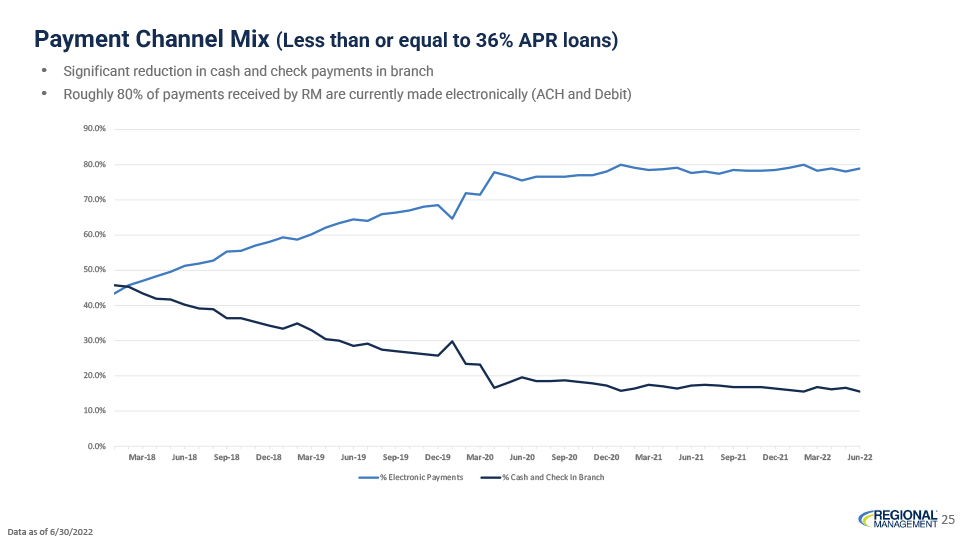
Payment Channel Mix (Less than or equal to 36% APR loans) • Significant reduction in cash and check payments in branch • Roughly 80% of payments received by RM are currently made electronically (ACH and Debit) 90.0% 80.0% 70.0% 60.0% 50.0% 40.0% 30.0% 20.0% 10.0% 0.0% Mar-18 Jun-18 Sep-18 Dec-18 Mar-19 Jun-19 Sep-19 Dec-19 Mar-20 Jun-20 Sep-20 Dec-20 Mar-21 Jun-21 Sep-21 Dec-21 Mar-22 Jun-22 % Electronic Payments % Cash and Check In Branch REGIONAL MANAGEMENT 25 Data as of 6/30/2022

Credit Performance
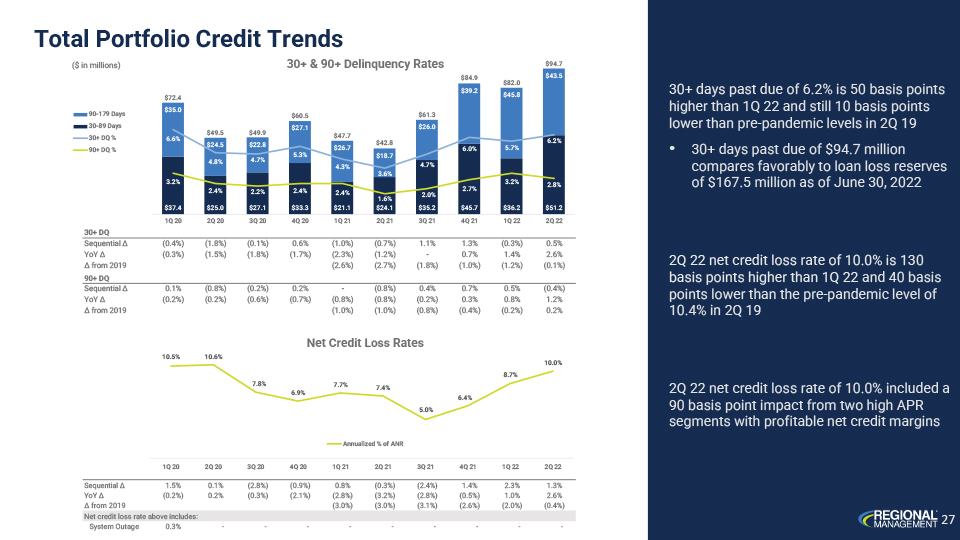
Total Portfolio Credit Trends ($ in millions) 30+ & 90+ Delinquency Rates $94.7 $84.9 $82.0 $72.4 90-179 Days $60.5 $61.3 30-89 Days $49.5 $49.9 30+ DQ % $47.7 $42.8 90+ DQ % 1Q 20 2Q 20 3Q 20 4Q 20 1Q 21 2Q 21 3Q 21 4Q 21 1Q 22 2Q 22 30+ DQ Sequential Δ (0.4%) (1.8%) (0.1%) 0.6% (1.0%) (0.7%) 1.1% 1.3% (0.3%) 0.5% YoY Δ (0.3%) (1.5%) (1.8%) (1.7%) (2.3%) (1.2%)—0.7% 1.4% 2.6% Δ from 2019 (2.6%) (2.7%) (1.8%) (1.0%) (1.2%) (0.1%) 90+ DQ Sequential Δ 0.1% (0.8%) (0.2%) 0.2%—(0.8%) 0.4% 0.7% 0.5% (0.4%) YoY Δ (0.2%) (0.2%) (0.6%) (0.7%) (0.8%) (0.8%) (0.2%) 0.3% 0.8% 1.2% Δ from 2019 (1.0%) (1.0%) (0.8%) (0.4%) (0.2%) 0.2% Net Credit Loss Rates 10.5% 10.6% 10.0% 8.7% 7.8% 7.7% 7.4% 6.9% 6.4% 5.0% Annualized % of ANR 1Q 20 2Q 20 3Q 20 4Q 20 1Q 21 2Q 21 3Q 21 4Q 21 1Q 22 2Q 22 Sequential Δ 1.5% 0.1% (2.8%) (0.9%) 0.8% (0.3%) (2.4%) 1.4% 2.3% 1.3% YoY Δ (0.2%) 0.2% (0.3%) (2.1%) (2.8%) (3.2%) (2.8%) (0.5%) 1.0% 2.6% Δ from 2019 (3.0%) (3.0%) (3.1%) (2.6%) (2.0%) (0.4%) Net credit loss rate above includes: System Outage 0.3% — — — — — — — — - 30+ days past due of 6.2% is 50 basis points higher than 1Q 22 and still 10 basis points lower than pre-pandemic levels in 2Q 19 • 30+ days past due of $94.7 million compares favorably to loan loss reserves of $167.5 million as of June 30, 2022 2Q 22 net credit loss rate of 10.0% is 130 basis points higher than 1Q 22 and 40 basis points lower than the pre-pandemic level of 10.4% in 2Q 19 2Q 22 net credit loss rate of 10.0% included a 90 basis point impact from two high APR segments with profitable net credit margins REGIONAL MANAGEMENT 27
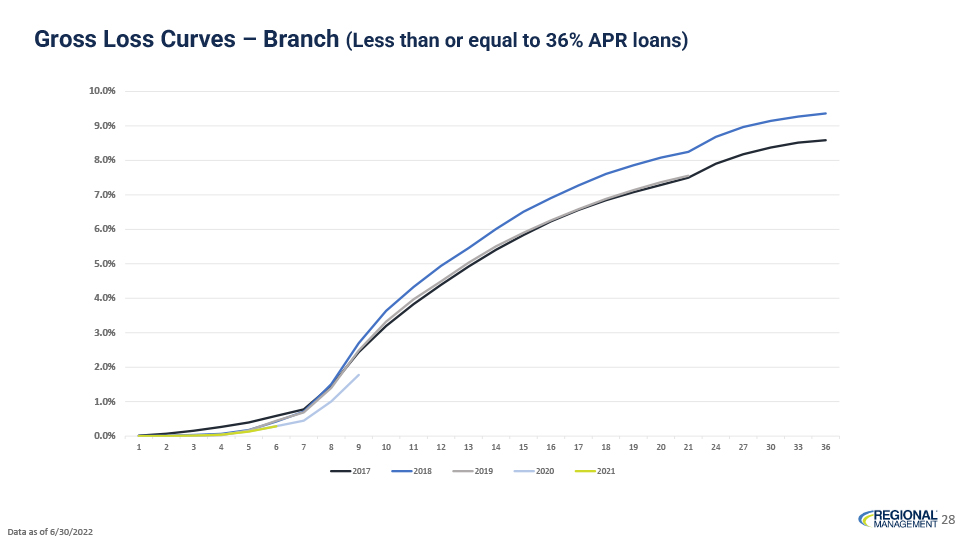
Gross Loss Curves – Branch (Less than or equal to 36% APR loans) 10.0% 9.0% 8.0% 7.0% 6.0% 5.0% 4.0% 3.0% 2.0% 1.0% 0.0% 1 2 3 4 5 6 7 8 9 10 11 12 13 14 15 16 17 18 19 20 21 24 27 30 33 36 2017 2018 2019 2020 2021 REGIONAL MANAGEMENT 28 Data as of 6/30/2022
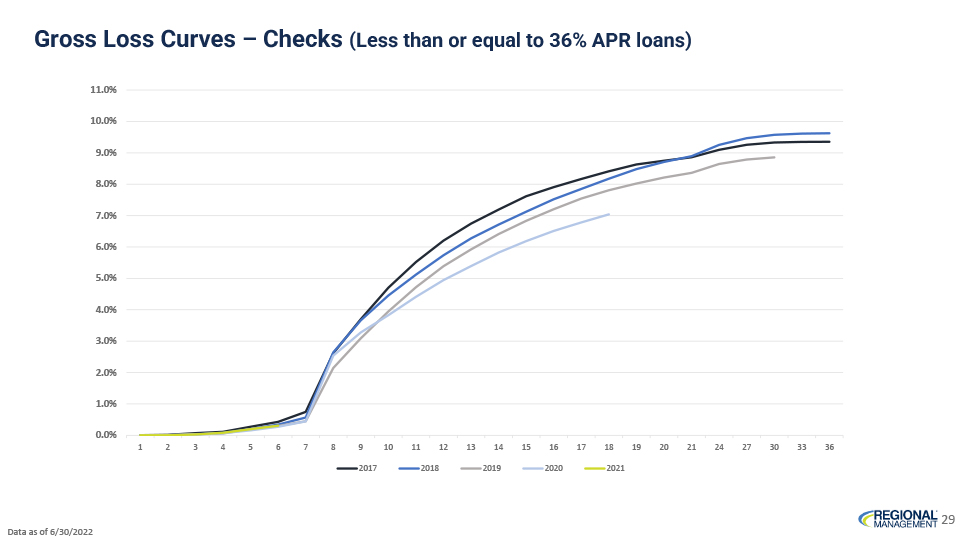
Gross Loss Curves – Checks (Less than or equal to 36% APR loans) 11.0% 10.0% 9.0% 8.0% 7.0% 6.0% 5.0% 4.0% 3.0% 2.0% 1.0% 0.0% 1 2 3 4 5 6 7 8 9 10 11 12 13 14 15 16 17 18 19 20 21 24 27 30 33 36 2017 2018 2019 2020 2021 REGIONAL MANAGEMENT 29 Data as of 6/30/2022
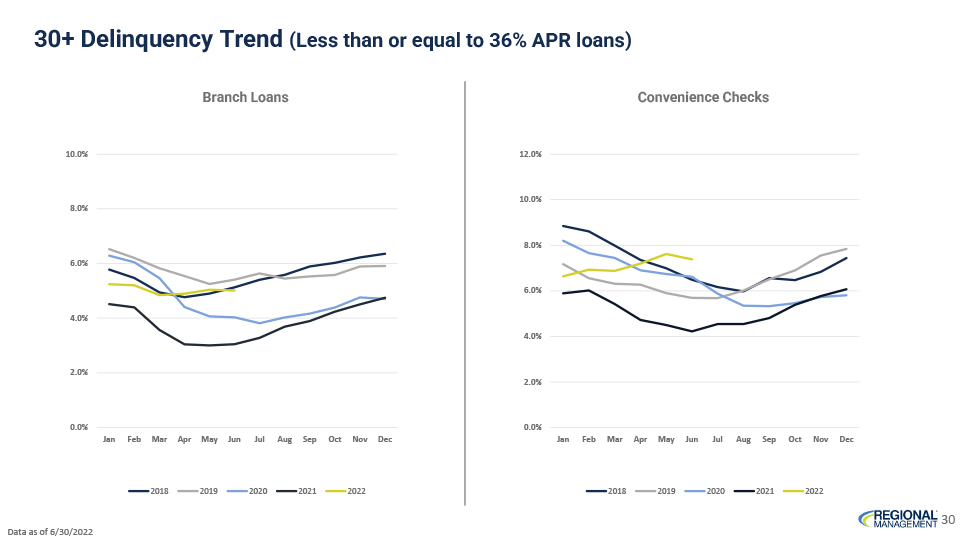
30+ Delinquency Trend (Less than or equal to 36% APR loans) Branch Loans Convenience Checks 10.0% 12.0% 10.0% 8.0% 8.0% 6.0% 6.0% 4.0% 4.0% 2.0% 2.0% 0.0% 0.0% Jan Feb Mar Apr May Jun Jul Aug Sep Oct Nov Dec Jan Feb Mar Apr May Jun Jul Aug Sep Oct Nov Dec 2018 2019 2020 2021 2022 2018 2019 2020 2021 2022 REGIONAL MANAGEMENT 30 Data as of 6/30/2022
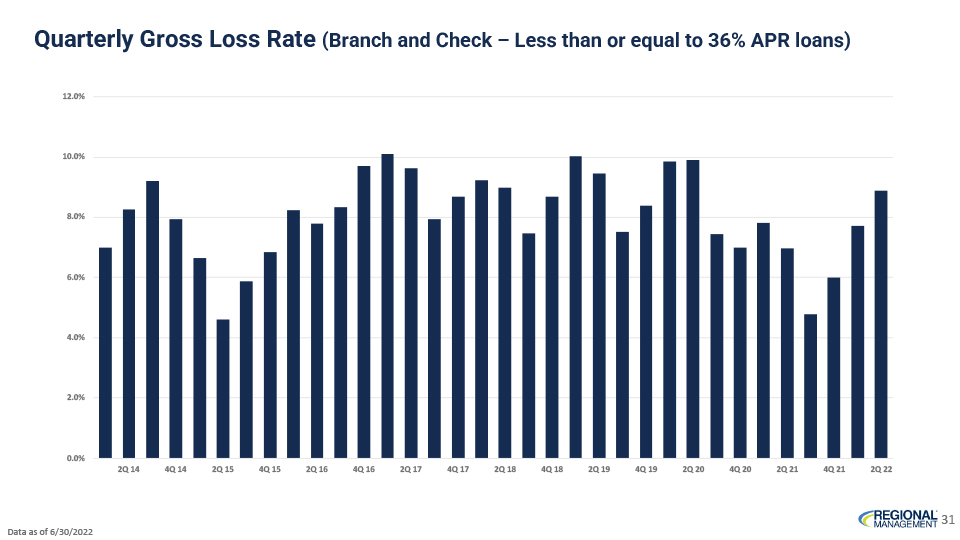
Quarterly Gross Loss Rate (Branch and Check – Less than or equal to 36% APR loans) 12.0% 10.0% 8.0% 6.0% 4.0% 2.0% 0.0% 2Q 14 4Q 14 2Q 15 4Q 15 2Q 16 4Q 16 2Q 17 4Q 17 2Q 18 4Q 18 2Q 19 4Q 19 2Q 20 4Q 20 2Q 21 4Q 21 2Q 22 REGIONAL MANAGEMENT 31 Data as of 6/30/2022
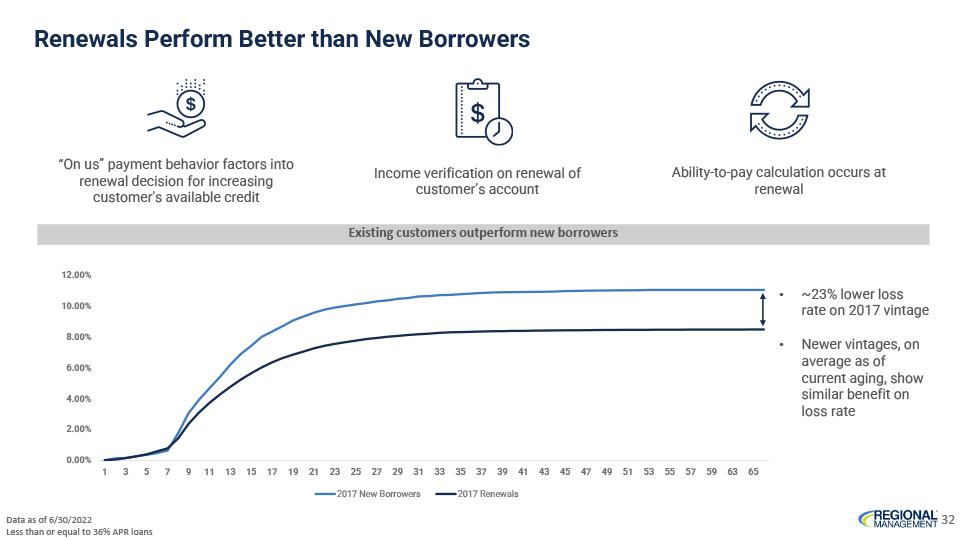
Renewals Perform Better than New Borrowers “On us” payment behavior factors into Income verification on renewal of Ability-to-pay calculation occurs at renewal decision for increasing customer’s account renewal customer’s available credit Existing customers outperform new borrowers 12.00% • ~23% lo wer loss 10.00% rate on 2017 vintage 8.00% • Newer vinta ges, on average as of 6.00% current aging, show 4.00% similar benefit on loss rate 2.00% 0.00% 1 3 5 7 9 11 13 15 17 19 21 23 25 27 29 31 33 35 37 39 41 43 45 47 49 51 53 55 57 59 63 65 2017 New Borrowers 2017 Renewals REGIONAL MANAGEMENT 32 Data as of 6/30/2022 Less than or equal to 36% APR loans

Appendix
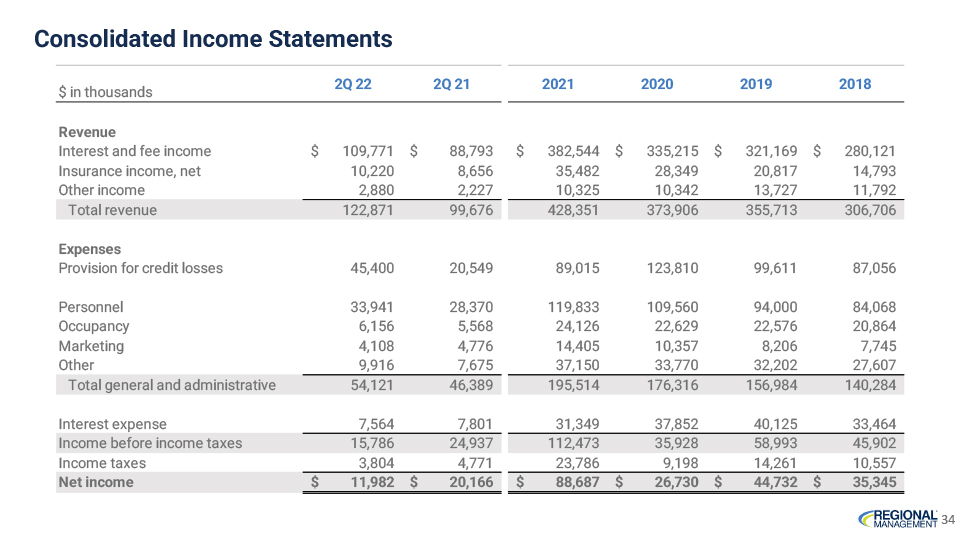
Consolidated Income Statements 2Q 22 2Q 21 2021 2020 2019 2018 $ in thousands Revenue Interest and fee income $ 109,771 $ 88,793 $ 382,544 $ 335,215 $ 321,169 $ 280,121 Insurance income, net 10,220 8,656 35,482 28,349 20,817 14,793 Other income 2,880 2,227 10,325 10,342 13,727 11,792 Total revenue 122,871 99,676 428,351 373,906 355,713 306,706 Expenses Provision for credit losses 45,400 20,549 89,015 123,810 99,611 87,056 Personnel 33,941 28,370 119,833 109,560 94,000 84,068 Occupancy 6,156 5,568 24,126 22,629 22,576 20,864 Marketing 4,108 4,776 14,405 10,357 8,206 7,745 Other 9,916 7,675 37,150 33,770 32,202 27,607 Total general and administrative 54,121 46,389 195,514 176,316 156,984 140,284 Interest expense 7,564 7,801 31,349 37,852 40,125 33,464 Income before income taxes 15,786 24,937 112,473 35,928 58,993 45,902 Income taxes 3,804 4,771 23,786 9,198 14,261 10,557 Net income $ 11,982 $ 20,166 $ 88,687 $ 26,730 $ 44,732 $ 35,345 REGIONAL MANAGEMENT 34
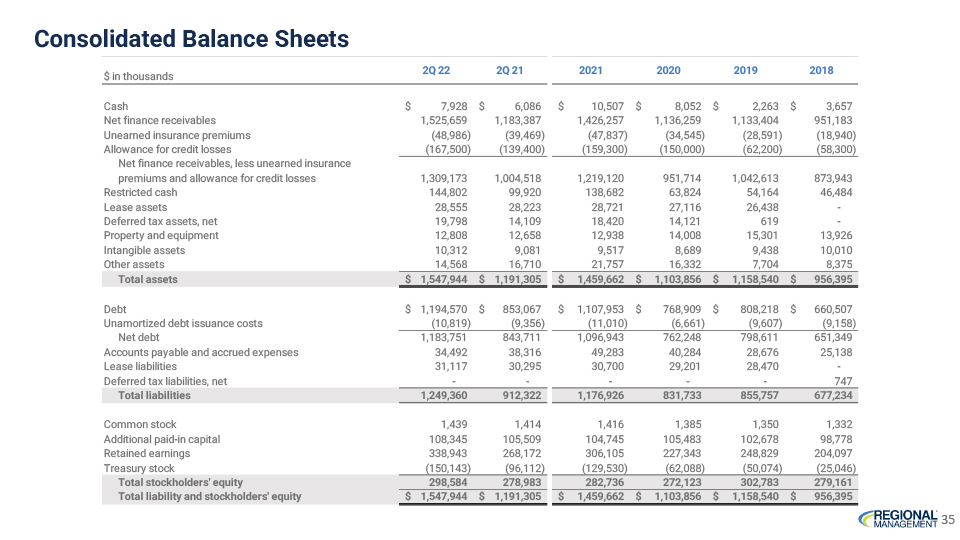
Consolidated Balance Sheets 2Q 22 2Q 21 2021 2020 2019 2018 $ in thousands Cash $ 7,928 $ 6,086 $ 10,507 $ 8,052 $ 2,263 $ 3,657 Net finance receivables 1,525,659 1,183,387 1,426,257 1,136,259 1,133,404 951,183 Unearned insurance premiums (48,986) (39,469) (47,837) (34,545) (28,591) (18,940) Allowance for credit losses (167,500) (139,400) (159,300) (150,000) (62,200) (58,300) Net finance receivables, less unearned insurance premiums and allowance for credit losses 1,309,173 1,004,518 1,219,120 951,714 1,042,613 873,943 Restricted cash 144,802 99,920 138,682 63,824 54,164 46,484 Lease assets 28,555 28,223 28,721 27,116 26,438 -Deferred tax assets, net 19,798 14,109 18,420 14,121 619 -Property and equipment 12,808 12,658 12,938 14,008 15,301 13,926 Intangible assets 10,312 9,081 9,517 8,689 9,438 10,010 Other assets 14,568 16,710 21,757 16,332 7,704 8,375 Total assets $1,547,944 $1,191,305 $ 1,459,662 $ 1,103,856 $ 1,158,540 $ 956,395 Debt $1,194,570 $ 853,067 $ 1,107,953 $ 768,909 $ 808,218 $ 660,507 Unamortized debt issuance costs (10,819) (9,356) (11,010) (6,661) (9,607) (9,158) Net debt 1,183,751 843,711 1,096,943 762,248 798,611 651,349 Accounts payable and accrued expenses 34,492 38,316 49,283 40,284 28,676 25,138 Lease liabilities 31,117 30,295 30,700 29,201 28,470 -Deferred tax liabilities, net — — — — — 747 Total liabilities 1,249,360 912,322 1,176,926 831,733 855,757 677,234 Common stock 1,439 1,414 1,416 1,385 1,350 1,332 Additional paid-in capital 108,345 105,509 104,745 105,483 102,678 98,778 Retained earnings 338,943 268,172 306,105 227,343 248,829 204,097 Treasury stock (150,143) (96,112) (129,530) (62,088) (50,074) (25,046) Total stockholders’ equity 298,584 278,983 282,736 272,123 302,783 279,161 Total liability and stockholders’ equity $1,547,944 $1,191,305 $ 1,459,662 $ 1,103,856 $ 1,158,540 $ 956,395 REGIONAL MANAGEMENT 35
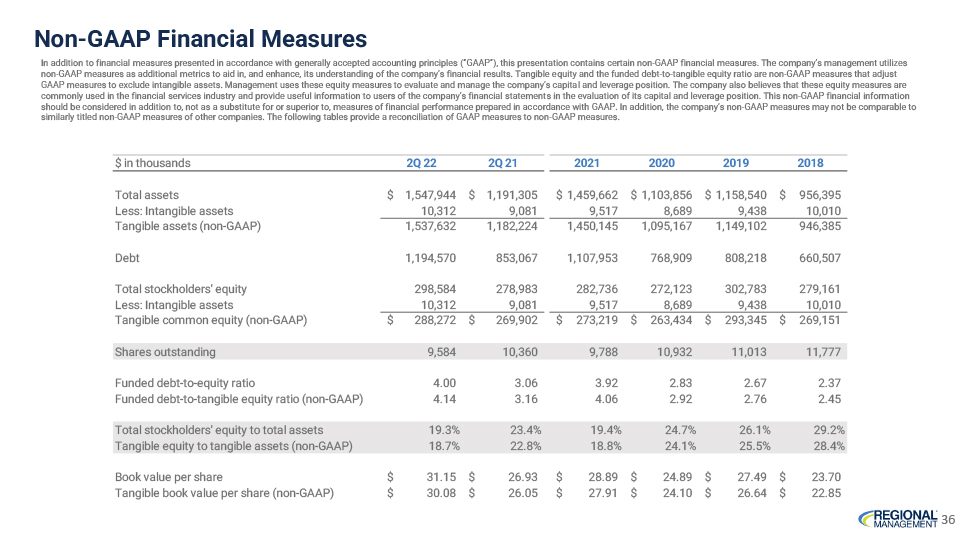
Non-GAAP Financial Measures In addition to financial measures presented in accordance with generally accepted accounting principles (“GAAP”), this presentation contains certain non-GAAP financial measures. The company’s management utilizes non-GAAP measures as additional metrics to aid in, and enhance, its understanding of the company’s financial results. Tangible equity and the funded debt-to-tangible equity ratio are non-GAAP measures that adjust GAAP measures to exclude intangible assets. Management uses these equity measures to evaluate and manage the company’s capital and leverage position. The company also believes that these equity measures are commonly used in the financial services industry and provide useful information to users of the company’s financial statements in the evaluation of its capital and leverage position. This non-GAAP financial information should be considered in addition to, not as a substitute for or superior to, measures of financial performance prepared in accordance with GAAP. In addition, the company’s non-GAAP measures may not be comparable to similarly titled non-GAAP measures of other companies. The following tables provide a reconciliation of GAAP measures to non-GAAP measures. $ in thousands 2Q 22 2Q 21 2021 2020 2019 2018 Total assets $1,547,944 $1,191,305 $ 1,459,662 $ 1,103,856 $ 1,158,540 $ 956,395 Less: Intangible assets 10,312 9,081 9,517 8,689 9,438 10,010 Tangible assets (non-GAAP) 1,537,632 1,182,2241,450,1451,095,1671,149,102 946,385 Debt 1,194,570 853,0671,107,953 768,909 808,218 660,507 Total stockholders’ equity 298,584 278,983 282,736 272,123 302,783 279,161 Less: Intangible assets 10,312 9,081 9,517 8,689 9,438 10,010 Tangible common equity (non-GAAP) $ 288,272 $ 269,902 $ 273,219 $ 263,434 $ 293,345 $ 269,151 Shares outstanding 9,584 10,360 9,788 10,932 11,013 11,777 Funded debt-to-equity ratio 4.00 3.06 3.92 2.83 2.67 2.37 Funded debt-to-tangible equity ratio (non-GAAP) 4.14 3.16 4.06 2.92 2.76 2.45 Total stockholders’ equity to total assets 19.3% 23.4% 19.4% 24.7% 26.1% 29.2% Tangible equity to tangible assets (non-GAAP) 18.7% 22.8% 18.8% 24.1% 25.5% 28.4% Book value per share $ 31.15 $ 26.93 $ 28.89 $ 24.89 $ 27.49 $ 23.70 Tangible book value per share (non-GAAP) $ 30.08 $ 26.05 $ 27.91 $ 24.10 $ 26.64 $ 22.85 REGIONAL MANAGEMENT 36
REGIONAL MANAGEMENT NYSE RM LISTED