 Exhibit 99.1 February 2014 |
 CORE GROWTH Creating value by leveraging our structural competitive advantages to gain share and drive profitable growth in a recovering market INCREMENTAL GROWTH utilizing our strong balance sheet and cash flow Creating incremental value by |
 A Solid Foundation to Maximize Long-Term Shareholder Value 3 Maximizing Long-Term Value Incremental Growth Creating incremental value by utilizing our strong balance sheet and cash flow Core Growth Creating value by leveraging our structural competitive advantages to gain share and drive profitable growth in a recovering market Solid Business Model Structural competitive advantages Attractive product categories Operational/management excellence Demonstrated market outperformance Strong capital structure Consumer-driven innovation |
 Strong capital structure Demonstrated market outperformance Operational excellence Consumer driven innovation Solid Business Model 4 Attractive product categories Consumer involved in purchase Keeps product lines fresh and on trend – exciting consumers Creates industry leading performance across the business Consistent share gains across business over 25 years and through multiple cycles Low leverage and strong cash flow creates flexibility for incremental growth Structural competitive advantages Drives outsized growth and share gains in a recovering market |
 CORE GROWTH Creating value by leveraging our structural competitive advantages to gain share and drive profitable growth in a recovering market |
 Fortune Brands Home & Security 2013 Sales: $4.2B 6 Kitchen & Bath Cabinetry Plumbing & Accessories Windows & Door Systems Security & Storage 7.3% Operating Margin 1 Brand Leadership #1 #1 Kitchen & bath residential cabinet manufacturer in North America Faucet brand in North America Ranked highest in customer satisfaction with Windows and Doors, 4 years in a row.* #1 Fiberglass residential entry door brand in U.S. among builders and remodelers.* Padlock brand in North America *Refer to Reference page for source(s) #1 Net Sales 17.8% 2.4% 15.8% $1.6B $1.3B $0.7B $0.6B 1 Before Charges/Gains |
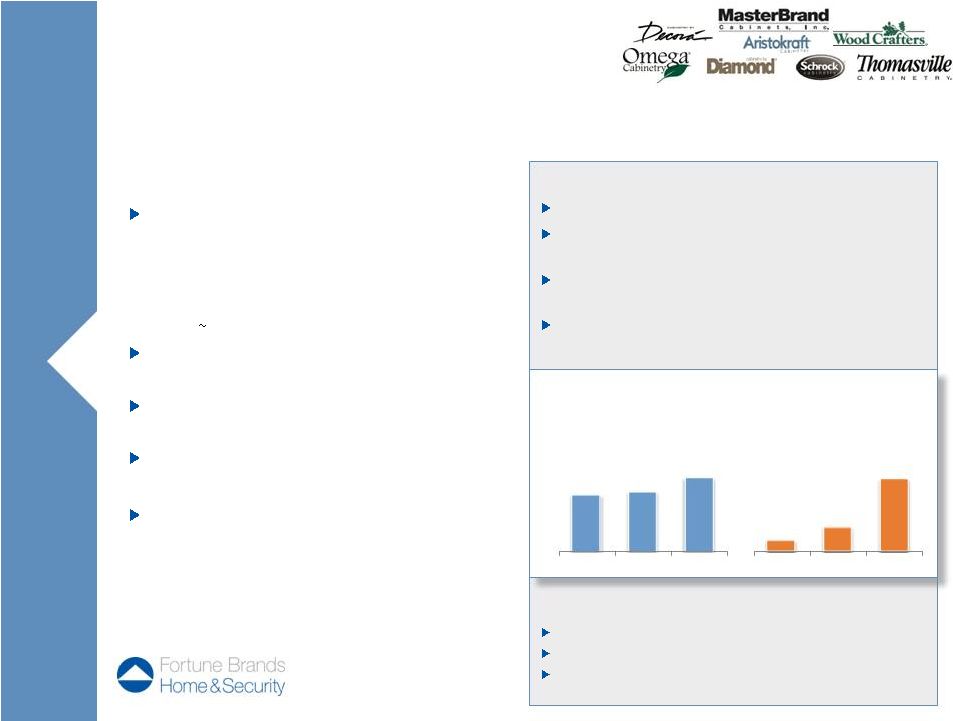 7 Benefits of Competitive Advantages Leading North American market share and growing Largest and growing share in critical dealer channel and continuing strong home center presence Increased market share 500 basis points over the last 5 years and captured overall #1 position Market leadership allows disciplined focus on profitable growth Performance – First Phase COMPETITIVE ADVANTAGES Regional supply chain and service footprint provides dealers with more local production and prompt service • Dealers represent more than 50% of the market with local manufacturers supplying 50% of the market Multiple brands allow designers and retailers to offer unique brands Efficient tools that allow designers to move customers across brands World-class service and trusted quality • Must meet designer and customer needs Consistent flow of consumer focused innovation – Approximately 30% of 2013 sales from products introduced over the past 3 years. • Innovation builds demand by exciting consumers Kitchen & Bath Cabinetry Largest and most profitable North American cabinet business well-positioned to continue to gain share and drive profitable growth Growth Potential – Next Phase Sales $2+ billion Growing North American market share Operating margins return to 14% 1 Operating Income Before Charges/Gains $1.3 $1.3 $1.6 '11 '12 '13 NET SALES ($ in Billions) $18 $40 '11 '12 '13 PROFIT 1 ($ in Millions) $121 |
 8 Growth Potential – Next Phase Benefits of Competitive Advantages Leading market share in North America and growing Growing international business and global brand recognition COMPETITIVE ADVANTAGES Exclusive national, multi-year contracts with majority of largest builders • Large builders purchase through wholesalers Large embedded base of Moen faucets in North America • Embedded base from years of category leadership drives repair & remodel back to brand Consistent flow of consumer focused innovation – 24% of 2013 sales from products introduced in the last 3 years Flexible global supply chain Strong and growing brand in China – built organically over time Plumbing & Accessories North American market share leader well-positioned to gain share and drive profitable growth Performance – First Phase 1 Operating Income Before Charges/Gains NET SALES ($ in Billions) PROFIT 1 ($ in Millions) $0.96 $1.1 $1.3 '11 '12 '13 $138 $169 $230 '11 '12 '13 Double digit sales growth with continued share gains Operating margins in high teens Larger international business in China and emerging markets |
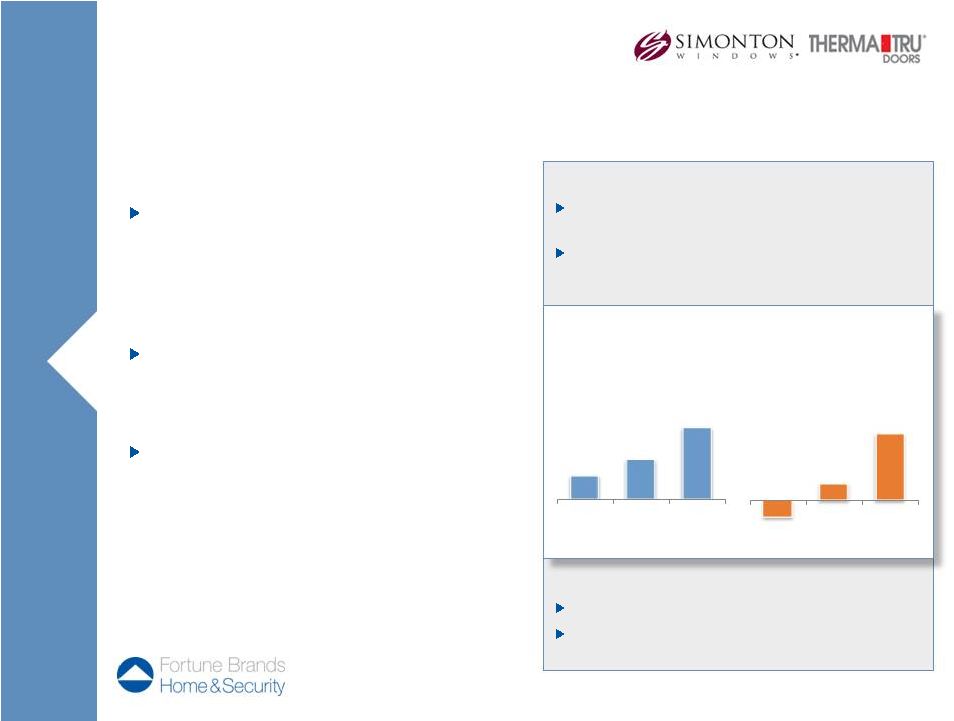 Benefits of Competitive Advantages Therma-Tru is the leading fiberglass entry door brand in North America and growing Simonton is ranked highest in consumer and trade satisfaction by J.D. Powers Growth Potential – Next Phase Mid-teens sales growth Return to double digit operating margins COMPETITIVE ADVANTAGES Innovative fiberglass material leadership • Fiberglass is the fasting growing segment of the entry door market • Continued stream of innovation in door styles, finishes, and decorative glass designs Best fabricator network and full entry door system approach • Fabricators add value by assembling and installing the entry door system Most dependable lead times for replacement vinyl windows • Fragmented industry requires product differentiation Windows & Doors Leader in fiberglass entry doors and best lead times in vinyl window industry 9 Performance – First Phase 1 Operating Income Before Charges/Gains $553 $587 $658 '11 '12 '13 NET SALES ($ in Millions) $(4) $4 $16 '11 '12 '13 PROFIT 1 ($ in Millions) |
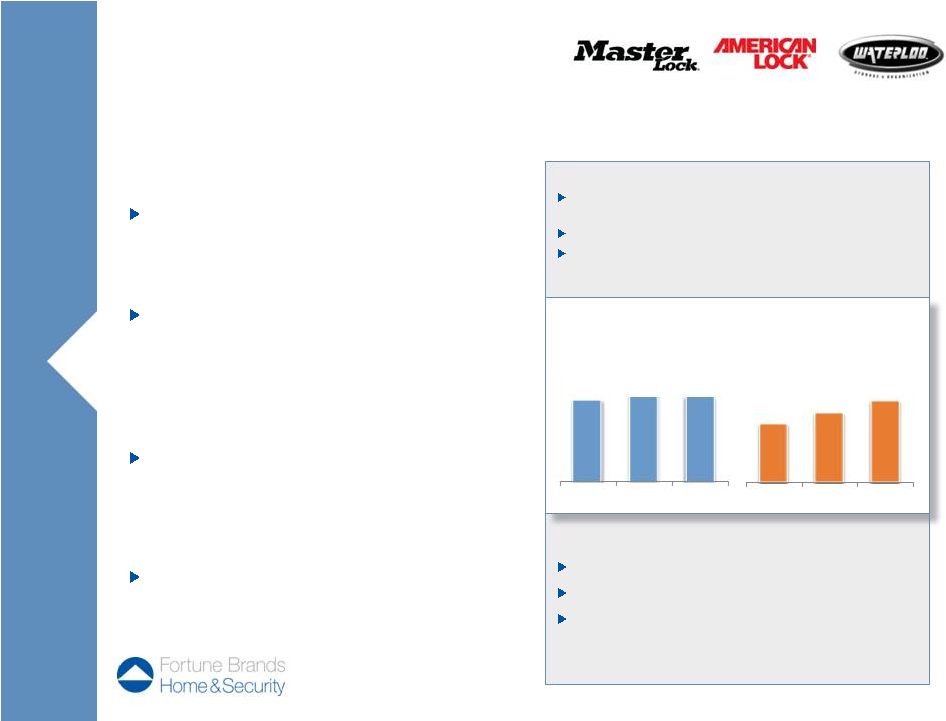 Benefits of Competitive Advantages Master Lock holds leading market share of domestic retail padlocks Broad distribution in both retail and commercial Growing international sales through multiple channels COMPETITIVE ADVANTAGES Master Lock has leading brand awareness and strong global brand recognition • Brands drive the majority of retail sales Consistent flow of consumer focused innovation – 23% of 2013 segment sales from products introduced over the past three years • Innovation drives demand and refreshes the category Recently developed commercial electronic locking capabilities and solutions • Growing demand for electronic locking solutions Flexible global supply chain Security & Storage Master Lock is an iconic brand with strong market share and significant potential to leverage the brand to expand globally 10 Performance – First Phase Growth Potential – Next Phase Double digit growth for security products Larger and growing international business Growing electronic solutions become a meaningful portion of business $577 1 Operating Income Before Charges/Gains $570 '11 '12 '13 NET SALES ($ in Millions) $557 $63 $74 $90 '11 '12 '13 PROFIT 1 ($ in Millions) |
 Market Outlook 11 We have come through a historic downturn but still have a long way to go to return to the long-term average housing starts – driven by household formations and demolitions. Source: U.S. Census Bureau and internal company data |
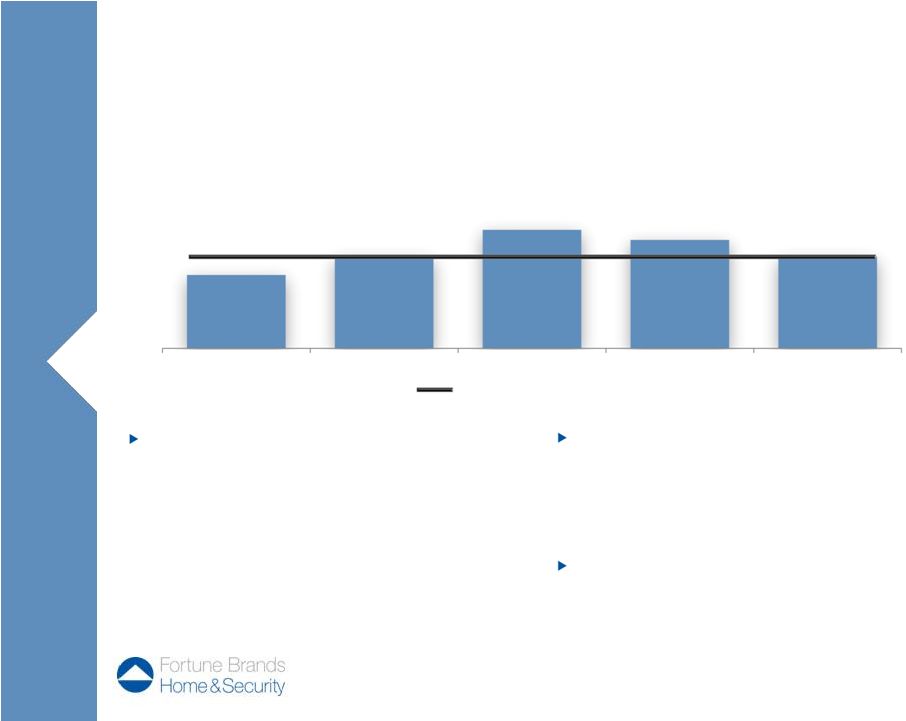 Consumers’ confidence also drives willingness to invest in their homes • Employment • Home prices are improving • Access to credit FBHS is well-positioned to capture R&R market growth • Two thirds of FBHS home segments’ sales are driven by R&R • Leading share of the cabinet dealer channel • Large embedded base of Moen faucets Pent-up demand has developed • From 2007 – 2012 R&R growth was significantly below the long-term historical average, even negative for a period • Early in the recovery big-ticket projects lagged even further, as expected • The median age of homes in the U.S. has increased and is now 40 years • Homes built during 1996-2006 are entering a remodel period Market Outlook In addition to public data, we receive unique insight to current R&R market trends from our leading position in the Kitchen & Bath dealer channel 12 Repair & Remodel (“R&R”) Long-term Historical Average 7% 6-7% 5-6% 5-6% 4-5% 2012 2013E 2014E 2015E 2016E |
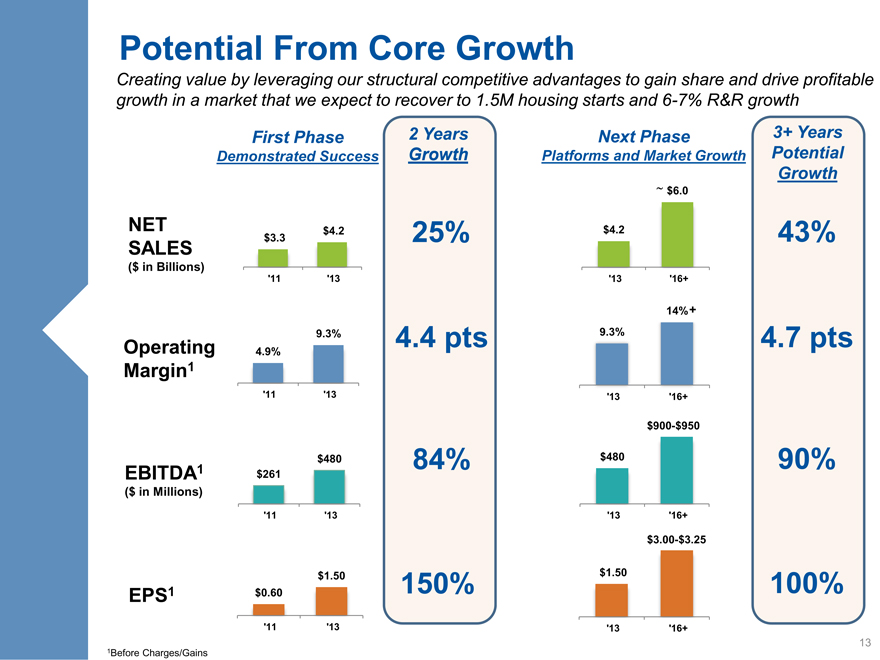
Potential From Core Growth
Creating value by leveraging our structural competitive advantages to gain share and drive profitable growth in a market that we expect to recover to 1.5M housing starts and 6-7% R&R growth
First Phase 2 Years
Demonstrated Success Growth
NET $3.3 $4.2 25%
SALES
($ in Billions)
‘11 ‘13
9.3% 4.4 pts
Operating 4.9%
Margin1
‘11 ‘13
$480 84%
EBITDA1 $261
($ in Millions)
‘11 ‘13
$1.50 150%
EPS1 $0.60
‘11 ‘13
Next Phase 3+ Years
Platforms and Market Growth Potential
Growth
$6.0
$4.2 43%
‘13 ‘16+
14% +
9.3% 4.7 pts
‘13 ‘16+
$900-$950
$480 90%
‘13 ‘16+
$3.00-$3.25
$1.50 100%
‘13 ‘16+
1Before Charges/Gains
13
 INCREMENTAL GROWTH Creating incremental value by utilizing our strong balance sheet and cash flow |
 Incremental Growth Opportunities Over the next 3+ years, the combination of free cash flow and reasonable 3+ Years Outlook ($ in Billions) EBITDA EBITDA $1.0 $1.8 $2.8 Cumulative Free Cash Flow Balance Sheet Leverage Cash Available to Drive Incremental Value 2.0x 1.5x 15 debt leverage could create $2.8 billion of available cash + |
 Capital Allocation Acquisitions • Expand in current categories or adjacent categories globally • Evaluate new, complementary categories • Enhanced internal capabilities to execute acquisitions Dividend reflects Board’s confidence in performance and long-term cash flow • Potential to increase dividend independent of other uses of cash • Less than 30% payout ratio • Should not limit growth prospects Share repurchase • Repurchased $61 million of FBHS shares through 2013 Efficient cash management providing maximum flexibility to leverage cash and a strong balance sheet for acquisitions, expansion into new markets and adjacent categories, and return cash to shareholders 16 |
 Next Phase – Leverage the Model Continue to leverage structural competitive advantages, brand building and consumer driven innovation to gain market share Accelerate investment in market expansion Multiple Growth Opportunities Initially, the economic recovery will drive significant organic growth. Beyond the recovery, product innovations, market expansions and acquisitions will accelerate growth as cash and a strong balance sheet are leveraged to create value. Time First Phase Next Phase 17 Beyond Before Charges/Gains Improved Financial Performance • Increased net sales 25% to over $4B First Phase – Proved the Model Further Strengthened Balance Sheet • EBITDA grew 84% and EPS was up 150% • Reduced Net Debt/EBITDA to nearly ZERO Deployed Capital • Initiated 10¢ quarterly dividend, increased to 12¢ for 2014 • Acquired WoodCrafters for $300M • Repurchased $61M of shares Strengthened Organization • Aligned management compensation to drive shareholder value through an increased focus on equity compensation • Brought in proven, experienced talent for key leadership roles • Enhanced strategy and corporate development team to help drive the next phase of growth Expand capacity to capture growth 1 1 Return cash to shareholders through dividends and share repurchases Acquire to expand in current and new complementary categories globally 1 |
 2014 Guidance Based on more than two years of strong and improving performance and continued confidence in the home products market recovery, FBHS expects the following performance for full-year 2014 results: 2013 Actual 2014 Guidance U.S. Home Products Market 10% +10-11% Net Sales $4.2B +11-13% EPS 1 $1.50 $1.91 - $2.01 1 Before Charges/Gains 18 |
 Disclaimer 19 This presentation contains certain “forward-looking statements” regarding business strategies, market potential, future financial performance and other matters, including all statements with respect to the "Next Phase" and "guidance" and statements with words such as "will," "should," "could," "expects," "potential" or "projected." Where, in any forward-looking statement, we express an expectation or belief as to future results or events, such expectation or belief is based on the current plans and expectations at the time this presentation. Although we believe that these statements are based on reasonable assumptions, they are subject to numerous factors, risks and uncertainties that could cause actual outcomes and results to be materially different from those indicated in such statements, including the risks described in our Annual Report on Form 10-K as filed with the Securities and Exchange Commission. Except as required by law, we undertake no obligation to update or revise any forward-looking statements to reflect changed assumptions, the occurrence of anticipated or unanticipated events, new information or changes to future results over time or otherwise. This presentation includes financial measures, including EBITDA before charges/gains, EBITDA margin before charges/gains, operating income before charges/gains, operating margin before charges/gains, unlevered free cash flow, and diluted EPS before charges/gains, that are derived on the basis of methodologies other than in accordance with U.S. generally accepted accounting principles (GAAP). We offer these measures to assist investors in assessing our financial performance and liquidity under GAAP, but investors should not rely on these measures as a substitute for any GAAP measure, including net income or operating income. In addition, these measures may be inconsistent with similarly titled measures presented by other companies. For more information, including reconciliations of these non-GAAP financial measures to the most comparable GAAP measures, please visit the “Investor Center” section of the Company’s website at www.FBHS.com. |
 Appendix CORE GROWTH Creating value by leveraging our structural competitive advantages to gain share and drive profitable growth in a recovering market INCREMENTAL GROWTH Creating incremental value by and strong balance sheet utilizing our cash flow |
 Balanced & Diverse Business Mix 21 *Source: Internal company data for year ended December 31, 2013 Repair & Remodel 46% New Construction 22% Security & Storage 11% Commercial 5% International 16% By End Market* Home Centers 29% Wholesale 29% Dealers 15% Other Retail 7% Builder Direct 4% International 16% By Channel* Repair & Remodel 68% Domestic Home Products Market* New Construction 32% Our business mix is driven by Repair and Remodel International is 16% of net sales, Canada is 10% and China is 4% |
 Fiscal Year Ending December 31 2006 2009 2011 2012 2013 Net Sales $4,694 $3,007 $3,329 $3,591 $4,157 % Growth vs. Prior Year 13% (20%) 3% 8% 16% Operating Income 1 $ 678 $ 81 $ 163 $ 228 $ 388 % Operating Margin 1 14% 3% 5% 6% 9% EBITDA 1 $ 826 $ 195 $ 261 $ 321 $ 480 % EBITDA Margin 1 18% 6% 8% 9% 12% Unlevered Free Cash Flow 2 $ 464 $ 280 $ 130 $ 331 $ 259 Since 2009, we have restructured, recovered, and are moving forward towards earnings and cash flow growth 22 ($ millions) 1 Before Charges/Gains; ² Including incremental standalone corporate expenses for periods prior to the spin-off from Fortune Brands, Inc. |
References 23 Page 7: Brand Use Studies, 2013 Builder and 2013 Remodeling Magazines Page 7: Simonton Windows received the highest numerical score among window and door manufacturers in in 2013). 2013 study based on responses from 2,554 consumers measuring 11 brands and measures opinions of consumers who purchased new windows or patio doors in the previous 12 months. Proprietary study results are based on experiences and perceptions of consumers surveyed in January – February 2013. Your experiences may vary. Visit: SM www.JDPower.com . a tie in the proprietary J.D. Power 2010-2013 Windows and Patio Doors Satisfaction Studies (Tied |