![]() Investor Presentation March 2012 Exhibit 99.1 |
![]() 1 Forward-Looking Statements This presentation and statements made by representatives of Matador Resources Company (“Matador” or the “Company”) during the course of this presentation include “forward-looking statements” within the meaning of Section 27A of the Securities Act of 1933, as amended, and Section 21E of the Securities Exchange Act of 1934, as amended. “Forward-looking statements” are statements related to future, not past, events. Forward-looking statements are based on current expectations and include any statement that does not directly relate to a current or historical fact. In this context, forward-looking statements often address expected future business and financial performance, and often contain words such as “could,” “believe,” “would,” “anticipate,” “intend,” “estimate,” “expect,” “may,” “should,” “continue,” “plan,” “predict,” “potential,” “project” and similar expressions that are intended to identify forward-looking statements, although not all forward-looking statements contain such identifying words. Actual results and future events could differ materially from those anticipated in such statements. These forward-looking statements involve certain risks and uncertainties and ultimately may not prove to be accurate, including, but not limited to, the following risks related to our financial and operational performance: general economic conditions; our ability to execute our business plan, including the success of our drilling program; changes in oil, natural gas and natural gas liquids prices and the demand for oil, natural gas and natural gas liquids; our ability to replace reserves and efficiently develop our current reserves; our costs of operations, delays and other difficulties related to producing oil, natural gas and natural gas liquids; our ability to make acquisitions on economically acceptable terms; availability of sufficient capital to execute our business plan, including from our future cash flows, increases in our borrowing base and otherwise; weather and environmental conditions; and other important factors which could cause actual results to differ materially from those anticipated or implied in the forward-looking statements. For further discussions of risks and uncertainties, you should refer to Matador’s SEC filings, including the “Risk Factors” section of Matador’s Prospectus dated February 1, 2012. Matador undertakes no obligation and does not intend to update these forward-looking statements to reflect events or circumstances occurring after the date of this presentation, except as required by law. You are cautioned not to place undue reliance on these forward-looking statements, which speak only as of the date of this presentation. All forward-looking statements are qualified in their entirety by this cautionary statement. |
![]() 2 Company Overview Completed IPO of 14,883,334 shares (12,209,167 primary) including overallotment at $12.00/share in March 2012 Exchange: Ticker NYSE: MTDR Shares Outstanding 55.27 million common shares Share Price as of March 20, 2012 $11.84/share Market Capitalization as of March 20, 2012 $654.4 million 2012 Guidance Summary 2012 Estimated Capital Spending $313 million 2012 Estimated Total Oil Production 1.4 to 1.5 million barrels 2012 Estimated Exit Rate for Oil Production 5,000 to 5,500 barrels per day 2012 Estimated Total Natural Gas Production 12.5 to 13.5 billion cubic feet |
![]() Founded by Joe Foran in 1983 Foran Oil funded with $270,000 in contributed capital from 17 friends and family members Rolled into Matador Petroleum Corporation in 1988 Grown primarily through acquire and exploit strategy Delivered 21% average annual rate of return over 15 years Sold to Tom Brown, Inc. (1) in June 2003 for an enterprise value of $388 million in an all- cash transaction Foran Oil & Matador Petroleum 3 Matador History Matador Resources Company Founded by Joe Foran in 2003 Attracted start-up capital from long-time shareholders; diverse and unique shareholder group including over 400 friends and neighbors Proven management, technical team and Board of Directors Grown entirely through drill bit, with focus on unconventional reservoir plays Strong growth since 2008 Daily production has increased over 4x (2) Adjusted EBITDA (3) has more than doubled (2) Proved reserves have increased 9x (4) Predecessor Entities (1) Tom Brown purchased by Encana in 2004 (2) Year ended December 31, 2011 compared to year ended December 31, 2008 (3) Adjusted EBITDA is a non-GAAP financial measure. For a definition of Adjusted EBITDA and a reconciliation of Adjusted EBITDA to our net income (loss) and net cash provided by operating activities, see slide 28 (4) At December 31, 2011 as compared to at December 31, 2008 Matador Today |
![]() 4 Daily Production (1) 55 MMcfe/d % Oil 33% Proved Reserves @ 12/31/11 193.2 Bcfe % Proved Developed 33.7% % Oil 12% (and growing) 2012E CapEx $313 million % Eagle Ford 84% % Oil and Liquids 94% 2012E Anticipated Drilling 29.5 net wells Eagle Ford / Austin Chalk 27.6 net wells Haynesville 1.5 net wells Gross Acreage (2) 236,263 acres Net Acreage (2) 197,764 acres Identified Drilling Locations (2) 818 gross / 313 net Eagle Ford / Austin Chalk (2) 213 gross / 173 net Haynesville / Cotton Valley (2) 605 gross / 140 net (1) Average daily production from March 1 to March 15, 2012 (2) As of September 30, 2011 Matador Resources Snapshot |
![]() 5 Investment Highlights Strong Growth Profile with Increasing Focus on Oil / Liquids Oil production up almost five-fold in 2011 and projected to increase nearly 10x in 2012 94% (1) of 2012E capital expenditure program focused on oil / liquids exploration and development High Quality Asset Base in Attractive Areas Eagle Ford provides immediate oil-weighted value and upside Other key assets provide long-term option value on natural gas, with Haynesville, Bossier and Cotton Valley assets all essentially HBP Significant Multi-year Drilling Inventory 173 net drilling locations across 28,900 net acres in Eagle Ford (157) and Austin Chalk (16) (2) 140 net drilling locations across 25,500 net acres in Haynesville (104) and Cotton Valley (36) (2) Strong Financial Position and Long-Term Institutional, Industry and Individual Shareholders Proven Management, Technical Team and Active Board of Directors Management averaging over 25 years of industry experience Board with extensive industry experience and expertise as well as significant company ownership Strong record of stewardship for over 28 years Low Cost Operations LOE for year ended December 31, 2011 was $0.47 per Mcfe, a 23% reduction since year end 2010 Active Exploration Effort Using Science and Technology Ongoing pipeline of new oil and natural gas opportunities, with strong emphasis on science and technology to create value (1) Calculated as percent of anticipated CapEx focused on oil weighted Eagle Ford and Austin Chalk drilling and acreage and includes $20 million to acquire oil prospective acreage in New Mexico and West Texas (2) As of September 30, 2011 |
![]() Leverage to Eagle Ford (Net Eagle Ford Acres / EV) (Net Acres / $mm) 6 Leading Eagle Ford Exposure Matador offers significant leverage and focus to the Eagle Ford Approximately 85% of Eagle Ford acreage is in the prospective oil and liquids window All 2012E Eagle Ford drilling focused in the prospective oil and liquids window 84% of 2012 estimated CapEx allocated to Eagle Ford One rig running in the eastern and one in the western portions of the Eagle Ford play Eagle Ford acreage well- positioned throughout the play Note: Reflects companies with greater than 50 Bcfe of proved reserves. Data sourced from public filings; stock price data as of 03/20/2012 2012E Capex % Eagle Ford 44.4 43.3 42.9 32.2 31.8 27.6 24.9 23.5 21.3 16.8 14.9 9.5 9.0 6.0 3.7 SFY MTDR NFX SM FST GDP PVA CRZO ROSE MHR CHK PXD APA PXP APC 84% 48% 34% N/A N/A N/A 78% 92% N/A N/A 62% 25% 73% 85% 5.2% |
![]() Highlights 7 Eagle Ford Properties are Well Positioned MTDR acreage in counties with robust transaction activity – “good neighborhoods” Transaction values ranging from $10,000 to $25,000 / acre Our Eagle Ford position has grown to almost 30,000 net acres Acreage in both the eastern and western areas of the play Approximately 85% of acreage in prospective oil and liquids windows Acreage offers potential for Austin Chalk, Buda, Olmos, Pearsall and other formations Note: Information for precedent transactions based on public filings Good reputation with land and mineral owners 80% of Eagle Ford acreage HBP or not burdened with lease expirations before 2013 COMBO LIQUIDS / GAS FAIRWAY DRY GAS FAIRWAY OIL FAIRWAY TALISMAN-STATOIL / SM ENERGY June 2011 $14,610 / acre SHELL / HARRISON RANCH March 2010 $10,000 / acre CNOOC / CHESAPEAKE October 2010 $11,011 / acre MARATHON / HILCORP June 2011 $24,823 / acre KKR / HILCORP June 2010 $10,000 / acre TALISMAN-STATOIL / ENDURING October 2010 $13,660 / acre RELIANT / PIONEER NEWPEK June 2010 $11,070 / acre PLAINS / HUGHES October 2010 $9,633 / acre TALISMAN / COMMON March 2010 $9,730 / acre HUNT / MARUBENI January 2012 +$20,000 / acre MITSUI / SM ENERGY June 2011 $18,846 / acre COMBO LIQUIDS / GAS FAIRWAY DRY GAS FAIRWAY OIL FAIRWAY TALISMAN-STATOIL / SM ENERGY June 2011 $14,610 / acre SHELL / HARRISON RANCH March 2010 $10,000 / acre CNOOC / CHESAPEAKE October 2010 $11,011 / acre MARATHON / HILCORP June 2011 $24,823 / acre KKR / HILCORP June 2010 $10,000 / acre TALISMAN-STATOIL / ENDURING October 2010 $13,660 / acre RELIANT / PIONEER NEWPEK June 2010 $11,070 / acre PLAINS / HUGHES October 2010 $9,633 / acre TALISMAN / COMMON March 2010 $9,730 / acre HUNT / MARUBENI January 2012 +$20,000 / acre MITSUI / SM ENERGY June 2011 $18,846 / acre |
![]() 8 Eagle Ford and Austin Chalk Properties COMBO LIQUIDS / GAS FAIRWAY DRY GAS FAIRWAY OIL FAIRWAY EOG OPERATED, MTDR WI = 21% 23,420 gross / 4,631 net acres Lewton #1H GLASSCOCK (WINN) RANCH 8,891 gross / 8,891 net acres Martin Ranch #1H, #2H, #3H, #5H EAGLE FORD WEST 13,472 gross / 10,510 net acres EAGLE FORD EAST 6,270 gross / 4,874 net acres EAGLE FORD ACREAGE TOTALS 52,053 gross / 28,906 net acres Affleck #1H JCM Jr. Minerals #1H COMBO LIQUIDS / GAS FAIRWAY DRY GAS FAIRWAY OIL FAIRWAY EOG OPERATED, MTDR WI = 21% 23,420 gross / 4,631 net acres Lewton #1H GLASSCOCK (WINN) RANCH 8,891 gross / 8,891 net acres Martin Ranch #1H, #2H, #3H, #5H EAGLE FORD WEST 13,472 gross / 10,510 net acres EAGLE FORD EAST 6,270 gross / 4,874 net acres EAGLE FORD ACREAGE TOTALS 52,053 gross / 28,906 net acres Affleck #1H JCM Jr. Minerals #1H Note: All acreage values are as of September 30, 2011 |
![]() 9 Eagle Ford and Austin Chalk Overview Acreage positioned in some of the most active counties for Eagle Ford and Austin Chalk (including “Chalkleford”) Two rigs running, primarily focused on oil and liquids Eleven operated wells drilled, completed and producing; Four additional operated wells in completion phase 94% (5) of 2012E capital expenditure program focused on oil / liquids exploration and development Drilling locations are based on 120 acre spacing Anticipate oil production to constitute approx. 35-40% of our total production volume and oil revenues to constitute approx. 75-80% of our total oil and natural gas revenues in 2012 Proved Reserves @ 12/31/11 4.7 MMBoe % Proved Developed 37.9% % Oil / Liquids 78.1% Daily Production (1) 3,000+ Boe/d Gross Acres (2) 52,053 acres Net Acres (2) 28,906 acres Eagle Ford (2)(3) 28,906 acres Austin Chalk (2)(3) 14,849 acres Identified Drilling Locations (2) 173.1 net 2012E Anticipated Drilling 27.6 net wells 2012E CapEx Budget $268.5 million % HBP or no short term expirations (4) 80% (1) Average daily production from March 1 to March 15, 2012 (2) As of September 30, 2011 (3) Some of the same leases cover the net acres shown for Eagle Ford & Austin Chalk. Therefore, the sum for both formations is not equal to the total net acreage (4) 80% of Eagle Ford acreage HBP or not burdened with lease expirations before 2013 (5) Calculated as percent of anticipated CapEx focused on oil weighted Eagle Ford and Austin Chalk drilling and acreage and includes $20 million to acquire oil prospective acreage in New Mexico and West Texas |
![]() 10 Eagle Ford East (Dewitt, Gonzales, Wilson and Karnes Counties) Acreage Position (1) 6,270 gross / 4,874 net Producing Wells Lewton #1H Wells drilled in Q1 2012 Sickenius #1H Danysh #1H Danysh #2H Pawelek #1H (drilling) Running one rig throughout 2012 San Antonio (1) Acreage as of September 30, 2011 |
![]() ![]() ![]() 11 Eagle Ford West (Dimmit, La Salle and Zavala Counties) Acreage Position (1) 13,472 gross / 10,510 net Wells Drilled Martin Ranch #1H, #2H, #3H, #4H, #5H, #6H, #7H, #8H Affleck #1H JCM Jr Minerals #1H Northcut #1H Northcut #2H (drilling) Running one rig throughout 2012 San Antonio (1) Acreage as of September 30, 2011 |
![]() ![]() ![]() 12 Martin Ranch Overview Approximate Current Production Martin Ranch #1H – 235 Bbls/d and 0.8 MMcf/d 12-month production of 138,000 barrels Martin Ranch #2H – 545 Bbls/d and 1.35 MMcf/d Martin Ranch #3H – 650 Bbls/d and 0.3 MMcf/d Martin Ranch #5H – 715 Bbls/d and 0.15 MMcf/d Wells Drilled, Completed and Producing Martin Ranch #4H Martin Ranch #6H Martin Ranch #7H Martin Ranch #8H 5 additional wells scheduled for 2012 San Antonio 2,485 gross / 2,483 net acres |
![]() 13 Emerging Multi-Pay Area in Eagle Ford Oil Fairway and MTDR Acreage |
![]() 14 Multi-Pay Fairway: Productive and Prospective Pay Zones Austin Chalk Eagle Ford Buda Georgetown Del Rio Edwards Glen Rose Rodessa Pearsall Sligo Olmos Navarro ANCC |
![]() 15 South Texas Multi-Pay Petroleum Systems: Petroleum Charge focus towards Glasscock Ranch Note: Information for Pearsall Oil Field sourced from public information |
![]() 16 Northwest Louisiana / East Texas Properties Overview Proved Reserves @ 12/31/11 164.6 Bcfe % Proved Developed 32.7% % Natural Gas 99.8% Daily Production (1) 38.8 MMcfe/d Gross Acres (2) 29,128 acres Net Acres (2) 25,477 acres Haynesville (2) (3) 14,705 acres Cotton Valley (2) (3) 23,236 acres Identified Drilling Locations (2) 139.9 net wells 2012E Anticipated Drilling 1.5 net wells 2012E CapEx Budget $13.5 million % HBP Over 90% (1) Production data for the year ended December 31, 2011 (2) As of September 30, 2011 (3) Some of the same leases cover the net acres shown for Haynesville & Cotton Valley. Therefore, the sum for both formations is not equal to the total net acreage Participated in over 110 operated and non-operated Haynesville wells at December 31, 2011 Haynesville proved reserves grew from zero at year end 2008 to 164.6 Bcfe at December 31, 2011 LA Wildlife H#1 and Williams 17 H#1 operated wells produced approximately 3.4 Bcfe (9.3 MMcfe/d) and 1.83 Bcfe (6.7 MMcfe/d) in their first 12 and 9 months, respectively Tigner Walker H#1 Alt (CV) LA Wildlife H#1 Alt. (HV) Williams 17 H#1 (HV) Tigner Walker H#1 Alt (CV) LA Wildlife H#1 Alt. (HV) Williams 17 H#1 (HV) Note: Matador operates two sections, including the LA Wildlife and the BLM sections, in Tier 1; all other acreage in Tier 1 is non-operated. |
![]() Highlights 17 Haynesville Positioning Approximately 12,000 gross and 5,500 net acres in Haynesville Tier 1 core area Almost all Tier 1 core acreage is HBP, as is over 90% of all prospective Haynesville acreage – provides “natural gas bank” for future development MTDR active as both operator and non-operator in Haynesville play Approximately 1,700 net acres with Bossier potential Haynesville acreage also prospective for shallower targets – Cotton Valley, Hosston – in many areas Approximately 10,000 net HBP acres prospective for Cotton Valley Horizontal play at Elm Grove / Caspiana Tigner Walker H#1 Alt (CV) LA Wildlife H#1 Alt. (HV) Williams 17 H#1 (HV) Tigner Walker H#1 Alt (CV) LA Wildlife H#1 Alt. (HV) Williams 17 H#1 (HV) Note: Matador operates two sections, including the LA Wildlife and the BLM sections, in Tier 1; all other acreage in Tier 1 is non-operated. |
![]() Liquids Focused CapEx in 2012E Commentary Oil Production Growth Over Time (Bbls/d) 18 Approximately 90% of 2012E capital budget focused on Eagle Ford (84%) and Austin Chalk (6%) Oil production up about five-fold year-over-year at December 31, 2011 Oil production expected to increase nearly 10x in 2012 All 2012 Eagle Ford and Austin Chalk drilling locations targeting oil and liquids Only 14% of our identified Eagle Ford and 5% of our identified Haynesville locations being drilled in 2012 From March 1, 2012 through March 15, 2012, oil production in excess of 3,000 bbl per day Strong Growth Profile Focused on Liquids (1) From March 1, 2012 through March 15, 2012, oil production in excess of 3,000 bbl per day |
![]() Diversified Investor Composition 19 Given management’s significant equity position, interests are well aligned with public shareholders Unique and diverse investor base includes institutional and industry shareholders with significant experience investing in the oil and gas sector Most initial capital was provided by investor base of predecessor company, Matador Petroleum Corporation 99.2% of shares outside the public float locked-up for 180 days following February 1, 2012 |
![]() Business Strategy to Deliver Growth and Value 20 Exploration and Development Dedicating approximately 94% (1) of 2012E CapEx to oil and liquids opportunities Approximately 80% of Eagle Ford and approximately 90% of Haynesville acreage either HBP or not burdened by near-term lease expirations Balanced Portfolio Growing Eagle Ford contributes to a diversified portfolio mix between oil and natural gas Active, ongoing exploration effort continues to identify new oil prospects and opportunities Pursue Opportunistic Acquisitions Ability to identify high return, operated opportunities at attractive prices History of significant acquisitions and joint ventures Maintain Financial Discipline Keep balance sheet strong and control expenses Work with industry participants to control costs for non-operated properties Leverage Industry Relationships Leverage expertise of our industry partners, exchange data and information and build upon existing relationships Continue active participation in industry consortia and professional societies Build Upon Director and Management Team Experience and Success in Unconventional Plays (1) Calculated as percent of anticipated capital expenditure focused on oil weighted Eagle Ford and Austin Chalk and includes $20 million to acquire acreage for oil opportunities in New Mexico and West Texas |
![]() 21 Matador Today Gross Acres (1) 144,368 acres Net Acres (1) 135,862 acres 2012E CapEx Budget $2.5 million Matador Today Gross Acres (1) 10,714 acres Net Acres (1) 7,519 acres Wyoming, Utah and Idaho (Meade Peak Shale) Option Value in Large Unevaluated Acreage Positions Initial test well drilled to 8,200 feet and cored through the Meade Peak shale Detailed petrophysical and rock properties testing in progress Carried participation interest provided by an affiliate of Alliance Bernstein Foothold of existing production and reserves Budgeted $20 million in 2012 to acquire acreage in oil- focused opportunities Southeast New Mexico / West Texas (1) As of September 30, 2011 |
![]() 22 Financial Performance Oil and Natural Gas Revenues ($ in mm) Total Realized Revenues (2) ($ in mm) Adjusted EBITDA (1) ($ in mm) Average Daily Production (MMcfe/d) Note: CAGR stands for compounded annual growth rate (1) Adjusted EBITDA is a non-GAAP financial measure. For a definition of Adjusted EBITDA and a reconciliation of Adjusted EBITDA to our net income (loss) and net cash provided by operating activities, see slide 28 (2) Includes realized gain on derivatives |
![]() 23 Selected Historical Financials (Revenues and Adjusted EBITDA in millions) (2) Adjusted EBITDA is a non-GAAP financial measure. For a definition of Adjusted EBITDA and a reconciliation of Adjusted EBITDA to our net income (loss) and net cash provided by operating activities, see slide 28 (1) 2011 numbers unaudited Year Ended December 31, 2009 2010 2011 Production Summary Oil Production (MBbls) 30.0 33.0 154.0 Gas Production (Bcf) 4.8 8.4 14.5 Total Annual Production (Bcfe) 5.0 8.6 15.4 Realized Prices (Including hedges) Oil ($/ Bbl) $57.72 $76.39 $93.80 Natural Gas ($/ Mcf) $5.17 $4.38 $4.11 Revenues (1) Oil and Gas Production Revenues $19.0 $34.0 $67.0 Realized Oil & Gas Hedging Gain / (Loss) 7.6 5.3 7.1 Unrealized Oil & Gas Hedging Gain / (Loss) (2.4) 3.1 5.1 Total Revenues $24.3 $42.5 $79.2 Operating Expenses ($/ Mcfe) Lease Operating $0.94 $0.61 $0.47 Production Taxes and Marketing 0.22 0.23 0.41 General and Administrative 1.42 1.13 0.87 Total Expenses $2.58 $1.97 $1.75 Adjusted EBITDA (2) $15.2 $23.6 $49.9 |
![]() 24 Hedging Profile Oil Hedges 2012 2013 Total Volume Hedged by Ceiling (Bbl) 1,180,000 1,260,000 Weighted Average Price ($ / Bbl) $109.84 $110.26 Total Volume Hedged by Floor (Bbl) 1,180,000 1,260,000 Weighted Average Price ($ / Bbl) $90.51 $87.14 Natural Gas Hedges 2012 2013 Total Volume Hedged by Ceiling (Bcf) 7.20 1.05 Weighted Average Price ($ / MMBtu) $5.78 $5.75 Total Volume Hedged by Floor (Bcf) 7.20 1.05 Weighted Average Price ($ / MMBtu) $4.44 $4.50 |
![]() 25 Financial Flexibility Plan to fund 2012 capital budget with a portion of IPO net proceeds, anticipated cash flows from operations and available borrowings under credit facility Intend to seek redeterminations of borrowing base as a result of any increases in oil and natural gas proved reserves during the year - May, November and one additional redetermination available in 2012 Borrowing base of $125 million, based on February 2012 redetermination - 19% of current market capitalization (1) $15 million in debt outstanding as of March 19, 2012 (1) As of March 20, 2012 close |
![]() 26 Investment Highlights Strong Growth Profile with Increasing Focus on Oil / Liquids High Quality Asset Base in Attractive Areas Significant Multi-year Drilling Inventory Strong Financial Position and Long-Term Institutional, Industry and Individual Shareholders Proven Management and Technical Team and Active Board of Directors Low Cost Operations Active Exploration Effort Using Science and Technology |
![]() Appendix |
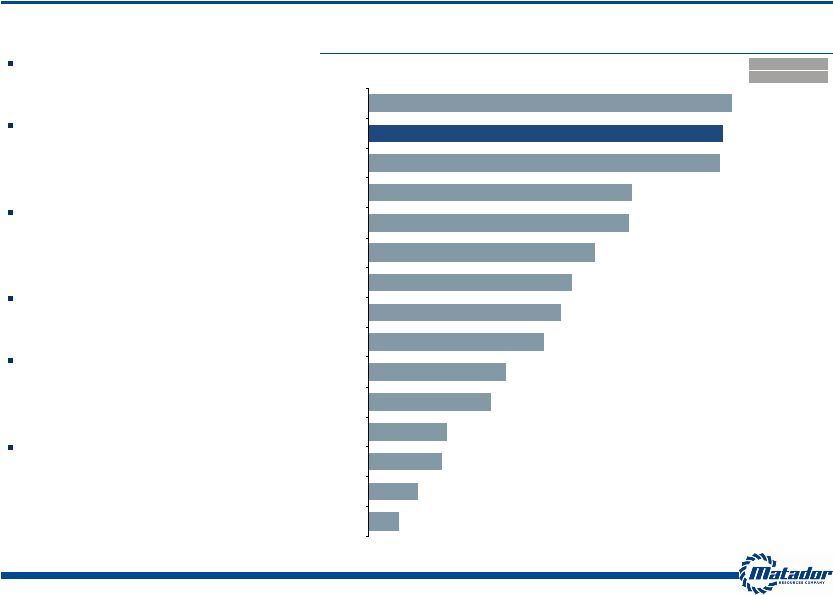
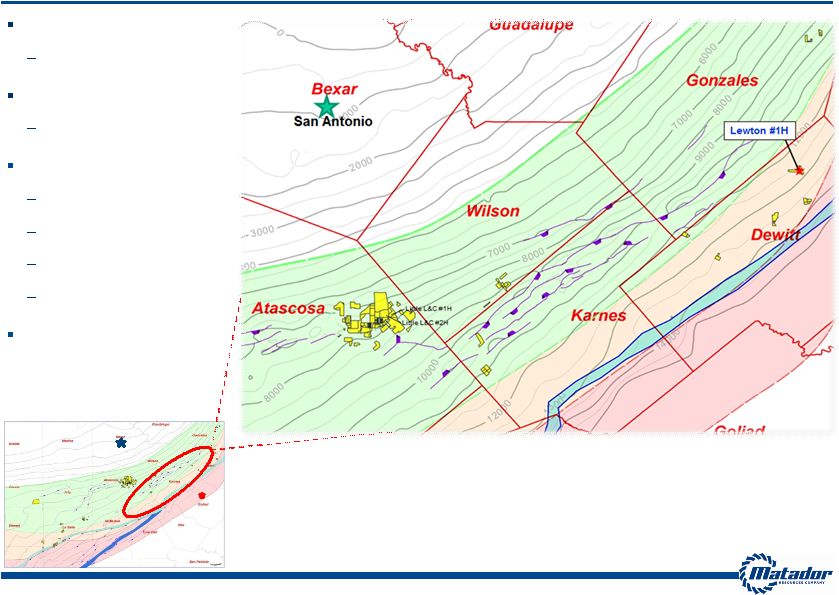
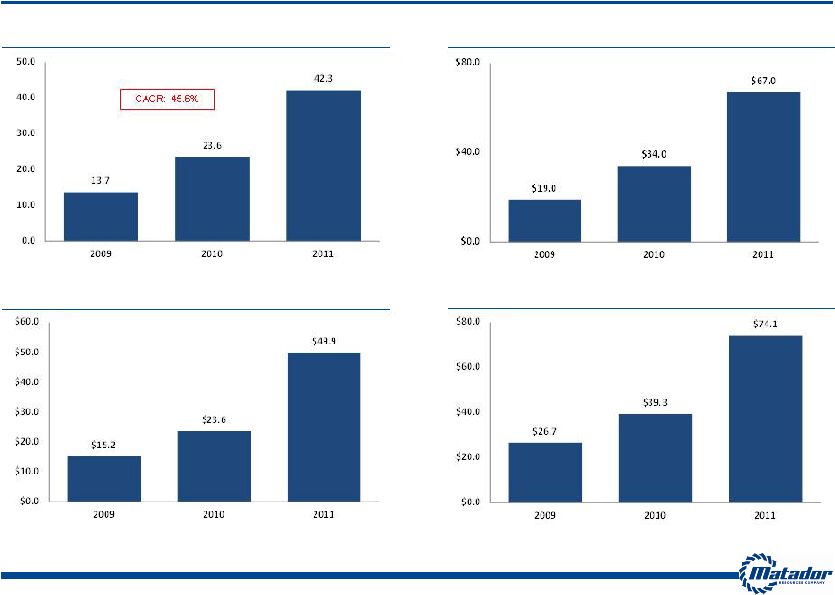
![]() 28 Adjusted EBITDA Reconciliation The following table presents our calculation of Adjusted EBITDA and reconciliation of Adjusted EBITDA to the GAAP financial measures of net income (loss) and net cash provided by operating activities, respectively. Year Ended December 31, (In thousands) 2008 2009 2010 2011 Unaudited Adjusted EBITDA reconciliation to Net Income (Loss): Net income (loss) $103,878 ($14,425) $6,377 ($10,309) Interest expense - - 3 683 Total income tax provision (benefit) 20,023 (9,925) 3,521 (5,521) Depletion, depreciation and amortization 12,127 10,743 15,596 31,754 Accretion of asset retirement obligations 92 137 155 209 Full-cost ceiling impairment 22,195 25,244 - 35,673 Unrealized (gain) loss on derivatives (3,592) 2,375 (3,139) (5,138) Stock option and grant expense 605 622 824 2,362 Restricted stock grants 60 34 74 44 Net (gain)/loss on asset sales and inventory impairment (136,977) 379 224 154 Adjusted EBITDA $18,411 $15,184 $23,635 $49,911 Year Ended December 31, (In thousands) 2008 2009 2010 2011 Unaudited Adjusted EBITDA reconciliation to Net Cash Provided by Operating Activities: Net cash provided by operating activities $25,851 $1,791 $27,273 $61,868 Net change in operating assets and liabilities (17,888) 15,717 (2,230) (12,594) Interest expense - - 3 683 Current income tax provision (benefit) 10,448 (2,324) (1,411) (46) Adjusted EBITDA $18,411 $15,184 $23,635 $49,911 We believe Adjusted EBITDA helps us evaluate our operating performance and compare our results of operation from period to period without regard to our financing methods or capital structure. We define Adjusted EBITDA as earnings before interest expense, income taxes, depletion, depreciation and amortization, property impairments, unrealized derivative gains and losses, non-recurring income and expenses and non-cash stock-based compensation expense, including stock option and grant expense and restricted stock grants. Adjusted EBITDA is not a measure of net income (loss) or cash flows as determined by GAAP. Adjusted EBITDA should not be considered an alternative to, or more meaningful than, net income or cash flows from operating activities as determined in accordance with GAAP or as an indicator of our operating performance or liquidity. |
![]() Board of Directors and Special Board Advisors 29 Board Members and Advisors Professional Experience Business Expertise Charles L. Gummer Director - Former Chairman, President and CEO, Comerica Bank –Texas Banking Dr. Stephen A. Holditch Director - Professor and Former Head of the Department of Petroleum Engineering, Texas A&M University - Founder / President S.A. Holditch & Associates - Past President of Society of Petroleum Engineers Oil & Gas Operations David M. Laney Director - Past Chairman, Amtrak Board of Directors - Former Partner, Jackson Walker LLP Law Gregory E. Mitchell Director - President / CEO, Toot’n Totum Food Stores Petroleum Retailing Dr. Steven W. Ohnimus Director - Retired VP and General Manager, Unocal Indonesia Oil & Gas Operations Michael C. Ryan Director - Partner, Berens Capital Management International Business and Finance Margaret B. Shannon Director - Retired VP and General Counsel, BJ Services Co. - Former Partner, Andrews Kurth LLP Law and Corporate Governance Marlan W. Downey Special Board Advisor - Retired President, ARCO International - Former President, Shell Pecten International - Past President of American Association of Petroleum Geologists Oil & Gas Exploration Edward R. Scott, Jr. Special Board Advisor - Former Chairman, Amarillo Economic Development Corporation - Law Firm of Gibson, Ochsner & Adkins Law, Accounting and Real Estate Development W.J. “Jack” Sleeper Special Board Advisor - Retired President, DeGolyer and MacNaughton (Worldwide Petroleum Consultants) Oil & Gas Executive Management |
![]() Experienced Leadership 30 Management Team Background and Prior Affiliations Industry Experience Matador Experience Joseph Wm. Foran Founder, Chairman and CEO - Matador Petroleum Corporation, Foran Oil Company, J Cleo Thompson Jr. and Thompson Petroleum Corp. 31 years Since Inception David E. Lancaster EVP, COO and CFO - Schlumberger, S.A. Holditch & Associates, Inc., Diamond Shamrock 32 years Since 2003 Matthew V. Hairford EVP, Operations - Samson, Sonat, Conoco 27 years Since 2004 Wade I. Massad EVP, Capital Markets - Cleveland Capital Management, LLC, KeyBanc Capital Markets, RBC Capital Markets 22 years Since 2010 David F. Nicklin Executive Director, Exploration - ARCO, Senior Geological Assignments in UK, Angola, Norway and the Middle East 40 years Since 2007 Scott E. King Co-Founder, VP, Geophysics and New Ventures - Matador Petroleum Corporation, Enserch, BP, Sohio 28 years Since Inception Bradley M. Robinson VP, Reservoir Engineering - Schlumberger, S.A. Holditch & Associates, Inc., Marathon 34 years Since Inception Kathryn L. Wayne Controller and Treasurer - Matador Petroleum Corporation, Mobil 27 years Since Inception |